
Formation of Formaldehyde and Other Byproducts by TiO2 Photocatalyst Materials

 , ,
, ,  , , , and
Abstract
1. Introduction
2. Results And Discussion
2.1. Characterization
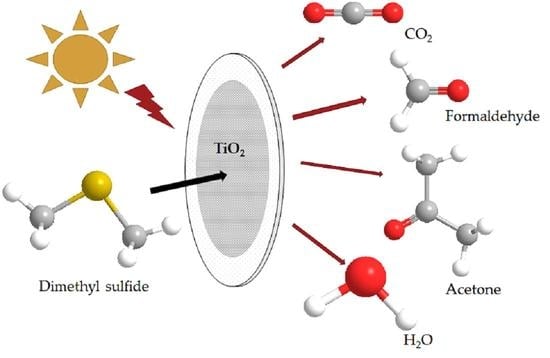
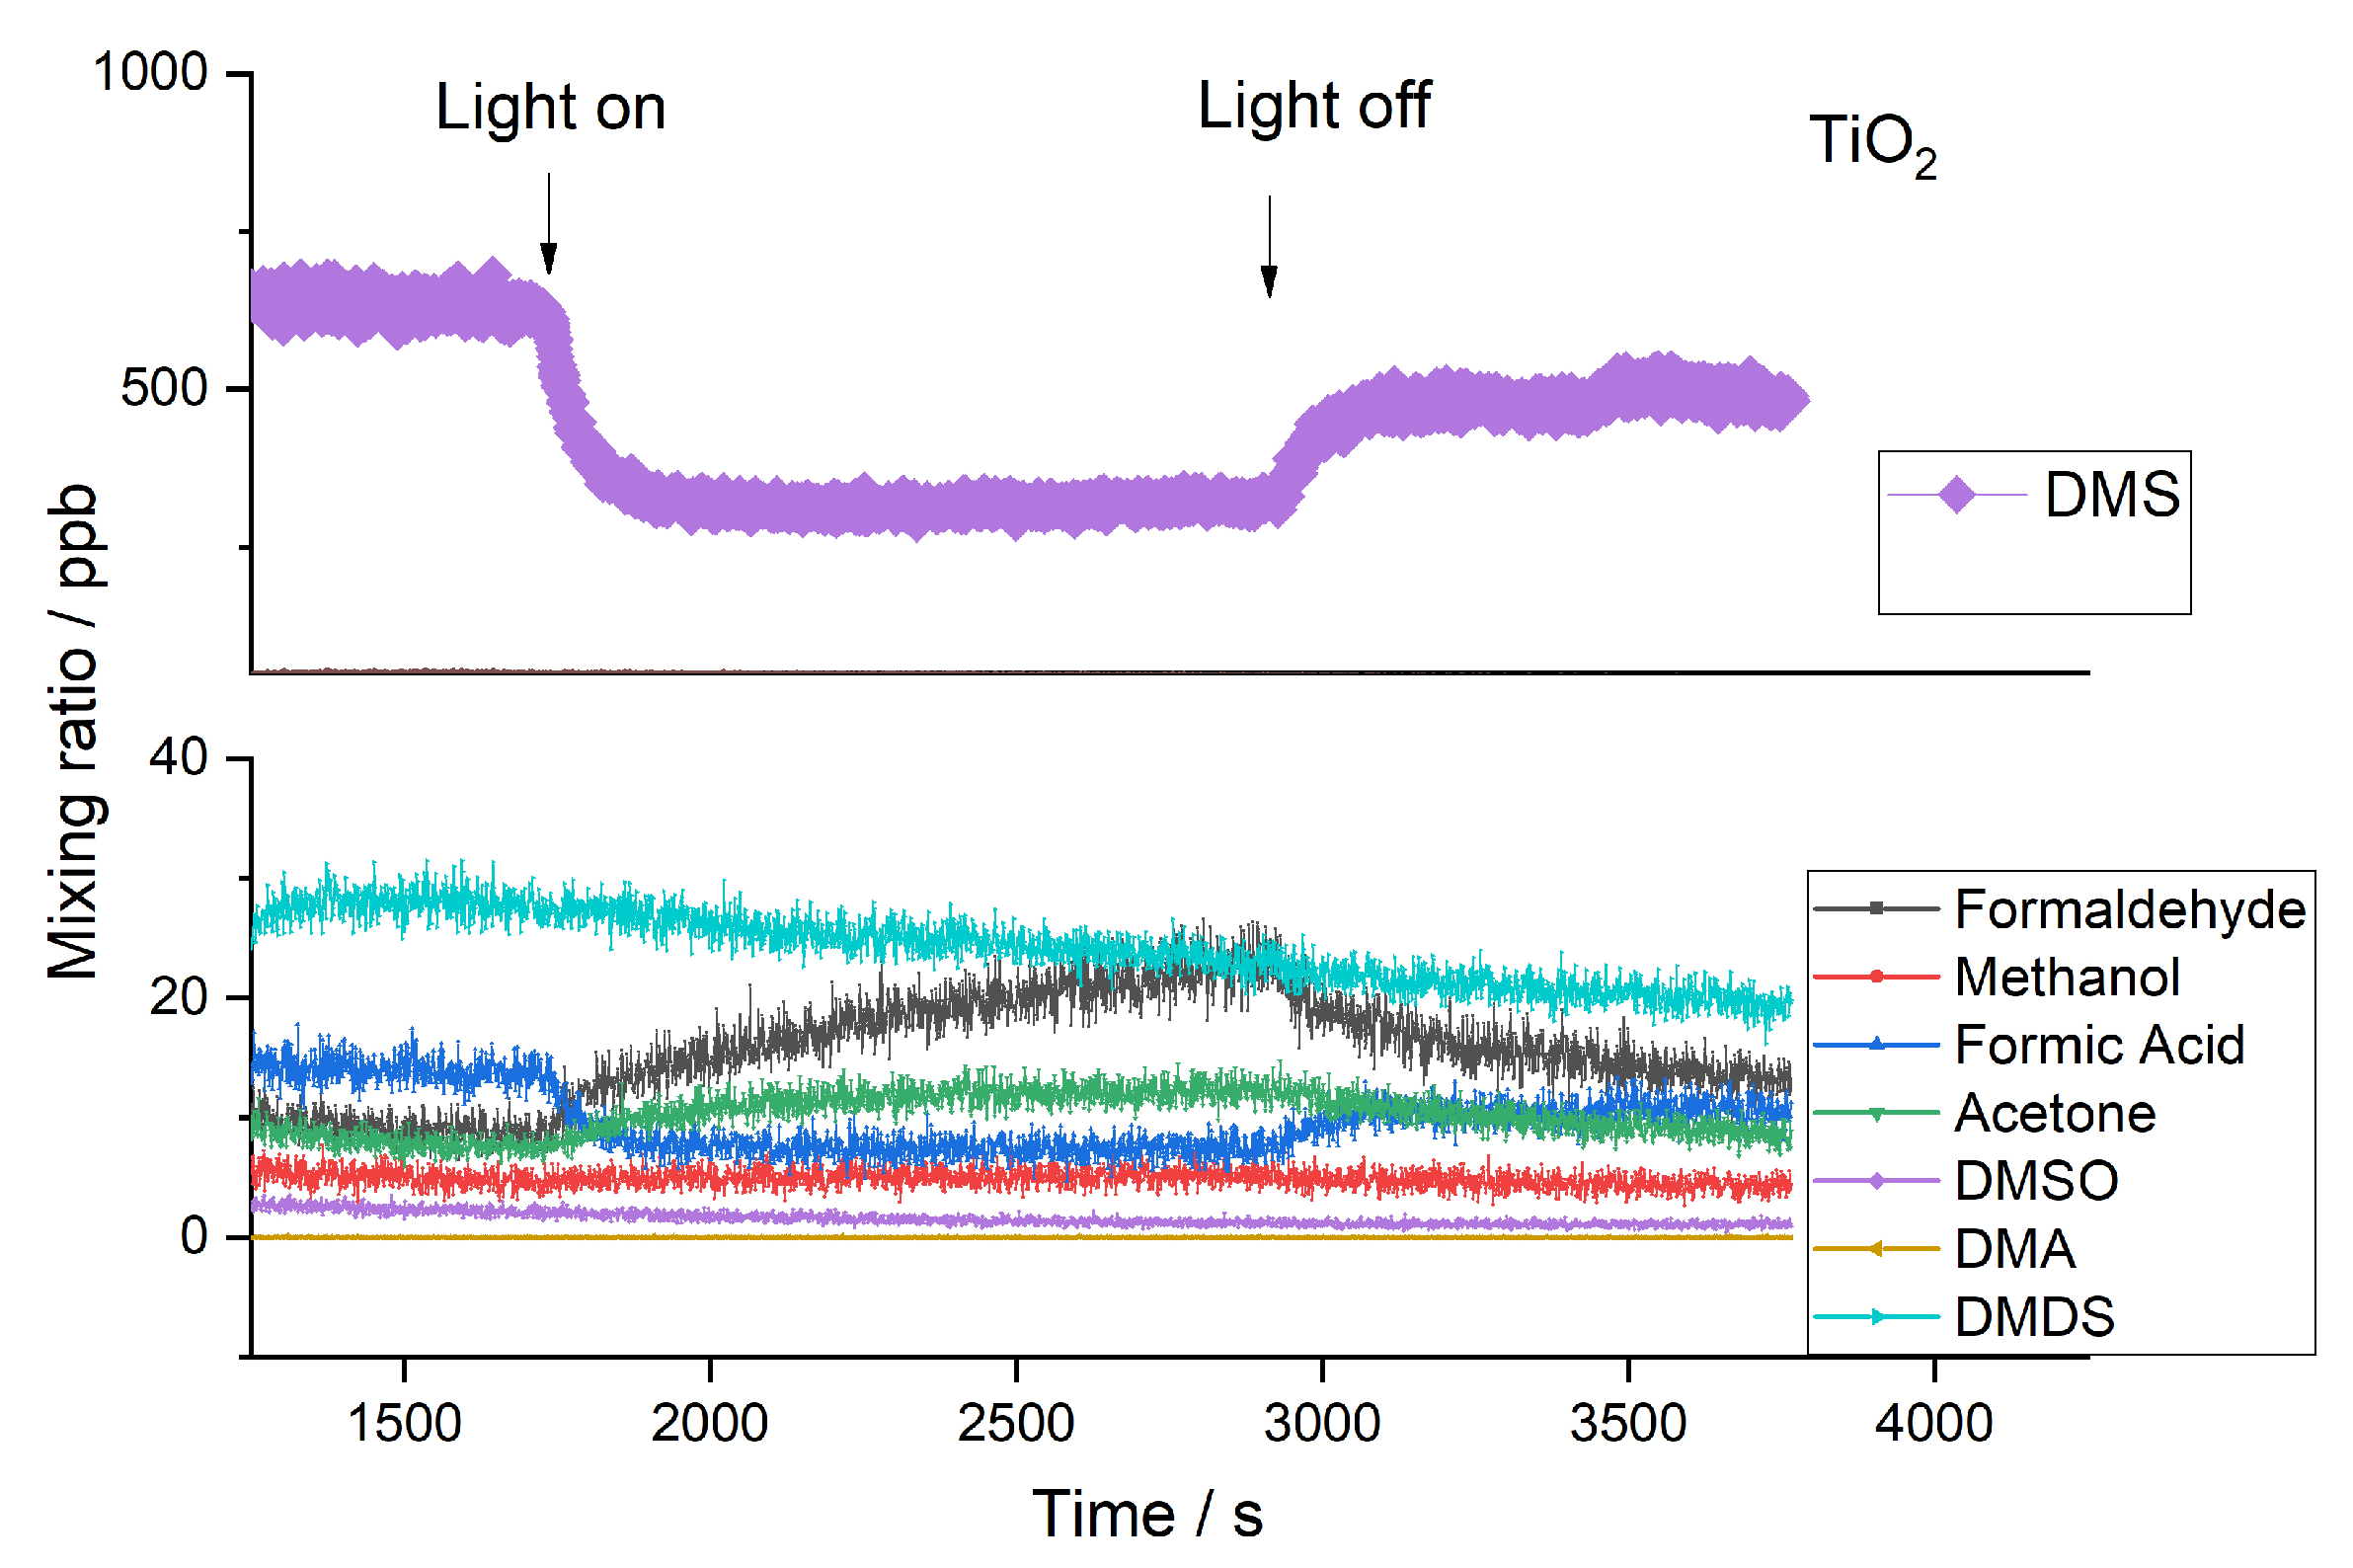
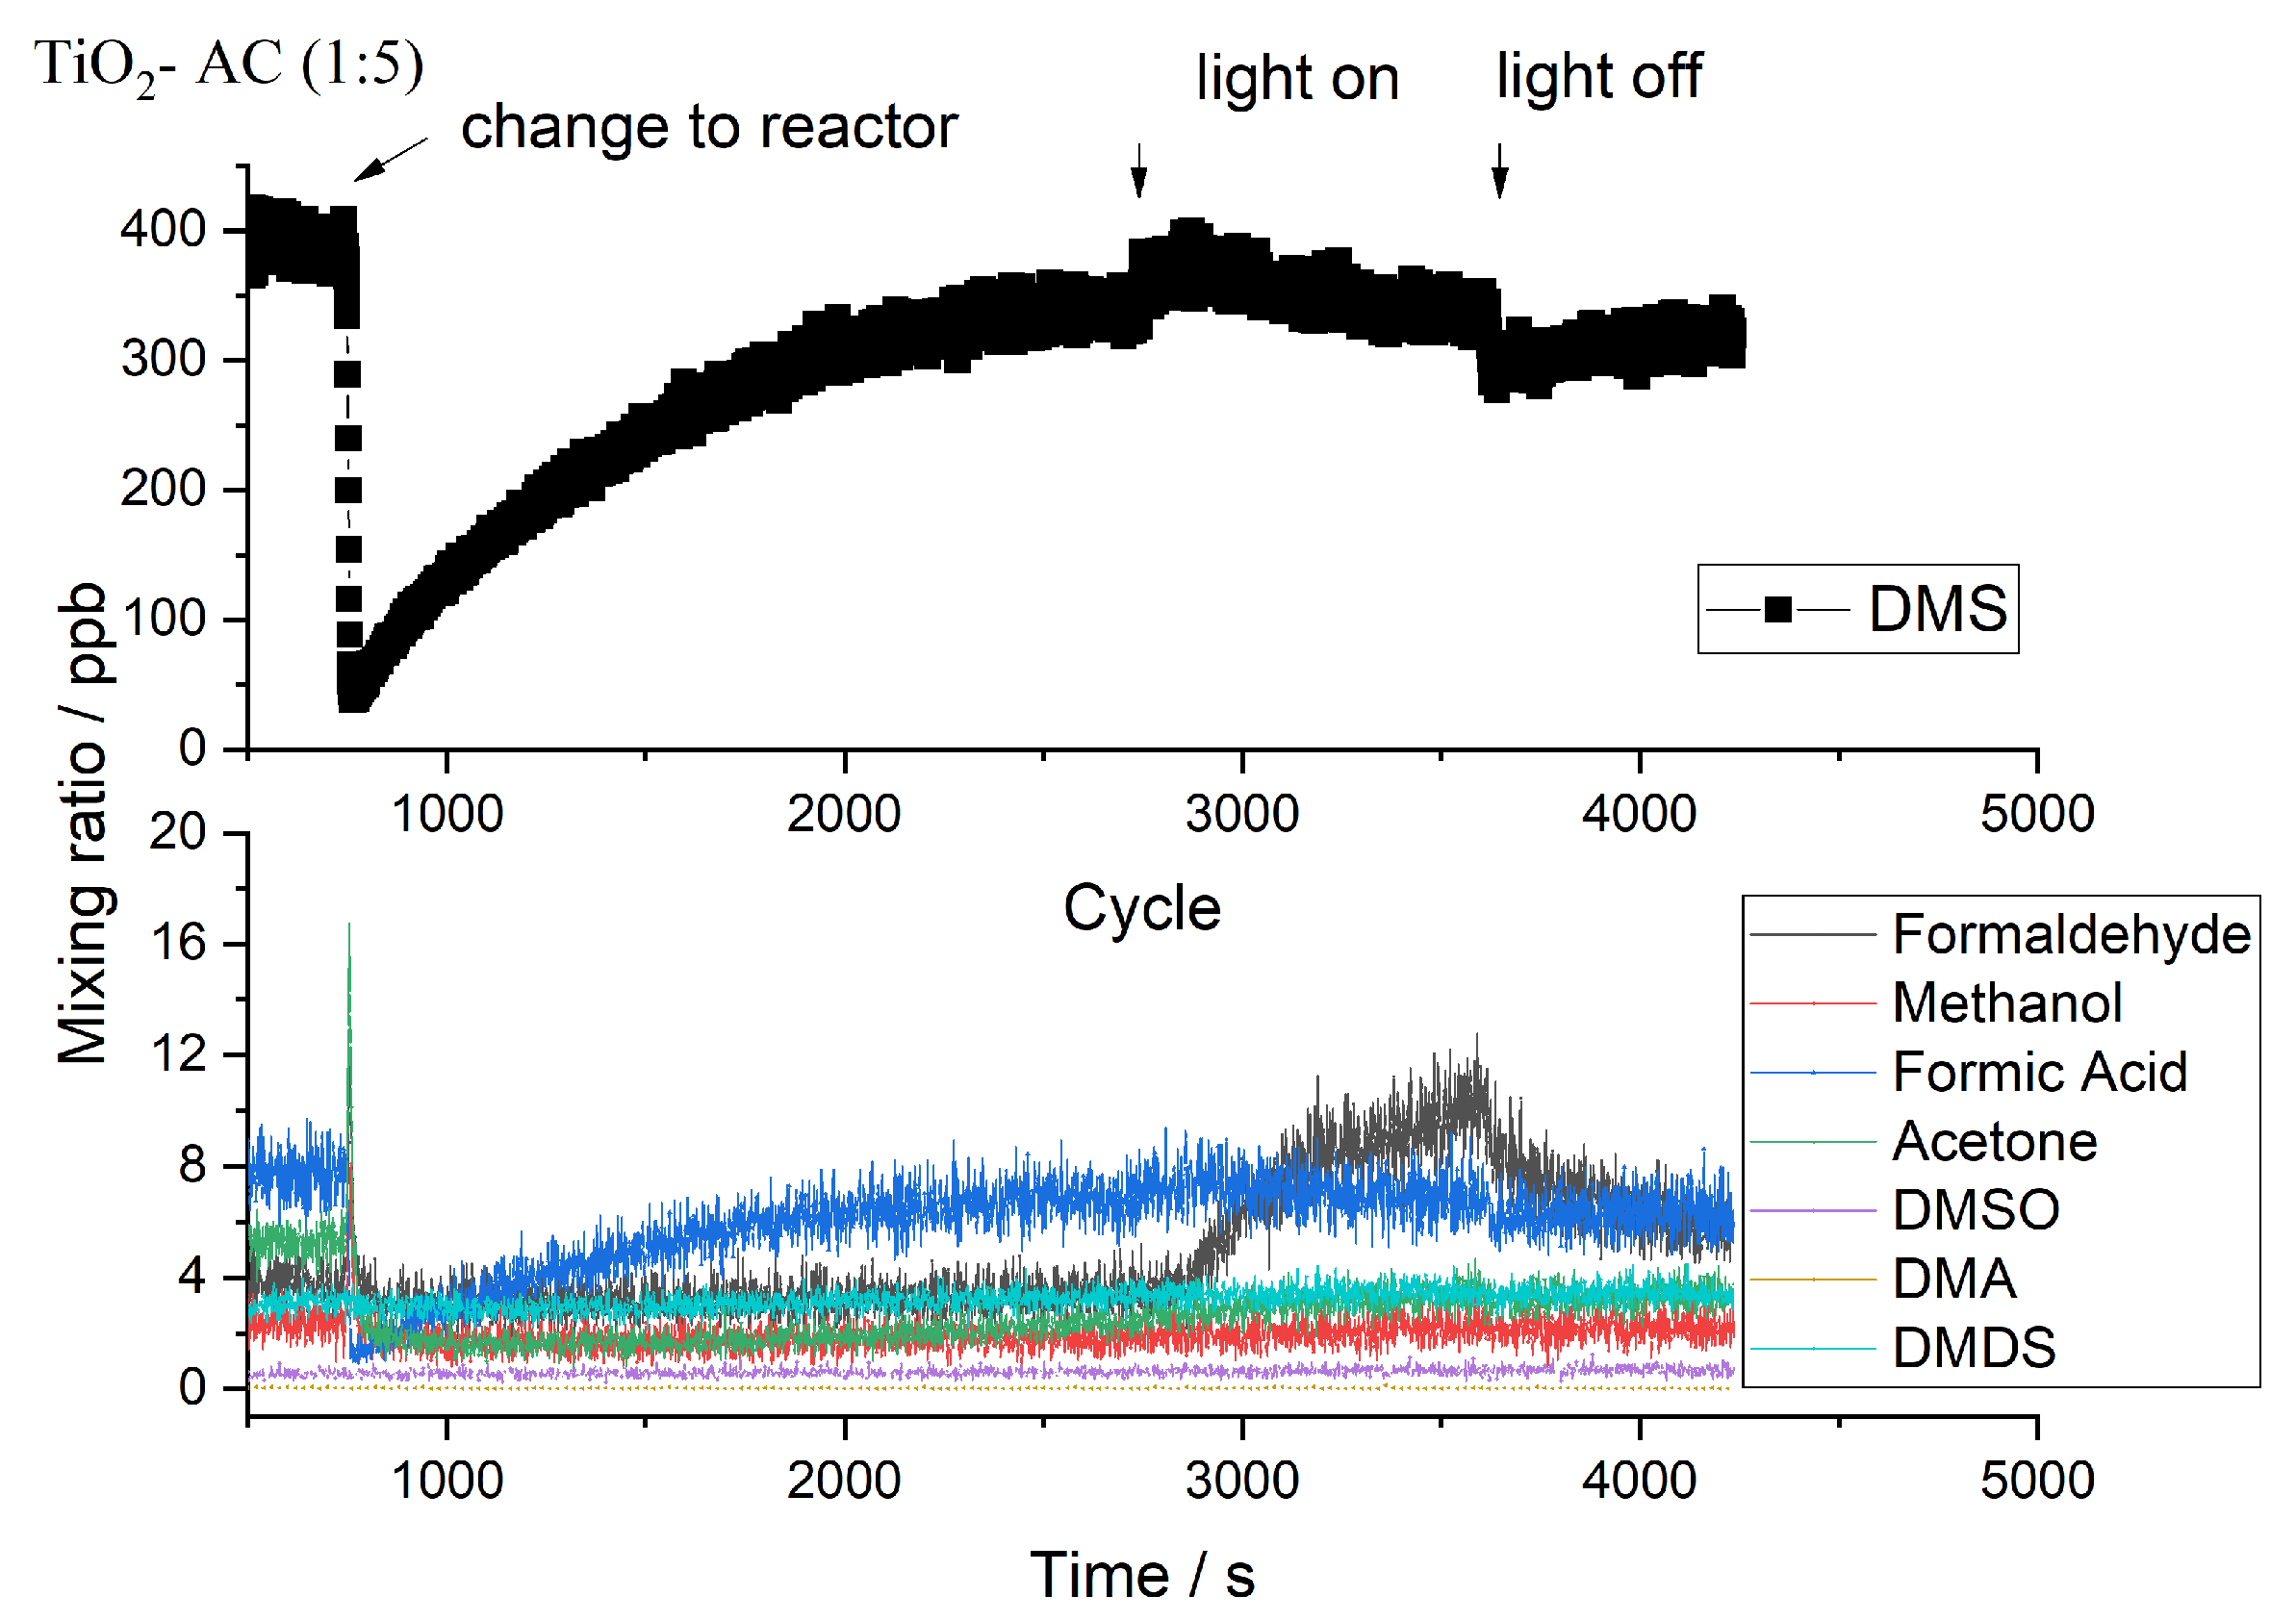
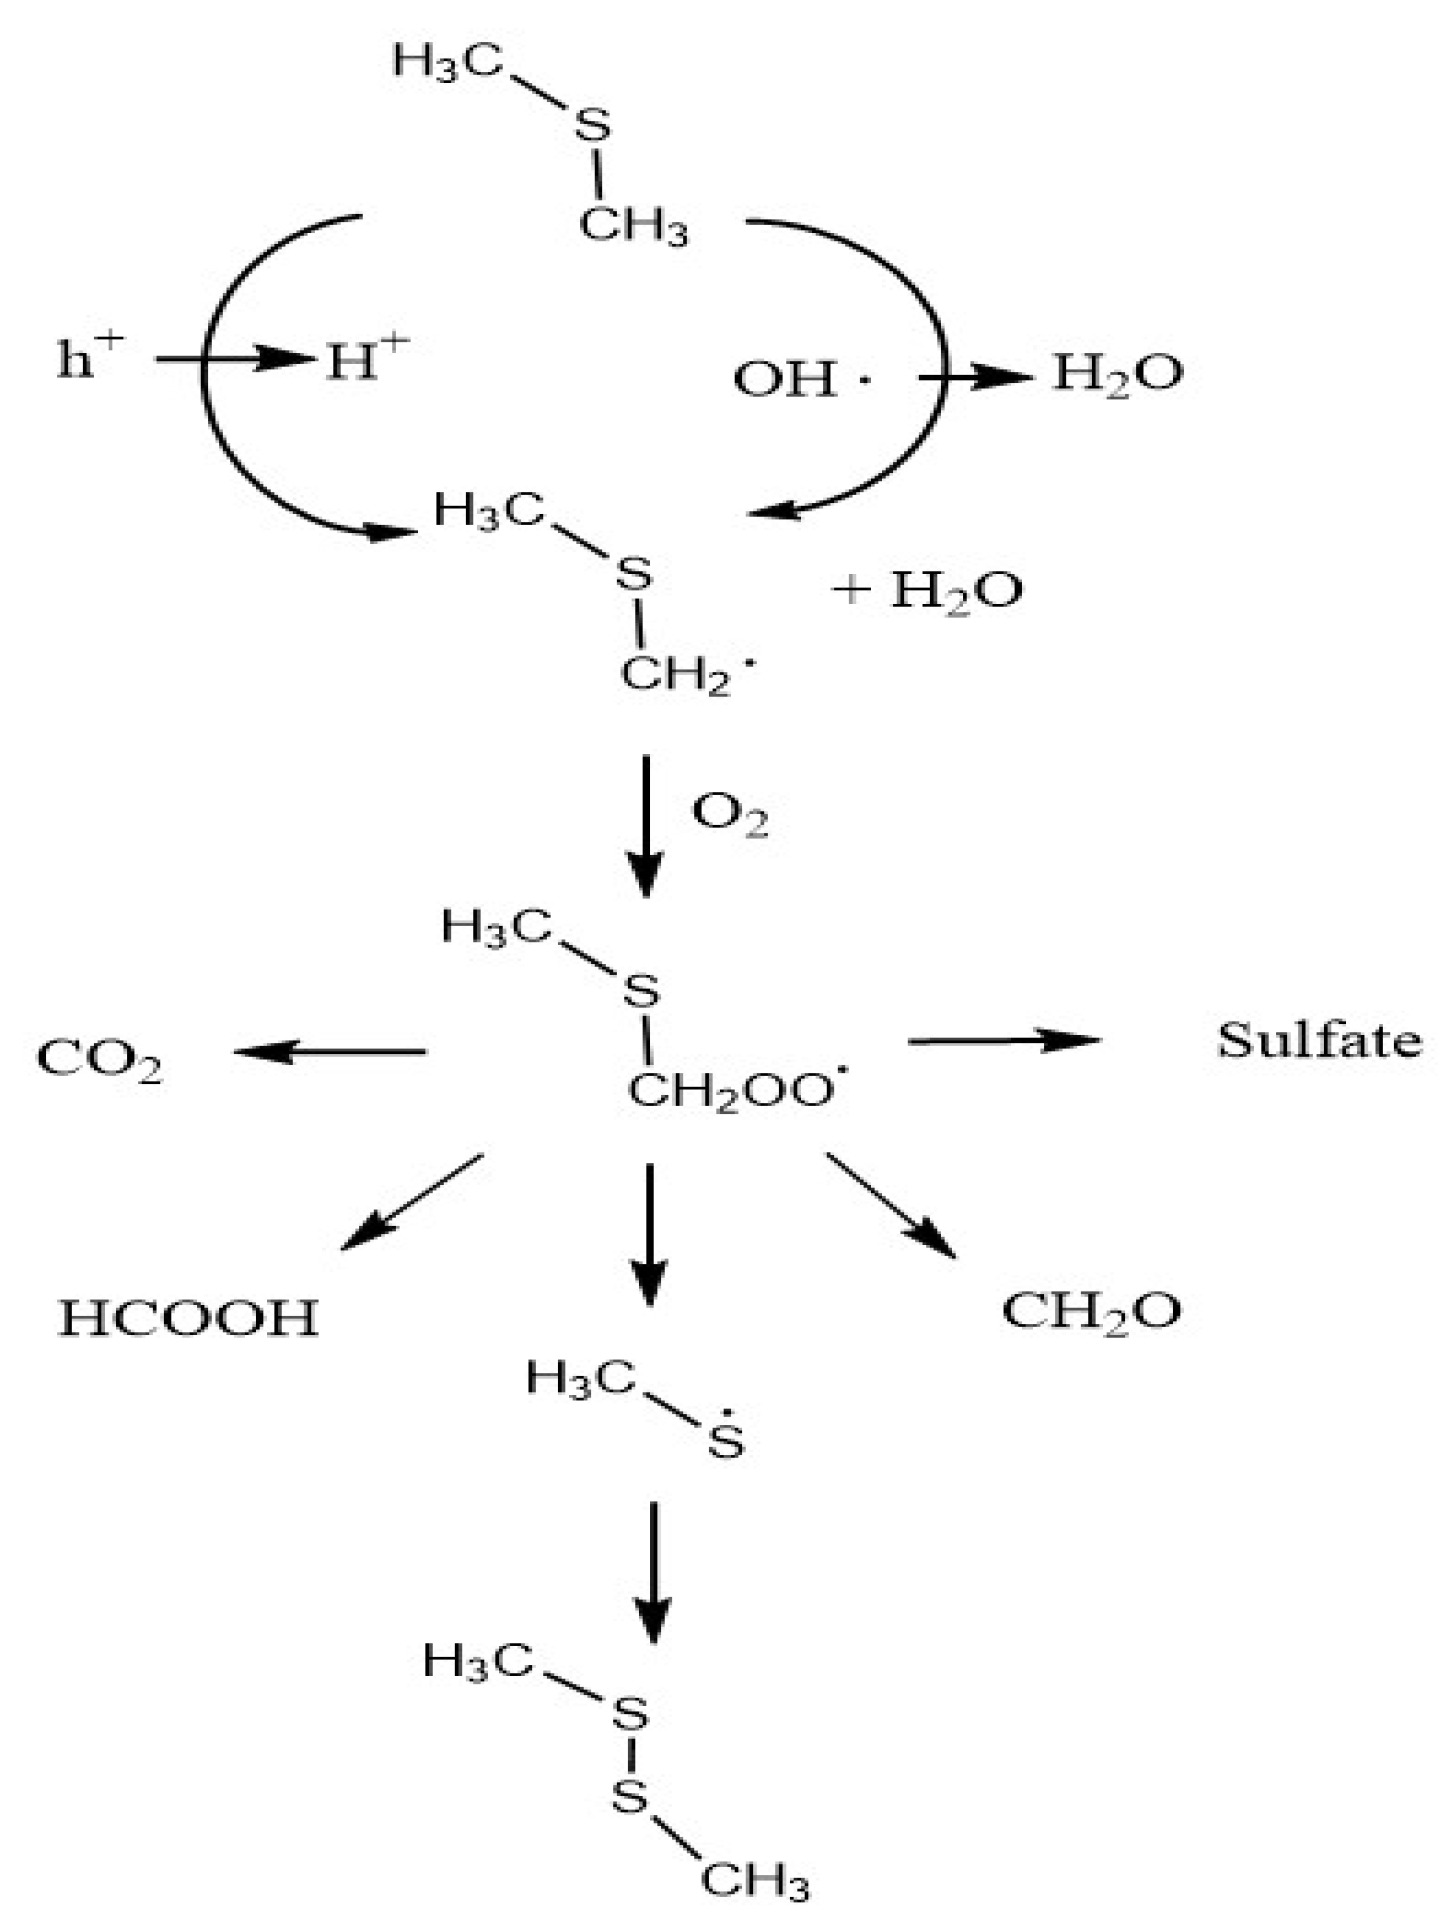
2.2. Byproducts
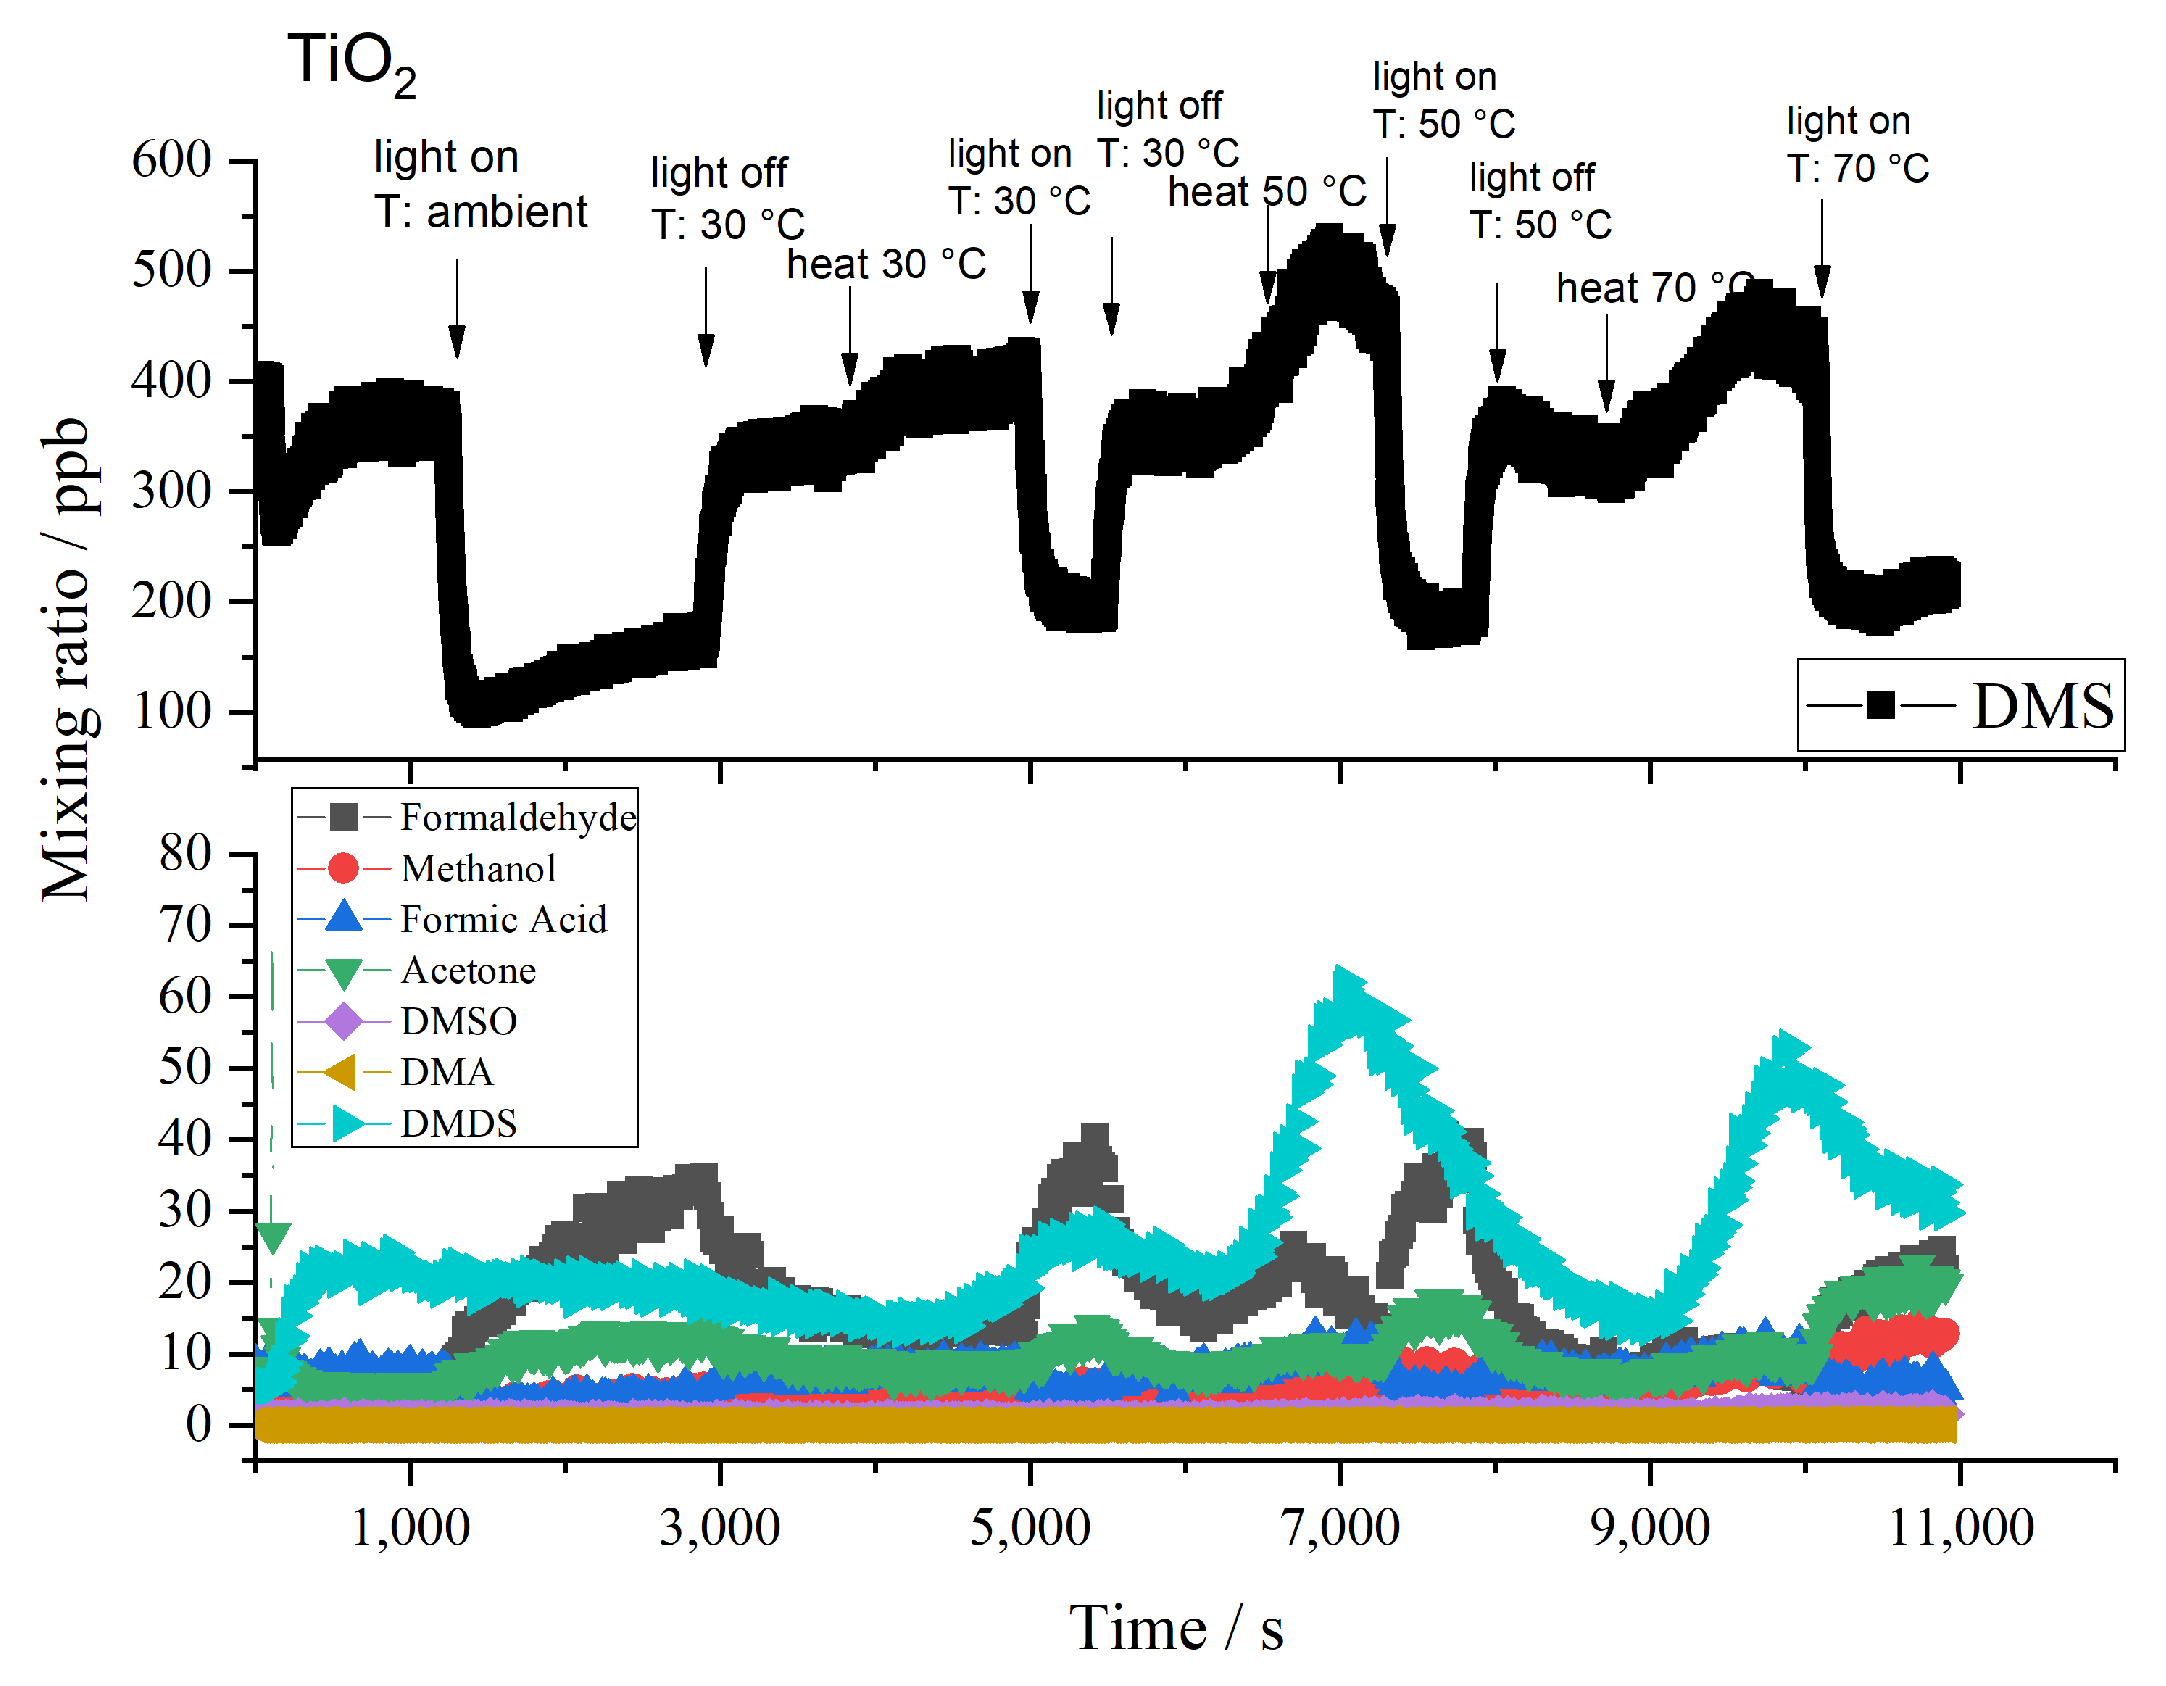
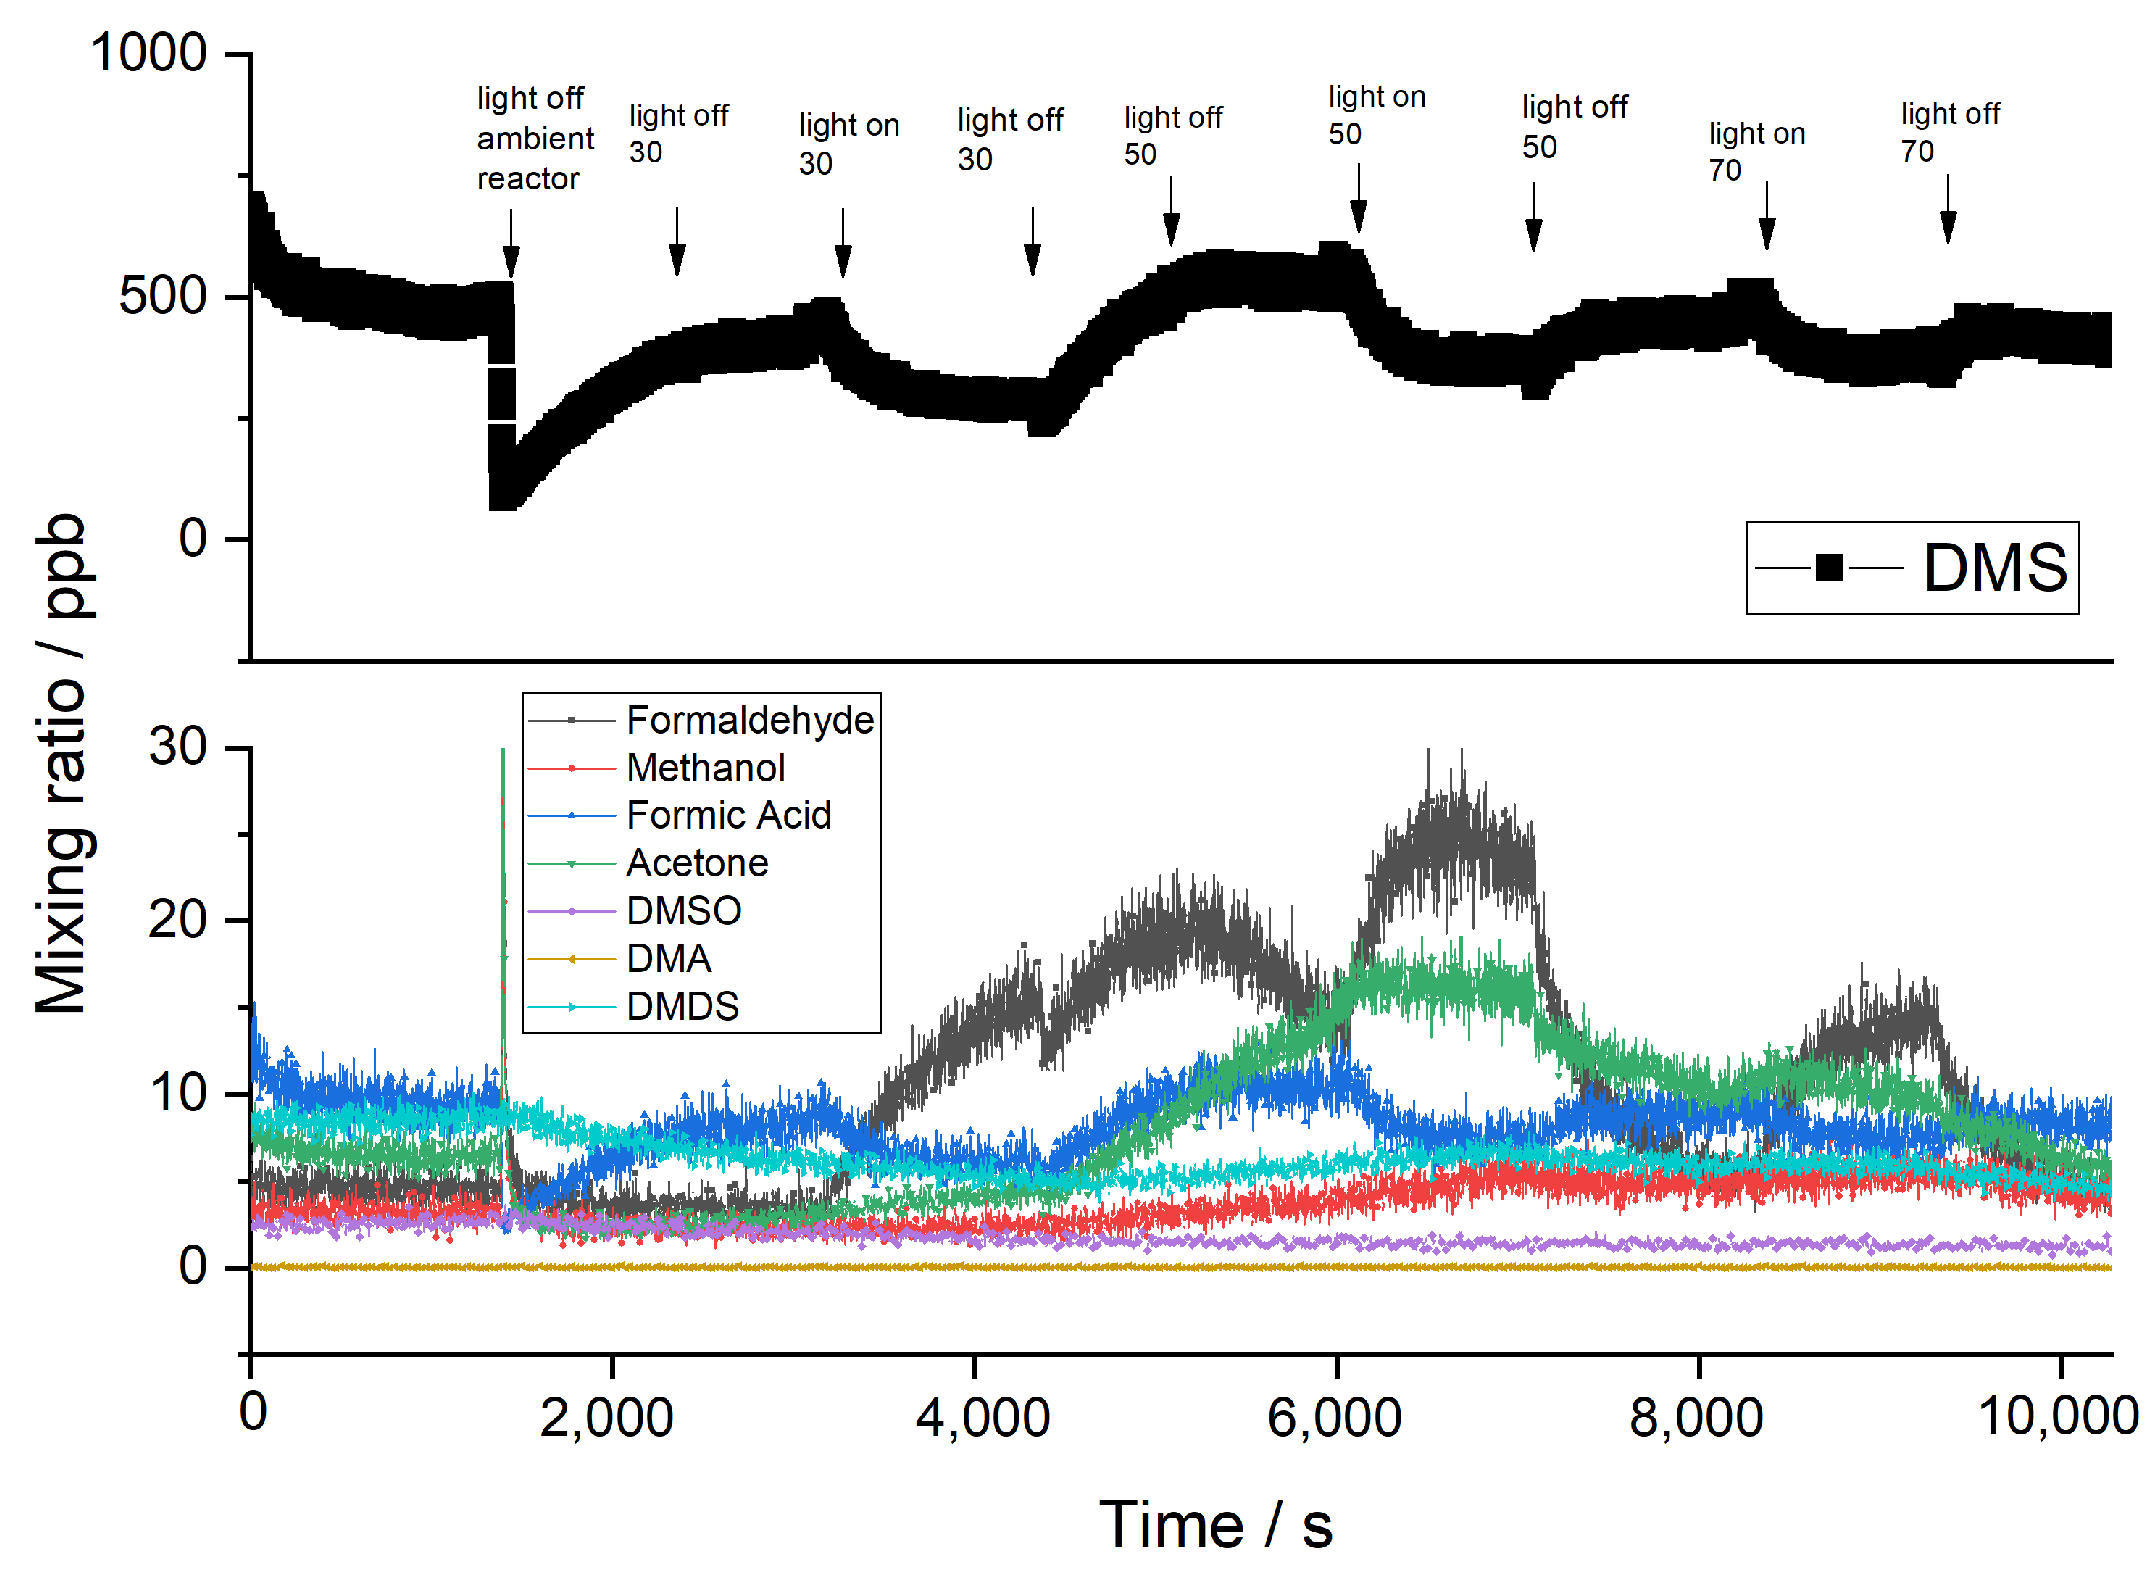
2.3. Influence of Temperature
3. Materials And Methods
3.1. Materials
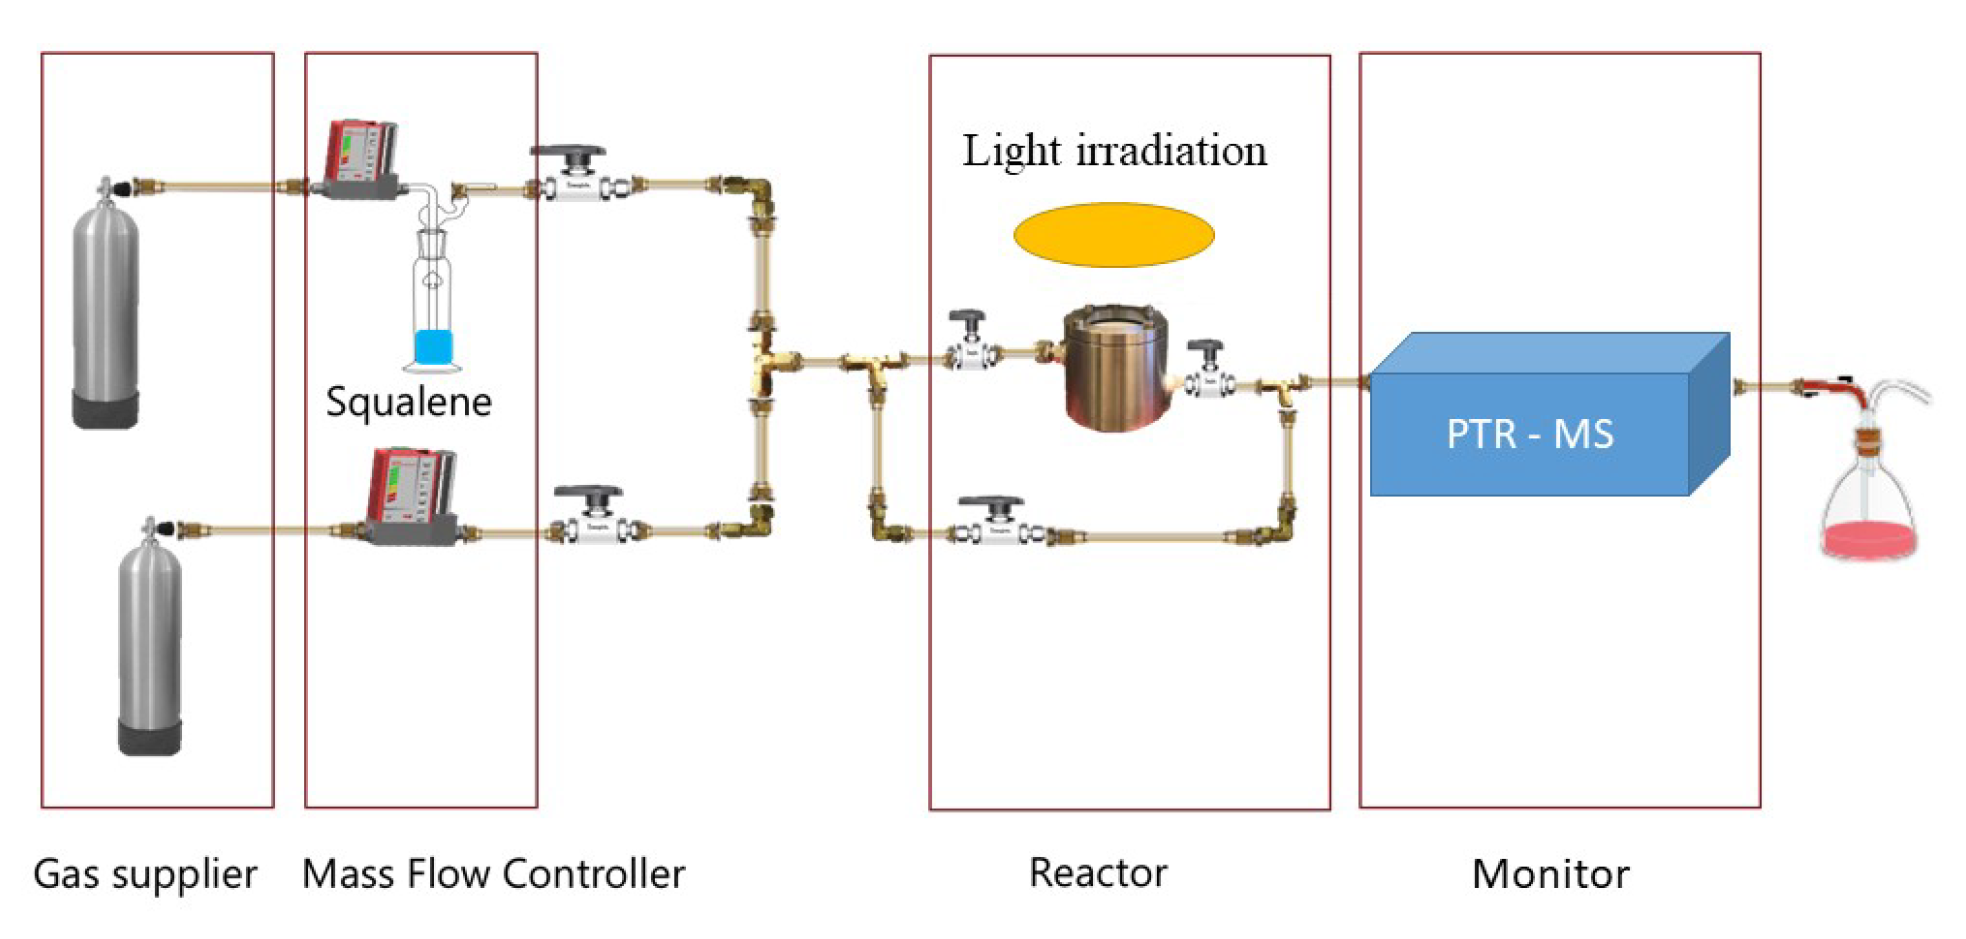
3.2. Methods
3.3. Characterization
3.4. Formaldehyde Calibration
4. Conclusions
Supplementary Materials
Author Contributions
Funding
Data Availability Statement
Acknowledgments
Conflicts of Interest
References
- Lelieveld, J.; Pozzer, A.; Pöschl, U.; Fnais, M.; Haines, A.; Münzel, T. Loss of life expectancy from air pollution compared to other risk factors: A worldwide perspective. Cardiovasc. Res. 2020, 116, 1910–1917. [Google Scholar] [CrossRef]
- Landrigan, P.J.; Fuller, R.; Acosta, N.J.; Adeyi, O.; Arnold, R.; Baldé, A.B.; Bertollini, R.; Bose-O’Reilly, S.; Boufford, J.I.; Breysse, P.N.; et al. The Lancet Commission on pollution and health. Lancet 2018, 391, 462–512. [Google Scholar] [CrossRef]
- Brunekreef, B.; Holgate, S.T. Air pollution and health. Lancet 2002, 360, 1233–1242. [Google Scholar] [CrossRef]
- Wyon, D.P. The effects of indoor air quality on performance and productivity. Indoor Air 2004, 14, 92–101. [Google Scholar] [CrossRef] [PubMed]
- Chen, S.; Oliva, P.; Zhang, P. Air Pollution and Mental Health: Evidence from China; Technical Report; National Bureau of Economic Research: Cambridge, MA, USA, 2018. [Google Scholar]
- Burkhardt, J.; Bayham, J.; Wilson, A.; Berman, J.D.; O’Dell, K.; Ford, B.; Fischer, E.V.; Pierce, J.R. The relationship between monthly air pollution and violent crime across the United States. J. Environ. Econ. Policy 2020, 9, 188–205. [Google Scholar] [CrossRef]
- Saini, J.; Dutta, M.; Marques, G. A comprehensive review on indoor air quality monitoring systems for enhanced public health. Sustain. Environ. Res. 2020, 30, 6. [Google Scholar] [CrossRef]
- Beeldens, A. An environmental friendly solution for air purification and self-cleaning effect: The application of TiO2 as photocatalyst in concrete. In Proceedings of the Transport Research Arena Europe—TRA, Göteborg, Sweden, 12–15 June 2006; pp. 12–16. [Google Scholar]
- Asahi, R.; Morikawa, T.; Ohwaki, T.; Aoki, K.; Taga, Y. Visible-light photocatalysis in nitrogen-doped titanium oxides. Science 2001, 293, 269–271. [Google Scholar] [CrossRef] [PubMed]
- Maggos, T.; Bartzis, J.; Liakou, M.; Gobin, C. Photocatalytic degradation of NOx gases using TiO2-containing paint: A real scale study. J. Hazard. Mater. 2007, 146, 668–673. [Google Scholar] [CrossRef] [PubMed]
- Maggos, T.; Plassais, A.; Bartzis, J.; Vasilakos, C.; Moussiopoulos, N.; Bonafous, L. Photocatalytic degradation of NOx in a pilot street canyon configuration using TiO2-mortar panels. Environ. Monit. Assess. 2008, 136, 35–44. [Google Scholar] [CrossRef]
- Yuan, Y.; Zhang, J.; Li, H.; Li, Y.; Zhao, Y.; Zheng, C. Simultaneous removal of SO2, NO and mercury using TiO2-aluminum silicate fiber by photocatalysis. Chem. Eng. J. 2012, 192, 21–28. [Google Scholar] [CrossRef]
- Liu, H.; Yu, X.; Yang, H. The integrated photocatalytic removal of SO2 and NO using Cu doped titanium dioxide supported by multi-walled carbon nanotubes. Chem. Eng. J. 2014, 243, 465–472. [Google Scholar] [CrossRef]
- Alberici, R.M.; Jardim, W.F. Photocatalytic destruction of VOCs in the gas-phase using titanium dioxide. Appl. Catal. B Environ. 1997, 14, 55–68. [Google Scholar] [CrossRef]
- Mo, J.; Zhang, Y.; Xu, Q.; Lamson, J.J.; Zhao, R. Photocatalytic purification of volatile organic compounds in indoor air: A literature review. Atmos. Environ. 2009, 43, 2229–2246. [Google Scholar] [CrossRef]
- Kim, S.B.; Hong, S.C. Kinetic study for photocatalytic degradation of volatile organic compounds in air using thin film TiO2 photocatalyst. Appl. Catal. B Environ. 2002, 35, 305–315. [Google Scholar] [CrossRef]
- Xu, T.; Zheng, H.; Zhang, P. Performance of an innovative VUV-PCO purifier with nanoporous TiO2 film for simultaneous elimination of VOCs and by-product ozone in indoor air. Build. Environ. 2018, 142, 379–387. [Google Scholar] [CrossRef]
- Ren, H.; Koshy, P.; Chen, W.F.; Qi, S.; Sorrell, C.C. Photocatalytic materials and technologies for air purification. J. Hazard. Mater. 2017, 325, 340–366. [Google Scholar] [CrossRef]
- Di Paola, A.; García-López, E.; Marcì, G.; Palmisano, L. A survey of photocatalytic materials for environmental remediation. J. Hazard. Mater. 2012, 211, 3–29. [Google Scholar] [CrossRef] [PubMed]
- Palanisamy, B.; Babu, C.; Sundaravel, B.; Anandan, S.; Murugesan, V. Sol–gel synthesis of mesoporous mixed Fe2O3/TiO2 photocatalyst: Application for degradation of 4-chlorophenol. J. Hazard. Mater. 2013, 252, 233–242. [Google Scholar] [CrossRef] [PubMed]
- Fujishima, A.; Honda, K. Electrochemical photolysis of water at a semiconductor electrode. Nature 1972, 238, 37–38. [Google Scholar] [CrossRef]
- Linsebigler, A.L.; Lu, G.; Yates, J.T., Jr. Photocatalysis on TiO2 surfaces: Principles, mechanisms, and selected results. Chem. Rev. 1995, 95, 735–758. [Google Scholar] [CrossRef]
- Xu, M.; Shao, S.; Gao, B.; Lv, J.; Li, Q.; Wang, Y.; Wang, H.; Zhang, L.; Ma, Y. Anatase (101)-like structural model revealed for metastable rutile TiO2 (011) surface. ACS Appl. Mater. Interfaces 2017, 9, 7891–7896. [Google Scholar] [CrossRef] [PubMed]
- Yu, J.; Yu, H.; Cheng, B.; Zhou, M.; Zhao, X. Enhanced photocatalytic activity of TiO2 powder (P25) by hydrothermal treatment. J. Mol. Catal. A Chem. 2006, 253, 112–118. [Google Scholar] [CrossRef]
- Zhang, X.; Zhou, M.; Lei, L. TiO2 photocatalyst deposition by MOCVD on activated carbon. Carbon 2006, 44, 325–333. [Google Scholar] [CrossRef]
- Sun, Q.; Lv, K.; Zhang, Z.; Li, M.; Li, B.; others. Effect of contact interface between TiO2 and g-C3N4 on the photoreactivity of g-C3N4/TiO2 photocatalyst: (0 0 1) vs. (1 0 1) facets of TiO2. Appl. Catal. B Environ. 2015, 164, 420–427. [Google Scholar]
- Ohno, T.; Tsubota, T.; Toyofuku, M.; Inaba, R. Photocatalytic activity of a TiO2 photocatalyst doped with C4+ and S 4+ ions having a rutile phase under visible light. Catal. Lett. 2004, 98, 255–258. [Google Scholar] [CrossRef]
- Zhang, J.; Zhou, P.; Liu, J.; Yu, J. New understanding of the difference of photocatalytic activity among anatase, rutile and brookite TiO2. Phys. Chem. Chem. Phys. 2014, 16, 20382–20386. [Google Scholar] [CrossRef]
- Ohtani, B.; Prieto-Mahaney, O.; Li, D.; Abe, R. What is Degussa (Evonik) P25? Crystalline composition analysis, reconstruction from isolated pure particles and photocatalytic activity test. J. Photochem. Photobiol. A Chem. 2010, 216, 179–182. [Google Scholar] [CrossRef]
- Hurum, D.C.; Agrios, A.G.; Gray, K.A.; Rajh, T.; Thurnauer, M.C. Explaining the enhanced photocatalytic activity of Degussa P25 mixed-phase TiO2 using EPR. J. Phys. Chem. B 2003, 107, 4545–4549. [Google Scholar] [CrossRef]
- Ohno, T.; Sarukawa, K.; Tokieda, K.; Matsumura, M. Morphology of a TiO2 photocatalyst (Degussa, P-25) consisting of anatase and rutile crystalline phases. J. Catal. 2001, 203, 82–86. [Google Scholar] [CrossRef]
- Quesada-Cabrera, R.; Mills, A.; O’Rourke, C. Action spectra of P25 TiO2 and a visible light absorbing, carbon-modified titania in the photocatalytic degradation of stearic acid. Appl. Catal. B Environ. 2014, 150, 338–344. [Google Scholar] [CrossRef]
- Torimoto, T.; Okawa, Y.; Takeda, N.; Yoneyama, H. Effect of activated carbon content in TiO2-loaded activated carbon on photodegradation behaviors of dichloromethane. J. Photochem. Photobiol. A Chem. 1997, 103, 153–157. [Google Scholar] [CrossRef]
- Heu, R.; Ateia, M.; Awfa, D.; Punyapalakul, P.; Yoshimura, C. Photocatalytic Degradation of Organic Micropollutants in Water by Zr-MOF/GO Composites. J. Compos. Sci. 2020, 4, 54. [Google Scholar] [CrossRef]
- Ateia, M.; Alalm, M.G.; Awfa, D.; Johnson, M.S.; Yoshimura, C. Modeling the degradation and disinfection of water pollutants by photocatalysts and composites: A critical review. Sci. Total Environ. 2020, 698, 134197. [Google Scholar] [CrossRef]
- Awfa, D.; Ateia, M.; Fujii, M.; Johnson, M.S.; Yoshimura, C. Photodegradation of pharmaceuticals and personal care products in water treatment using carbonaceous-TiO2 composites: A critical review of recent literature. Water Res. 2018, 142, 26–45. [Google Scholar] [CrossRef]
- Awfa, D.; Ateia, M.; Fujii, M.; Yoshimura, C. Novel magnetic carbon nanotube-TiO2 composites for solar light photocatalytic degradation of pharmaceuticals in the presence of natural organic matter. J. Water Process. Eng. 2019, 31, 100836. [Google Scholar] [CrossRef]
- Shimizu, Y.; Ateia, M.; Wang, M.; Awfa, D.; Yoshimura, C. Disinfection mechanism of E. coli by CNT-TiO2 composites: Photocatalytic inactivation vs. physical separation. Chemosphere 2019, 235, 1041–1049. [Google Scholar] [CrossRef] [PubMed]
- Takeda, N.; Iwata, N.; Torimoto, T.; Yoneyama, H. Influence of carbon black as an adsorbent used in TiO2 photocatalyst films on photodegradation behaviors of propyzamide. J. Catal. 1998, 177, 240–246. [Google Scholar] [CrossRef]
- Ibusuki, T.; Takeuchi, K. Removal of low concentration nitrogen oxides through photoassisted heterogeneous catalysis. J. Mol. Catal. 1994, 88, 93–102. [Google Scholar] [CrossRef]
- Xu, Y.; Langford, C.H. Photoactivity of titanium dioxide supported on MCM41, zeolite X, and zeolite Y. J. Phys. Chem. B 1997, 101, 3115–3121. [Google Scholar] [CrossRef]
- Ao, C.; Lee, S. Combination effect of activated carbon with TiO2 for the photodegradation of binary pollutants at typical indoor air level. J. Photochem. Photobiol. A Chem. 2004, 161, 131–140. [Google Scholar] [CrossRef]
- Irie, H.; Watanabe, Y.; Hashimoto, K. Carbon-doped anatase TiO2 powders as a visible-light sensitive photocatalyst. Chem. Lett. 2003, 32, 772–773. [Google Scholar] [CrossRef]
- Chatterjee, A.; Wu, S.B.; Chou, P.W.; Wong, M.; Cheng, C.L. Observation of carbon-facilitated phase transformation of titanium dioxide forming mixed-phase titania by confocal Raman microscopy. J. Raman Spectrosc. 2011, 42, 1075–1080. [Google Scholar] [CrossRef]
- Fang, J.; Chen, Z.; Zheng, Q.; Li, D. Photocatalytic decomposition of benzene enhanced by the heating effect of light: Improving solar energy utilization with photothermocatalytic synergy. Catal. Sci. Technol. 2017, 7, 3303–3311. [Google Scholar] [CrossRef]
- Wang, L.; Zhang, Y.; Gu, X.; Zhang, Y.; Su, H. Insight into the role of UV-irradiation in photothermal catalytic Fischer–Tropsch synthesis over TiO2 nanotube-supported cobalt nanoparticles. Catal. Sci. Technol. 2018, 8, 601–610. [Google Scholar] [CrossRef]
- Zeng, M.; Li, Y.; Mao, M.; Bai, J.; Ren, L.; Zhao, X. Synergetic effect between photocatalysis on TiO2 and thermocatalysis on CeO2 for gas-phase oxidation of benzene on TiO2/CeO2 nanocomposites. ACS Catal. 2015, 5, 3278–3286. [Google Scholar] [CrossRef]
- Lan, L.; Li, Y.; Zeng, M.; Mao, M.; Ren, L.; Yang, Y.; Liu, H.; Yun, L.; Zhao, X. Efficient UV–vis-infrared light-driven catalytic abatement of benzene on amorphous manganese oxide supported on anatase TiO2 nanosheet with dominant {001} facets promoted by a photothermocatalytic synergetic effect. Appl. Catal. B Environ. 2017, 203, 494–504. [Google Scholar] [CrossRef]
- Zheng, Y.; Wang, W.; Jiang, D.; Zhang, L. Amorphous MnOx modified Co3O4 for formaldehyde oxidation: Improved low-tempe rature catalytic and photothermocatalytic activity. Chem. Eng. J. 2016, 284, 21–27. [Google Scholar] [CrossRef]
- Chen, J.; Li, Y.; Fang, S.; Yang, Y.; Zhao, X. UV–Vis-infrared light-driven thermocatalytic abatement of benzene on Fe doped OMS-2 nanorods enhanced by a novel photoactivation. Chem. Eng. J. 2018, 332, 205–215. [Google Scholar] [CrossRef]
- Ji, J.; Xu, Y.; Huang, H.; He, M.; Liu, S.; Liu, G.; Xie, R.; Feng, Q.; Shu, Y.; Zhan, Y.; et al. Mesoporous TiO2 under VUV irradiation: Enhanced photocatalytic oxidation for VOCs degradation at room temperature. Chem. Eng. J. 2017, 327, 490–499. [Google Scholar] [CrossRef]
- Fang, S.; Li, Y.; Yang, Y.; Chen, J.; Liu, H.; Zhao, X. Mg-doped OMS-2 nanorods: A highly efficient catalyst for purification of volatile organic compounds with full solar spectrum irradiation. Environ. Sci. Nano 2017, 4, 1798–1807. [Google Scholar] [CrossRef]
- Russell, H.S.; Bonomaully, J.; Bossi, R.; Hofmann, M.E.; Knap, H.C.; Pernov, J.B.; Veld, M.; Johnson, M.S. Novel Materials for Combined Nitrogen Dioxide and Formaldehyde Pollution Control under Ambient Conditions. Catalysts 2020, 10, 1040. [Google Scholar] [CrossRef]
- Selishchev, D.; Kolobov, N.; Pershin, A.; Kozlov, D. TiO2 mediated photocatalytic oxidation of volatile organic compounds: Formation of CO as a harmful by-product. Appl. Catal. B Environ. 2017, 200, 503–513. [Google Scholar] [CrossRef]
- Yao, H.; Feilberg, A. Characterisation of photocatalytic degradation of odorous compounds associated with livestock facilities by means of PTR-MS. Chem. Eng. J. 2015, 277, 341–351. [Google Scholar] [CrossRef]
- Wang, Z.; Liu, J.; Dai, Y.; Dong, W.; Zhang, S.; Chen, J. Dimethyl sulfide photocatalytic degradation in a light-emitting-diode continuous reactor: Kinetic and mechanistic study. Ind. Eng. Chem. Res. 2011, 50, 7977–7984. [Google Scholar] [CrossRef]
- Lin, Y.H.; Hsueh, H.T.; Chang, C.W.; Chu, H. The visible light-driven photodegradation of dimethyl sulfide on S-doped TiO2: Characterization, kinetics, and reaction pathways. Appl. Catal. B Environ. 2016, 199, 1–10. [Google Scholar] [CrossRef]
- Li, Y.; Chen, N.; Deng, D.; Xing, X.; Xiao, X.; Wang, Y. Formaldehyde detection: SnO2 microspheres for formaldehyde gas sensor with high sensitivity, fast response/recovery and good selectivity. Sens. Actuators B Chem. 2017, 238, 264–273. [Google Scholar] [CrossRef]
- Nielsen, G.D.; Larsen, S.T.; Wolkoff, P. Re-evaluation of the WHO (2010) formaldehyde indoor air quality guideline for cancer risk assessment. Arch. Toxicol. 2017, 91, 35–61. [Google Scholar] [CrossRef] [PubMed]
- Nie, L.; Yu, J.; Jaroniec, M.; Tao, F.F. Room-temperature catalytic oxidation of formaldehyde on catalysts. Catal. Sci. Technol. 2016, 6, 3649–3669. [Google Scholar] [CrossRef]
- Cho, K.S.; Hirai, M.; Shoda, M. Degradation characteristics of hydrogen sulfide, methanethiol, dimethyl sulfide and dimethyl disulfide by Thiobacillus thioparus DW44 isolated from peat biofilter. J. Ferment. Bioeng. 1991, 71, 384–389. [Google Scholar] [CrossRef]
- De Zwart, J.M.; Kuenen, J.G. C 1-cycle of sulfur compounds. Biodegradation 1992, 3, 37–59. [Google Scholar] [CrossRef]
- Charlson, R.J.; Lovelock, J.E.; Andreae, M.O.; Warren, S.G. Oceanic phytoplankton, atmospheric sulphur, cloud albedo and climate. Nature 1987, 326, 655–661. [Google Scholar] [CrossRef]
- Zhao, W.; Dai, J.; Liu, F.; Bao, J.; Wang, Y.; Yang, Y.; Yang, Y.; Zhao, D. Photocatalytic oxidation of indoor toluene: Process risk analysis and influence of relative humidity, photocatalysts, and VUV irradiation. Sci. Total Environ. 2012, 438, 201–209. [Google Scholar] [CrossRef]
- Vildozo, D.; Portela, R.; Ferronato, C.; Chovelon, J.M. Photocatalytic oxidation of 2-propanol/toluene binary mixtures at indoor air concentration levels. Appl. Catal. B Environ. 2011, 107, 347–354. [Google Scholar] [CrossRef]
- Irokawa, Y.; Morikawa, T.; Aoki, K.; Kosaka, S.; Ohwaki, T.; Taga, Y. Photodegradation of toluene over TiO2- X N X under visible light irradiation. Phys. Chem. Chem. Phys. 2006, 8, 1116–1121. [Google Scholar] [CrossRef] [PubMed]
- Cantau, C.; Larribau, S.; Pigot, T.; Simon, M.; Maurette, M.; Lacombe, S. Oxidation of nauseous sulfur compounds by photocatalysis or photosensitization. Catal. Today 2007, 122, 27–38. [Google Scholar] [CrossRef]
- Soni, K.C.; Shekar, S.C.; Singh, B.; Gopi, T. Catalytic activity of Fe/ZrO2 nanoparticles for dimethyl sulfide oxidation. J. Colloid Interface Sci. 2015, 446, 226–236. [Google Scholar] [CrossRef]
- Chen, J.; Qin, Y.; Chen, Z.; Yang, Z.; Yang, W.; Wang, Y. Gas circulating fluidized beds photocatalytic regeneration of I-TiO2 modified activated carbons saturated with toluene. Chem. Eng. J. 2016, 293, 281–290. [Google Scholar] [CrossRef]
- Demeestere, K.; Dewulf, J.; De Witte, B.; Van Langenhove, H. Titanium dioxide mediated heterogeneous photocatalytic degradation of gaseous dimethyl sulfide: Parameter study and reaction pathways. Appl. Catal. B Environ. 2005, 60, 93–106. [Google Scholar] [CrossRef]
- Yu, X.; Yin, H.; Ye, J.S.; Peng, H.; Lu, G.; Dang, Z. Degradation of tris-(2-chloroisopropyl) phosphate via UV/TiO2 photocatalysis: Kinetic, pathway, and security risk assessment of degradation intermediates using proteomic analyses. Chem. Eng. J. 2019, 374, 263–273. [Google Scholar] [CrossRef]
- Manheim, J.M.; Milton, J.R.; Zhang, Y.; Kenttamaa, H.I. Fragmentation of saturated hydrocarbons upon atmospheric pressure chemical ionization is caused by proton-transfer reactions. Anal. Chem. 2020, 92, 8883–8892. [Google Scholar] [CrossRef] [PubMed]
- Vlasenko, A.; Macdonald, A.; Sjostedt, S.; Abbatt, J. Formaldehyde measurements by Proton transfer reaction–Mass Spectrometry (PTR-MS): Correction for humidity effects. Atmos. Meas. Tech. 2010, 3, 1055–1062. [Google Scholar] [CrossRef]
- Inomata, S.; Tanimoto, H.; Kameyama, S.; Tsunogai, U.; Irie, H.; Kanaya, Y.; Wang, Z. Determination of formaldehyde mixing ratios in air with PTR-MS: Laboratory experiments and field measurements. Atmos. Chem. Phys. 2008, 8, 273–284. [Google Scholar] [CrossRef]
- Jobson, B.; McCoskey, J. Sample drying to improve HCHO measurements by PTR-MS instruments: Laboratory and field measurements. Atmos. Chem. Phys. 2010, 10, 1821–1835. [Google Scholar] [CrossRef]
- Warneke, C.; Veres, P.; Holloway, J.; Stutz, J.; Tsai, C.; Alvarez, S.; Rappenglueck, B.; Fehsenfeld, F.; Graus, M.; Gilman, J.; et al. Airborne formaldehyde measurements using PTR-MS: Calibration, humidity dependence, inter-comparison and initial results. Atmos. Meas. Tech. 2011, 4, 2345–2358. [Google Scholar] [CrossRef]
- Wisthaler, A.; Apel, E.; Bossmeyer, J.; Hansel, A.; Junkermann, W.; Koppmann, R.; Meier, R.; Müller, K.; Solomon, S.; Steinbrecher, R.; et al. Intercomparison of formaldehyde measurements at the atmosphere simulation chamber SAPHIR. Atmos. Chem. Phys. 2008, 8, 2189–2200. [Google Scholar] [CrossRef]
- Salthammer, T.; Mentese, S. Comparison of analytical techniques for the determination of aldehydes in test chambers. Chemosphere 2008, 73, 1351–1356. [Google Scholar] [CrossRef] [PubMed]
- Cui, L.; Zhang, Z.; Huang, Y.; Lee, S.C.; Blake, D.R.; Ho, K.F.; Wang, B.; Gao, Y.; Wang, X.M.; Louie, P.K.K. Measuring OVOCs and VOCs by PTR-MS in an urban roadside microenvironment of Hong Kong: Relative humidity and temperature dependence, and field intercomparisons. Atmos. Meas. Tech. 2016, 9, 5763–5779. [Google Scholar] [CrossRef]


| Substrate | /% | χCH2O/% | χCH3COCH3/% | χCH3SSCH3/% |
|---|---|---|---|---|
| TiO2 | 47.4 | 5.2 | 0.5 | −0.5 |
| TiO2/AC (1:1) | 22.9 | 12.3 | 0.5 | −0.2 |
| TiO2/AC (1:5) | 13.4 | 11.2 | 0.2 | −0.4 |
| T/C | fCH3SCH3/% | χCH2O/% | χCH3COCH3/% | χCH3SSCH3/% |
|---|---|---|---|---|
| 20 | 58.1 | 12.8 | 3.6 | 5.2 |
| 30 | 50.1 | 18.1 | 2.4 | 8.4 |
| 50 | 49.2 | 21.0 | 15.5 | 5.4 |
| 70 | 48.1 | 7.4 | 4.6 | 12.4 |
| Name | Formula | Vapor Pressure | Solubility | Boiling Point | Dipole Moment |
|---|---|---|---|---|---|
| Carbon monoxide | CO | >35 atm | 2% | −191.5 C | 0.122 D |
| Carbon dioxide | CO2 | 56.5 atm | 0.2% (25 C) | 78.48 C | - |
| Methane | CH4 | kPa (25 C) | 3.5 mL/100 mL at (17 C) | −161 C at 101.32 kPa | - |
| Formaldehyde | CH2O | 1.40 kPa at 25 C | 4.00 × 10 + 5 mg/L at 20 C | −21 C at 101.32 kPa | 2.330 D |
| Dimethyl sulfide | CH3SCH3 | 53.7 kPa (at 20 C) | 22 mg/mL at 25 C | 37.2 C at 101.32 kPa | 1.499 D |
| Acetone | C3H6O | 9.39 kPa (0 C) 30.6 kPa (25 C) 374 kPa (100 C) 2.8 MPa (200 C) | Miscible | 56.05 C ( 44 C) | 2.91 D |
| Dimethyl disulfide | CH3SSCH3 | 3.8 kPa (at 25 C) | 2.5 g/L (20 C) | 110 C | 1.50 D |
| T/C | fCH3SCH3/% | χCH2O/% | χCH3COCH3/% | χCH3SSCH3/% |
|---|---|---|---|---|
| 20 | 28.2 | 9.3 | 1.3 | −0.1 |
| 30 | 32.9 | 8.9 | 1.6 | −0.6 |
| 50 | 16.0 | 31.7 | 21.2 | 1.0 |
| 70 | 11.1 | 20.4 | 17.1 | 1.7 |
Publisher’s Note: MDPI stays neutral with regard to jurisdictional claims in published maps and institutional affiliations. |
© 2021 by the authors. Licensee MDPI, Basel, Switzerland. This article is an open access article distributed under the terms and conditions of the Creative Commons Attribution (CC BY) license (https://creativecommons.org/licenses/by/4.0/).
Share and Cite
Yu, W.; in `t Veld, M.; Bossi, R.; Ateia, M.; Tobler, D.; Feilberg, A.; Bovet, N.; Johnson, M.S. Formation of Formaldehyde and Other Byproducts by TiO2 Photocatalyst Materials. Sustainability 2021, 13, 4821. https://doi.org/10.3390/su13094821
Yu W, in `t Veld M, Bossi R, Ateia M, Tobler D, Feilberg A, Bovet N, Johnson MS. Formation of Formaldehyde and Other Byproducts by TiO2 Photocatalyst Materials. Sustainability. 2021; 13(9):4821. https://doi.org/10.3390/su13094821
Chicago/Turabian StyleYu, Weijia, Marten in `t Veld, Rossana Bossi, Mohamed Ateia, Dominique Tobler, Anders Feilberg, Nicolas Bovet, and Matthew S. Johnson. 2021. "Formation of Formaldehyde and Other Byproducts by TiO2 Photocatalyst Materials" Sustainability 13, no. 9: 4821. https://doi.org/10.3390/su13094821
APA StyleYu, W., in `t Veld, M., Bossi, R., Ateia, M., Tobler, D., Feilberg, A., Bovet, N., & Johnson, M. S. (2021). Formation of Formaldehyde and Other Byproducts by TiO2 Photocatalyst Materials. Sustainability, 13(9), 4821. https://doi.org/10.3390/su13094821