Article

Impacts of Urban Land Use Changes on Ecosystem Services in Dianchi Lake Basin, China

1
Faculty of Environmental Science and Engineering, Kunming University of Science and Technology, Kunming 650500, China
2
Center for Integrative Conservation, Xishuangbanna Tropical Botanical Garden, Chinese Academy of Sciences, Xishuangbanna 666303, China
3
Center of Conservation Biology, Core Botanical Gardens, Suzhou Chinese Academy of Sciences, Mengla 666303, China
4
Department of Biological and Environmental Sciences, College of Arts and Sciences, Qatar University, Doha P.O. Box 2713, Qatar
5
Environmental Science Center, Qatar University, Doha P.O. Box 2713, Qatar
6
University of Chinese Academy of Sciences, Beijing 100049, China
7
College of Behavioral and Social Sciences, University of Maryland, College Park, MD 20742, USA
*
Author to whom correspondence should be addressed.
Sustainability 2021, 13(9), 4813; https://doi.org/10.3390/su13094813
Submission received: 27 February 2021 / Revised: 10 April 2021 / Accepted: 15 April 2021 / Published: 25 April 2021
(This article belongs to the Special Issue Landscape Planning for Sustainability)

Abstract

:
Land use change is widely regarded as a key factor altering the structure and function of ecosystems. Urbanization is a particular driver and influence in land use change and is expanding globally, especially in developing countries like China. The InVEST model was employed in this study to comprehensively assess the temporal-spatial impacts of urban land use changes (ULUC) on ecosystem services (ESs) and clarify the tradeoffs between urbanization and ecosystem services provision (ESP) in Dianchi Lake Basin (DLB), China, during 1995–2015. The results showed that DLB’s constructed land, particularly in lakeside areas, has increased substantially because of rapid urbanization (built-up area increase 51%, urbanization rate increase 91%), at the expense of agriculture, grassland, and scrubland, greatly altering ESP. Compared with 1995, carbon storage in 2015 decreased, while soil retention and nitrogen exports only fluctuated slightly. Although water yield increased, the ecological water volume of the whole DLB decreased through an increase in regional surface runoff. This resulted in more pollutants being carried into Dianchi Lake, impairing water quality and causing serious ecological and environmental issues. Thus, this study provides empirical evidence of the significant influence of ULUC on ESP. For eco-friendly urbanization in DLB and similar areas with rapid urbanization, a sustainable pattern of urbanization should be followed. The best tradeoffs between urbanization and ESP should be identified and considered in decision-making relating to urban planning, land use management, optimal natural resources management, and ecological conservation.

1. Introduction

Ecosystems maintain normal operation of the Earth’s ecosphere, through system features, functions, and direct or indirect supply of services and products. They thereby provide most of material basis for the survival, development, and well-being of human societies and for the environment [1,2]. This is mainly manifested in biological production, material circulation, energy flows, and information transmission. Ecosystem services (ESs) usually refer to benefits people derive directly and indirectly from nature [3], and which are useful in maintaining human welfare and addressing sustainability challenges [4]. Interest, attention, and efforts by scientists worldwide are now being directed to the field of ESs assessment and management optimization [1,5].
Unfortunately, on a global scale, almost two-thirds of ESs are degenerated and this trend may accelerate in parallel with the increasing reach and intensity of human activities, and the growing ability of humans to influence nature [1,6]. Activities such as urbanization inevitably and particularly remold urban land use forms, intensity, types, and structure [7,8,9]. Already, ULUC is affecting a vast range of ESs and causing deterioration and even loss of vital ESs that require an unpolluted environment and biodiversity [10,11]. Research is urgently needed to identify the explicit temporal-spatial variation in ESs in urbanized areas. It is also critical to estimate the influence of urbanization on ESs variation through land use change, aiming at optimizing land use management, urban planning [12], and decision-making for economically, socially, and environmentally sustainable urban development [13,14].
The most prominent feature of urbanization is that it converts vast areas of semi-natural or natural land to construction land [15], with corresponding impacts on ESs. Numerous studies have demonstrated that land use changes can significantly reduce ESP [16], e.g., by damaging regional biodiversity, decreasing carbon storage and sequestration [16], exacerbating soil erosion and nitrogen export [17], deteriorating water quality and availability [18], and decreasing recreational and esthetic values [19]. Consequently, land use change has been proven to be the direct and main driving factor of recent ESs change and global environmental change [20]. Moreover, land ESs differ distinctly from other tangible goods and services, and are usually neglected by stakeholders (government, businesses, and individuals) during the process of urbanization, thus exacerbating potential threats to ecological security. A better understanding of the driver-response relationship between urbanization (through land use change) and ESP is critical for sustainable urban planning, land use management, and ecosystem protection [17,21].
However, there is a certain knowledge gap regarding the driving mechanism of land use change. Many studies ascribe land use change to continuously increasing human activities, such as farming and mining, or to climate variation [16,22,23]. Few studies have specifically examined the potential driving forces behind land use change, particularly the effect of conversion from non-urban land to urban land on regional ESs [24]. This makes investigation of driver-response relationships more complex, but is critical for sound decision-making on ecological environment protection and urban planning.
Urbanization is an unavoidable stage in global economic and social development [25], which is rapidly expanding globally. While acting as an efficient path to improve people’s life quality, economic, and social development extensively drives land use changes [26]. Urbanization inevitably leads to ecosystem changes by converting agricultural and forest land into constructed land, causing inevitable loss of ESs [27]. Even worse, most current policies neglect the impacts of urbanization-driven land use change on regional ecological and ESs. Identification of a sustainable urbanization pattern is an urgent global need to maintain ecological balance and ESP [17,28]. To attain this goal, the pressure-driver-response path by which urbanization drives ULUC, and the resulting variation in ESs, need to be identified.
Dianchi Lake Basin (DLB) is a typical example of an urban development model based on a plateau-lake ecosystem. It is located in the most active region of economic and social development in both Kunming city and Yunnan province, where it is the most concentrated area of urban construction and development. However, in parallel with large-scale and rapid urbanization, ecological regulation and self-recovery functions in the basin have gradually weakened and even been lost, with biodiversity reductions, water quality deterioration, and lake pollution becoming increasingly severe (Figure S1). This has caused increasingly serious ecological and environmental problems in the basin, severely affecting local residents’ lifestyle [29]. One of the main reasons for the increasing lake pollution and unrecoverable ecosystem function in DLB is unreasonable land use [30].
The aim of the present study was to help policymakers better understand the impacts of urbanization in driving land use change and changes in ESs, and the tradeoffs between these processes. The ecological dilemma posed by economic and social development in DLB creates an urgent need to clarify the following three issues: (1) Land use changes arising from urbanization; (2) the status of ESs in DLB; and (3) the impact of ULUC on ESs.

2. Materials and Methods

2.1. Study Area

Dianchi Lake (the sixth largest freshwater lake in China, covering an area of 2920 km2) is located in the middle of the Yunnan-Guizhou Plateau and Jinsha River system (Figure 1). The basin (elevation 1755–2825 m asl) has a subtropical plateau monsoon climate zone, with mean annual precipitation of 797–1007 mm, annual evaporation of 1409–1871 mm, and mean annual temperature of 14.6–15.9 °C [31]. The altitude of the terrain in DLB is lower in the south and center, around Dianchi Lake (hereafter ‘lakeside area’, defined as area with slope lower than 8° around the lake), and higher in the surrounding mountains (hereafter ‘mountainous area’) [32]. Urbanization and construction are mainly distributed around the lake, because of lower construction costs, easy drainage and flood control, and lake views. The mountainous area was defined here as all other areas in DLB.
Dianchi Lake is revered as the ‘mother lake’, due to the irreplaceable role of maintaining local people’s livelihoods and regional economic and social development in the form of water supply, agricultural production, climate regulation, tourism, and recreation [31]. Dianchi Lake is the foundation and support for urban development in Kunming city, the political, cultural, and economic center of Yunnan Province, and its most densely populated and developed area [33]. From 1995 to 2019, the GDP of DLB increased from 32.97 billion (RMB) to 647.59 billion (RMB), an approximately 20-fold increase, and the permanent resident population increased from 2.36 million to 4.05 million, a 1.7-fold increase. The built-up area of cities and towns increased by 229 km2, or 1.6-fold. Indirectly, these changes and trends indicate that urbanization is a direct and main factor in land use change in DLB.
Due to a relative lag in urban drainage systems and sewage treatment facilities, resulting in pollution from agricultural and urban non-point sources, the pollutant load to Dianchi Lake has increased sharply and the water quality has dropped rapidly since the 1990s [34]. Dianchi Lake has become a heavily eutrophicated lake, with cyanobacteria blooms nearly every year [35]. These seriously impair the regional ecological environment and overall urban water landscape, significantly impacting local residents’ lifestyle, culture, and living environment quality, damaging the beautiful image of Spring City, and reducing the overall urban competitiveness of Kunming. Protection and treatment of Dianchi Lake is a difficult problem facing governments at all levels, and a series of comprehensive measures for ecological restoration and pollution control are urgently needed.

2.2. Ecosystem Services Assessment

2.2.1. Representative Parameter Selection

To analyze the characteristics and existing problems in DLB’s economy, social development, and ecosystems, considering the demands of all stakeholders [17], we used the ecosystem services classification framework defined by Common International Classification of Ecosystem Services (CICES) and Millennium Ecosystem Assessment (MEA) [1,36]. We selected four representative indicators to represent ESs in DLB for which data were available, namely: water yield, carbon storage, nitrogen export, and soil retention. These selected parameters are critical for DLB, primarily due to requirements for optimizing urban development pattern and addressing water quality and availability issues faced by local governments and residents (a detailed description of the selected ESs can be found in the Supplementary Materials, Section S1).

2.2.2. Ecosystem Services Evaluation

Water yield, soil retention, nitrogen export, and carbon storage in DLB were assessed using the InVEST model (Version.3.7.0, Stanford University, The Nature Conservancy and the World Wide Fund for Nature, Stanford, CA, USA) and a 20-year timescale (1995–2015). Integrated Valuation of Ecosystem Services and Tradeoffs (InVEST) is a set of model systems developed by the U.S. Natural Capital Project Group to evaluate ecosystem services and their economic value, and to support ecosystem management and decision-making. It includes three types of ecosystem service evaluation models: terrestrial, freshwater, and marine. The InVEST model is now widely used in spatial planning, ecological compensation, risk management, adaptation to climate change, and other environmental management decisions in more than 20 countries and regions [37]. InVEST was originally developed to map the distribution of ESs at spatial scale and evaluate tradeoffs between different ESs [38]. The evaluation procedure is described in the Supplementary Materials, Section S2 and parameterization of InVEST in Supplementary Materials, Section S3. The sources and availability of data are summarized in Table S2 (Supplementary Materials, Section S3), while model settings are listed in Tables S3 and S4 (Supplementary Materials, Section S3).
The water yield model in InVEST was used to calculate water production per pixel of a certain landscape on a certain occasion, always simplified as precipitation minus evapotranspiration [37]. The main input data were annual soil depth, precipitation and evapotranspiration, and plant-available water content (PAWC). Soil retention was determined using the sediment delivery ratio model in InVEST, which estimates generation and delivery of overland sediment to streams, with main input data including a DEM, raster data on precipitation, soil texture, and land cover, and biophysical attributes based on soil erosion caused by land use and land cover changes (LUCC, listed in Tables S2 and S4). Carbon storage was determined using the carbon sequestration and storage model in InVEST, using LUCC rasters and carbon-pool parameters (from a biophysical attributes table; Tables S2 and S3) to calculate the carbon quantity captured and stored in a certain landscape at a certain occasion [37]. Nitrogen export was estimated using the nutrient delivery ratio model in InVEST. It applies the principle of mass conservation to calculate transmission and attenuation of nutrient mass while flowing through a certain landscape, with main driving data including DEM, land use and cover rasters, precipitation capacity data, and a biophysical attributes table based on the nutrient loading and retention efficiency related to LUCC (Tables S2–S4). A flow chart of the methodology used in the present study is shown in Figure 2.

2.2.3. Model Parameterization and Validation

The InVEST model has its own unique regional attributes, i.e., a specific region has a set of specific parameters. The parameters for a specific region are relatively stable in specific time and space, and are based on actual data on the study area, such as DEM, land use, precipitation, soil, and other data input into the model. In accordance with the principles, methods of use, and accepted rules of the academic community in using the InVEST model [20], literature and monitoring data were used here to calibrate the models and validate the simulation results. Water yield 2009–2011 is reported to be 0.45–0.75 × 10⁹ m3 [39], while our modeled amount was 0.73 × 10⁹ m3 in 1995 and 0.78 × 10⁹ m3 in 2015. Considering the variation in annual rainfall in DLB, the prediction results of our model were reasonable. Soil retention was modeled to be 0.31 × 10⁹ t in 2015, which was similar to the 0.34 × 10⁹ t reported for almost the same period [40]. Annual nitrogen export in DLB, based on relevant research and monitoring results, varies between 1240 t and 1951.1 t [41]. Our simulated value was 1980.42 t in 1995 and 1794.85 t in 2015, i.e., within reasonable limits. Carbon storage parameters (Tables S3 and S4) extracted from the literature were used in model calibration, while the simulation results were validated using other independent reported data. Total carbon storage of the forest in DLB was estimated to be 1.96 × 10⁶ t in 2008 [42], which was very close to our modeled result of 2.72 × 10⁶ t in 2015.

2.3. Statistical Analysis

Quantifying the amount, location, and spatial distribution of ESs is a critical step in integrating ESs into decision making on ecosystem management [43]. The spatial patterns and amounts of the ESs mapped in this study were comparable to those in other relevant previous studies.
To assess the influence of various factors on land use change in DLB, regression analysis was used over the course of the study (1995, 2000, 2005, 2010, 2015, and 2019). Built-up area was chosen as the indicator, and also as the dependent variable to characterize land use change, because it underwent tremendous changes in the study period and is highly correlated with urbanization [30]. The selected independent variables were urbanization rate, permanent resident population, GDP, industrial added value, and major meat production, which are commonly regarded as the main factors in LUCC [44], and for which it was easy to obtain data (Table S1).
The relationships between ESs and land use change were evaluated using correlation coefficient (Pearson’s r) over the study period and on spatial scale in DLB (whole basin, lakeside area, mountainous area) [45]. A total of 500 points each were randomly generated in the mountainous area and lakeside area, and relevant indicator values of these points were extracted and used to analyze the correlations between ESs. The tradeoffs between urbanization and ESs were then aggregated and analyzed on the scale of the whole basin, mountainous area, and lakeside area.

2.4. Data Preparation

Spatial maps and designated biophysical parameter tables were used as inputs to run the InVEST model [23]. DEM (30 m spatial resolution) and land use data (overall accuracy 92.27%) were acquired from http://www.resdc.cn/ (accessed on 20 January 2020). In total, six types of land use were considered in the analysis: agriculture, forest, constructed, shrub, open water, and grass (Table S5). Spatial and other relevant data needed are summarized in Table S2. The main parameters applied to drive the InVEST model are listed in Tables S3 and S4. All layers applied were assigned to the WGS 1984 Albers reference system and re-sampled to 90 m resolution.

3. Results

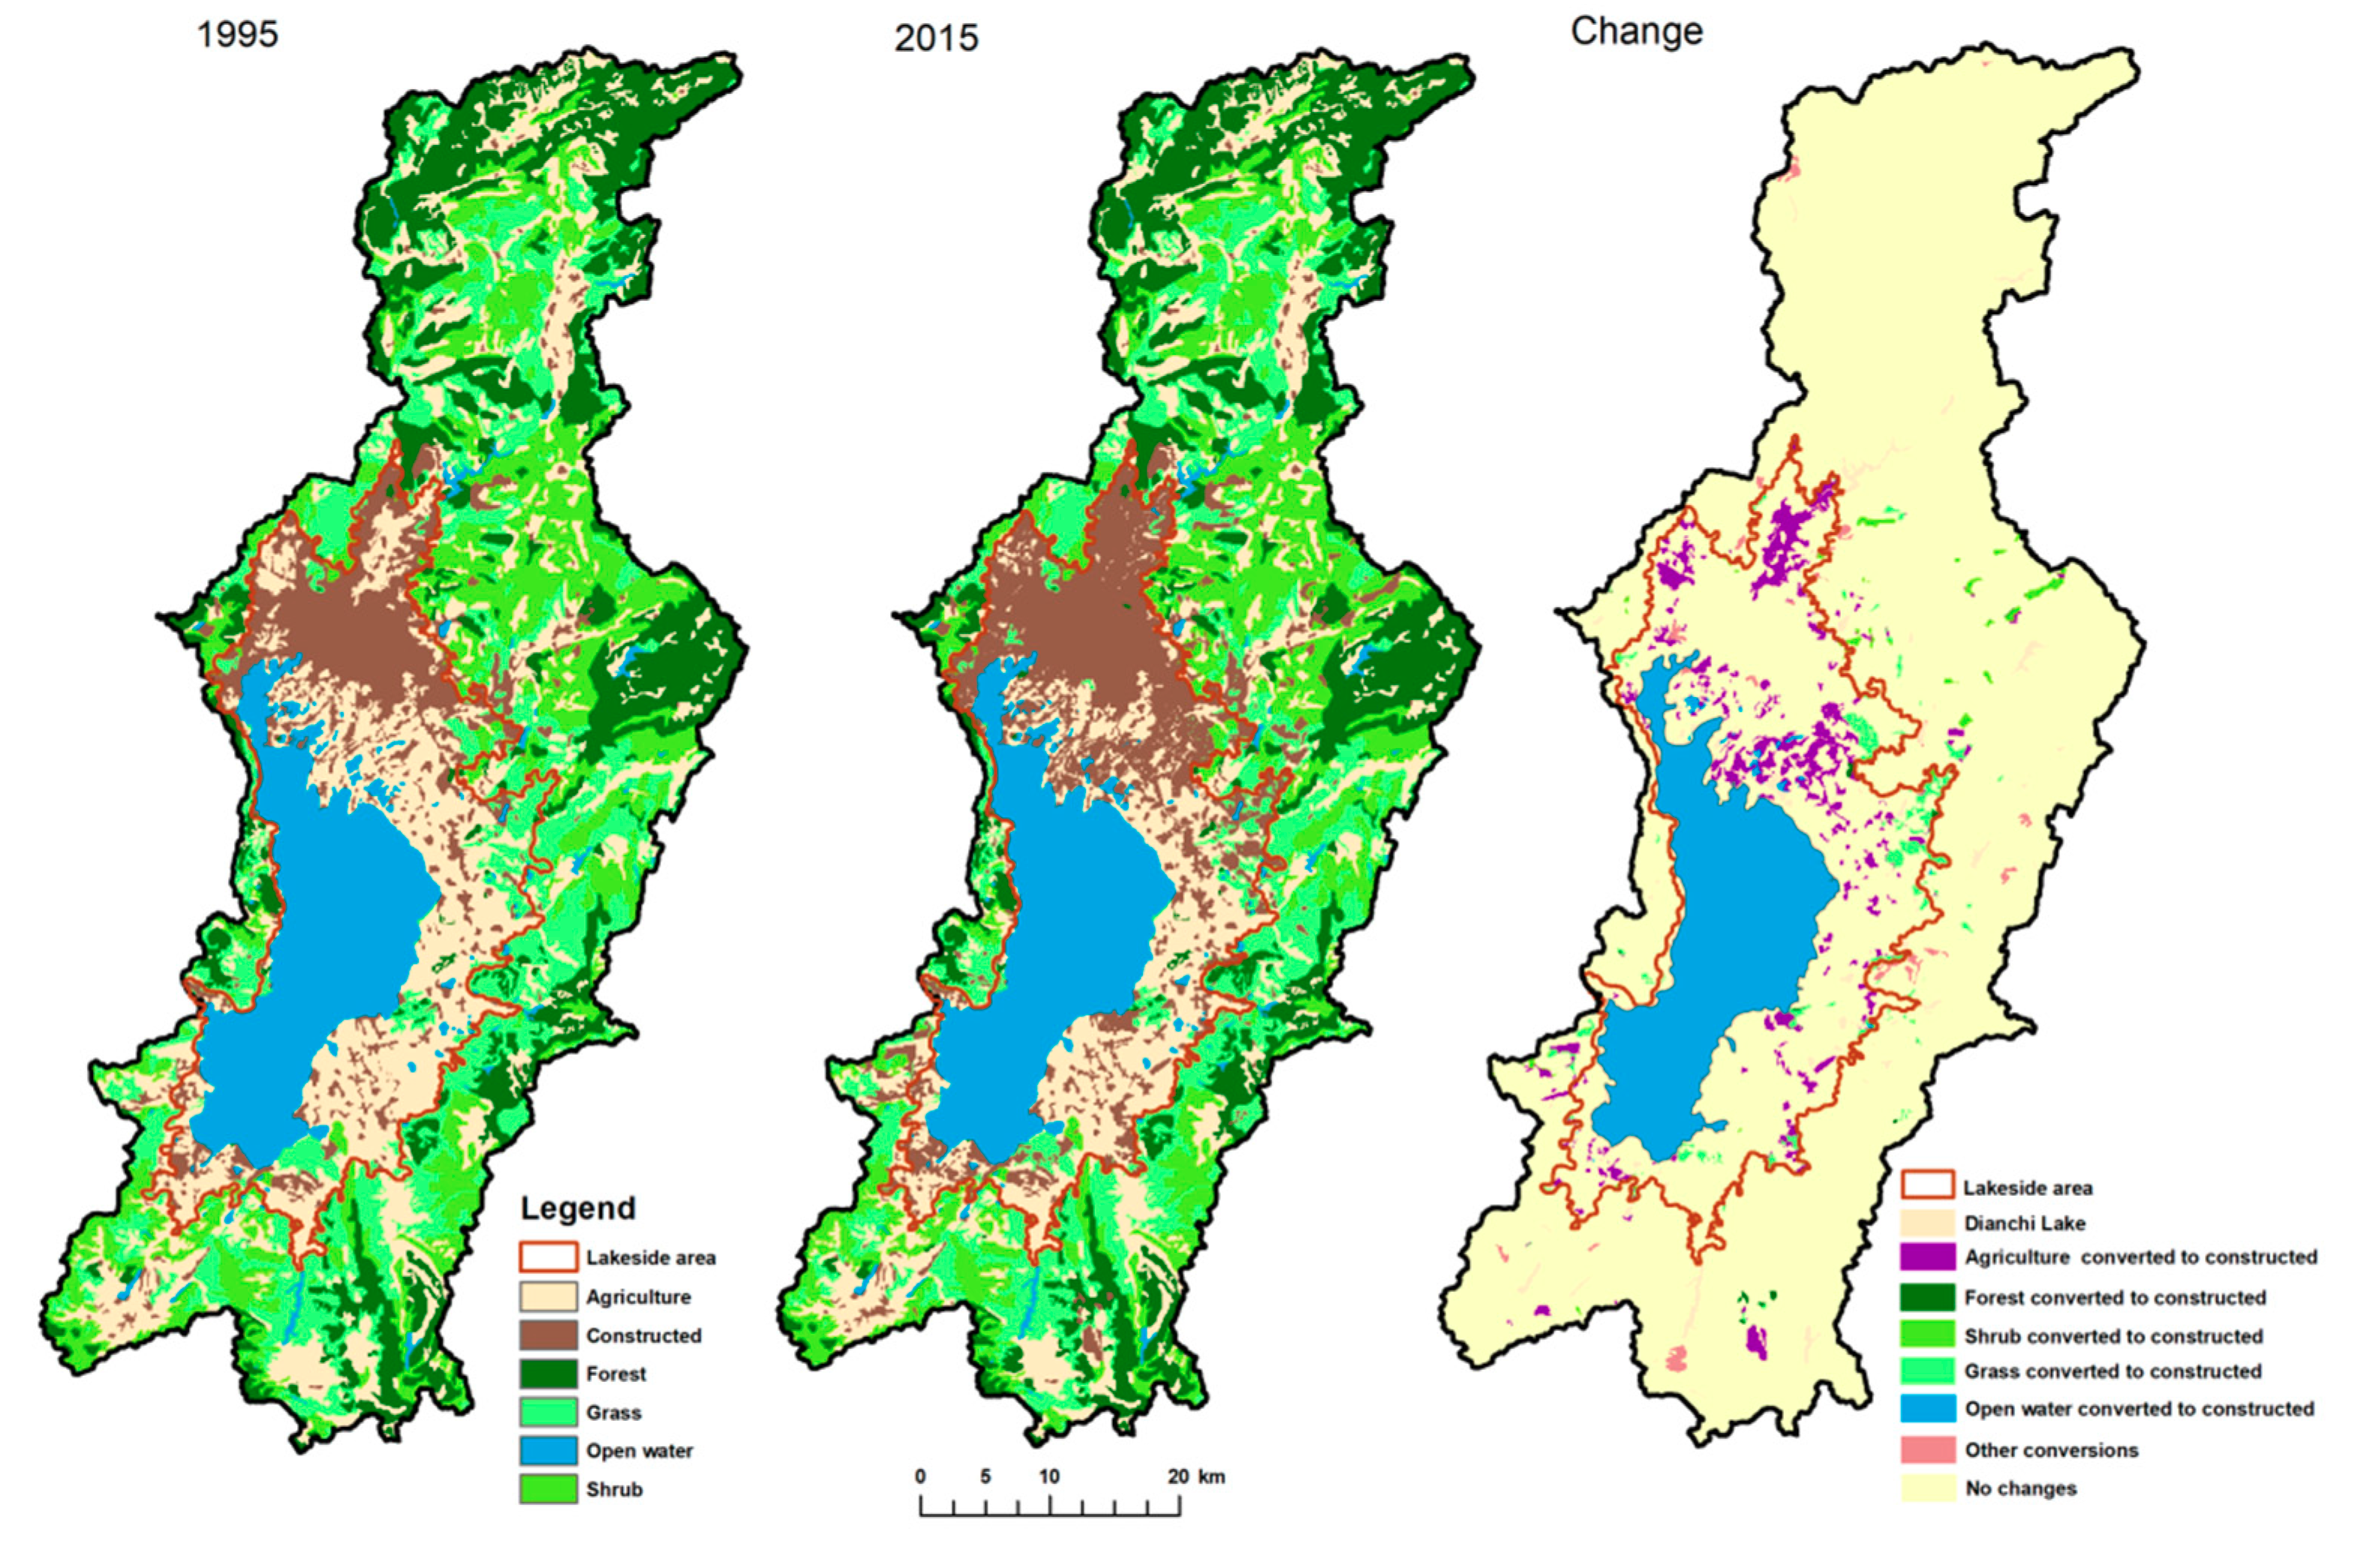
3.1. Land Use Classes and Changes

Constructed land, grassland, and agriculture were the three major land use changes in the whole DLB from 1995 to 2015 (Tables S6 and S7, Figure 3). The overall area of constructed land increased significantly, from 273.89 km2 in 1995 to 412.94 km2 in 2015 (Table 1). This largely derived from agricultural land, which constituted 21.3% of the total constructed land in 2015, followed by conversion of grassland (8.2%). The overall agricultural area declined dramatically, from 723.97 km2 in 1995 to 634.24 km2 in 2015, with 12.5% of this becoming constructed land and 0.4% becoming forest over the study period. Grassland decreased slightly, from 569.78 km2 in 1995 to 531.83 km2 in 2015, with 5.9% of the grassland area in 1995 converted to constructed land and 0.6% to forest.
In the lakeside area, constructed land, agriculture, grassland, and shrubland were the four major land use changes from 1995 to 2015, excluding water area of Dianchi Lake. The grassland area was reduced sharply, from 66.23 km2 in 1995 to 42.88 km2 in 2015, mainly because of conversion of 24.73 km2 (37.3% of grassland in 1995) to constructed land. The total area of agriculture was reduced significantly from 328.66 km2 to 249.15 km2, mainly because of conversion of 79.51 km2 to constructed land (23.7% of agriculture in 1995). For shrubland, the main change was conversion of 1.73 km2 to constructed land (15.9% of shrubland in 1995). Meanwhile, total constructed zone dramatically increased, from 230.62 km2 in 1995 to 339.57 km2 in 2015, mainly from agriculture (79.51 km2) and grassland (24.73 km2). The newly-added constructed land constituted 32.1% of the total constructed land in 2015.
In the mountainous area, constructed land, grassland, and agriculture were the three major land use changes during 1995 and 2015. Grassland area experienced a slight decrease, from 503.55 km2 in 1995 to 489.96 km2 in 2015. Agriculture area also diminished slightly, from 395.31 km2 in 1995 to 385.08 km2 in 2015. However, constructed land increased significantly, from 43.28 km2 in 1995 to 73.28 km2 in 2015. This construction land came mainly from agriculture (13.6% of constructed land in 2015), shrubland (13.1% of constructed land in 2015), and grassland (12.6% of constructed land in 2015). The area of forest expanded slightly, mainly at the expense of grassland (3.21 km2) and agriculture (2.52 km2).
In correlation analysis, urbanization rate showed more a significant correlation with land use change than with GDP, industrial development, extensive livestock, or other factors (Table S1; n = 5, p < 0.01). This shows that urbanization was the key driving factor exerting the greatest impact on land use changes from 1995 to 2019 in DLB.

3.2. Ecosystem Services in DLB

In the whole DLB, the overall quantity of water yield and soil retention increased from 1995 to 2015, while the quantity of nitrogen export and carbon storage decreased. Water yield rose from 0.73 × 10⁹ m3 in 1995 to 0.78 × 10⁹ m3 in 2015, and soil retention from 31.119 × 10⁶ t in 1995 to 31.125 × 10⁶ t in 2015. Meanwhile carbon storage declined from 13.29 × 10⁶ t in 1995 to 13.22 × 10⁶ t in 2015, and nitrogen export from 1980.42 t in 1995 to 1974.85 t in 2015.
The lakeside area displayed a similar trend in ESs variation to the whole DLB, with increasing water yield and soil retention, and decreasing carbon storage and nitrogen export. Specifically, water yield increased from 2.81 × 10⁹ m3 in 1995 to 3.19 × 10⁹ m3 in 2015, and soil retention from 26.88 × 10⁶ t in 1995 to 26.93 × 10⁶ t in 2015. Nitrogen export in the lakeside area decreased from 904.20 t in 1995 to 735.92 t in 2015, and carbon storage from 185.27 × 10⁶ t in 1995 to 174.58 × 10⁶ t in 2015.
The trend in ESs variation in the mountainous area differed slightly from that in the whole DLB and lakeside area, with increasing water yield, soil retention, and carbon storage, and decreasing nitrogen export. Specifically, water yield increased from 4.58 × 10⁹ m3 in 1995 to 4.69 × 10⁹ m3 in 2015, soil retention from 284,322.02 kiloton in 1995 to 284,327.87 kiloton in 2015, and carbon storage from 1144.22 × 106 t in 1995 to 1144.86 × 106 t in 2015. Nitrogen exports decreased from 1076.22 t in 1995 to 1058.91 t in 2015.
In spatial terms, high-provision areas for carbon storage and soil retention were mostly distributed at the periphery of DLB, especially in the mountainous area, while high-provision areas for nitrogen export and water yield were mostly distributed in the middle of DLB, particularly the lakeside area (Figure 4). The spatial variation in carbon storage, water yield, and nitrogen export mainly occurred in northern and eastern parts of lakeside area, and that in soil retention on eastern and northeastern hillsides of the mountainous area near the lakeside area (Figure 5). Thus, it can be concluded that the spatial-temporal changes in ESs in DLB have mainly been caused by land use changes, dominated by urbanization in the lakeside area.

3.3. Tradeoffs between ESs

At the scale of the whole DLB, correlations between the ESs were investigated by Pearson correlation test (Table 2; df = 998). Carbon storage showed a highly significant positive correlation with soil retention (p < 0.01), and a highly significant negative correlation with water yield and nitrogen export (p < 0.01), in both 2015 and 1995. Water yield displayed a highly significant positive correlation with nitrogen export in both 1995 and 2015 (p < 0.01), and a highly significant negative correlation (p < 0.01) with soil retention in 2015 and a significant negative correlation (p < 0.05) with soil retention in 1995. Soil retention showed a non-significant correlation with nitrogen export in both 1995 and 2015 (p > 0.05). The trends in the mountainous area generally resembled those in the whole DLB.
In the lakeside area, the correlations between the ESs displayed quite different tendencies (Table 2; df = 498). Carbon storage showed a very highly significant positive correlation (p < 0.01) with nitrogen export and water yield, and a highly significant positive correlation (p < 0.01) with soil retention, in both 1995 and 2015. Water yield displayed a highly significant positive correlation with soil retention in both 1995 and 2015 (p < 0.01), and a highly significant positive correlation with nitrogen export in 1995 (p < 0.01), but only a significant positive correlation in 2015 (p < 0.05). Soil retention showed a significant correlation with nitrogen export in 1995 (p < 0.05), but a non-significant correlation in 2015 (p > 0.05).
There were tradeoffs between urbanization and ESs in DLB (Figure 6). Urbanization rate increased rapidly, from 36.7% in 1995 to 70.1% in 2015. With this great increase in urbanization rate, the amount and distribution of ESs also changed clearly in the opposite direction in the whole DLB, and especially in the lakeside area. There were only slight variations in carbon storage and soil retention, while nitrogen export was reduced and water yield was higher in 2015 than in 1995 (Figure 6).

4. Discussion

4.1. Impact of Urbanization on ESs

Urbanization is an inevitable worldwide trend in global socio-economic development and plays an irreplaceable role in improving quality of life and urban civilization [46]. Unfortunately, accelerating global urbanization is also having real and potential negative effects and posing threats to the surrounding ecological environment. Consequently, coordinating and balancing urbanization with ecosystem health is increasingly becoming a pressing global strategic issue for academics and for decision-makers in government [47]. However, previous research has concentrated mainly on assessing changes in ESs in term of biophysical parameters and monetization, based on historical (previous) land use change or future land use scenarios. Effective approaches to ensure sound urban planning and land use management decisions and policy must be based on in-depth knowledge of the mechanisms and dynamics of ESP variations in response to urban land use changes.
Taking DLB as a case study and using the novel methodology of integrating InVEST models with socio-economic data, this study revealed that the type, amount, and degree of land use changes in DLB varied markedly from 1995 to 2015, particularly in the lakeside area. In both the lakeside area and whole DLB, only constructed land increased from 1995 to 2015, while all the other land use types decreased (Tables S6 and S7). The mountainous area experienced an increase in grassland area, but also a slight increase in forest and shrubland in 1995–2015 (mainly due to implementation of the Grain for Green Project and Natural Forest Protection Project). Surprisingly, in the mountainous area, lakeside area, and whole DLB, there was a sharp decrease in agricultural land. The lakeside area and whole DLB both experienced a significant reduction in forest and shrubland, all of which mostly became constructed land. Urbanization was confirmed to be the most influential factor in land use quantity and distribution changes in DLB, rather than other factors, such as population growth, economic growth, industrialization, and livestock and poultry breeding. The rapid and large-scale urbanization resulted in a net increase of 139.05 km2 in constructed land, mainly at the cost of agricultural land, forest, shrubland, and grassland. Urbanization was the dominant land use change in both the lakeside area and whole DLB. Constructed land in DLB is mostly distributed along the north and east side of Dianchi Lake, on available land with the best geological conditions, topographic gradient, drainage conditions, water source, wind direction, natural landscape, and other convenient conditions for urban construction. Construction on this land has significantly increased with the demand caused by urbanization since the 1990s. In DLB, the contradiction between supply and demand for land resources is becoming increasingly acute, but the productivity level and intensity of land use are not high, large areas of land are being overexploited, the structure and distribution of land use are unreasonable, and planning control is difficult [48].
Land use changes in DLB derived from urbanization, and obviously involved conversion of land formerly under agriculture, forest, shrub, and grass into built-up area. This decreased the regional ecological water volume and carbon storage in the whole DLB during the study period, but with only slight variations in nitrogen export and soil retention. The lakeside area, besides these variations, also experienced a sharper reduction in carbon storage, mainly due to diminished forest area since the 1990s, which caused an overall reduction in the total carbon sink in the whole DLB. In the mountainous area, carbon storage increased over the study period (Figure 6). Soil retention in both the mountainous area and lakeside area displayed a slight increasing tendency over the study period.
Tradeoffs between urbanization and ESs were also identified. In the mountainous area and the whole DLB, the strongest correlations were mainly between urbanization and nitrogen export and soil retention. In the lakeside area, the primary tradeoffs were mainly between urbanization and carbon storage, soil retention, and nitrogen export (Figure 6). Although water yield increased, the regional ecological water volume of the whole DLB decreased with increasing regional surface runoff caused by the growing impervious surface area accompanying the increase in constructed land in the lakeside area [49]. With the increased surface runoff flowing into Dianchi Lake, more pollutants are being carried into the lake, particularly from the lakeside area, increasing the water pollution burden of Dianchi Lake. Total ESP in DLB from 1995 to 2015 was demonstrated to be severely impacted by sprawl of constructed land deriving from urbanization, confirming previous findings [22,50].

4.2. Implications of ESs Optimization and Management

Dianchi Lake Basin is a typical example of a lake basin transforming under economic development and population pressure, and increasingly experiencing ecological pressure and even ecological deterioration. Governments at all levels in China are confronted with various difficulties in protecting Dianchi Lake and surrounding ecosystems, and the other similar areas with rapid urbanization, and effective policies and measures are urgently needed. The current urbanization in DLB has problems such as incomplete planning system, imperfect basic functional facilities, heavy pressure on resources and environment, unreasonable structure and layout of land use, and low level and intensity of land use productivity. Considering the noticeable impacts of ULUC on the regional integrated ESP in DLB, three major suggestions can be made to improve decision making on ESs maintenance, land use administration, urban planning, and territorial space control.
First, since urbanization is an inevitable trend and the primary mode of global economic and social development, it should take a sustainable path, namely sustainable urbanization [51]. In top-level planning by government, ESP in DLB should be considered the most important ecological factor. Therefore, more severe constraints should be imposed on urban planning and land use, so as to control the urban scale. Specifically, ecological principles and ESP should be taken into consideration in promoting and optimizing sustainable strategic land use management and city planning [52,53], especially for urban land use. In addition, it is critical to optimize the economic benefits and intensity of land use. The increase in construction land should be controlled, especially the total constructed land area, and the annual amount of new construction land should be strictly monitored. The local government should increase the clearance and disposal of abandoned land, fully revitalize existing urban construction land, strengthen the management of rural homesteads, strictly control the scale of development zones, and make full use of its economic leverage.
Second, the current ecological environmental programs that protect forest, cropland, shrubland, and grassland, especially the Returning Cropland to Lake and Grain to Green Project planned to end in 2020, should be prolonged and extended to 2030 and beyond. These programs and projects clearly play a vital role and have contributed to improving the carbon sink and other ESs (e.g., water quantity adjustment and purification, biodiversity, etc.), and could continue to serve well over a long period. In addition, local governments should formulate and implement responsive protection policies according to the needs for ecosystem protection in DLB. A set of effective, scientific, systemic, and normative mechanisms to monitor, reward, and punish changes in ecosystem services should be established as soon as possible [27]. This should include a long-term ecosystem and environment change monitoring system (ECM), with the main role of timely monitoring and understanding changes in ecosystem and environmental conditions at temporal and spatial scale. Local government should have the responsibility for establishing a reward-punishment system (RPS) to ensure reasonable and sound tradeoffs between urbanization and ESs, by setting strict thresholds for the environmental capacity baseline, pollutant emission limits, environmental quality baseline, resource utilization ceiling, ecological environment access list, ecological protection boundary, and ecological protection red line. Based on the above rules and criteria, local government could legally punish or reward stakeholders (businesses, individuals, government departments) found to damage or protect the regional ecosystem and ESs according to the monitoring results of EMC.
Third, regional ecological restoration should be actively carried out. For areas under ecological protection and restoration in DLB, afforestation, conversion of agriculture to forest, and renovation of low-efficiency forest should be carried out in a planned and targeted way, so as to restore vegetation and reduce landslides and soil erosion. For water source protection areas, ecological protection areas and natural parks should be established in selected areas. Protection of the water conservation area for Dianchi Lake is needed, by controlling soil erosion and restoring damaged ecosystems. In the Dianchi lakeside ecological function protection zone, measures in the Four Retreats and Three Restoration Program have been implemented to gradually restore the lakeside ecological wetland and protect the Dianchi lake water environment and lakeside wetland system [54]. In addition, we suggest establishing ecological buffer strips for high-density urbanized area, which could effectively reduce surface runoff, decrease soil and nitrogen exports, increase landscape connectivity, and enhance biodiversity [55]. A 100 m wide buffer strip can effectively improve water quality, reducing soil export by 9.6% and nitrogen export by 4.9% compared with areas without buffer strips [56]. Ecological buffer strips are especially recommended around high-density urbanized areas in DLB, to alleviate and reduce non-point source pollution from these areas. Efforts should be intensified to promote construction of sunken green space and permeable pavement in the urban area of the basin, and facilities should be established for initial rainwater interception and treatment, so as to control pollution caused by urban rainwater.

4.3. Innovation and Limitations

The innovative value of this study lies in the presentation of empirical evidence that urbanization exerts noticeable impacts on urban land use in a regional landscape like DLB, resulting in variations in ESs through decreasing carbon storage and regional ecological water volume, and deteriorating water environment quality. Building on these observations, corresponding countermeasures are proposed. This provides important theoretical guidance and a technical basis for ecological protection, urban planning, strategic land use management, and territorial space control in DLB.
However, the study also has some limitations, which should be considered in future studies so as to further clarify the mechanism and optimize the methodology in the field. (i) The pressure-driver-response path by which urbanization drives urban land use changes, resulting in ESs variations, was not fully analyzed here. Future work is needed on how to simulate the impacts on the carbon cycle of conversion from agricultural land and other non-forest types to forest. A comprehensive database on long-term and spatial-temporal dynamics of socio-ecological factors should be established for this purpose [55]. Additionally, the legacy effects of environmental change on ESs should be taken into consideration, such as the effects of the continuity of ecosystem variables on agricultural land carbon storage and soil nitrogen content. (ii) This study only considered water yield, carbon storage, nitrogen export, and soil retention, but urbanization can also influence other ESs not taken into consideration here, e.g., regional capacity for biodiversity maintenance, climate regulation, and pollination. In addition, assessments of ESs impacted by urban land use changes dominated by urbanization were only quantified at the scale of the whole DLB, while ESP with urbanization along urban gradients was not quantified. (iii) The influence of potential future uncertain scenarios on ESs demand, selection of indicators used to quantify ESs demand for further urbanization, and the methodology used to balance provision and demand for ESs need further study. More meteorological factors (such as temperature, atmospheric radiation, wind speed, evaporation) and annual dynamic factors (such as annual precipitation, plant growth, nitrogen absorption, and hydrological flux) should be included in the model, so as to further enhance the accuracy and precision. Due to lack of data in this research area, we were unable to carry out data verification for more years. Although the model and the simulated results were credible and reliable when compared against previous findings in scientific studies [20,56,57], actual measured data should be used to verify the model in future, so as to reduce the uncertainty of the simulation results.

5. Conclusions

This study refined and optimized existing methodology by integrating the simulation capacity of InVEST models with socio-economic data in a combined analysis. The combined approach was used to conduct a series of comprehensive evaluations of the impact of ULUC on ESs and to identify tradeoffs between urbanization and ESP in DLB from 1995–2015. The results revealed that construction land increased substantially in the period and was the main factor in land use changes, resulting in great changes in the amount and distribution of ESs in DLB, particularly within the lakeside area. Although water yield increased over the period, the ecological water volume decreased due to increasing regional surface runoff. This runoff carried more pollutants into Dianchi Lake, resulting in deterioration of water quality and causing ecological and environmental issues in DLB. Carbon storage in the whole basin decreased sharply during the study period. Urbanization was identified as the driving factor exerting the greatest impact on regional land use changes, and ultimately resulted in temporal-spatial changes in ESs in DLB.
Despite methodological limitations and some unavoidable assumptions, the results can be used to formulate temporal-spatial explicit guidance for decision-making on ecological conservation, urban planning, land use, and natural resources management. DLB should follow a sustainable path of urbanization, ESP and demand in the basin should be considered in top-level decision-making by government, and effective environmental monitoring and reward-punishment systems should be established. Stakeholders, in particular local government and local businesses have the responsibility and obligation to reinforce current ecological environmental programs and to achieve the best use of the available land. Regional ecological restoration should be actively carried out, and buffer strips (especially for high-density urbanized area) should be established during future urbanization.

Supplementary Materials

The following are available online at https://www.mdpi.com/article/10.3390/su13094813/s1, Figure S1: Changes in urbanization rate and water quality (represented by total nitrogen content) in Dianchi Lake Basin, 1992–2015, Table S1: Results of power regression analysis of built-up area (dependent variable) and potential influencing factors (independent variable); Section S1: Justification of the Selected Ecosystem Services, Section S2: InVEST Models, Section S3: InVEST Parameterization.

Author Contributions

Conceptualization, R.W.; formal analysis, R.W.; investigation, Z.Y. (Zongbao Yang) and W.Y.; project administration, X.X.; resources, Y.B.; supervision, Y.B.; visualization, Z.Y. (Zhangqian Yang); writing original draft, R.W.; writing, review and editing, X.X., Y.B. and J.M.A. All authors have read and agreed to the published version of the manuscript.

Funding

This study was supported by West Light Talent Program (Grant No. Y9XB011B01) and Key Research Program of Frontier Sciences of the Chinese Academy of Sciences (Grant No. ZDBS-LY-7011); J.M.A. was supported by Qatar Petroleum.

Acknowledgments

Thanks to the Data Center for Resources and Environmental Sciences, Chinese Academy of Sciences for providing land use data, DEM data, and land use layers with 30 m spatial resolution.

Conflicts of Interest

The authors declare no conflict of interest.

References

  1. Millennium Ecosystem Assessment. Millennium Ecosystem Assessment Synthesis Report; Island Press: Washington, DC, USA, 2005. [Google Scholar]
  2. Costanza, R.; Rudolf, R.D.A.; Limburg, K.; Naeem, S.; O’neill, R.V.; Paruelo, J.; Raskin, R.G. The value of the world’s ecosystem services and natural capital. Nature 1997, 387, 253–260. [Google Scholar] [CrossRef]
  3. Daily, G.C.; Matson, P.A. Ecosystem Services: From Theory to Implementation. Proc. Natl. Acad. Sci. USA 2008, 105, 9455–9456. [Google Scholar] [CrossRef] [PubMed] [Green Version]
  4. Wong, C.P.; Jiang, B.; Kinzig, A.P.; Lee, K.N.; Ouyang, Z. Linking ecosystem characteristics to final ecosystem services for public policy. Ecol. Lett. 2015, 18, 108–118. [Google Scholar] [CrossRef] [PubMed] [Green Version]
  5. TEEB. The Economics of Ecosystems and Biodiversity: Ecological and Economic Foundations; Kumar, P., Ed.; Earthscan: London, UK; Washington, DC, USA, 2010. [Google Scholar]
  6. De Groot, R.; Brander, L.; van der Ploeg, S.; Costanza, R.; Bernard, F.; Braat, L.; Christie, M.; Crossman, N.; Ghermandi, A.; Hein, L.; et al. Global estimates of the value of ecosystems and their services in monetary units. Ecosyst. Serv. 2012, 1, 50–61. [Google Scholar]
  7. Costanza, R.; de Groot, R.; Sutton, P.; van der Ploeg, S.; Anderson, S.J.; Kubiszewski, I.; Farber, S.; Turner, R.K. Changes in the global value of ecosystem services. Glob. Environ. Chang. 2014, 26, 152–158. [Google Scholar] [CrossRef]
  8. Fu, B.; Zhang, L.; Xu, Z.; Zhao, Y.; Wei, Y.; Skinner, D. Ecosystem services in changing land use. J. Soil Sediment 2015, 15, 833–843. [Google Scholar]
  9. Gaglio, M.; Aschonitis, V.G.; Mancuso, M.M.; Reyes Puig, J.P.; Moscoso, F.; Castaldelli, G.; Fano, E.A. Changes in land use and ecosystem services in tropical forest areas: A case study in Andes mountains of Ecuador. Int. J. Biodivers. Sci. Ecosyst. Serv. Manag. 2017, 13, 264–279. [Google Scholar]
  10. Łowicki, D.; Walz, U. Gradient of Land Cover and Ecosystem Service Supply Capacities- A Comparison of Suburban and Rural Fringes of Towns Dresden (Germany) and Poznan (Poland). Procedia Earth Planet. Sci. 2015, 15, 495–501. [Google Scholar] [CrossRef] [Green Version]
  11. Kroll, F.; Müller, F.; Haase, D.; Fohrer, N. Rural–urban gradient analysis of ecosystem services supply and demand dynamics. Land Use Policy 2012, 29, 521–535. [Google Scholar]
  12. Larondelle, N.; Haase, D. Urban ecosystem services assessment along a rural–urban gradient: A cross-analysis of European cities. Ecol. Indic. 2013, 29, 179–190. [Google Scholar] [CrossRef]
  13. Bateman, I.J.; Brouwer, R.; Ferrini, S.; Schaafsma, M.; Barton, D.N.; Dubgaard, A.; Hasler, B.; Hime, S.; Liekens, I.; Navrud, S.; et al. Making Benefit Transfers Work: Deriving and Testing Principles for Value Transfers for Similar and Dissimilar Sites Using a Case Study of the Non-Market Benefits of Water Quality Improvements Across Europe. Environ. Resour. Econ. 2011, 50, 365–387. [Google Scholar]
  14. Honey-Rosés, J.; Pendleton, L.H. A demand driven research agenda for ecosystem services. Ecosyst. Serv. 2013, 5, 160–162. [Google Scholar] [CrossRef]
  15. Satterthwaite, D.; McGranahan, G.; Tacoli, C. Urbanization and its implications for food and farming. Philos. Trans. R. Soc. B Biol. Sci. 2010, 365, 2809–2820. [Google Scholar] [CrossRef] [PubMed]
  16. Tolessa, T.; Senbeta, F.; Kidane, M. The impact of land use/land cover change on ecosystem services in the central highlands of Ethiopia. Ecosyst. Serv. 2017, 23, 47–54. [Google Scholar]
  17. Bai, Y.; Wong, C.P.; Jiang, B.; Hughes, A.C.; Wang, M.; Wang, Q. Developing China’s Ecological Redline Policy using ecosystem services assessments for land use planning. Nat. Commun. 2018, 9, 1–13. [Google Scholar]
  18. Fiquepron, J.; Garcia, S.; Stenger, A. Land use impact on water quality: Valuing forest services in terms of the water supply sector. J. Environ. Manag. 2013, 126, 113–121. [Google Scholar] [CrossRef]
  19. Song, W.; Deng, X. Land-use/land-cover change and ecosystem service provision in China. Sci. Total Environ. 2017, 576, 705–719. [Google Scholar] [PubMed]
  20. Huang, A.; Xu, Y.; Sun, P.; Zhou, G.; Liu, C.; Lu, L.; Xiang, Y.; Wang, H. Land use/land cover changes and its impact on ecosystem services in ecologically fragile zone: A case study of Zhangjiakou City, Hebei Province, China. Ecol. Indic. 2019, 104, 604–614. [Google Scholar]
  21. Huang, D.; Huang, J.; Liu, T. Delimiting urban growth boundaries using the CLUE-S model with village administrative boundaries. Land Use Policy 2019, 82, 422–435. [Google Scholar]
  22. Kindu, M.; Schneider, T.; Teketay, D.; Knoke, T. Changes of ecosystem service values in response to land use/land cover dynamics in Munessa–Shashemene landscape of the Ethiopian highlands. Sci. Total Environ. 2016, 547, 137–147. [Google Scholar] [CrossRef] [PubMed]
  23. Bai, Y.; Ochuodho, T.O.; Yang, J. Impact of land use and climate change on water-related ecosystem services in Kentucky, USA. Ecol. Indic. 2019, 102, 51–64. [Google Scholar] [CrossRef]
  24. Xu, X.; Yang, G.; Tan, Y.; Tang, X.; Jiang, H.; Sun, X.; Zhuang, Q.; Li, H. Impacts of land use changes on net ecosystem production in the Taihu Lake Basin of China from 1985 to 2010. J. Geophys. Res. Biogeosci. 2017, 122, 690–707. [Google Scholar]
  25. Zhang, Z.; Liu, F.; Zhao, X.; Wang, X.; Shi, L.; Xu, J.; Yu, S.; Wen, Q.; Zuo, L.; Yi, L.; et al. Urban Expansion in China Based on Remote Sensing Technology: A Review. Chin. Geogr. Sci. 2018, 28, 727–743. [Google Scholar]
  26. Xie, H.; Zhang, Y.; Duan, K. Evolutionary overview of urban expansion based on bibliometric analysis in Web of Science from 1990 to 2019. Habitat Int. 2020, 95, 102100. [Google Scholar]
  27. Bai, Y.; Jiang, B.; Wang, M.; Li, H.; Alatalo, J.M.; Huang, S. New ecological redline policy (ERP) to secure ecosystem services in China. Land Use Policy 2016, 55, 348–351. [Google Scholar] [CrossRef] [Green Version]
  28. Mendoza-González, G.; Martínez, M.L.; Lithgow, D.; Pérez-Maqueo, O.; Simonin, P. Land use change and its effects on the value of ecosystem services along the coast of the Gulf of Mexico. Ecol. Econ. 2012, 82, 23–32. [Google Scholar]
  29. Zhang, E.; Peng, S.; Feng, H. Evaluation of soil erosion sensitivity and its spatial pattern evolution in Dianchi Lake Basin based on GIS and RUSLE. J. Soil Water Conserv. 2020, 34, 115–122. [Google Scholar]
  30. Zhang, H.; Lei, D.; Li, H.; Chen, Z. Analysis of the relationship between the landscape pattern of construction land and the water quality of Dianchi Lake basin. Water Soil Conserv. Bull. 2013, 33, 103–107. [Google Scholar]
  31. Peng, S. Evolution of Impermeable Surface Pattern and Its Correlation with Soil Erosion in Dianchi Basin under the Background of Rapid Urbanization. Ph.D. Thesis, Yunnan Normal University, Kunming, China, 2016; p. 150. [Google Scholar]
  32. Lv, Y.; Wu, L.; Ye, W.; Hao, X.; Tang, J. Variation trend, Abrupt change and Periodic Analysis of precipitation in Dianchi Lake Basin in recent 60 years. J. Kunming Univ. Sci. Technol. 2016, 41, 33–44. [Google Scholar]
  33. Pan, M.; Gao, L. The influence of social and economic development on the change of water quality in Dianchi Lake Basin. Chin. Eng. Sci. 2010, 12, 117–122. [Google Scholar]
  34. Huang, C.; Yao, L.; Zhang, Y.; Huang, T.; Zhang, M.; Zhu, A.; Yang, H. Spatial and temporal variation in autochthonous and allochthonous contributors to increased organic carbon and nitrogen burial in a plateau lake. Sci. Total Environ. 2017, 603–604, 390–400. [Google Scholar]
  35. He, J.; Zhang, Y.; Wu, X.; Yang, Y.; Xu, X.; Zheng, B.; Deng, W.; Shao, Z.; Lu, L.; Wang, L.; et al. A study on the relationship between metabolism of Cyanobacteria and chemical oxygen demand in Dianchi Lake, China. Water Environ. Res. 2019, 91, 1650–1660. [Google Scholar] [CrossRef]
  36. Haines-Young, R.; Potschin, M.; Kienast, F. Indicators of ecosystem service potential at European scales: Mapping marginal changes and trade-offs. Ecol. Indic. 2012, 21, 39–53. [Google Scholar]
  37. Sharp, R.; Tallis, H.T.; Ricketts, T.; Guerry, A.D.; Wood, S.A.; Chaplin-Kramer, R.; Nelson, E.; Ennaanay, D.; Wolny, S.; Olwero, N.; et al. InVEST +VERSION+ User’s Guide; The Natural Capital Project; Stanford University: Stanford, CA, USA, 2016. [Google Scholar]
  38. Redhead, J.W.; May, L.; Oliver, T.H.; Hamel, P.; Sharp, R.; Bullock, J.M. National scale evaluation of the InVEST nutrient retention model in the United Kingdom. Sci. Total Environ. 2018, 610–611, 666–677. [Google Scholar]
  39. Cao, Y.; Yi, Q.; Wang, J.; Dou, X.; Chai, S.; Zhang, L. The potential and spatial and temporal distribution characteristics of rainwater resources in the Dianchi Lake Basin. J. Water Resour. Water Eng. 2016, 27, 60–66. [Google Scholar]
  40. Gong, X. The Study of Ecological Assets Evaluation and Ecological Compensation in the Dianchi Basin. Master’s Thesis, Yunnan University, Kunming, China, 2018. [Google Scholar]
  41. Li, W.; He, J.; Xu, X.; Zheng, Y.; Li, Y.; Chen, Y.; Dawei, Z.; Zhang, L.; Wang, L. Quantitative study on urban rainfall runoff pollution Load in Dianchi Basin. Environ. Monit. Manag. Technol. 2011, 23, 37–42. [Google Scholar]
  42. Li, J.; Gong, X.; Zhang, Y.; Duan, C.; Gao, W. Evaluation of forest ecosystem carbon sequestration and oxygen Release service in Dianchi Basin. J. Yunnan Univ. 2019, 41, 629–663. [Google Scholar]
  43. Daily, G.C.; Polasky, S.; Goldstein, J.; Kareiva, P.M.; Mooney, H.A.; Pejchar, L.; Ricketts, T.H.; Salzman, J.; Shallenberger, R. Ecosystem services in decision making: Time to deliver. Front. Ecol. Environ. 2009, 7, 21–28. [Google Scholar]
  44. Kalumba, A.M.; Olwocha, J.M.; Van Aardt, I.; Adeola, A.M.; Malahlela, O.; Nsubugaa, F.W.N. Assessing Industrial Development Influence on Land use/Cover Drivers and Change Detection for West Bank East London, South Africa. Int. J. Appl. Eng. Res. 2018, 14, 11609–11624. [Google Scholar]
  45. Kamwi, J.; Cho, M.; Kaetsch, C.; Manda, S.; Graz, F.; Chirwa, P. Assessing the Spatial Drivers of Land Use and Land Cover Change in the Protected and Communal Areas of the Zambezi Region, Namibia. Land 2018, 7, 131. [Google Scholar] [CrossRef] [Green Version]
  46. Zhang, Y.; Xie, A.H. Interactive Relationship among Urban Expansion, Economic Development, and Population Growth since the Reform and Opening up in China: An Analysis Based on a Vector Error Correction Model. Land 2019, 8, 153. [Google Scholar] [CrossRef] [Green Version]
  47. McPhearson, T.; Hamstead, Z.A.; Kremer, P.; Haase, D.; Frantzeskaki, N.; Elmqvist, T. Urban Ecosystem Services for Resilience Planning and Management in New York City. Ambio 2014, 43, 502–515. [Google Scholar]
  48. Hai-lin, L.; Hong, Z.; Jie, J. Study on the Urbanization Process of Kunming City and Its Impact on the Water Environment of Dianchi Lake. Meteorol. Environ. Res. 2012, 3, 28–31. [Google Scholar]
  49. Wang, S.; Guo, S.; He, Q.; Yan, W.; Song, L. Water quality characteristics of stormwater runoff and the first flush effect in urban regions. Res. Environ. Sci. 2015, 28, 532–539. [Google Scholar]
  50. Zhao, W.; Zhu, X.; Sun, X.; Shu, Y.; Li, Y. Water quality changes in response to urban expansion: Spatially varying relations and determinants. Environ. Sci. Pollut. Res. 2015, 22, 16997–17011. [Google Scholar]
  51. Shaker, R.R. The well-being of nations: An empirical assessment of sustainable urbanization for Europe. Int. J. Sustain. Dev. World Ecol. 2015, 22, 375–387. [Google Scholar]
  52. Wolff, S.; Schulp, C.J.E.; Verburg, P.H. Mapping ecosystem services demand: A review of current research and future perspectives. Ecol. Indic. 2015, 55, 159–171. [Google Scholar]
  53. Shaker, R.R. Examining sustainable landscape function across the Republic of Moldova. Habitat Int. 2018, 72, 77–91. [Google Scholar]
  54. Kunming Dianchi Lake Administration Bureau. Three-Year Action Plan for the Protection and Governance of Dianchi Lake (2018–2020); Kunming Dianchi Lake Administration Bureau: Kunming, China, 2018. Available online: http://dgj.km.gov.cn/c/2020-07-28/3615885.shtml (accessed on 15 April 2021).
  55. Ouyang, Z.; Zheng, H.; Xiao, Y.; Polasky, S.; Liu, J.; Xu, W.; Wang, Q.; Zhang, L.; Xiao, Y.; Rao, E.; et al. Improvements in ecosystem services from investments in natural capital. Science 2016, 352, 1455–1459. [Google Scholar] [CrossRef] [PubMed]
  56. Gao, J.; Li, F.; Gao, H.; Zhou, C.; Zhang, X. The impact of land-use change on water-related ecosystem services: A study of the Guishui River Basin, Beijing, China. J. Clean. Prod. 2017, 163, S148–S155. [Google Scholar] [CrossRef]
  57. Jiang, W.; Deng, Y.; Tang, Z.; Lei, X.; Chen, Z. Modelling the potential impacts of urban ecosystem changes on carbon storage under different scenarios by linking the CLUE-S and the InVEST models. Ecol. Model. 2017, 345, 30–40. [Google Scholar] [CrossRef]
Figure 1. Location and composition of Dianchi Lake Basin (DLB) in Southwest China.
Sustainability 13 04813 g001
Figure 2. Flow chart of the methodology used in the present study.
Sustainability 13 04813 g002
Figure 3. Spatial distribution of land use classes and changes in Dianchi Lake Basin (DLB) between 1995 and 2015.
Sustainability 13 04813 g003
Figure 4. Spatial distribution of four major ecosystem services in Dianchi Lake Basin (DLB) in 1995 (upper diagrams) and 2015 (lower diagrams).
Sustainability 13 04813 g004
Figure 5. Spatial changes in four major ecosystem services in Dianchi Lake Basin (DLB) from 1995 to 2015.
Sustainability 13 04813 g005
Figure 6. Tradeoffs between urbanization and ecosystem services (ESs) in Dianchi Lake Basin (DLB).
Sustainability 13 04813 g006
Table 1. Land use transfer matrix from 1995 to 2015 in Dianchi Lake Basin (DLB).
Area (km2)Land Type (km2)
GrassShrubConstructedAgricultureForestOpen WaterTotal
Whole DLB, 1995Grass528.981.1333.992.383.220.09569.78
Grass0.76486.9611.310.490.28499.80
Constructed0.23273.500.050.080.04273.89
Agriculture1.7987.96631.192.870.16723.97
Forest0.072.290.13509.020.04511.55
Open water3.890.03339.58343.50
Total531.83488.08412.94634.24515.50339.902922.50
Lakeside area, 1995Grass41.440.0224.730.030.010.0066.23
Shrub0.018.941.730.150.0010.84
Constructed0.20230.300.040.080.00230.62
Agriculture1.2278.00248.930.350.16328.66
Forest0.965.626.59
Open water3.850.03318.83322.71
Total42.888.96339.57249.156.09319.00965.65
Mountainous area, 1995Grass487.541.119.252.353.210.09503.55
Shrub0.75478.019.580.340.28488.96
Constructed0.0343.200.01 0.0443.28
Agriculture0.579.96382.262.52395.31
Forest0.071.330.13503.400.04504.97
Open water0.0420.7520.79
Total488.96479.1273.38385.08509.4120.901956.85
Table 2. Tradeoffs between ecosystem services in the lakeside area, mountainous area, and whole Dianchi Lake Basin (DLB).
Basin PartitionESsCarbon StorageWater Yield Soil Retention
Lakeside areaWater yield 0.463 **, a
0.433 **, b
Soil retention 0.210 **0.166 **
0.209 **0.168 **
Nitrogen export 0.443 **0.169 **0.103 *
0.419 **0.089 **0.1
Mountainous areaWater yield −0.610 **
−0.597 **
Soil retention 0.108 *−0.1
0.100 *−0.1
Nitrogen export −0.275 **0.403 **−0.1
−0.270 **0.348 **−0.1
Whole basinWater yield −0.281 **
−0.303 **
Soil retention 0.176 **−0.071 *
0.178 **−0.082 **
Nitrogen export −0.171 **0.272 **0.002
−0.159 **0.212 **0.013
a,b For each ecosystem service indicator, the upper value represents 1995 and the lower value represents 2015; * p < 0.05; ** p < 0.01 (n = 1000 in the whole DLB, n = 500 in lakeside area and mountainous area).
Publisher’s Note: MDPI stays neutral with regard to jurisdictional claims in published maps and institutional affiliations.

