Abstract
Cities around the world should prioritize the management of municipal solid waste (MSW). For this to be effective, there is a strong need to buildup a complex system that involves social, economic, and environmental processes, leading to a supply chain (SC). The actors involved in dealing with MSW—from suppliers, collectors, distributors, industries, and managers—should be engaged in strategic planning. This paper focuses on alternative energy solutions and uses existing SC models of managing MSW, as well as the existing literature, to identify successful stories in cities like Bergen and Tønsberg in Norway, London in UK and Barcelona in Spain and draw a conceptual framework for city officials in Romanian municipalities (but not only) to innovate—and convert MSW in biogas to be used in delivering public services, i.e., public transportation. The article shows that when the innovation is accepted and well implemented by all actors, the benefits for the citizens and the municipality are considerably higher than by using conventional methods of collecting and depositing MSW. The proposed approach is also relevant for implementing the EU environment policy, where delays are usually observed (as the case for Romania).
1. Introduction
Many countries have developed strategies targeting renewable energy sources for replacing fossil fuels and reducing greenhouse gas emissions in the past few decades. Global warming needs to be tackled by the entire international community: low- and high-income economies together. However, as expected, it is the latter taking steps to push environment concerns forward, for example, the establishment of the European Union (EU) Emissions Trading System in 2005, as well as the amendment of EU directive 2003/87/EC in 2009, by EU directive 2009/29/EC strengthened the incentives for using alternative energy sources [1].
In 2005, the Romanian government published a decision (1844/2005) on promoting using biofuels and other renewable fuels for transport [2]. According to it, biomass is defined as the biodegradable part of agricultural products, waste and residues, including plant and animal substances, forestry and related industries, and the biodegradable part of industrial and urban waste. Due to its worldwide availability—compared with the reserves of fossil fuels (natural gas, coal, oil) present in only a small number of countries, and by the fact that it is producing neutral CO2, biofuels obtained from biomass are globally getting more attention.
EU, which is seen as a global leader in reducing carbon dioxide emissions, established the Waste Framework Directive that introduced a five-level hierarchy starting with waste prevention and minimization, preparation for reuse, recycling, energy recovery and disposal [3]. By doing this, the EU, together with the Organization for Economic Cooperation and Development (OECD), was trying to raise awareness and increase the consciousness of all the actors involved in managing municipal solid waste (MSW). Despite this, however, the total amount of waste did not decrease significantly over the last ten years [4]. Moreover, landfilling still continues to be an important option for waste treatment [5,6]; therefore, efforts are needed to increase prevention and transform waste, making it a reliable option for alternative energy.
Waste prevention and minimization and its preparation for reuse are mandatory for a circular economy since they contribute to the general idea of waste reduction. After reviewing the research outlined in Sustainability (issues 2019–2021), Journal of Cleaner Production (issues 2019–2021), Waste Management and Research: the Journal for a Sustainable Circular Economy (issues 2019–2021) and Journal of Industrial Ecology Resources, Conservation and Recycling (issues 2019–2021), one can conclude that much of the focus is placed on prevention and little on the reuse process from collecting to transforming the waste into an alternative source of energy—waste to energy (WtE).
Policy interest in MSW is also growing, both internationally (Directive 2006/12/CE [7], Directive 2014/94/UE [8]), as well as nationally (Bucharest master plan for the integrated waste management system at the level of Bucharest municipality [9]), and citizens are starting to pay more attention to the environment [10,11]. MSW management is considered a strategic issue, often seen on the smart cities’ agenda [12,13]. In fact, most smart cities are building a supply chain (SC) that starts with the waste collection infrastructure, separation centers, waste processing technics and, a few, up to biogas conversion centers. However, despite a large amount of literature found on MSW management systems, converting waste to energy obtained from the biomass chain → biogas → electricity and/or heat receives little attention. This could be explained by the incumbent high costs and/or complexity of the logistical operations that may hinder scale implementation [14,15,16].
Biogas is a substance consisting of (bio)methane (CH4), around 50–70%, while the rest is mainly carbon dioxide (CO2) with very few other compounds like H2O (5–10%), N2 (0–3%), O2 (0–1%) [17]. It is obtained through the processes of fermentation or gasification of biomass in highly specialized centers, and it is considered alternative fuel because the carbon dioxide eliminated in the atmosphere by converting it comes from the carbon dioxide currently assimilated by plants during the vegetation period, respectively from animal feed [18]; according to the Kyoto protocol, this carbon dioxide is considered to be neutral because it is recirculated in a closed circuit, as opposed to the one from the burning of fossil fuels, a process that releases carbon dioxide that was assimilated in prehistoric times, is considered a contribution to the current state of the atmosphere [19].
This article focuses on the WtE concept, an idea that seems to become a viable option for cities of today. In doing so, it starts from the assumption that biogas has a special role to play in changing today’s energy supply patterns and then provides a critical analysis of present developments. More specifically, in Section 2, Section 2.1. European context presents the actual situation on the researched topic indicating the investments made until the end of 2020 on European soil and the reasons behind the not-so-big investments, followed by the current situation in Romania (Section 2.2) and supporting literature (Section 2.3). The argument proceeds with presenting the most commonly used technologies for converting WtE in Section 3—MSW energy production technologies. Further on, the author provides a framework for building up an SC needed to tackle the MSW, mapped on operational levels (Section 3.2—Municipal Solid Waste Supply Chains (MSWSCs)). Several interesting and up-to-date examples of European initiatives at the municipality level are presented in the Results section, as researchers along with practitioners need iconic models as examples to compare against other initiatives that are to be implemented. The critical synthesis of the most relevant particularities and/or ideas discussed in the article is presented in Section 5—Discussion. Finally, the last section presents the conclusions.
2. Background Information and Context
2.1. European Context
Renewable energy production started to be a topic for discussions back in 1972 in Stockholm due to the rising concerns on greenhouse gas (GHG) emissions. Since then, increasing discussions have aimed at developing strategies and governmental policies to stimulate the production and use of renewable energy all around the world [20,21].
Europe is leading the industry by producing nearly ¾ of the total biogas produced in the world [5], and this is mostly because biogas technologies are considered the key to reach the Renewable Energy Directive (RED) [22] and, at the same time, to meet the requirements of Directive 2006/12/CE; EU 2006 regarding organic waste management [7] and Directive 2014/94/UE; EU2014 on alternative fuels infrastructure [8].
According to the European Commission, waste prevention programs—which are mandatory for every member state, should include recycling as a process in developing a circular economy, which, again, contribute to the reduction of waste—and, by that, the circle is closed. Michelini et al. stated in 2017 that the circular economy paradigm is emphasizing the role of product-service systems as one of the most promising business models in this field [23], promoting take-back-centered systems as the most efficient way to recycle. Even though the previous hypotheses were already proven both by researchers and in practice, the potential has not been yet fully developed.
Recycling and associated processes of recovering energy contribute to creating self-sustaining production systems, and, in this context, waste is being recognized as a resource [24,25]. The total contribution of bio-energy (taking into consideration all potential resources like agricultural, animal residues, organic waste and, of course, wood) is as high as 1100 EJ (Exajoule; 1 EJ = 1018 J)—about two times and a half of the global use of energy as today [26,27]. Globally, one-third of food produced for meeting human needs is wasted—that is about 1.3 billion tons yearly [28]. Taking this information into account, there is a strong need to reinforce the potential of biomass by synthesizing earlier research on this topic.
However, a deep analysis of the related scientific literature shows that the investments into this field are not yet very attractive. The costs and complexity of the multilevel supply systems discourage investors from the energy field (detailed discussions about energy conversion centers in Section 3.2—Municipal Solid Waste Supply Chains (MSWSCs)); a situation that transcends the strategic level of decision-making process both at national and international level.
Identifying the location of MSW to biogas conversion facilities attracted the interest of several scholars. The current level of production and use of biogas around the world, given the short period since this industry emerged, shows a growing interest in developing WtE through biogas conversion plants with Europe and the United States leading [29]—according to the statistics made by European Biogas Association (EBA), in Europe only, the total number of biogas operating plants increased to 17,783 as of the end of 2017 (Figure 1 presents the European countries seen from developing the number of biogas plants). However, Asia has its own place due to the high number of anaerobic conversion plants used by individuals (domestic use) [29].
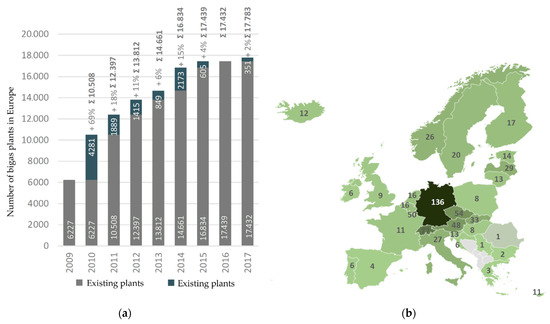
Figure 1.
Development of (a) the number of biogas plants in Europe, (b) per 1 million inhabitants. Image source: author’s adaptation after EBA 2019 [29].
Committed to reaching carbon neutrality by 2050, European countries made clear their interest in making biogas a central pillar of their future smart energy system [30].
Germany has been the driving force for many years with 10,971 plants, followed by Italy with 1655. The rest of the platoon starts with France (742), Switzerland (632) and United Kingdom (613), as shown in Figure 2 [29].
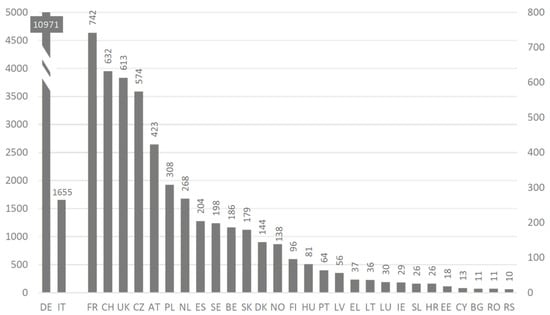
Figure 2.
Number of biogas plants in European countries. Image source: author’s adaptation after EBA 2019 [29].
Germany is leading from such a huge distance not only because of the volumes but also because of the policies that started to encourage citizens to buildup biofuel facilities since the 1970s—farmers were using liquid and solid manure as well as leftovers to generate electricity and heat for themselves. In 1991, the country adopted the feed-in tariff system (StrEG), which offered the citizens the chances to earn back some of the investments (from 6.5 euro cents per kWh up to 7.1 depending on the amount of electricity generated)—this, of course, together with the ease of accessing the programs, encouraged people even more to buildup biofuels facilities [31] (the number of biogas plants in Germany increased from roughly 100 up to 11,000 in thirty years).
Italy and the rest of the first platoon (France, Switzerland and United Kingdom), with a production of about ⅓ of Germany’s, is using the biogas mainly for electricity in the industry—therefore, there is not too much interest from the citizen side to develop facilities and, as it is known to date, the industry is still preferring fossil fuels [32].
In Denmark and Norway, on the other hand, the biogas plants have been primarily used for producing it in local towns, accounting, to date, about 10% of the volumes in the natural gas grid [33,34]. Moreover, Denmark is willing to quadruple its biogas production by 2050 [33], and Italy foresees an eight-time increased use of biogas (mostly produced by agricultural waste and MSW) by 2030—particularly in the heavy-duty transport industry [33].
However, among all these examples of countries, who embraced biogas technologies, there are few cities, which provide great examples of how municipalities are tackling the issue. According to the Global Methane Initiative (GMI) [35], the oldest European initiative in this regard belongs to Norway, the city of Bergen, and the most integrated into the local ecosystem is Tønsberg, also in Norway (their examples are presented later in this article). London in the United Kingdom is the largest capital city in Europe, which actively involved itself in waste management issues [36,37], and the author is considering it as being a very good example for the rest of large European cities. Spain is providing an interesting example of public–private partnership (PPP) for promoting the WtE initiatives by bringing Seat—the Spanish automobile manufacturer, as an investor into this industry [38,39].
2.2. Current Situation in Romania
Considering the available data about annual waste quantities and technologies to process it [40,41], Romania—situated in the lagger’s corner, as shown in Figure 2, is trying to buildup facilities meant to improve its position. In 2017 alone, approximately 4 million tons of MSW (about 200 kg of waste per capita) were generated; 3.44 million tons of them were treated traditionally (i.e., landfilling). To offer a complete picture, the total amount of waste generated in Romania is approximately 260 million tons per year, which includes municipal, industrial and hazardous waste. The cited statistics are providing figures that show an increased interest in recycling, composting and anaerobic digestion of MSW (from 0.4% in 2007 to 13.9% in 2017; aiming to reach 50% by 2025). In comparison, Norway, placed in the middle of the chart (Figure 2), is producing approximately 2.5 million tons of MSW yearly and manages to recycle (by composting and anaerobic digestion) about 39% of it, using the energy produced this way mostly for vehicles.
Bucharest, the Romanian capital city and also the biggest city in the country, hosting 9% [42] of the Romanian population, produces roughly 20% of the total waste generated at the national level [9]. To deal with this issue, around the city, there are three enormous waste disposal landfills facilities able to host around 550,000 tons of waste yearly [9]. The average recycling rate for all of them is about 10%, the rest being disposed of on landfills (88%) or incinerated (2%) [43,44].
While in Bucharest, the coverage of waste services is 100% [9], in the rest of the country, it is around 80%; national reports from the official environmental bodies indicate that the rest of 20% is illegally incinerated or disposed on unauthorized landfills [45]. Looking at the numbers and although this situation is seen as a threat, it is also an opportunity for investors that are willing to buildup WtE facilities. In this regard, the Bucharest municipality and other actors involved in environmental studies are looking for solutions. For the time being, the initiatives are rather modest, but using an evidence-based approach and replicating the existing facilities to a larger scale (further down, the article offers a schematic representation of the MSW facilities in use—Figure 3 and Figure 4), chances to reduce the existing quantities of waste by transforming it into biogas are increasing.
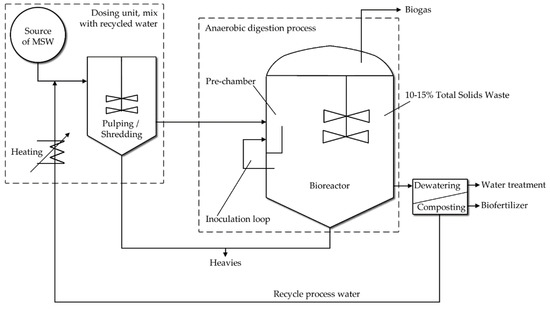
Figure 3.
Schematic representation of an MSW biogas conversion plant (wet system). Image source: author’s adaptation after Abbasi et al. [20].
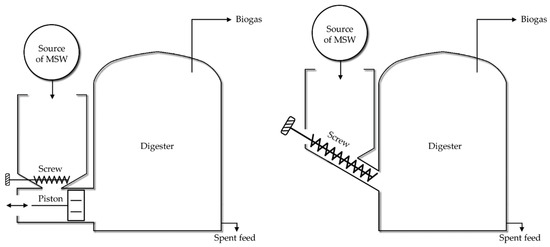
Figure 4.
Schematic representation of an MSW biogas conversion plant (dry fermentation). Left: a screw and piston system; Right: only screw system. Image source: author’s adaptation after Abbasi et al. [20].
As indicated by the data on the composition of waste provided by sanitation operators (Table 1), 78.4% of the total waste is biowaste, which makes it subject of transformation by using the available technologies (some presented in the next section, “MSW to biogas production technologies”).

Table 1.
MSW composition.
2.3. Related Works
As stated previously, few studies have investigated WtE through the biomass chain. Among these, Treichel et al. [36] researched innovation on Biogas Chain and provided some of the friendliest legal and administrative frameworks existing today, giving many examples of European (but not only) initiatives. Furthermore, Pfau et al. [46] focused on considering local needs and feedstock materials as being important to be taken into consideration when building policies that are aiming to stimulate the production and use of renewable energy.
Additionally, Scholwin [14] proposed some innovative and very promising technology for the production of biogas. Besides, Holm-Nielsen and Oleskowicz-Popiel [47] developed a mathematical process of modeling and optimization process control for biogas plants. Al Seadi et al. [48] After providing a complete list of categories of biomass appropriate as feedstocks for biogas production with all the important characteristics, designed the whole SCs for a future biogas plant. Similarly, Bachmann [15] used engineering and mathematical models to buildup biogas facilities. The author focused on achieving an efficient plant installation model that allows optimal use of biomass resources.
Moreover, Beil and Beyrich [49] proposed upgrading biogas to biomethane for better efficiency since the production phase. They also designed and architecture biogas upgrading technologies. The authors utilized process schemes of different technologies to cover all the scenarios. They showed that, due to the biogas upgrading, biomethane could become one of the most promising renewable energy carriers.
Iakovu et al. [50] provided a critical synthesis of waste biomass-to-energy supply chain focusing, as well as Kerroum and Hassan [51], on the production of biogas from municipal solid waste. The researchers designed distributed SCs together with proper implementation frameworks that need to be understood before investing in this field. Likewise, Gomez [52] and Viancelli et al. [53] provided overviews of using MSW in biogas production as an energy option around the world.
The reviewed studies helped understanding the whole picture of what biomass to the energy supply chain is with a particular focus on transforming municipality waste to biogas/biomethane and then using it for transport, as an example given by Svensson [54]. Nevertheless, the cited authors are concerned about greenhouse gasses (GHG) and the positive impact of the biogas chain in reducing them.
3. MSW to Biogas Production Technologies
3.1. Biogas Conversion Facilities—Overviews
It is significantly important to have a strategic view over the ramifications of all the variables and parameters of the technologies available on MSWSCs (Table 2).
Table 2.
MSW energy-producing technologies classification.
Frombo et al. developed 2009 a linear programming model for optimizing conversion center size according to the biomass quantities of a specific SC [56]. The cited authors took into consideration various technological aspects as well as the economical ones, their model being used mostly for direct combustion and gasification. A methodology for optimizing installations of new MSW conversion centers on a regional level is presented by Dornburg and Faaij as early as 2001 [57].
In 2018 Taifouris and Martin developed an SC based on a multiscale model to evaluate the potential of residues (e.g., sludge, manure MSW and wood residues) as well as the size of the plant/reactor and the best location to build [58]. The aim of the model is to maximize the production of biogas by minimizing the total cost. Their main finding was that MSW is one of the best waste types because of its availability, while wood (also known as lignocellulosic residue) is the second due to its higher efficiency when converting it into biogas.
However, the complexity (showed in a schematic form in Figure 3 and Figure 4 left and right) and the high costs for building biogas conversion plants, as stated previously, hinder the investor’s intentions. Moreover, the amount of energy that must be invested in the process is bigger than what is gained in the form of biogas [20]—most of the companies that are producing biogas from waste are either public or they are running on public–private partnership, because the profits are not necessarily financial, but social (e.g., less pollution, cleaner cities, etc.). The technology is continuing to improve, and by that, higher efficiencies are expected through new MSW separation technologies. The more increasing concerns over gas emissions tend to enhance state support, which may influence investors, making this energy sector more attractive.
A biogas plant, like the one in Tønsberg, Norway, beautifully named “Den Magiske Fabrikken” (The Magic Factory), is treating 110.000 tons of MSW in the form of food waste (40%), manure (55%) and liquid industrial waste (5%) since 2008, converting it in, roughly, 6.8 million cubic meters of methane per year (equivalent to 5.3 million liters of diesel), while the remaining solids are transformed into biofertilizer (approximately 112,000 tons) [59,60].
The size of the biogas plant may vary by several factors [61]:
- The amount of organic waste to be used;
- The ratio with which household waste is collected;
- The type of the organic waste (later on the article, a table with the most common biomass constituents of MSW are provided—Table 3);
- Local demand of the biogas—assuming that the plant is only feeding local needs and does not serve as a national or international source of biogas;
- The climate in the region throughout the different seasons.
The amount of recycled water together with other mixing compounds (e.g., manure) fed into the bioreactor each day has an important effect on its operation and, by that, on its size. To determine the size of the bioreactor, a mathematical equation, like the following one, should be used:
where:
- = bioreactor volume (m3)
- = biomass volume to be used daily (m3 * day−1)
- = retention time (days)
- = gas space—about 10% from the total volume of (the place where the biogas accumulates).
3.2. Municipal Solid Waste Supply Chains (MSWSCs)
As previously mentioned (in the Introduction), one of the most pressing environmental problems of the world is that of solid waste and its major component, namely, biodegradable waste (also known as biomass). When disposed on landfills, through anaerobic digestion, the biomass generates methane, a process that is to be translated both in lost energy and global warming [20]. While burning it in the landfills may solve one of the problems, such as reducing the total amount of waste, it does not bring any real benefits, such as producing energy.
Several researchers studied the design of waste biomass SCs. In 2010, Iakovu et al. developed a network infrastructure for the waste to be sent to energy plants [50]; an adapted version is presented below (Figure 5). As observed, MSWSCs for energy production generally consists of four subsystems components: (1) waste collection, (2) storing, (3) transporting and pretreatment and (4) converting it into energy—one considers entering the SC the moment in which a material is discarded into the waste stream, while the existence is the moment it is converted into biogas and biofertilizer.
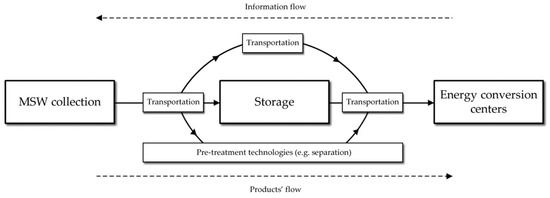
Figure 5.
Graphical representation of an MSWSC network (author’s adaptation).
The complexity of MSWSC is higher than compared with other biomass SCs due to the perishable products, as this attribute may alter the transportation and the storage costs by being a time-dependent activity. In addition, MSWSCs need to be both robust and flexible to adapt to seasonal changes as this may influence the production of energy and, by that, the competitiveness of the traditional forms of fuel could unbalance the demands.
However, there are few assumptions to start from when thinking about MSWSCs, and those are [62]:
- Waste generation is forecasted with high probability rates for the entire scheduling periods;
- Waste generated in cities is collected by the city collection station;
- All costs related to waste collection, transportation as well as other operational costs are linear functions.
The total MSW, based on the characterization of biomass materials, consists in organic garbage—70% of the total MSW, plastic and other petrochemicals (i.e., synthetic textile) constitute another 15% and paper, wood, leather, cotton and wool [63]. The table below (Table 3) shows the potential of biogas production of different constituents of solid waste as there are to be found in MSW:
Table 3.
Biomass constituents of MSW.
Table 3.
Biomass constituents of MSW.
| MSW Biomass Constituents | Biogas over Biomass Constituents (L kg−1, Dry Weight) | Methane (%) | Energy MJ ** | Energy KWh *** |
|---|---|---|---|---|
| Column 1 (C1) | Column 2 (C2) | Column 3 (C3) | Column 4 (C4) | Column 5 (C5) |
| Organics [64] | 100–400 | 53 | 0.1294–0.5175 | 0.0120–0.0479 |
| Petrochemicals [65] | 80–100 | 56 | 0.1094–0.1367 | 0.0101–0.0126 |
| Paper [66] | 65–80 | 52 | 0.0825–0.1016 | 0.0076–0.0094 |
| Wood [67] | 10–15 | 51 | 0.0125–0.0187 | 0.0012–0.0017 |
| Leather * [68] | 25–77 | 34 | 0.0208–0.0639 | 0.0019–0.0059 |
| Cotton and wool * [69] | 25–77 | 65 | 0.0397–0.1222 | 0.0037–0.0113 |
Source: author’s compilation & calculus based on cited literature [64,65,66,67,68,69].
Explanations: * according to [64,65,66,67,68,69], processing one metric ton of dry solid waste (i.e., cotton, wool or leather) requires a substantial need of water—around 500,000 L. To reduce the costs for this operation, cow dung (or other types of manure) is used (from 2.5% up to 15% of the mixture), and by that, a better C:N (carbon to nitrogen) ratio is achieved [70].
where:
- (rho) = density of methane (CH4), 46.5 kg/m3 [71]
- = value of energy (heat) for methane (CH4), 50–55 MJ/kg
- (eta) = efficiency (MJ to KWh converted at 33% efficiency is 0.0926) [72].
When MSW is made by organic garbage or food waste (e.g., fruits and vegetables), usually those constituents contain less than 4% volatile solids (VS), while the total solids (TS) mass rarely exceeds 7%—the rest being comprised of water [19,70].
In a municipal solid waste management (MSWM) system, there are two main processes: (1) waste disposal planning and control, together with (2) the distribution process [62]. Both of them should be tackled by the government (maybe in partnership with private companies) due to the lack of efficiency (as mentioned before, what is gained over the reuse of waste is less than the expenses). The SC continues with the conversion facilities, which, this time, does not necessarily need to be governmental anymore (or under the government supervision) and, after the waste is converted into biogas and biofertilizer, both of those main products are distributed from converting plants to dedicated centers to reenter the economy [73].
3.3. Constraints
For each city, there are few constraints to be taken into consideration, such as:
- The capacity of each storage station; this should equalize the amount left from the previous period plus the waste collected the period taken into consideration;where:
- = capacity of a storage station (m3);
- = time;
- = waste collection ratio;
- = quantity/volume of waste collected;
If is smaller than the total amount of waste generated in the city in the specified amount of time (), the costs of biogas may increase because the extra waste should be transported to another conversion plant, or unwillingly, it might end up on a landfill.
- 2.
- Transportation limits; clearly, the total waste transported from the city to distribution centers and further on the supply chain cannot exceed the transport capacity.where:
- = transportation mean (vehicle);
- = the total number of vehicles available for MSW transportation;
- = the volume (or quantity) of MSW transported by each unit/vehicle;
Delayed transports should also be considered.
4. Results
When biogas technologies and innovation is accepted and well implemented by all actors, the benefits for the citizens and the municipality are considerably higher than by using conventional methods of collecting and depositing MSW. The following examples are among the best practice cases found across Europe [14,35,36,37,38,39,53].
4.1. Bergen Example
Bergen, Norway’s second-largest city, offers one of the best, if not the best, MSW management system, which is capable of handling thirty tons of waste per day straight from the households, using airflow alone throughout an underground pipe system without requiring on-street waste containers [74] (however, those being still in use by the pedestrians). Using this system, the second constraint, as described in the previous section, is overcome.
From its first installation, in the year 2010, the system was developed to such an extent that today it serves 8953 households and businesses plus 1200 public waste inlets covering an area of roughly 800,000 m2 and being able to transport the waste extremely fast (70 km/h) outside the city where the waste collection station is [75].
4.2. Tønsberg Example
Following the Bergen example, the city of Tønsberg—part of the Oslo Region Alliance (Osloregionen), developed the system even more, making it a part of the Norway circular economy by recycling food waste for 1.2 million inhabitants annually into climate-friendly biogas for vehicles (i.e., public busses in the whole region are using it), as well as biofertilizers and bio-CO2 for the production of new food (i.e., tomato farms in the region are using both products for growing their plants and fruits that, in the end, are given to citizens as interest for the effort of sorting and collecting their waste) [76].
4.3. London Example
Since opening in February 2014, East London Biogas Plant processes up to 35,000 tons per year of MSW and already diverted more than 97,831 tons of waste from landfill producing over 39,487 MWh of renewable power—enough to power approximately 2000 homes. The process also produces 42,000 tons of biofertilizer used by local farmland [77,78].
4.4. Barcelona Example
Car manufacturer Seat announced in spring 2019 that they would be launching a project entitled “Life Metamorphosis” for converting organic waste into biomethane in Barcelona [39]. The company outline that all the waste collected at the Ecoparc 2—one of the four big environmental equipment infrastructures of biological and mechanical treatment of municipal waste in Barcelona [38,79], is transformed into biogas that would be injected into the gas supply network. Moreover, the car manufacturer was testing a number of cars working with this biomethane to see and understand the effect on their engines after being driven a minimum of 30,000 km each [39].
There are many other success stories that create ground to identify new actions and collaboration projects that contribute to accomplish this vision of using MSW for fueling the transport system of tomorrow [80,81,82]. The total operational cost associated with transforming MSW into biogas should take into consideration the entire SC (from waste disposal facilities to handling and waste storage stations and distribution centers, transportation, disposal and biogas production), which, as already stated throughout the article, may be higher than the financial gain. However, as undertaken here, a broader analysis shows that, from a social point of view, as well as environmental by reducing pollution and waste recycling, the benefits are immeasurable—see the case of Bergen and/or London. In addition, by participating in the circular economy, MSW management shows a huge potential in the long run—as in the case of Tønsberg.
The cost–benefit ratio of converting MSW to biogas depends on the following factors [70]:
- Energy prices;
- Tax concessions, if any;
- Land prices;
- Labor costs;
- Construction and material costs;
- Prices and markets for biofertilizer;
- Quality of both the biogas produced and biofertilizer.
5. Discussion
Although most of the articles in the literature examine the biomass-to-energy conversion from a technological or ecological approach, few focus on the assessments of the biomass potential. The present article tackled a niched component of biomass, municipal solid waste (MSW), and how a smart city may benefit from it. Moreover, as already presented, Romania offers a fertile land for biogas production, and this article is trying to present the benefits of investing in this industry.
Today, transforming MSW into biogas is one of the most, if not the most, environmentally friendly [83] ways of fueling the cities’ public transportation [84] and making a sizable contribution to the circular economy.
Of course, there are limitations as well as avenues to improve the large-scale biogas technology, and they are both institutional and also economic. One needs to observe:
- The complexity of the whole system. Establishing a self-sustaining institutional system is a complex activity that may require many resources, capability and initiative. In this regard, the author considers that private–public partnerships are a great way to deal with this new perspective of transforming MSW into biogas—Bergen is one of the most convincing cases of huge scale complexity.
- Individual behavior and waste cycles. The daily behavior of individuals cannot be precisely predicted (only their aggregation can); in fact, the volume of waste, as well as its type, are very particular. As such, it is not an easy task to do any prior calculation of inputs to properly understand the expected outputs. Introducing Smart Metering may help, but the costs associated with it would be added to the whole project.
- (Technical) acceptance by officials. Introduction and use of biogas require a huge change in the actual waste collection and deposit. The benefits must be fully observed and understood by the officials, as well as by citizens, in order for them to accept the investments. Barriers as management failures and organizational inflexibility are difficult to overcome [85,86]. Therefore, extra efforts should be made in this regard.
The current scenarios in biogas industry development corroborate with decision-making and investment initiatives aiming at reducing fossil fuels, increasing using renewable energy and emphasizing the role of the circular economy. For this, new perspectives on energy production are necessary to be taken into consideration and, of course, political support.
In this article, the reader visualized the whole MSWtE framework to provide systemic approaches for Romanian (but not only) researchers, practitioners and investors in their efforts to further develop better and sustainable MSWSCs networks. Further efforts are needed to promote waste to biogas processes and reduce the waste amounts from municipalities in a useful way. In this regard, logistics and SC management are areas of high importance for success.
6. Conclusions
As presented, MSW management should be considered as a strategic development director for the municipalities due to the complexity and benefits of its supply chain. MSW is subject to various impact factors, such as collection techniques, transport and disposal tools and facilities and of course, conversion plants. At the same time, waste management implies ethical behavior toward society. As the main product generated by MSW, biogas is currently the only renewable fuel viable alternative to natural gas being used for the same purposes and using the same transport infrastructure. Moreover, in the circular economy, digested MSW could be reused as biofertilizer to cultivate crops that may be used further on producing biogas.
This article is also trying to encourage Romanian local and national public administration as well as other interested parties to invest in the biogas industry; in doing so, the author provided systemic guidance for researchers and practitioners in their efforts to understand, design and plan MSWSCs up to transform MSW into energy.
Funding
This research was partially funded by The National University of Political Studies and Public Administration (SNSPA), Bucharest, Romania, under the framework of a project entitled “From smart cities to smart nation. Synergy of smart projects implemented at the city level in Romania”.
Institutional Review Board Statement
Not applicable.
Informed Consent Statement
Not applicable.
Data Availability Statement
Not applicable.
Acknowledgments
The author would like to thank Diana-Camelia Iancu, for her comments on an early version of this article.
Conflicts of Interest
The author declares no conflict of interest.
References
- Official Journal of the European Union. Directive 2009/29/EC of The European Parliament and of The Council, of 23 April 2009, amending Directive 2003/87/EC so as to Improve and Extend the Greenhouse Gas Emission Allowance Trading Scheme of the Community. Available online: https://eur-lex.europa.eu/LexUriServ/LexUriServ.do?uri=OJ:L:2009:140:0063:0087:en:PDF (accessed on 22 November 2019).
- Romanian Government Official Gazette. Hotărârea nr. 1844/2005 Privind Promovarea Utilizării Biocarburanților și a Altor Carburanți Regenerabili Pentru Transport (Decision no. 1844/2005 on Promoting the Use of Biofuels and Other Renewable Fuels for Transport). Available online: https://lege5.ro/Gratuit/hazdmnbz/hotararea-nr-1844-2005-privind-promovarea-utilizarii-biocarburantilor-si-a-altor-carburanti-regenerabili-pentru-transport (accessed on 22 November 2019). (In Romanian)
- European Commission. Directive 2008/98/EC on Waste (Waste Framework Directive). Available online: https://ec.europa.eu/environment/waste/framework/ (accessed on 22 November 2019).
- Gusmerotti, N.M.; Corsini, F.; Borghini, A. Assessing the role of preparation for reuse in waste-prevention strategies by analytical hierarchical process: Suggestions for an optimal implementation in waste management supply chain. Environ. Dev. Sustain. 2019, 21, 2773–2792. [Google Scholar] [CrossRef]
- Eurostat. Municipal Waste Statistics. Available online: https://ec.europa.eu/eurostat/statistics-explained/index.php/Municipal_waste_statistics (accessed on 23 November 2019).
- OECT.Stat. Municipal Waste, Generation and Treatment. Available online: https://stats.oecd.org/Index.aspx?DataSetCode=MUNW (accessed on 22 November 2019).
- EU (2006) Directive 2006/12/CE of the European Parliament and of the Council of 5 April 2006 on Waste. Available online: https://eur-lex.europa.eu/eli/dir/2006/12/oj (accessed on 24 January 2020).
- EU (2014) Directive 2014/94/UE of the European Parliament and of the Council of 22 October 2014 on the Deployment of Alternative Fuels Infrastructure. Available online: https://eur-lex.europa.eu/eli/dir/2014/94/oj (accessed on 24 January 2020).
- Bucharest Master Plan for the Integrated Waste Management System at the Level of Bucharest Municipality. Available online: https://www3.pmb.ro/storage/proiecte/1541510102master-plan.pdf (accessed on 24 January 2020).
- Sennes, V.; Gombert-Courvoisier, S.; Robeyre, F.; Felonneau, M.L. Citizens’ environmental awareness and responsibility at local level. Int. J. Urban. Sustain. Dev. 2012, 4, 186–197. [Google Scholar] [CrossRef]
- Tampakis, S.; Tsantopoulos, G.; Arabatzis, G.; Rerras, I. Citizens’ views on various forms of energy and their contribution to the environment. Renew. Sustain. Energy Rev. 2013, 20, 473–482. [Google Scholar] [CrossRef]
- Anagnostopoulos, T.; Zaslavsy, A.; Medvedev, A.; Khoruzhnicov, S. Top—k Query Based Dynamic Scheduling for IoT-enabled Smart City Waste Collection. In Proceedings of the 16th IEEE International Conference on Mobile Data Management, Pittsburgh, PA, USA, 15–18 June 2015; pp. 50–55. [Google Scholar] [CrossRef]
- Jaydeep, L.; Venkata, R.M.; Xuan, Z. Solid waste collection/transport optimization and vegetation land cover estimation using Geographic Information System (GIS): A case study of a proposed smart-city. Sustain. Cities Soc. 2017, 35, 336–349. [Google Scholar] [CrossRef]
- Scholwin, F. Energy flows in biogas plants: Analysis and implications for plant design. In The Biogas Handbook; Woodhead Publishing Series in Energy: Cambridge, UK, 2013; pp. 212–227. [Google Scholar]
- Bachmann, N. Design and engineering of biogas plants. In The Biogas Handbook; Woodhead Publishing Series in Energy: Cambridge, UK, 2013; pp. 191–211. [Google Scholar]
- Abbasi, T.; Tauseef, S.M.; Abbasi, S.A. Biogas Capture from Solid Waste. In Biogas Energy; Springer Briefs in Environmental Science: Berlin/Heidelberg, Germany, 2011; Volume 2, pp. 105–143. [Google Scholar]
- Scheper, T. Advances in Biochemical Engineering/Biotechnology. In Biogas Science and Technology; Springer International Publishing: Cham, Switzerland, 2015; p. 5. [Google Scholar]
- Makádi, M.; Tomócsik, A.; Orosz, V. Digestate: A New Nutrient Source—Review. In Biogas; IntechOpen: Rjeka, Croatia, 2012. [Google Scholar] [CrossRef]
- United Nation Framework Convention on Climate Change (UNFCCC). Kyoto Protocol Reference Manual on Accounting of Emissions and Assigned Amount. Available online: https://unfccc.int/resource/docs/publications/08_unfccc_kp_ref_manual.pdf (accessed on 22 November 2019).
- Abbasi, T.; Tauseef, S.M.; Abbasi, S.A. Biogas and Global Warming. Biogas Energy 2012. [Google Scholar] [CrossRef]
- Scarlat, N.; Dallemand, J.F.; Fahl, F. Biogas: Developments and perspectives in Europe. Renew. Energy 2018, 129, 457–472. [Google Scholar] [CrossRef]
- Official Website of the European Union. Renewable Energy Directive. Available online: https://ec.europa.eu/energy/topics/renewable-energy/renewable-energy-directive/overview_en (accessed on 9 April 2021).
- Michelini, G.; Moraes, R.N.; Cunha, R.N.; Costa, J.M.H.; Ometto, A.R. From Linear to Circular Economy: PSS Conducting the Transition. CIRP IPSS 2017, 64, 2–6. [Google Scholar] [CrossRef]
- Ciuta, S.; Apostol, T.; Rusu, V. Urban and Rural MSW Stream Characterization for Separate Collection Improvement. Sustainability 2015, 7, 916–931. [Google Scholar] [CrossRef]
- Mutz, D.; Hengevoss, D.; Hugi, C.; Gross, T. Waste-to-Energy Options in Municipal Solid Waste Management, Deutsche Gesellschaft für Internationale Zusammenarbeit (GIZ) GmbH, Eschborn, 2017; pp. 10–19. Available online: https://www.giz.de/en/downloads/GIZ_WasteToEnergy_Guidelines_2017.pdf (accessed on 16 January 2020).
- BP. BP Statistical Review of World Energy; BP: London, UK, 2019; Volume 68, pp. 8–10. [Google Scholar]
- REN21. Renewables Now; Global Status Report; REN21: Paris, France, 2019; p. 71. [Google Scholar]
- Mahajan, J.; Vakharia, A.J. Waste Management: A Reverse Supply Chain Perspective. VIKALPA 2016, 41, 1–12. [Google Scholar] [CrossRef]
- European Biogas Association (EBA). EBA Statistical Report 2018. 2019. Available online: https://www.europeanbiogas.eu/wp-content/uploads/2019/05/EBA_Statistical-Report-2018_AbrigedPublic_web.pdf (accessed on 2 December 2019).
- European Parliament News Portal. What is Carbon Neutrality and How Can It Be Achieved by 2050? Available online: https://www.europarl.europa.eu/news/en/headlines/society/20190926STO62270/what-is-carbon-neutrality-and-how-can-it-be-achieved-by-2050 (accessed on 31 March 2021).
- Wüstenhagen, R.; Bilharz, M. Green Energy Market Development in Germany: Effective Public Policy and Emerging Customer Demand. Energy Policy 2006, 34, 1681–1696. [Google Scholar] [CrossRef]
- Roberts, P. Energy Is Power. In The End of Oil: On the Edge of a Perilous New World, 1st ed.; Houghton Mifflin: Boston, MA, USA, 2004; pp. 91–115. [Google Scholar]
- French Institute of International Relations (IFRI); Eyl-Mazzega, M.A.; Mathieu, C. Biogas and Biomethane in Europe: Lessons from Denmark, Germany and Italy; IFRI: Paris, France, 2019; Available online: https://www.ifri.org/sites/default/files/atoms/files/mathieu_eyl-mazzega_biomethane_2019.pdf (accessed on 31 March 2021).
- Lyng, K.A.; Skovsgaard, L.; Jacobsen, H.K.; Hanssen, O.J. The implications of economic instruments on biogas value chains: A case study comparison between Norway and Denmark. Environ. Dev. Sustain. 2020, 22, 7125–7152. [Google Scholar] [CrossRef]
- Global Methane Initiative (GMI). Official Web Site. Available online: https://www.globalmethane.org/resources/index.aspx?sector=Municipal+Solid+Waste (accessed on 24 March 2021).
- Treichel, H.; Alves, S.L.J.; Müller, C.; Fongaro, G. An Overview About of Limitations and Avenues to Improve Biogas Production. Biofuel Biorefinery Technol. 2019, 9, 289–304. [Google Scholar]
- Anaokar, G.S.; Khambete, A.K.; Christian, R.A. Biogas modeling by fuzzy comprehensive index of municipal wastewater and sludge. Environ. Prog. Sustain. Energy 2021, 40, e13502. [Google Scholar] [CrossRef]
- The Barcelona Website|Barcelona City Council. Available online: https://ajuntament.barcelona.cat/ecologiaurbana/en/services/the-city-works/maintenance-of-public-areas/waste-management-and-cleaning-services/household-waste-collection (accessed on 14 February 2021).
- SEAT Official Web Page. Available online: https://www.seat.com/company/news/company/seat-turns-organic-waste-into-fuel.html (accessed on 14 February 2021).
- European Commission. Estimates of European Food Waste Levels. Available online: https://ec.europa.eu/food/safety/food_waste_en (accessed on 5 December 2019).
- Eurostat. Waste Generated by Households by Year and Waste Category. Available online: https://ec.europa.eu/eurostat/tgm/table.do?tab=table&init=1&language=en&pcode=ten00110&plugin=1 (accessed on 5 December 2019).
- European Commission, Statistical Office. Portrait of the Regions—Romania; European Commission: Brussels, Belgium, 2011; Volume 11, Available online: https://insse.ro/cms/files/publicatii/Statistica%20teritoriala/Portrait%20of%20the%20regions_Romania_volume%2011.pdf (accessed on 23 March 2021).
- DIGI 24 News Channel, Article: Toate Gropile de Gunoi ale Bucureștiului, în Afara Legii (All the Landfills of Bucharest, Outside the Law). Available online: https://www.digi24.ro/stiri/actualitate/social/toate-gropile-de-gunoi-din-bucuresti-in-afara-legii-824826 (accessed on 18 March 2021).
- European Commission, Directorate-General for Internal Market, Industry, Entrepreneurship and SMEs. Country Report, Romania, Legal Assistance on the Application of Public Procurement Rules in the Waste Sector; Ramboll: Copenhagen, Denmark, 2016. [Google Scholar]
- National Statistics Institute, Metadata [O4_9]. Available online: http://www.insse.ro/cms/files/Web_IDD_BD_ro/ob4.htm (accessed on 19 March 2021).
- Pfau, S.F.; Hagens, J.E.; Dankbaar, B. Biogas between renewable energy and bio-economy policies—Opportunities and constraints resulting from a dual role. Energy Sustain. Soc. 2017, 7, 7–17. [Google Scholar] [CrossRef]
- Holm-Nielsen, J.B.; Oleskowicz-Popiel, P. Process control in biogas plants. In The Biogas Handbook; Woodhead Publishing Series in Energy: Cambridge, UK, 2013; pp. 228–247. [Google Scholar]
- Al Seadi, T.; Rutz, D.; Janssen, R.; Drosg, B. Biomass resources for biogas production. In The Biogas Handbook; Woodhead Publishing Series in Energy: Cambridge, UK, 2013; pp. 19–51. [Google Scholar]
- Beil, M.; Beyrich, W. Biogas upgrading to biomethane. In The Biogas Handbook; Woodhead Publishing Series in Energy: Cambridge, UK, 2013; pp. 342–377. [Google Scholar]
- Iakovou, E.; Karagiannidis, A.; Vlachos, D.; Toka, A.; Malamakis, A. Waste biomass-to-energy supply chain management: A critical synthesis. Waste Manag. 2010, 30, 1861–1870. [Google Scholar] [CrossRef] [PubMed]
- Kerroum, D.; Mossaab, B.; Hassen, M.A. Production of Biogas from Sludge Waste and Organic Fraction of Municipal Solid Waste. Biogas 2011. [Google Scholar] [CrossRef][Green Version]
- Gomez, C. Biogas as an energy option: An overview. In The Biogas Handbook; Woodhead Publishing Series in Energy: Cambridge, UK, 2013; pp. 1–16. [Google Scholar]
- Viancelli, A.; Michelon, W.; ElMahdy, M. Current Efforts for the Production and Use of Biogas Around the World. Biofuel Biorefinery Technol. 2019, 9, 277–287. [Google Scholar]
- Svensson, M. Biomethane for transport applications. In The Biogas Handbook; Woodhead Publishing Series in Energy: Cambridge, UK, 2013; pp. 428–443. [Google Scholar]
- Folk, E. BioEnergy Consult, Insights into MSW-to-Energy. 2019. Available online: https://www.bioenergyconsult.com/msw-to-energy/ (accessed on 16 January 2020).
- Frombo, F.; Minciardi, R.; Robba, M.; Rosso, F.; Sacile, R. Planning woody biomass logistics for energy production: A strategic decision model. Biomass Bioenergy 2009, 33, 372–383. [Google Scholar] [CrossRef]
- Dornburg, V.; Faaij, A. Efficiency and economy of woodfired biomass energy systems in relation to scale regarding heat and power generation using combustion and gasification technologies. Biomass Biomass Energy 2001, 21, 91–108. [Google Scholar] [CrossRef]
- Taifouris, M.S.; Martín, M. Multiscale scheme for the optimal use of residues for the production of biogas across Castile and Leon. J. Clean. Prod. 2018, 185, 239–251. [Google Scholar] [CrossRef]
- Malmberg, Insights, The Magic Factory, A Real Win-Win Situation. Available online: https://www.malmberg.se/en-us/Insights/The-Magic-Factory (accessed on 16 January 2020).
- Den Magiske Fabrikken. Available online: https://kampanje.vesar.no/den-magiske-fabrikken/ (accessed on 13 February 2021).
- Samer, M. Biogas Plant Constructions. In Biogas; InTech: Rijeka, Croatia, 2012; pp. 343–369. [Google Scholar]
- Zhang, Y.; Huang, G.H.; He, L. A multi-echelon supply chain model for municipal solid waste management system. Waste Manag. 2014, 34, 553–561. [Google Scholar] [CrossRef]
- Themelis, N.J.; Ulloa, P.A. Methane generation in landfills. Renew. Energy 2007, 32, 1243–1257. [Google Scholar] [CrossRef]
- Mustafa, M.Y.; Calay, R.K.; Román, E. Biogas from Organic Waste—A Case Study. Procedia Eng. 2016, 146, 310–317. [Google Scholar] [CrossRef]
- Roddy, D.J. Biomass in a petrochemical world. Interface Focus 2013, 3, 20120038. [Google Scholar] [CrossRef]
- Ofoefule, A.U.; Nwankwo, J.I.; Ibeto, C.N. Biogas Production from Paper Waste and its blend with Cow dung. Adv. Appl. Sci. Res. 2010, 1, 1–8. [Google Scholar]
- Salehian, P.; Keikhosro, K.; Zilouei, H.; Jeihanipour, A. Improvement of biogas production from pine wood by alkali pretreatment. Fuel 2012, 106, 484–489. [Google Scholar] [CrossRef]
- Leather International, Tannery Waste to Biogas—Industry Report. 2016. Available online: http://www.leathermag.com/features/featuretannery-waste-to-biogas-industry-report-4995410/ (accessed on 21 December 2019).
- Rajendran, K.; Balasubramanian, G. High-Rate Biogas Production from Waste Textiles. Master’s Thesis, University of Borås, Industrial Biotechnology, Borås, Sweden, 2011. Available online: https://www.researchgate.net/publication/232285480_High_rate_biogas_production_from_waste_textiles (accessed on 21 December 2019).
- Ramasamy, E.V.; Gajalaksl, S.; Sanjeevi, R.; Jithesh, M.N.; Abbasi, S. Feasibility studies on the treatment of dairy wastewaters with up flow anaerobic sludge blanket reactors. Bioresour. Technol. 2004, 93, 209–212. [Google Scholar] [CrossRef] [PubMed]
- Endmemo. Methane Mass Volume Converter. Available online: www.endmemo.com/chem/massvolume.php?q=Methane (accessed on 21 December 2019).
- World Nuclear Association. Heat Values of Various Fuels. Available online: https://www.world-nuclear.org/information-library/facts-and-figures/heat-values-of-various-fuels.aspx (accessed on 21 December 2019).
- Wen, X.Y. City intelligent life: A case study on Shenzhen city intelligent classification of domestic waste. SCRD Smart Cities Reg. Dev. J. 2021, 27–30. [Google Scholar]
- Infrastructure Intelligence Official Web Page. Available online: http://www.infrastructure-intelligence.com/article/nov-2016/world%E2%80%99s-largest-automated-vacuum-waste-collection-system-set-bergen (accessed on 14 February 2021).
- ENVAC Official Web Page. Available online: https://www.envacgroup.com/project/bergen/ (accessed on 14 February 2021).
- Bugge, M.M.; Fevolden, A.M.; Klitkou, A. Governance for system optimization and system change: The case of urban waste. Res. Policy 2019, 48, 1076–1090. [Google Scholar] [CrossRef]
- London’s Global University. Available online: https://www.ucl.ac.uk/circular-economy-lab/Past_events/teg_visit (accessed on 14 February 2021).
- L’àrea Metropolitana de Barcelona Official Web Page. Available online: https://www.amb.cat/en/web/ecologia/residus/instalacions-i-equipaments/detall/-/Equipament/ecoparc-montcada-i-reixac/352170/11818 (accessed on 14 February 2021).
- London Municipality Official Web Page. Available online: https://www.london.gov.uk/about-us/london-assembly/london-assembly-publications/energy-waste (accessed on 14 February 2021).
- Kok, S.W.; Irene, M.C.L. A proposed framework of food waste collection and recycling for renewable biogas fuel production in Hong Kong. Waste Manag. 2016, 47, 3–10. [Google Scholar] [CrossRef]
- Tavares, G.; Zsigraiova, Z.; Semiao, V.; Carvalho, M.G. Optimization of MSW collection routes for minimum fuel consumption using 3D GIS modelling. Waste Manag. 2009, 29, 1176–1185. [Google Scholar] [CrossRef] [PubMed]
- Mustafa, A.; Kaur, C.R.; Mohamad, Y.M. A Techno-economic Study of a Biomass Gasification Plant for the Production of Transport Biofuel for Small Communities. Energy Procedia 2017, 112, 529–536. [Google Scholar] [CrossRef]
- Winquist, E.; Van Galen, M.; Zielonka, S.; Rikkonen, P.; Oudendag, D.; Zhou, L.; Greijdanus, A. Expert Views on the Future Development of Biogas Business Branch in Germany, The Netherlands, and Finland until 2030. Sustainability 2021, 13, 1148. [Google Scholar] [CrossRef]
- Dahlgren, S.; Ammenberg, J. Sustainability Assessment of Public Transport, Part II—Applying a Multi-Criteria Assessment Method to Compare Different Bus Technologies. Sustainability 2021, 13, 1273. [Google Scholar] [CrossRef]
- Vrabie, C. Elemente de E-Guvernare (Elements of E-Government); Pro Universitaria Publishing House: Bucharest, Romania, 2016; pp. 33–53. [Google Scholar]
- Solutions for eGovernment. Deliverable 3 for the EC-funded Project ‘Breaking Barriers to eGovernment’. Breaking Barriers to eGovernment. Overcoming Obstacles to Improving European Public Services; Modinis Study; 2007. eGovernment Unit, DG Information Society and Media, European Commission. Available online: https://www.oii.ox.ac.uk/archive/downloads/research/egovbarriers/deliverables/solutions_report/Solutions_for_eGovernment.pdf (accessed on 17 February 2021).
Publisher’s Note: MDPI stays neutral with regard to jurisdictional claims in published maps and institutional affiliations. |
© 2021 by the author. Licensee MDPI, Basel, Switzerland. This article is an open access article distributed under the terms and conditions of the Creative Commons Attribution (CC BY) license (https://creativecommons.org/licenses/by/4.0/).