1. Introduction
Taro (Cocoyam) [
Colocasia esculenta (L.) Schott] is an important tropical root crop grown purposely for its starchy corms or underground stem [
1]. It is regarded as one of the most important staple crops in the Pacific Islands, Asia and Africa [
1,
2,
3,
4]. It is one of the oldest world’s food crops believed to have been first domesticated in Southeast Asia before its eventual spread to other parts of the world [
5,
6]. The two most commonly cultivated species of Taro (
Colocasia esculenta and
Xanthosoma sagittifolium) belong to the Araceae family and are extensively cultivated in Africa.
Taro is an herbaceous monocotyledonous plant of 1–2 m height. The plant consists of central corm (below the soil surface) making the leaves grow upwards, roots grown downwards, while cormels, daughter corms and runners (stolons) grow laterally. The root system is fibrous and lies mainly at a depth of up to one meter of soil [
3,
7].
In most Pacific Island countries (PICs) where taro is widely cultivated and consumed, two species of
Colocasia are recognized. They are
C.
esculenta var.
esculenta, commonly called dasheen, and
C.
esculenta var.
antiquorum, often referred to as eddoe [
3,
8]. The dasheen variety possesses large central corms, with suckers and/or stolons, while eddoes have somewhat small central corm and a large number of smaller cormels [
3,
9,
10].
In Africa, Taro is commonly produced by smallholder, resource-limited and mostly female farmers [
3]. Taro ranks third in importance, after cassava and yam, among the class of root and tuber crops cultivated and consumed in most African countries [
3]. The crop is underutilized in the areas of export, human consumption, industrial uses, nutritional and other health benefits in Africa. Thus, the objective of this review is to provide a critical assessment of the leading players in the taro sub-sector globally and continentally with the most recent datasets useful for policy intervention and planning. Also, this study explores the nutritional, health and economic benefits of taro highlighting the role it can play in enhancing sustainable livelihoods especially in Africa.
This review relied largely on secondary data freely available at the Food and Agriculture Organisation of the United Nations Corporate Statistical Database (FAOSTAT) and Tridge.com (an online resource for agricultural crops’ international trade data). Other sources include selected peer-reviewed journal articles (from google scholar, Science Direct, Scopus, Mendeley etc), handbooks, conference proceedings, bulletins, and online materials that are germane to this study.
2. Global Taro Production Outlook (2000–2019)
In many parts of the world, roots and tubers such as cassava, sweet potato, yam, and cocoyam are important staple crops. They are commonly cultivated by smallholder farmers and used as food security and income crops especially in Africa. According to FAOSTAT [
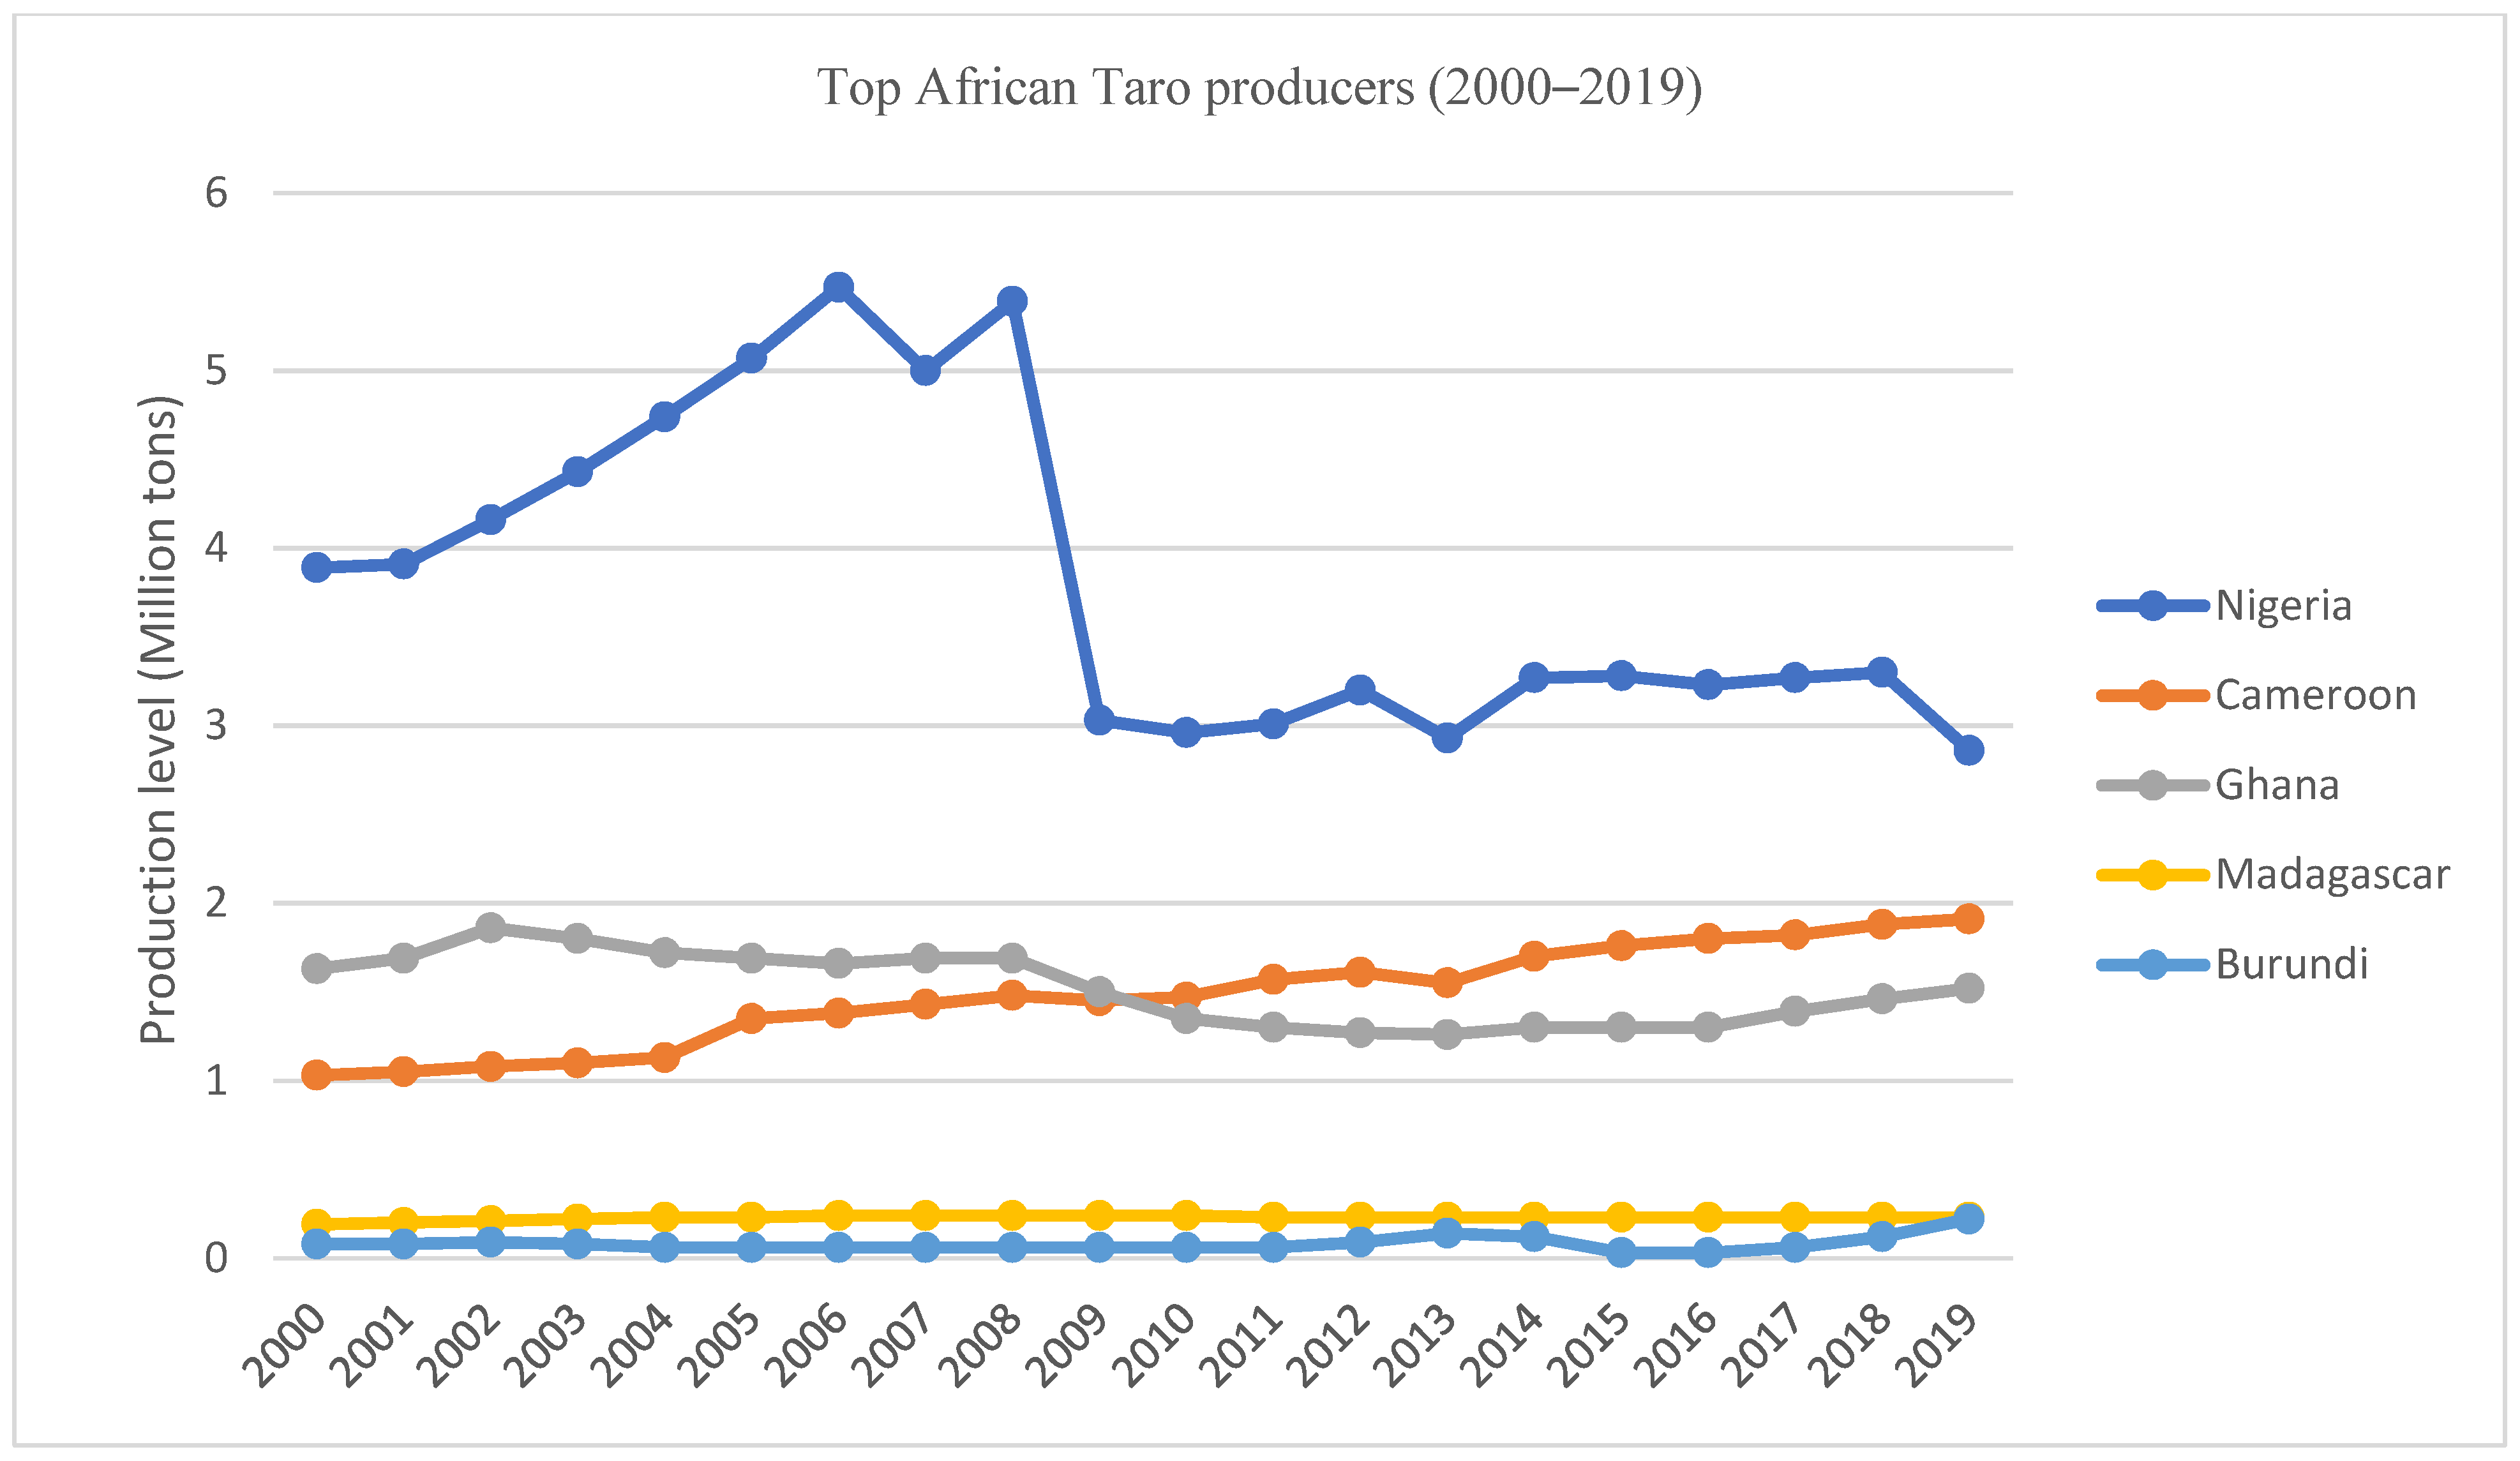
11], global taro production stood at 9.76 million tonnes in 2000 and reached 10.54 million tonnes in 2019 (
Table 1) with Nigeria, Cameroon, China (mainland) and Ghana ranked 1st, 2nd, 3rd and 4th respectively (
Table 2).
According to FAOSTAT 2021 [
11], there are 47 major taro producing countries in 2019. These countries are from Africa, America, Asia and Oceania regions (
Table 3). Nigeria is the highest producer of taro (cocoyam) globally with about 2.86 million tonnes and 27.14% (
Table 2) share of world total production in 2019 while Maldives had the least production level of 8 tonnes [
11]. Nigeria, Nicaragua, China (mainland) and Papua New Guinea had the highest production level in Africa, Americas, Asian and Oceanian regions respectively in 2019 [
11]. Globally, taro production in terms of total area harvested has increased substantially in the last two decades, moving from 1.40 million tonnes in 2000 to 1.96 million tonnes in 2019 (
Table 1). Asian region had its highest average yield of taro in 2019 (
Table 3) from Palestine (37.00 tons/ha) while the average yield of 9.60 tons/ha from Madagascar was Africa’s highest. From the Americas, the highest average yield was from St. Lucia (25.00 tons/ha) while the highest yield of Oceania was 17.57 tons/ha from Kiribati.
According to [
3], FAO’s projection that 70% growth in global agricultural production is required to feed the growing population of an additional 2.3 billion people by 2050 can only be achieved by increasing yields and crop production levels on available farmlands, rather than by increasing lands used for agricultural production. This is not the case in the African region. The increased production level noticed in the African region depended largely on increased farmland for taro cultivation rather than increased crop yield per hectare.
3. Global Taro Imports and Exports Outlook
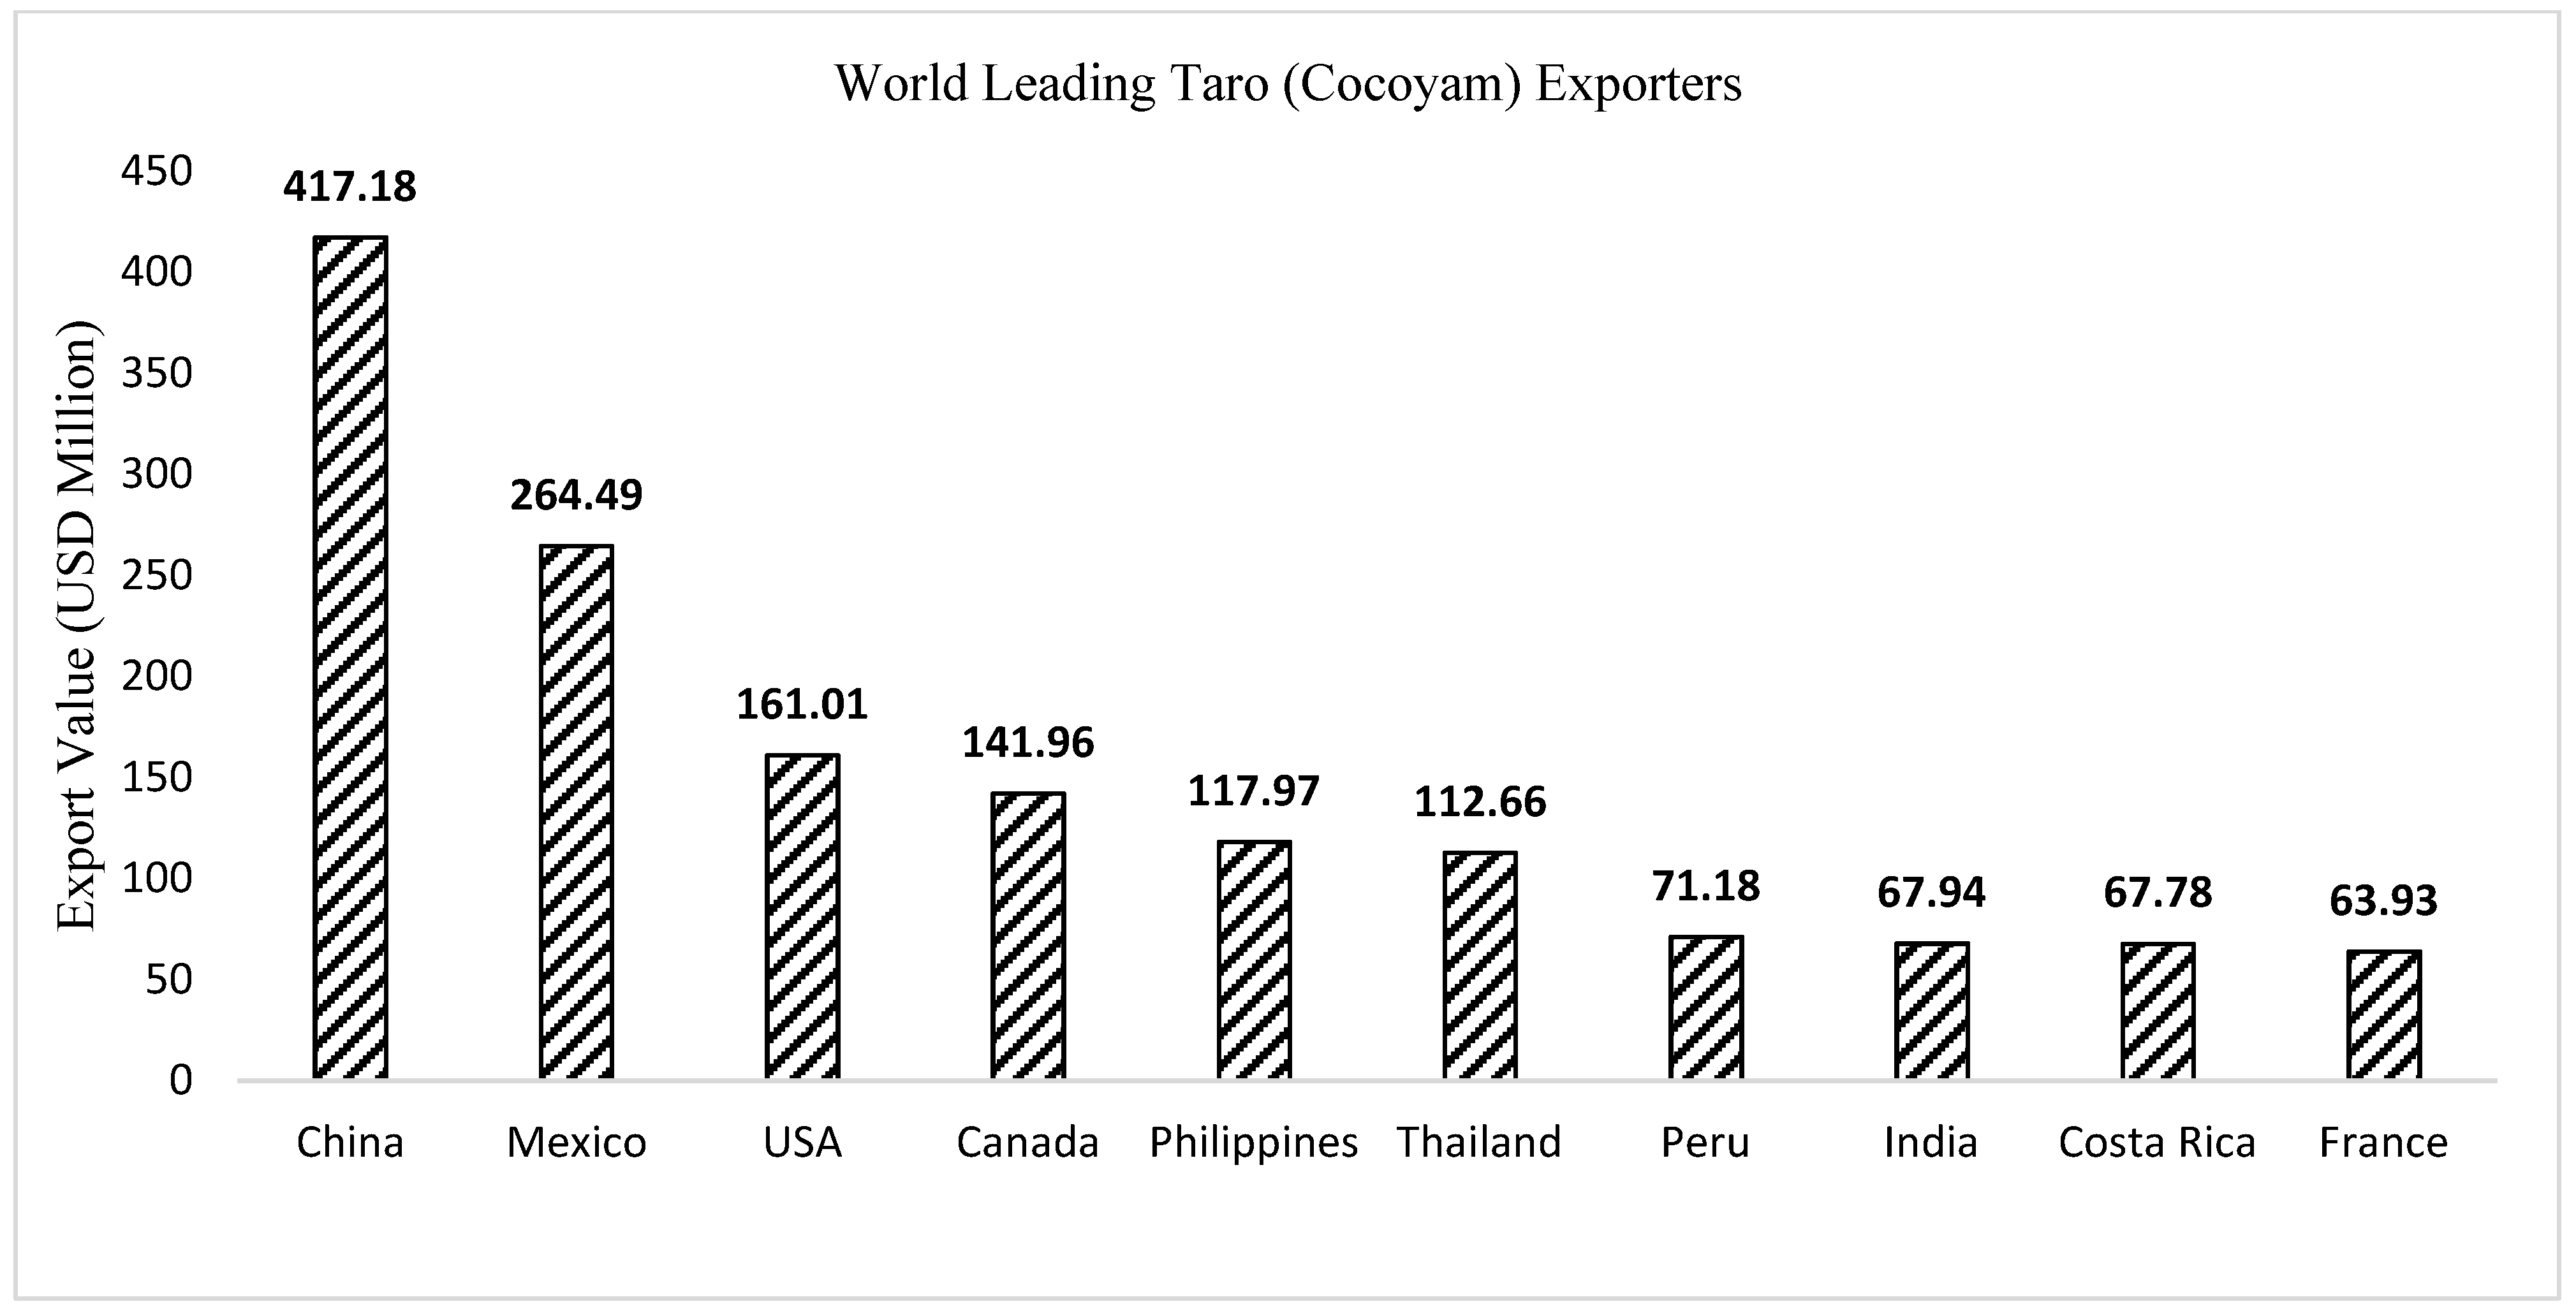
On the taro global market, China is the leading exporter of taro followed by Mexico, USA and Canada, even though taro production levels in these countries are not as high as those of the top five producers in African countries namely; Nigeria, Cameroon, Ghana, Madagascar and Burundi respectively (
Figure 1). From
Table 4 and
Figure 2, China had the highest taro export value in 2018 with
$417.18 million (17.0% world share in US dollars) and about 177 thousand metric tonnes, followed by Mexico
$264 million (10.8% global share in US dollars) with a total of 112.96 thousand metric tonnes (quantity exported) while USA had
$161 million taro export value (6.6% global share in US dollars) and 50.97 thousand metric tonnes quantity exported in 2018 [
12].
Surprisingly, no African countries made the top 20 exporters of taro in 2018 despite being the world leading producers of taro for decades. China and Thailand have consistently maintained their exporting and importing capability on the global crop market just like in cassava global market where Thailand was ranked 1st in export with a total export value of
$1.19 billion and China ranked 1st in cassava import globally with a total import value of
$1.37 billion in 2017 [
13].
However, China’s total taro export value increased steadily from
$338.29 million in 2009 to
$417.18 million in 2018 [
12]. Information on the international trade of taro from Africa seem to be very scarce. This may partly be due to the fact that these leading African producers like Nigeria, Cameroon, and Ghana do not have good documentation of trade in taro and also indicative of the fact that taro production in Africa (especially Sub-Saharan Africa) is mainly hinged on meeting the food security needs at national levels [
3].
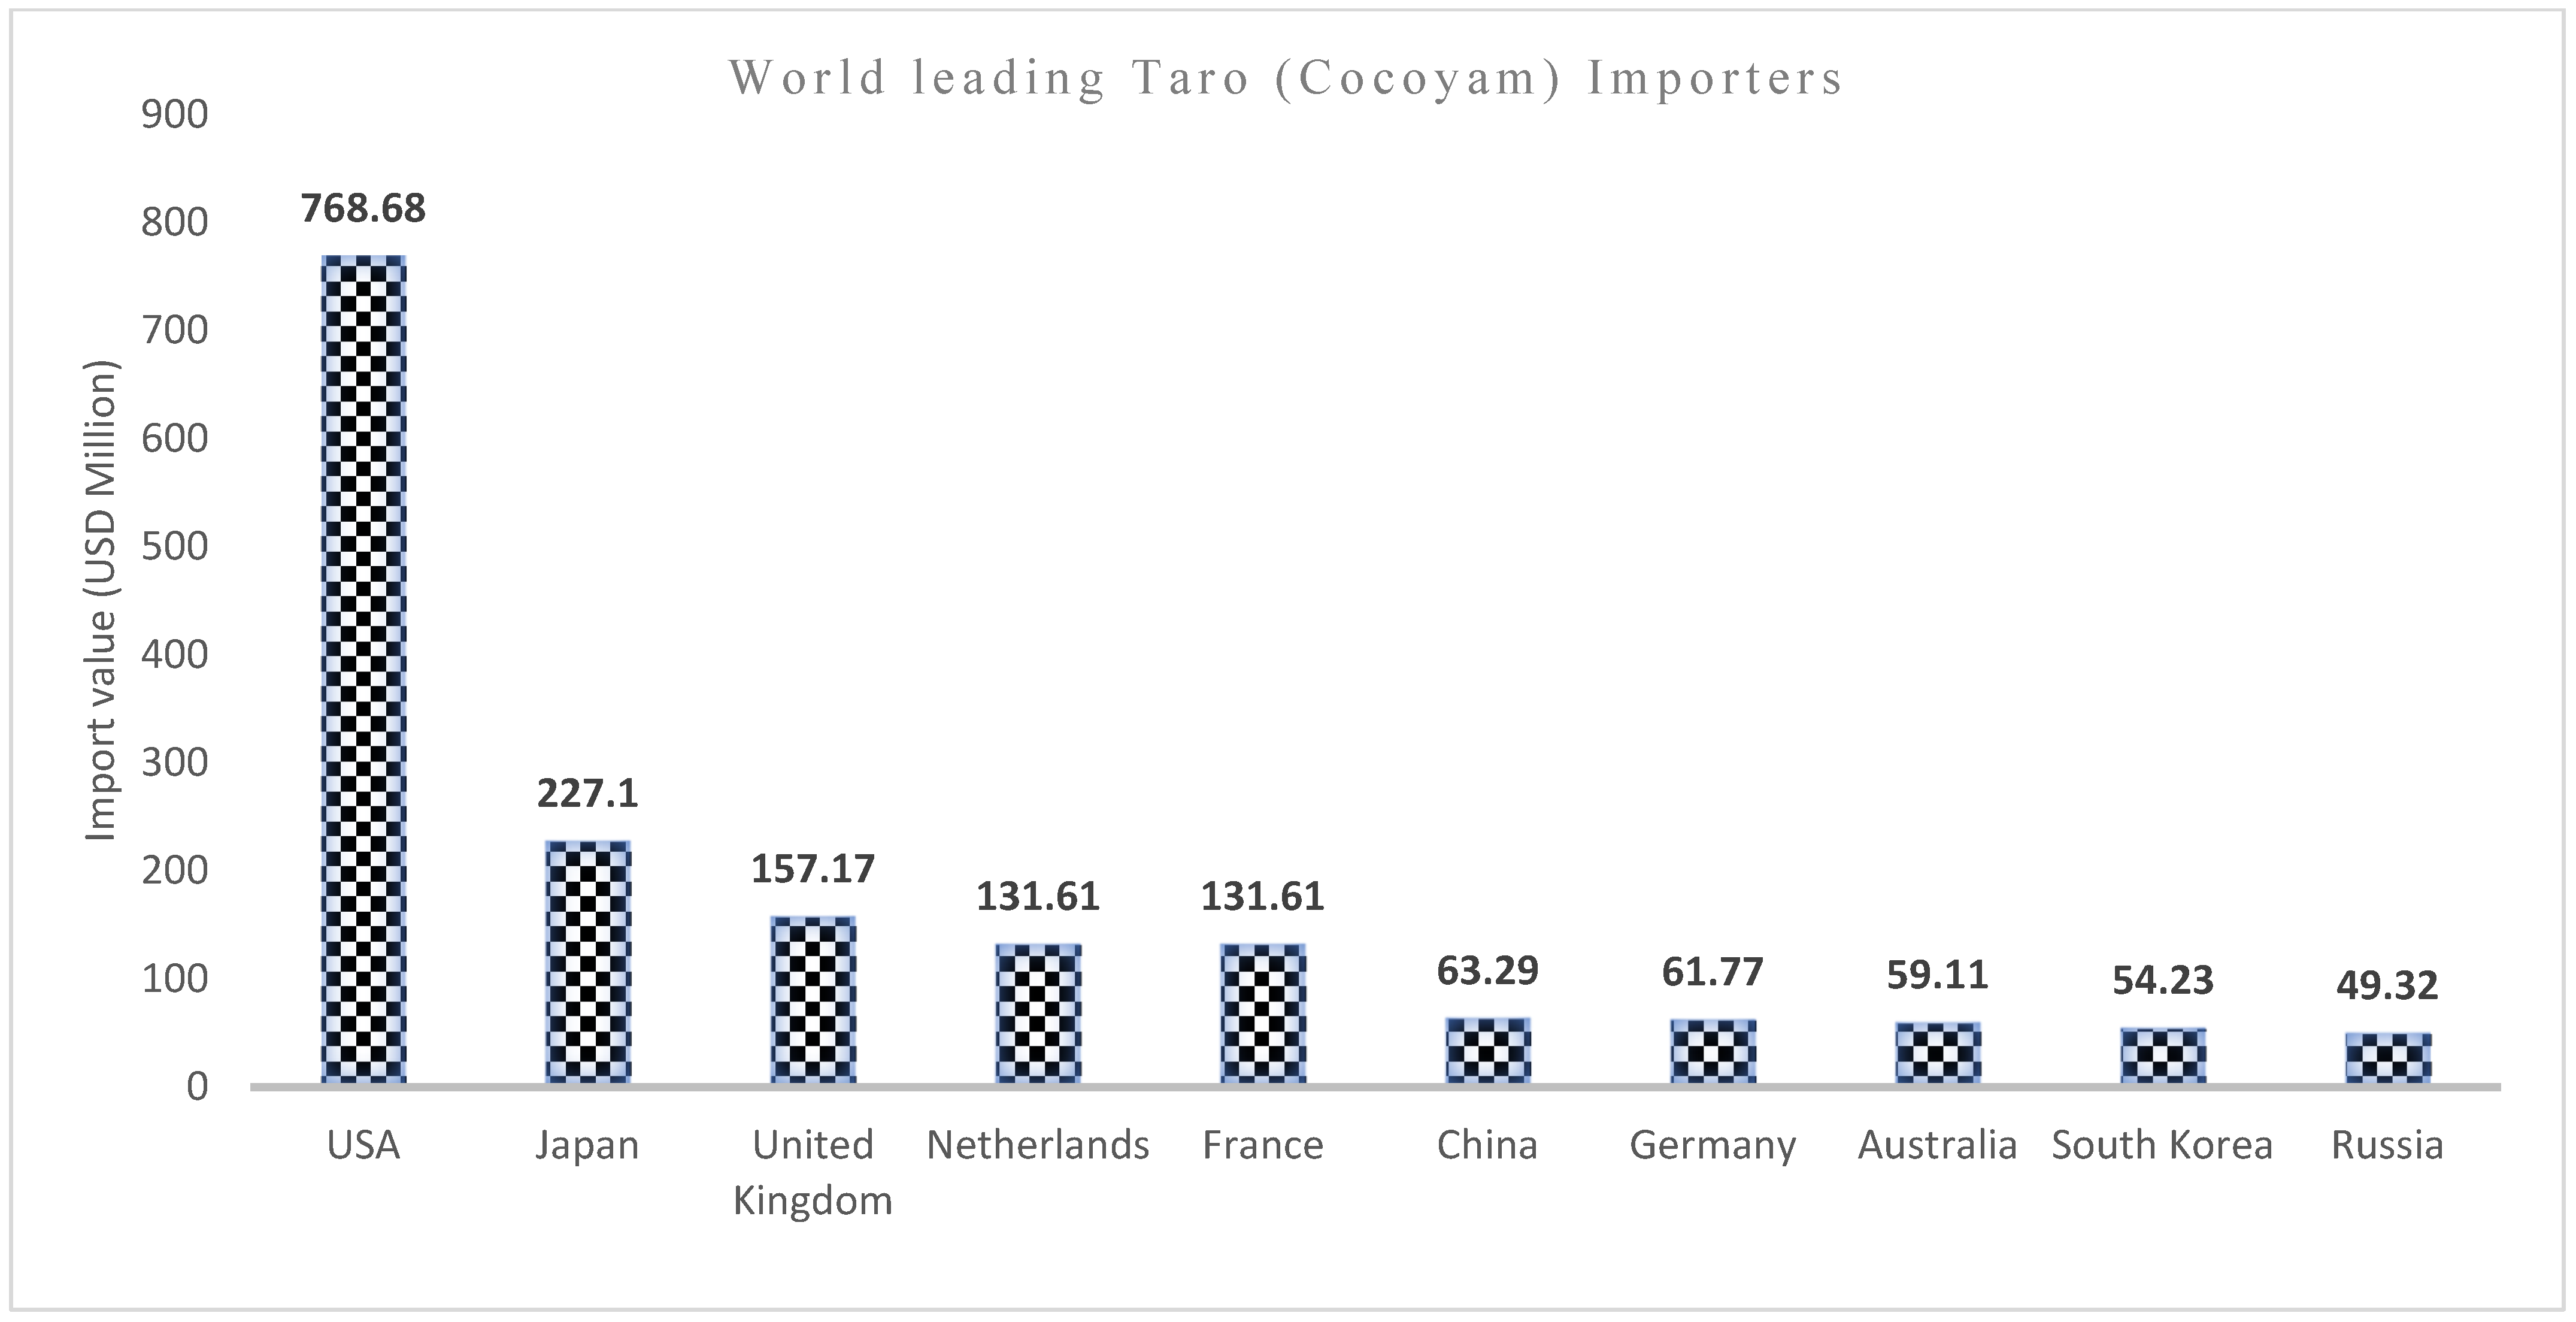
The global taro import value stood at
$2.46 billion in 2018. United States of America (USA) imported a total value of
$768.68 million in 2018 while Japan, United Kingdom, Netherlands and France are among the top 10 leading taro importing countries (
Figure 3).
Table 5 revealed the top 20 taro importing countries and their import shares and quantities (metric tons). USA had the highest import value of taro in 2018 with about
$768.68 million (31.3% world share in US dollars) and about 393.68 thousand metric tonnes of importing quantities, followed by Japan with
$227 million (9.3% global share in US dollars) with a total of 93.21 thousand metric tonnes (quantity imported) while United Kingdom had
$157 million taro import value (6.4% global share in US dollars) and 75.85 thousand metric tonnes quantity exported in 2018 [
12].
4. The Energy and Nutritional Values of Taro
Root crops, including taro, are very good sources of energy, fiber, calcium, iron and vitamins. Root plants provide up to 24% of the energy required and 100% of vitamin C. Taro is also a functional food, and possesses nutraceutical ingredients which act against chronic diseases and help maintain good health. Food innovations provide modern methods of food preservation.
Taro has a brown outer skin and white flesh with purple spots all over. When cooked, it has a slightly sweet taste and a potato-like consistency. Taro root is an excellent source of fiber and other nutrients. It is mainly grown for its corm starch, which can be baked, fried, boiled, or made into fresh or fermented paste, flour, drink, crisps or chips. Additionally, its leaves are eaten in sauces, soups or stews due to the high content of vitamins, minerals, secondary metabolites and fiber [
8,
14,
15,
16,
17].
Nutritionally, taro contains more than twice as much carbohydrate as potatoes and gives 135 kcal per 100 g. Taro contains about 11% protein on a dry weight basis. It’s more than yam, cassava or sweet potato. Many authors have also stated that the protein content of taro is higher than that of other root crops in leaves and tubers, respectively. It contains 85–87% starch on a dry matter basis with small granules, 3–18 µm in size and the content of other nutrients such as minerals, vitamin C, thiamine, riboflavin and niacin [
15,
17].
Taro leaves are rich in nutrients including minerals such as calcium, phosphorus, iron, and vitamins such as vitamin C, thiamin, riboflavin, and niacin. The high levels of dietary fiber in taro are also beneficial due to their active role in regulating intestinal metabolism, increasing dietary weight and the consistency of stool due to their ability to absorb water. Most of the rural population suffers from malnutrition not because of their economic status, but from an inability to use the available nutritional resources to meet their daily needs. Today, zinc deficiency is common and affects the health and well-being of populations around the world, and since taro is one of the few sources of non-animal zinc, its use should be sought to help alleviate the zinc deficiency that is associated with dwarfism [
16,
17,
18].
4.1. The Chemical Composition of Taro
Taro tubers are characterized by low protein and fat content, but high carbohydrate and mineral content. The small size of the starch granules helps to increase the bioavailability of the nutrients through digestive and absorption efficiency. The ash content in taro ranges from 0.6 to 2.11% fresh weight and 3.54–7.78% dry matter (
Table 6). From a nutritional point of view, however, taro is rather low in iron and manganese. The nutritional composition of taro tubers can vary significantly depending on the genotype, growing conditions and interactions between the genotype and the environment [
19,
20,
21]. The distribution of individual components (minerals) in different parts of the tuber is uneven.
4.2. Dry Matter Content
Taro has a rather low dry matter content and thus a high moisture content, accounting for two-thirds of the total fresh root weight [
25,
26]. The dry matter content of taro varies according to the variety, growing conditions and harvest time. Overall, the dry matter content is 27–40% of the roots [
14]. Diversity of the dry matter of varieties, depending on the variety and part of tubers, is presented in
Table 7. The lowest average dry matter content (19.5%) was produced by the Vu 1654 variety, and the highest (35.8%)—Vu 360. The dry matter content was different in all tuber sections. The varieties Vu 105, Vu 360, Vu 372, Vu 384, Vu 1765 and Vu 1822 showed the highest values in the middle and upper parts, Vu 468 in the middle and Vu 1654 in the lower part (
Table 7). However, the differences were not large and may have been caused by differences in the lengths of the growing periods and the size of the tubers. The differences in the dry matter content between the cultivars revealed that they are closely related to the consumption quality of tubers. Varieties with a high dry matter content turned out to be more desirable for edible purposes than varieties with a low dry matter content [
14] (
Table 7 and
Table 8).
4.3. Starch
Taro has 70–80% starch in the dry weight of tubers [
27]. Due to the small size of the starch granules (1–4 m in diameter), taro is easily digestible and as such has been used in the preparation of baby food in Hawaii and other Pacific islands. Taro starch is considered to be easily digestible and is therefore widely used in infant foods and in the diets of gluten-allergic and lactose-sensitive children [
27]. Taro starch, due to its small grain size, is used in industrial applications [
27]. The very small size of taro starch granules makes them ideal for cosmetic formulations such as face powder and for dusting preparations that use aerosol dispensing systems. Despite these uses, large-scale extraction and utilization of starch from taro tubers is nowhere practiced. So, taro starch can get attention in the pharmaceutical research field. Taro starch is an easily digestible starch, because fine and very fine starch grains have hypoallergenic properties (low susceptibility to allergy), and the starch is gluten-free. Taro starch is also good for patients with peptic ulcers, patients with pancreatic disease, chronic liver problems and inflammatory bowel disease and gallbladder disease [
28]. The size of the starch grains varies depending on the variety and ranges from 1.5 to 6.6 μm. The shape of the grains is polygonal. Taro starch contains about 50% less amylose than amylopectin, which is higher compared to other species. The amylose/amylopectin ratio is 1:7. The taro starch forms a clear and soft paste similar to potato starch. The starch gelatinization temperature depends on the variety and ripeness at the time of harvesting and is lower with age, ranging from 63–73 °C. [
14,
27]. Taro is grown for the starch of the corm eaten baked or cooked and processed into snack foods (chips or fries) to cater for the growing city markets. Most consumers prefer unsweet taros.
The high content of sucrose (non-reducing sugar), glucose and fructose (reducing sugars) in taro tubers is undesirable as they can brown snacks. Taro breeding to improve tuber quality is complex and phenotypic batch selection is impaired by a long growth cycle and low vegetative reproductive rate. Therefore, it requires high-throughput phenotyping tools and the selection of suitable hybrids in early clonal generations. Individual sugars are worth 60 hybrids exhibited by four different breeding programs that were compared with 300 varieties from six different countries. The average total sugar content in
C. esculenta ranges from 1.83 to 6.28% FW in hybrids and from 1.32 to 7.69% FW in established, population varieties. The sucrose/reducing sugar ratio varies from 0.06 to 4.34% in hybrids and from 0.04 to 4.82% in fixed varieties. This technique can be used in taro breeding programs for early detection of unwanted hybrids with high levels of reducing sugars [
28]. The chemical composition of the sugars is presented in
Table 9.
Fresh taro tubers are often sold as French fries and can cater to the ever-growing market for these snacks. The high content of sucrose (non-reducing sugar), glucose and fructose (reducing sugars) in tubers represent undesirable characteristics as they cause browning of the fries (Maillard reaction). The individual sugars are a big problem when preparing taro for French fries, which can be easily replaced by frozen potato fries imported by Fast Foody in tropical countries. Sugars in tubers of Papua New Guinea varieties were identified in order of decreasing importance. They contained the highest levels of fructose (0.4% DW), glucose (0.4%), sucrose (0.1%) and maltose (0.1%). Considerable variation was also observed between different slices of the same tuber, of the same variety grown in different regions. The ratio of sucrose to reducing sugars (S/RS) (
Table 9), indicates that some cultivars have this ratio lower than 1.00 and represent genotypes with a higher reducing sugar content than sucrose. There are also taro genotypes that contain five times more sucrose than reducing sugars, revealing the extent of their variability [
28].
4.4. Protein
Taro contains approximately 11% protein by dry weight of tubers. This is more than the protein content of yam, cassava or sweet potato. The protein fraction is rich in essential amino acids such as: threonine, leucine, arginine, valine and phenylalanine. The essential amino acids include methionine, lysine, cystine, phenylalanine, and leucine, and the leaves are relatively more abundant than tubers. The protein content of the tuber is higher around the circumference of the tuber than in its center. This suggests that tubers should be peeled very thinly, otherwise a significant amount of protein may be lost during peeling.
C. esculenta leaves contain approximately 23% protein by dry weight [
25]. Taro leaves are richer in protein than tubers. Taro contains more protein than other root crops due to the presence of symbiotic soil bacteria in its root and rhizome parts [
29]. The abundance of these symbiotic bacteria in soils help taro plants to grow under a variety of environmental and ecological conditions [
30]. These properties have economic and ecological importance for the environment.
4.5. Lipids
Taro’s fat content is very low and consists mainly of cell membrane lipids and is also variable among varieties. Overall, the fat content of taro tubers ranges from 0.3–0.6% [
25,
30].
Crude Fibers
Taro contains dietary fiber. In studies on six cultivars in Cameroon and Chad, it was found that the crude fiber content in taro varied from 0.3–3.8% [
26]. Taro grown in American Samoa has an even greater range of total, soluble, and insoluble fiber (5.02–9.01%) [
31,
32,
33].
Crude fiber has many desirable functional properties. They include facilitating nutrition, helping in the micro-supply of components and glucose metabolism, as well as slowing down the process of absorption of undesirable dietary components such as cholesterol, they also shorten the intestinal transit time, lower the concentration of total and Low Density Lipoprotein (LDL) cholesterol in the blood, reduce postprandial glucose levels and of insulin in the blood, acts as a buffer and reduces excessive acid secretion in the stomach, prevents constipation, increases the water absorption of food, can increase food stability by modifying the structure and density of food, giving it texture, the form of a gel in food, and the ability to thicken food [
33,
34].
4.6. Mineral Compounds
Ash
Taro contains a fairly large amount of ash. Its amount in taro ranges from 3.54–7.78%. Essential minerals, like inorganic substances, are present in all body fluids and tissues and play an important role in metabolism and physicochemical processes, such as maintaining pH and osmotic pressure, muscle contractions, and gas transport. These minerals are important components of enzymes and hormones, crucial for bone formation and vitamin synthesis [
35,
36]. People require a sufficient intake of many mineral elements, depending on their needs. Taro is a very good source of minerals, including potassium (2271–4276.06 mg/100 g), sodium (82–1521.34 mg/100 g), magnesium (118–415.07 mg/100 g), calcium (31–132 mg/100 g), phosphorus (72.21–340 mg/100 g), iron (8.66–10.8 mg/100 g), zinc (2.63 mg/100 g), copper (1.04 mg/100 g). A high ratio of potassium to sodium is recommended for patients with high blood pressure [
36,
37,
38].
Table 10 presents the content of basic elements in tubers, calculated on their dry weight, as well as their minimum, maximum and coefficients of variation. Potassium turned out to be the most stable element, and zinc the most variable [
36,
37].
For example, calcium oxalate is more concentrated in the distal part. Peeling, and especially deep peeling, can significantly affect the concentration of minerals accumulated in individual parts of the tuber. The uneven distribution of minerals in C. esculenta tubers results from their morphological and anatomical structure as well as from the stages of physiological development. The breakdown of taro occurs when the storage organ begins to grow and continues throughout the growing season. C. esculenta is characterized by continuous divisions with an almost linear increase in fresh and dry matter. The constant breakdown of aroids makes them similar to sugar beets.
Taro tuber includes tissues produced during two consecutive seasons: (1) tissue from the previous season (tuber base) and (2) tissue from the current growing season (tuber rest) [
19,
36,
37]. The distribution of the various minerals in the tuber varies depending on the element. The distribution of essential or potentially toxic elements in the tuber flesh (in the tissues used in human nutrition) is generally little known. Data on the chemical composition of the marginal part is also needed for regulation during peeling. If essential minerals are dominant in the outer part, exfoliation or peeling should be limited to a very thin layer, but deeper, if there are harmful or undesirable substances in this part.
Mergedus et al. [
37] found that P, Mg, Zn, Fe, Mn, Cu and Cd are found mainly in the upper part of the tuber, in the central part K, P, Mg, Zn, Fe, Cu and Cd are concentrated, and Ca is concentrated in the lower and marginal parts of
C. esculenta tubers. The central part is always the most important from a nutritional point of view, but in order to increase the tuber yield it is necessary to reduce the amount of waste due to the removal of the marginal part. Data on the chemical composition of the four main tuber parts may also be useful in tuber processing, especially in the popular taro chips industry. Horizontal slices in the top should be avoided or parts with undesirable chemical composition should be removed. The youngest tissue is always in the upper part of the tuber (near the shoot). This part is of low edible quality (watery tissue with a low dry matter content). Data on the mineral composition of the tuber and the distribution of individual elements in the tuber can aid in the development of macro- and micronutrient biofortification programs in taro cultivation.
4.7. Anti-Nutritional Factors of Taro
The anti-nutritional factors that limit the use of taro have negative implications for taro as a food, but these also have positive effects on taro as a crop that can be grown with minimal pesticide use. The main anti-nutritional components found in taro are: mucus, oxalic acid, tannins, cyanides, alpha lectins, amylase inhibitors, protease (trypsin and chymotrypsin), and inhibitors [
37].
Oxalic acid and oxalates are the main limiting factors in the use of taro. Their presence gives a pungent taste or causes irritation when consumed raw or unprocessed food. This pungent taste and stiffness are caused by calcium oxalate crystals like needles, raffids, which can penetrate soft skin. Then the irritant present in the reefs, possibly a protease, can cause tissue discomfort [
13,
14,
33].
The high concentration of calcium oxalate in the leaves and tubers of plants consumed daily is of concern due to the detrimental health effects associated with high levels of oxalate consumption [
5]. In high amounts, oxalic acid is a poison that is troublesome to humans, and it can also reduce the nutritional value of food by binding to calcium to form calcium oxalate. Calcium oxalates are destroyed by boiling the taro tubers for a long time at 90 °C for 30 min and soaking C for 24 h. Since taro is a food for humans and animals, it is important and necessary to investigate whether the oxalate content of taro leaves poses a risk and whether various tuber preparation and cooking methods can dissolve excess oxalate when consumed as a diet.
4.8. Secondary Metabolites
Muñoz-Cuervo et al. [
38] analyzed 167 cultivars of
C. esculenta and detected 70 substances that absorb UV radiation. These included 6 carotenoids, 35 flavones/flavonols, 6 flavanones, 2 flavanols and one indole. Twenty flavones, which were glycosylated forms of apigenin, luteolin and chrysoeriol. These compounds give the broths a yellow color and determine the chemotype of a low number (approx. 10% of varieties). Their accumulation is negatively correlated with the flavanones that were first recorded in taro. Orange flesh tubers are characterized by a high level of β-carotene. Nevertheless, chemotypes based on secondary metabolites did not show any pattern of geographic distribution [
38,
39].
4.9. Healing Values of Taro
In addition to being used as a staple food, tropical bulbous plants are also popular for their healing properties. Many of them are used in the preparation of Ayurvedic medicines and for many diseases. They are also used as stimulants, tonics, carminatives, diuretics and expectorants.
C. esculenta also offers a number of potential health benefits, including better blood sugar control. Vitamin C and a complex of B vitamins, such as niacin, riboflavin and thiamine, important for the diet are present in significant amounts in taro tubers and leaves, but are not sufficient, but significant amounts of dietary fiber are significant and important [
40]. Taro leaves are rich in beta-carotene, iron and folic acid, protect against acidosis, and contribute to the prevention of kidney stones [
15,
25,
33,
34]. Tubers have therapeutic value and are used to treat tuberculosis, ulcers, pulmonary congestion, fungal infections, to lower body temperature in a feverish patient, and other ailments. Phytochemicals are responsible for the healing effects of many plant species.
They also have the ability to treat a variety of ailments through their potential anti-inflammatory, antibacterial, antioxidant, antidiabetic, anti-hepatotoxic and antimelanogenic properties. Natural products from medicinal plants, whether in pure form or in extracted form, provide opportunities for new drugs due to the unmatched availability of chemical diversity. Due to the increasing demand for chemical diversity, therapeutic drugs from herbal products are being sought in screening programs. Recent studies have proven the presence of bioactive compounds in taro, such as flavonoids, steroids, β-sitosterols, etc., which have confirmed health properties [
15,
21,
41,
42,
43]. Nowadays, when the consumer demands natural ingredients that integrate food products, taro has greater possibilities of application not only in the food industry, but also in the pharmaceutical industry.
5. Taro [Colocasia esculenta (L.) Schott] in Africa
In many parts of the world, (especially, African countries), roots and tubers such as cassava (
Manihot esculenta), sweet potato (
Ipoemea batatas), yam (
Dioscorea sp), and cocoyam (
Colocasia esculenta and
Xanthosoma sagittifolium), are important staple crops commonly cultivated by smallholder farmers and used as food security and income crops [
11,
44]. Taro production in Africa (especially SSA) is commonly by smallholder, resource-limited and mostly female farmers [
3]. However, the crop is mostly referred to as “poor man’s crop” because its consumption is mainly by the low income households in the society [
3]. As mentioned above, Africa contributed to over 70% of global taro production consistently in the past two decades and accounted for about 76 percent of world share in 2000 but, witnessed a slight decline in production levels in two decades attaining 72.27% (7.6 million tonnes) share of world total production in 2019 (
Table 10) [
11]. Despite the global recognition of taro production in Africa, the crop has suffered serious neglect, receiving little attention from agricultural researchers and government policymakers [
3,
43,
44,
45,
46].
The world is faced with enormous task of providing sufficient food for over seven billion people, with 690 million people suffering from hunger globally, Africa region accounted for 73 million out of the 135 million people suffering from acute food insecurity in 2019 [
47,
48,
49,
50,
51,
52,
53]. Hunger and malnutrition continue to escalate as the world’s food system is being threatened by the emergence of COVID-19 pandemic in December 2019. The attendant total and partial lockdowns in many countries has led to increased level of hunger and food insecurity. The situation in Africa is the one referred to as “a crisis within a crisis” with very high prevalence of hunger and malnutrition in most Africa countries. African governments need to intensify efforts in boosting agricultural production and keeping the food value chain active in order to stem the tide of hunger and food insecurity in the continent [
54,
55,
56,
57,
58,
59,
60].
However, one of the means of reducing the level of hunger and protein-energy malnutrition in Africa (especially SSA) is through increased production and consumption of indigenous staples of high energy content such as taro [
61,
62]. Taro is recognized as a cheaper yam substitute, notably during period of food scarcity (hunger season) among many households in SSA (especially Ghana and Nigeria) and its production remained an integral part of many smallholder farming households in many parts of West and Central African countries [
3]. It is worthy of note that, most of the output that placed Nigeria as number one taro producer globally and other high producing African countries like Cameroon, Ghana, Madagascar and Burundi (
Figure 3) are carried out by smallholder rural farmers employing primitive technology and traditional farming practices with limited intensive management system [
3,
11]. Taro leaves and tubers possess excellent nutraceutical and healing properties. Thus, its increased production and consumption should be encouraged because of these properties in addition to its usefulness as a food security staple.
5.1. Recent Taro Productivity and Yield Potential in Africa
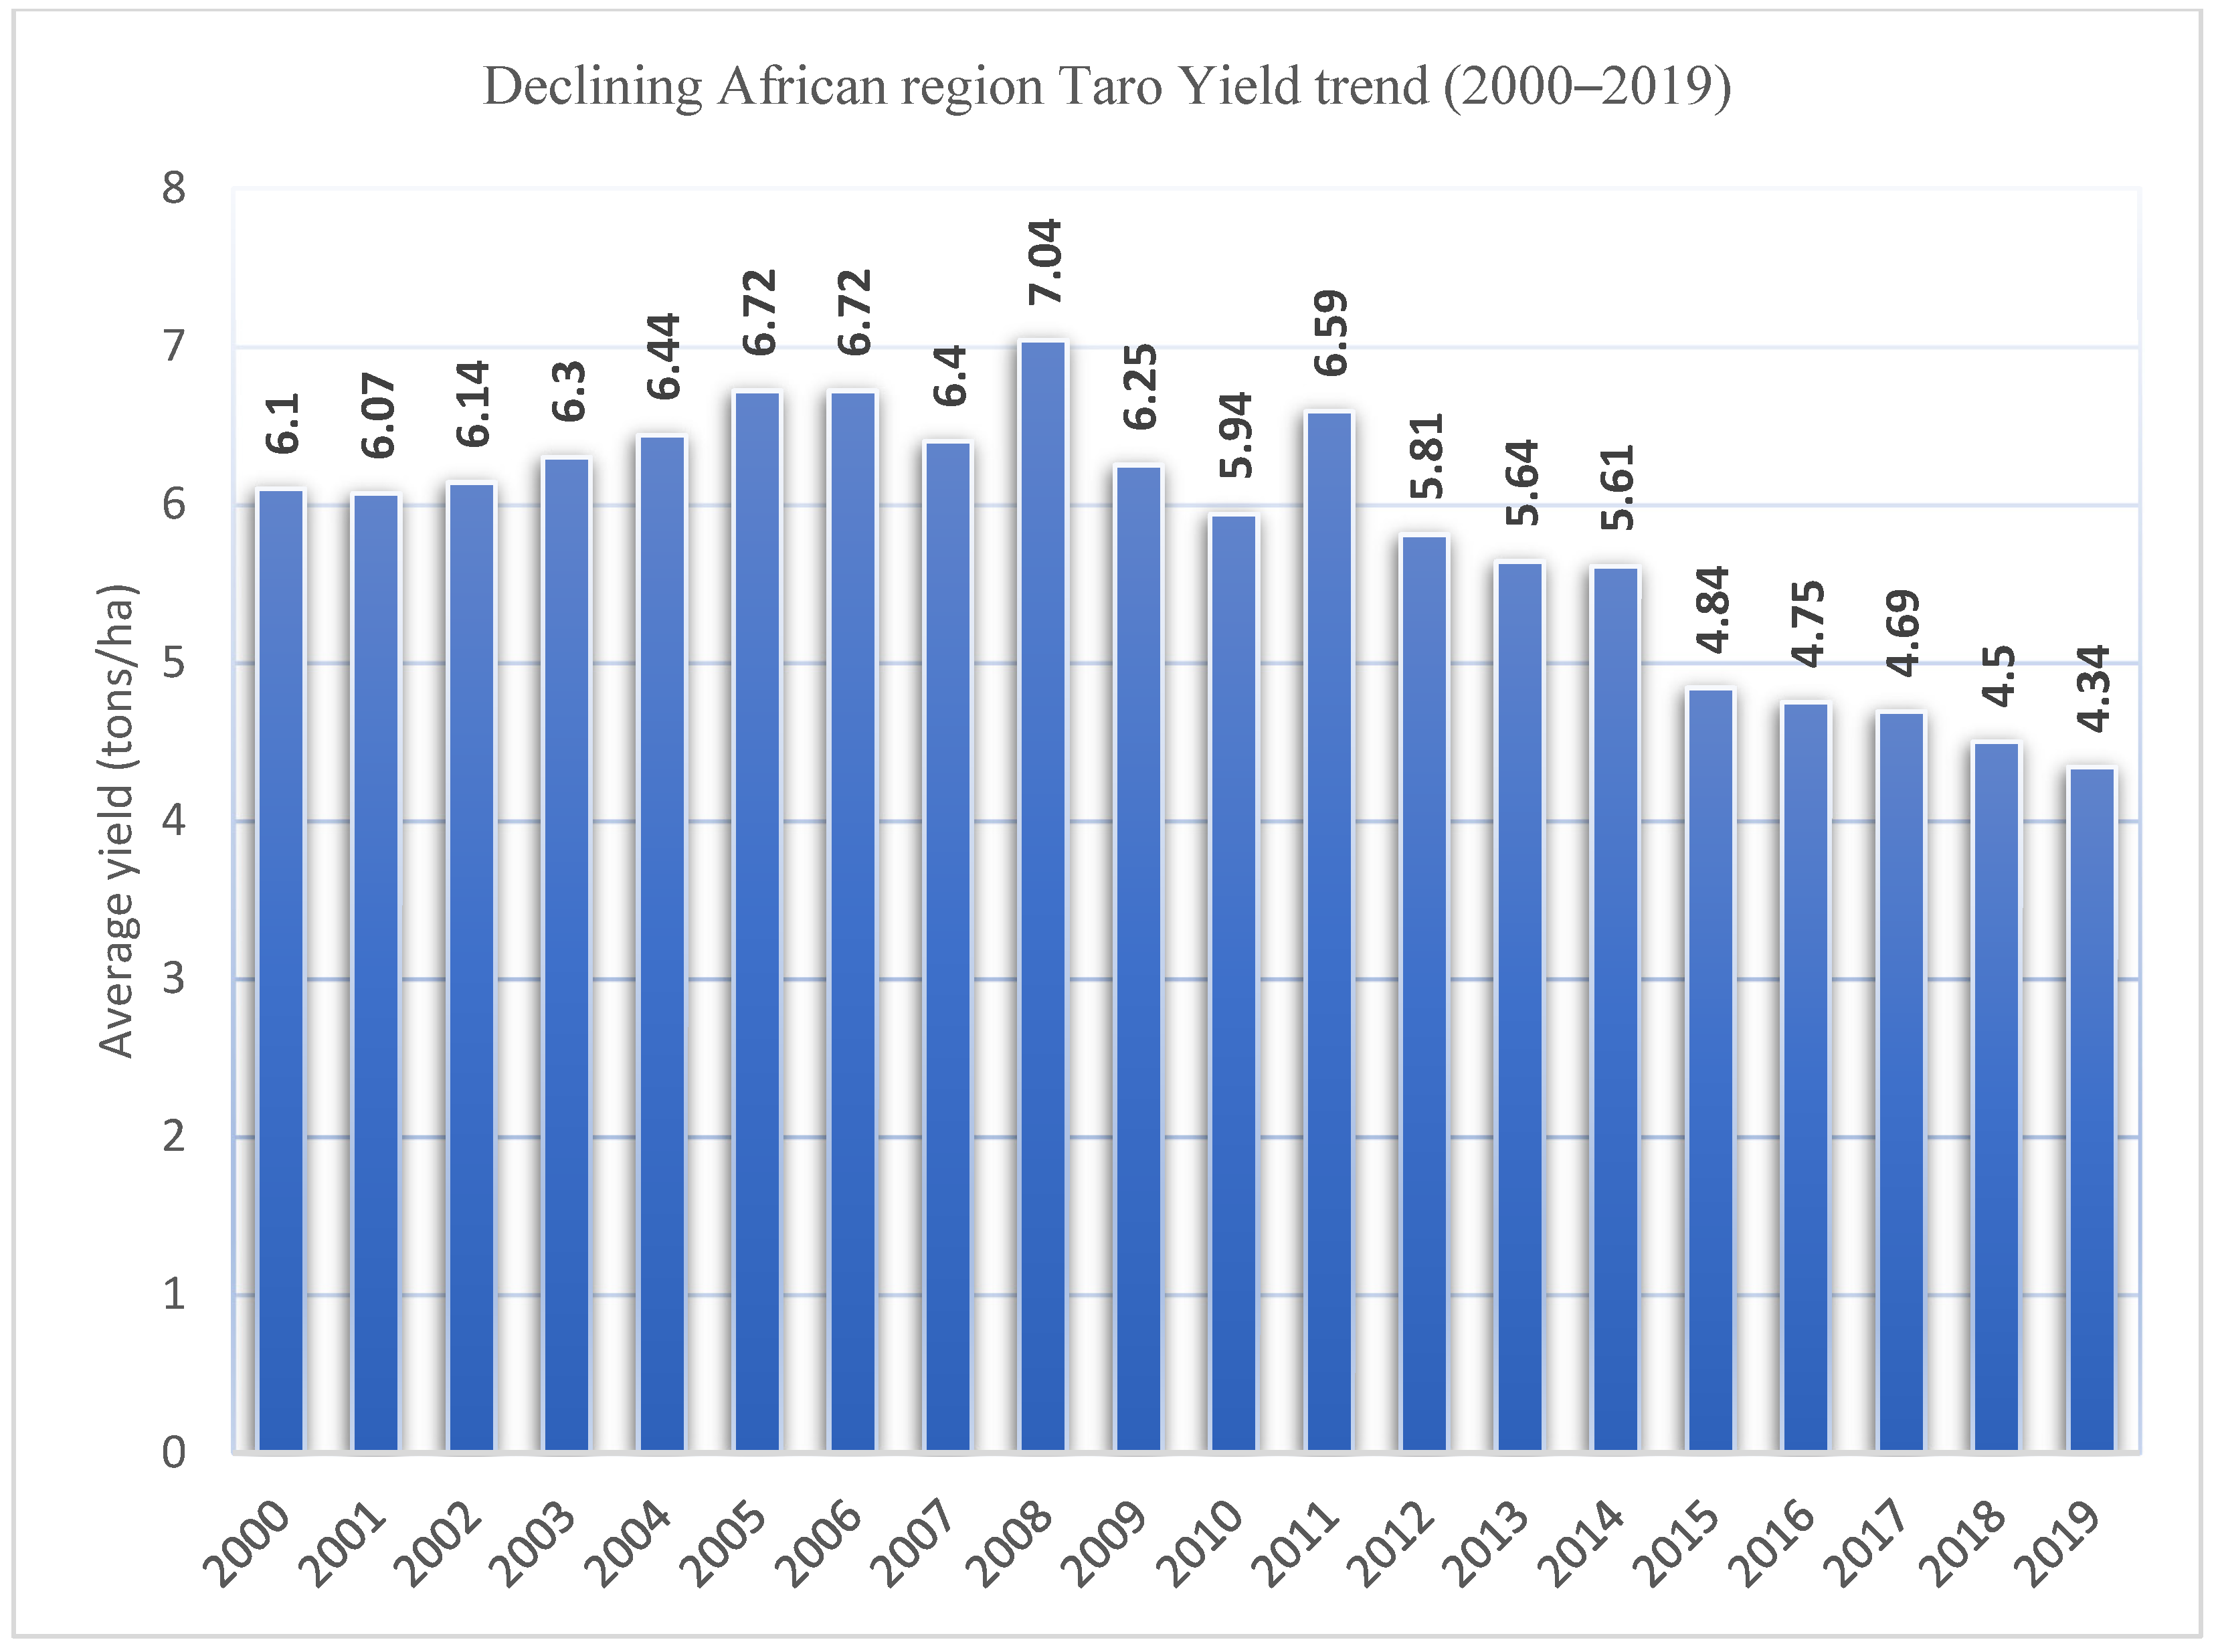
Total output of taro has witnessed significant increase in Africa, (mostly in West and Central Africa) where total production level in 2019 reached 7.62 million tonnes (the highest in 2 decades) (
Table 1). However, these were largely due to increased harvested area rather than increase in yield per land area [
11]. The average yield per land area (tons/ha) in Africa has consistently remained relatively low (
Figure 4), from 6.10 tons/ha in 2000 to abysmally low 4.34 tons/ha in 2019 while Nigeria (
Figure 5) the leading taro producer was not spared in the declining trend of taro yield per land area in Africa, decreasing from 6.62 tons/ha in 2000 to 2.88 tons/ha in 2019 [
11]. Consequently, while other taro producing regions experienced significant increase in their yield per land area from 2000 to 2019, Africa recorded a monumental decrease in taro yield per land area in this period (
Table 11 &
Figure 4) [
11]. African region recorded the lowest taro yield per land area in 2019 (
Table 11) when compared with other regions such as Asia (16.50 tons/ha), America (10.41 tons/ha), and Oceania (8.73 tons/ha). This unprecedented yield difference in Africa is indicative of the fact that current yield of taro (cocoyam) in the region (especially West and Central Africa) is far below its potential yield. This could be attributed to the fact that taro production in Africa is largely with limited input and mostly cultivated on marginal lands. The culture of merely increasing production level through increased area of farmland is obviously unsustainable, because it resulted in high demand for available land.
Increased taro production is a worthwhile venture. There are industrial, nutraceutical and healing uses for the crop both within and outside any of the producing countries. Exporting taro to other countries will boost the revenue base of the producing countries; livelihoods of the smallholder farmers and other actors along the value chain would also be enhanced.
5.2. Taro Trade Potentials in Africa
The unprecedented increase in total output of taro in Africa (especially, West and Central Africa) in the last two decades indicated that there could be further increase in another decade to come. The estimate from Tridge [
12] in 2018 indicated that China (with export value of
$417.18 million) remained the number one exporter of taro, followed by Mexico (
$264.49 million), USA (
$161.01 million) and Canada (
$141.96 million) (
Figure 1). However, no top taro producing countries from sub-Saharan Africa, which accounted for over 70% of global share of taro production in two decades (2000–2019), was listed among the top 20 cocoyam exporting countries (
Figure 1). This may be due to the difficulty in obtaining consistent and reliable data on taro import and export for most African countries. Although 65% of the global taro production is accounted for by Africa in 2019 [
11], there is insufficient information on the contribution of taro from these top producing countries to the international taro market. Apart from poor data on trade in taro in Africa, it could also be due to the fact that taro production in SSA is mainly for meeting local needs for food security [
3].
In 2018, the three major importers of taro are USA (
$768.68 million), Japan (
$227.10 million) and United Kingdom (
$157.17 million) (
Figure 3). Like taro exports, no top producing African countries was listed among the top 20 importers of taro in 2018. There is enormous trade potentials for taro markets in Africa both within (between countries in Africa) and outside the region. There is urgent need to improve taro production and marketing structures in Africa in order to maximize of its gains for economic empowerment [
3,
12].
5.3. Challenges of Taro in Africa
The non-existent of effective research and policy interventions for the increased production and marketing (international trade) of taro in most African countries (especially SSA) has left the crop as an unpopular and under-utilized root and tuber crop when compared with other root and tuber crops such as cassava, yam and potato. The consistent increase in production levels (although with increasing reduction in yield per land area—
Figure 4) of taro in most high producing Africa countries (Nigeria, Cameroon and Ghana) has not attracted the international market for more than three decades [
3,
6,
63,
64]. Taro production in most major African growing areas has remained at subsistence level with farmers depending mainly on traditional farming inputs [
3,
57,
58,
59].
To further worsen the challenges of taro production, consumption and commercialization in Africa, is the emergence of taro leaf blight (TLB) (
Phytophthora colocasiae) in West Africa in 2009 [
3,
64]. The outbreak of TLB was opined to have accounted for more than US
$1.4 billion economic loss annually with enormous impact on the genetic erosion of gene pool in the region [
3]. Taro production is facing continuous decline due to rapid prevalence of TLB. This has resulted in continuous low yield, poor quality corms and reduced commercialization in most taro producing countries [
3,
65].
6. Implications of Taro for Increased Production and International Trade
Increased production of taro has huge implications on African economies and livelihoods. These include substantial foreign earnings from international trade, major addition to available foods commonly used in addressing food insecurity problems in Africa, industrial use as well as nutritional/medicinal values. Therefore, strategies have to be put in place to enhance its production and utilization on the African continent. These strategies as highlighted by [
3,
6] include:
Sensitization on the nutritional/medicinal values and food forms diversities of taro.
Improving the genetic base of taro in Africa through germplasm exchange
Taro production should not be targeted only for local consumption (as food security crop) but towards attracting the international (export) market.
Development of appropriate control measures to eliminate field and storage losses due to TLB and other diseases.
Fabrication of sustainable storage facilities to extend the shelf-life of taro after harvesting.
Establishment of regional network to foster effective collaboration and development of robust strategic approach to taro disease management.
Provision of research funds for agriculture-based institutes and institutions to enable them carry out result oriented researches that will improve the livelihood of both rural and urban households.
7. The Study Limitations
This study is limited to global trade in cocoyam with no consideration for intra-regional trade activities especially within the African region because of lack of data.
The study’s evidence on the level of awareness of the African people on the importance and benefits of cocoyam in their diet is limited.
8. Future Research Areas
Taro [Colocasia esculenta (L.) Schott] is recognized as one of the important root and tuber crops globally with enormous nutritional/health benefits and trade potentials as well as having prospects as sustainable food and nutrition security crop in Africa especially in Sub-Saharan Africa. Taro starch which is considered to be easily digestible could be widely explored in infant foods and in the diets of gluten-allergic and lactose-sensitive children while gaining prominence in pharmaceutical research field. Also, large-scale extraction and utilization of starch from taro tubers can further be enhanced in cosmetic formulations such as face powder and for dusting preparations that use aerosol dispensing systems. The huge trade potentials in taro’s international market can equally be explored especially by the heads of governments of the African producing countries that have contributed more than 50 percent share of global taro production consistently in the last two decades and recently accounted for 72.27% (7.6 million tonnes) share in 2019.
From the study, there is need for continuous research interventions to further explore the detailed molecular properties of the edible parts of Colocasia esculenta in finding better insight to their mechanical and gelatinization attributes for improved use. At present, there is insufficient data on the taro export activities in Africa, it is of utmost importance that African governments provide means of assessing both production and export data of cocoyam to help in harnessing Africa’s opportunities in cocoyam international markets which is capable of improving the economy and livelihood of the people especially, the smallholder households of the cocoyam producing Africa countries. Oxalic acid and oxalates are identified as the main anti-nutritional factors in the use of taro, there is need for robust research interventions on how to destroy calcium oxalates in taro tubers and be sure that oxalate content of taro leaves does not pose a risk to taro consumers’ health.
Author Contributions
Conceptualization, O.A.O. (Olutosin A. Otekunrin); introduction, O.A.O. (Olutosin A. Otekunrin), B.S., O.A.O. (Oluwaseun A. Otekunrin), L.R.; writing-review and editing, O.A.O. (Olutosin A. Otekunrin), B.S., O.A.O. (Oluwaseun A. Otekunrin), A.G.A., L.R.; Funding acquisition, B.S., L.R. All authors have read and agreed to the published version of the manuscript.
Funding
The APC was funded by University of Life Sciences in Lublin, Akademicka 13 str., 20-950 Lubin, Poland.
Institutional Review Board Statement
Not applicable.
Informed Consent Statement
Not applicable.
Data Availability Statement
Not applicable.
Conflicts of Interest
The authors declare no conflict of interest.
References
- Si, H.; Zhang, N.; Tang, X.; Yang, J.; Wen, Y.; Wang, L.; Zhou, X. Transgenic Research in Tuber and Root Crops. Genet. Eng. Hortic. Crop. 2018, 225–248. [Google Scholar] [CrossRef]
- Kreike, C.M.; Van Eck, H.J.; Lebot, V. Genetic diversity of taro, Colocasia esculenta (L.) Schott, in Southeast Asia and the Pacific. Theor. Appl. Genet. 2004, 109, 761–768. [Google Scholar] [CrossRef]
- Onyeka, J. Status of Cocoyam (Colocasia esculenta and Xanthosoma spp) in West and Central Africa: Production, Household Importance and the Threat from Leaf Blight; CGIAR Research Program on Roots, Tubers and Bananas (RTB): Lima, Peru, 2014; Available online: www.rtb.cgiar.org (accessed on 5 February 2021).
- Aguegui, A.; Fatokun, C.A.; Haln, S.K. Protein analysis of ten cocoyam, Xanthosoma sagittifolium (L). Schott and Colocasia esculenta (L.) Schott genotypes. In Root Crops for Food Security in Africa, Proceedings of the 5th Triennial Symposium; International Society for Tropical Roots Crops-Africa Branch (ISTRC-AB): Kampala, Uganda, 1992; p. 348. [Google Scholar]
- Ramanatha, R.V.; Matthews, P.J.; Eyzaguirre, P.B.; Hunter, D. (Eds.) The Global Diversity of Taro: Ethnobotany and Conservation; Bioversity International: Rome, Italy, 2010. [Google Scholar]
- Ubalua, A.O.; Ewa, F.; Okeagu, O.D. Potentials and challenges of sustainable taro (Colocasia esculenta) production in Nigeria. J. Appl. Biol. Biotechnol. 2016, 4, 053–059. [Google Scholar] [CrossRef]
- Onwueme, I.C. Tropical Root and Tuber Crops—Production, Perspectives and Future Prospects; FAO Plant Production & Protection Paper 126; FAO: Rome, Italy, 1994. [Google Scholar]
- Lebot, V. Biomolecular evidence for plant domestication in Sahul. Genet. Resour. Crop Evol. 1999, 46, 619–628. [Google Scholar] [CrossRef]
- Wagner, W.L.; Herbst, D.R.; Sohmer, S.H. Manual of the Flowering Plants of Hawaii; Revised Edition; University of Hawaii Press/Bishop Museum Press: Honolulu, HI, USA, 1999. [Google Scholar]
- Purseglove, J.W. Tropical Crops. Monocotyledons; Longman: London, UK, 1972. [Google Scholar]
- FAOSTAT. Food and Agriculture Organisation of the United Nations Statistical Database; Statistical Division; FAO: Rome, Italy, 2021; Available online: http://www.fao.org/statistics/en/ (accessed on 5 February 2021).
- Tridge. 2020. Available online: https://www.tridge.com/inteligences/taro/ (accessed on 20 September 2020).
- Otekunrin, O.A.; Sawicka, B. Cassava, a 21st Century Staple Crop: How can Nigeria Harness Its Enormous Trade Potentials. Acta Sci. Agric. 2019, 3, 194–202. [Google Scholar] [CrossRef]
- Lebot, V.; Prana, M.S.; Kreike, N.; van Eck, H.J.; Pardales, J.; Okpul, T.; Gunua, T.; Thongjiem, T.M.; Hue, H.; Viet, N.; et al. Characterization of the genetic resources of taro (Colocasia esculenta (L.) Schott) in Southeast Asia and Oceania. Genet. Resour. Crop Evol. 2004, 51, 381–392. [Google Scholar] [CrossRef]
- Bhagyashree, R.P.; Hussein, M.A. Anthepatotoxic effect of Colocasia esculenta leaf juice. Int. J. Adv. Biotechnol. Res. 2011, 2, 296–304. [Google Scholar]
- Lebot, V.; Legendre, L. HPTLC screening of taro hybrids (Colocasia esculenta (L.) Schott) with high flavonoids and antioxidants contents. Plant Breed. 2015, 134, 129–134. [Google Scholar] [CrossRef]
- Ahmed, I.; Lockhart, P.J.; Agoo, E.M.; Naing, K.W.; Nguyen, D.V.; Medhi, D.K.; Matthews, P.J. Evolutionary origin of taro (Colocasia esculenta) in Southeast Asia. Ecol. Evol. 2020, 10, 1–14. [Google Scholar] [CrossRef]
- Reichstädter, M. Application of Diffusive Gradients in Thin Films Technique in Food- and Environmental Analysis. Ph.D. Thesis, Brno University of Technology Faculty of Chemistry, Institute of Food Science and Biotechnology, Brno, Czech Republic, 2020. [Google Scholar]
- Lebot, V. Tropical Root and Tuber Crops: Cassava, Sweet Potato, Yams and Aroids; CABI: Cambridge, UK, 2009. [Google Scholar]
- Lebot, V.; Lawac, F. Quantitative comparison of individual sugars in cultivars and hybrids of taro [Colocasia esculenta (L.) Schott]: Implications for breeding programs. Euphytica 2017, 213, 147. [Google Scholar] [CrossRef]
- Sharma, S.; Jan, R.; Kaur, R.; Riar, C.S. Taro (Colocasia esculenta). In Antioxidants in Vegetables and Nuts—Properties and Health Benefits; Nayik, G.A., Gull, A., Eds.; Springer: Singapore, 2020. [Google Scholar] [CrossRef]
- Hedges, L.J.; Lister, C.E. Confidential Crop & Food Research Report No. 1569 Root and Tuber Health Attributes, March 2006; New Zealand Institute for Crop & Food Research: Christchurch, New Zealand, 2006. [Google Scholar]
- Onwueme, I. Taro Cultivation in Asia and the Pacific; Published in RAP Publication 1999/16; Food and Agriculture Organization of the United Nations, Regional Office for Asia and the Pacific: Bangkok, Thailand, 1999; Available online: http://www.fao.org/DOCREP/005/AC450E/ac450e03.htm#TopOfPage (accessed on 7 February 2021).
- Englberger, L.; Aalbersberg, W.; Ravi, P.; Bonnin, E.; Marks, G.C.; Fitzgerald, M.H.; Elymore, J. Further analyses on Micronesian banana, taro, breadfruit and other foods for provitamin A carotenoids and minerals. J. Food Compos. Anal. 2003, 16, 219–236. [Google Scholar] [CrossRef]
- FAO. Growing Taro in Asia and the Pacific; Food and Agriculture Organization of the United Nations (FAO): Rome, Italy, 1999; Available online: http://ebooks.lib.ntu.edu.tw/1_file/FAO/67652/ac450e00.pdf (accessed on 15 February 2021).
- FAO. Protein Sources for the Animal Feed Industry. (Animal Production and Health); Expert Consultation and Workshop: Bangkok, Thailand, 2004. [Google Scholar]
- Ahmed, A.; Khan, F. Extraction of Starch from Taro (Colocasia esculenta) and Evaluating it and further using Taro Starch as Disintegrating Agent in Tablet Formulation with Over All Evaluation. Inventi Rapid Nov. Excip. 2013, 2, 1–5. [Google Scholar]
- Lebot, V.; Malapa, R.; Bourrieau, M. Rapid estimation of taro (Colocasia esculenta) quality by near-infrared reflectance spectroscopy. J. Agric. Food Chem. 2011, 14, 9327–9334. [Google Scholar] [CrossRef]
- FAO. Importance of Taro. 2008. Available online: http:www.fao.org/docrep/005/AC450e (accessed on 15 February 2021).
- Lucy, M.; Reed, E.; Glick, B.R. Use of free growth in living plants-promoting rhizobacteria. Antonie Leeuwenhoek 2004, 86, 102. [Google Scholar] [CrossRef] [PubMed]
- Nip, W.K.; Muchille, J.; Cai, T.; Moy, J.H. Nutritive and non-nutrient in taro (Colocasia esculenta (L.) Schott) from American Samoa. J. Hawaii Pac. Agric. 1989, 2, 1–5. [Google Scholar]
- Nip, W.K. Taro root. In Taro: Vegetable Processing and Technology; Technomic Publishing: Pennsylvania, PA, USA, 1997; pp. 355–387. [Google Scholar]
- Njintang, Y.; Mbofung, F.; Balaam, F.; Kitissou, P.; Scher, J. Effect of taro (Colocasia esculenta (L.) Schott) addition of functional flour and alveographic properties of flour and wheat dough. J. Agric. Food Sci. 2008, 88, 273–279. [Google Scholar] [CrossRef]
- Biziuk, M.; Kuczynska, J. Mineral Components in Food—Analytical Implication. In Mineral Components in Foods; Chemical and Functional Properties of Food Components Series; CRC Press: Boca Raton, FL, USA, 2006; pp. 1–31. [Google Scholar] [CrossRef]
- Lewu, M.N.; Adebola, P.O.; Afolayan, A.J. Effect of cooking on mineral content and anti-nutritional factors in seven accessions of Colocasia esculenta (L.) Schott growing in South Africa Composition. J. Food Compos. Anal. 2010, 23, 389–393. [Google Scholar]
- Temesgen, M.; Ratta, M. Nutritional Pot and Food Safety Taro Colocasia esculenta (L.): An Overview. Available online: https://www.researchgate.net/publication/318562639_Nutritional_potential_Health_and_Food_Security_Benefits_of_Taro_Colocasia_esculenta_L_A_Review (accessed on 10 February 2021).
- Mergedus, A.; Kristl, J.; Ivancic, A.; Sober, A.; Sustar, V.; Krizan, T.; Lebot, V. Variation of mineral composition in different parts of taro (Colocasia esculenta) corms. Food Chem. 2015, 170, 37–46. [Google Scholar] [CrossRef]
- Muñoz-Cuervo, I.; Malapa, R.; Michalet, S.; Lebot, V.; Legendre, L. Variety of secondary metabolites in taro, Colocasia esculenta (L.) Schott, corms. J. Food Compos. Anal. 2016, 52, 24–32. [Google Scholar] [CrossRef]
- Savage, G.P.; Catherwood, D.J. Determination of oxalate in Japanese taro tubers by an in vitro digestion test. Gastron. Chem. 2007, 105, 383–388. [Google Scholar]
- Brown, A.C.; Valiere, A. Medicinal uses of Poi. Nutr. Clin. Care 2004, 7, 69–74. [Google Scholar] [PubMed]
- Diwedi, P.; Diwedi, J.; Patel, D.; Desai, S.; Meshram, D. Phytochemical analysis and assessment of in vitro urolithiatic activity of Colocasia leaves. J. Med. Plants 2016, 4, 43–47. [Google Scholar]
- Brown, A.C.; Ibrahim, S.A.; Song, D. Poi’s history, uses and role in health. In Fruits, Vegetables and Herbs; Elsevier B. V.: Amsterdam, The Netherlands, 2016; pp. 331–342. [Google Scholar] [CrossRef]
- Rashmi, D.R.; Raghu, N.; Gopenath, T.S.; Pradeep, P.; Bakthavatchalam, P.; Karthikeyan, M.; Gnanasekaran, A.; Ranjith, M.S.; Chandrashekrapp, G.K.; Basalingappa, K.B. Taro (Colocasia esculenta): An Overview. J. Med. Plants Stud. 2018, 6, 156–161. [Google Scholar]
- Owusu-Darko, P.G.; Paterson, A.; Omenyo, E.L. Cocoyam (corms and cormels)—An underexploited food and feed resource. J. Agric. Chem. Environ. 2014, 3, 22–29. [Google Scholar] [CrossRef]
- Chukwu, G.O. Euology for Nigeria’s giant crop. Adv. Agric. Sci. Eng. Res. 2011, 1, 9–13. [Google Scholar]
- Chukwu, G.O.; Okoye, B.C.; Agugo, B.A.; Amadi, C.O.; Madu, T.U. Cocoyam Rebirth: A Structural Transformation Strategy to Drive Cocoyam Value Chain in Nigeria. In (ASURI, NRCRI Book of Readings) Structural Transformation in Root and Tuber Research for Value Chain Development and Employment Generation in Nigeria; ASURI, NRCRI: Umudike, Nigeria, 2017; pp. 216–227. [Google Scholar]
- FAO; IFAD; UNICEF; WFP; WHO. The State of Food Security and Nutrition in the World 2020. In Transforming Food Systems for Affordable Healthy Diets; FAO: Rome, Italy, 2020. [Google Scholar]
- Food Security Information Network (FSIN). 2020 Global Report on Food Crises (GRFC 2020). 2020. Available online: https://www.wfp.org/publications/2020-global-report-food-crises (accessed on 10 January 2021).
- Ayinde, I.A.; Otekunrin, O.A.; Akinbode, S.O.; Otekunrin, O.A. Food Security in Nigeria: Impetus for Growth and Development. J. Agric. Econ. 2020, 6, 808–820. [Google Scholar]
- Otekunrin, O.A.; Otekunrin, O.A. Healthy and Sustainable Diets: Implications for Achieving SDG2. In Zero Hunger. Encyclopedia of the UN Sustainable Development Goals; Springer: Cham, Switzerland, 2021; pp. 1–17. [Google Scholar] [CrossRef]
- Otekunrin, O.A.; Otekunrin, O.A.; Sawicka, B.; Ayinde, I.A. Three decades of fighting against hunger in Africa: Progress, challenges and opportunities. World Nutr. 2020, 11, 86–111. [Google Scholar] [CrossRef]
- Otekunrin, O.A.; Otekunrin, O.A.; Momoh, S.; Ayinde, I.A. How far has Africa gone in achieving the Zero Hunger Target? Evidence from Nigeria. Glob. Food Secur. 2019, 22, 1–12. [Google Scholar] [CrossRef]
- Otekunrin, O.A.; Momoh, S.; Ayinde, I.A.; Otekunrin, O.A. How far has Africa gone in achieving the Sustainable Development Goals? Exploring the African dataset. Data Brief 2019, 27, 1–7. [Google Scholar] [CrossRef]
- Otekunrin, O.A.; Otekunrin, O.A.; Fasina, F.O.; Omotayo, A.O.; Akram, M. Assessing the zero hunger target readiness in Africa in the face of COVID-19 pandemic. Caraka Tani J. Sustain. Agric. 2020, 35, 213–227. [Google Scholar] [CrossRef]
- Otekunrin, O.A.; Ogodo, A.C.; Fasina, F.O.; Akram, M.; Otekunrin, O.A.; Egbuna, C. Coronavirus Disease in Africa: Why the Recent Spike in Cases of COVID-19? In Coronavirus Drug Discovery: SARS-Cov-2 (COVID-19) Impact, Pathogenesis, Pharmacology and Treatment 2020; in press.
- Otekunrin, O.A.; Otekunrin, O.A.; Momoh, S.; Ayinde, A.I. Assessing the Zero Hunger Target Readiness in Africa: Global Hunger Index (GHI) patterns and Indicators. In Proceedings of the 33rd Annual National Conference of the Farm Management Association of Nigeria (FAMAN), Abeokuta, Nigeria, 7–10 October 2019; pp. 456–464. [Google Scholar]
- Otekunrin, O.A.; Fasina, F.O.; Omotayo, O.A.; Otekunrin, O.A.; Akram, M. COVID-19 in Nigeria: Why continuous spike in cases? Asian Pac. J. Trop. Med. 2021, 14, 1–4. [Google Scholar] [CrossRef]
- Kalu, B. COVID-19 in Nigeria: A disease of hunger. Lancet Respir. Med. 2020, 8, 556–557. [Google Scholar] [CrossRef]
- Cucinotta, D.; Vanelli, M. WHO declares COVID-19 a pandemic. Acta Bio Med. Atenei Parm. 2020, 91, 157–160. [Google Scholar] [CrossRef]
- Otekunrin, O.A.; Otekunrin, O.A. COVID-19 and Hunger in Africa: A crisis within a crisis. In Proceedings of the 6th International Conference on Food Science and Technology, Vienna, Austria, 16–17 October 2020; pp. 27–28. [Google Scholar]
- Ogundahunsi, G.A. Estimation of Digestive Energy of Cocoyam Foods: (i) Roasted (ii) Peeled and Boiled (iii) Peeled, Ground and Steamed. Master’s Thesis, College of Medicine, University of Ibadan, Ibadan, Nigeria, 1981; 105p. [Google Scholar]
- Agbelemoge, A. Utilization of cocoyam in rural households in South Western Nigeria. Afr. J. Food Agric. Nutr. Dev. 2013, 13, 7944–7956. [Google Scholar]
- Boakye, A.A.; Wireko-Manu, F.D.; Oduro, I.; Ellis, W.O.; Gudjónsdóttir, M.; Chronakis, I.O. Utilizing cocoyam (Xanthosoma sagittifolium) for food and nutrition security: A review. Food Sci. Nutr. 2018, 6, 703–713. [Google Scholar] [CrossRef] [PubMed]
- Acheampong, P.; Osei-adu, J.; Amengo, E.; Sagoe, R. Cocoyam Value Chain and Benchmark Study in Ghana; CSIR: Accra, Ghana, 2015. [Google Scholar] [CrossRef]
- Mbong, G.A.; Fokunang, C.N.; Fontem, L.A.; Bambot, M.B.; Tembe, E.A. An overview of Phytophthora colocasiae of cocoyams: A potential economic disease of food security in Cameroon. Discourse J. Agric. Food Sci. 2013, 1, 140–145. [Google Scholar]
| Publisher’s Note: MDPI stays neutral with regard to jurisdictional claims in published maps and institutional affiliations. |
© 2021 by the authors. Licensee MDPI, Basel, Switzerland. This article is an open access article distributed under the terms and conditions of the Creative Commons Attribution (CC BY) license (https://creativecommons.org/licenses/by/4.0/).


 ,
, 


