
Flood Hazard Assessment Mapping in Burned and Urban Areas


Abstract
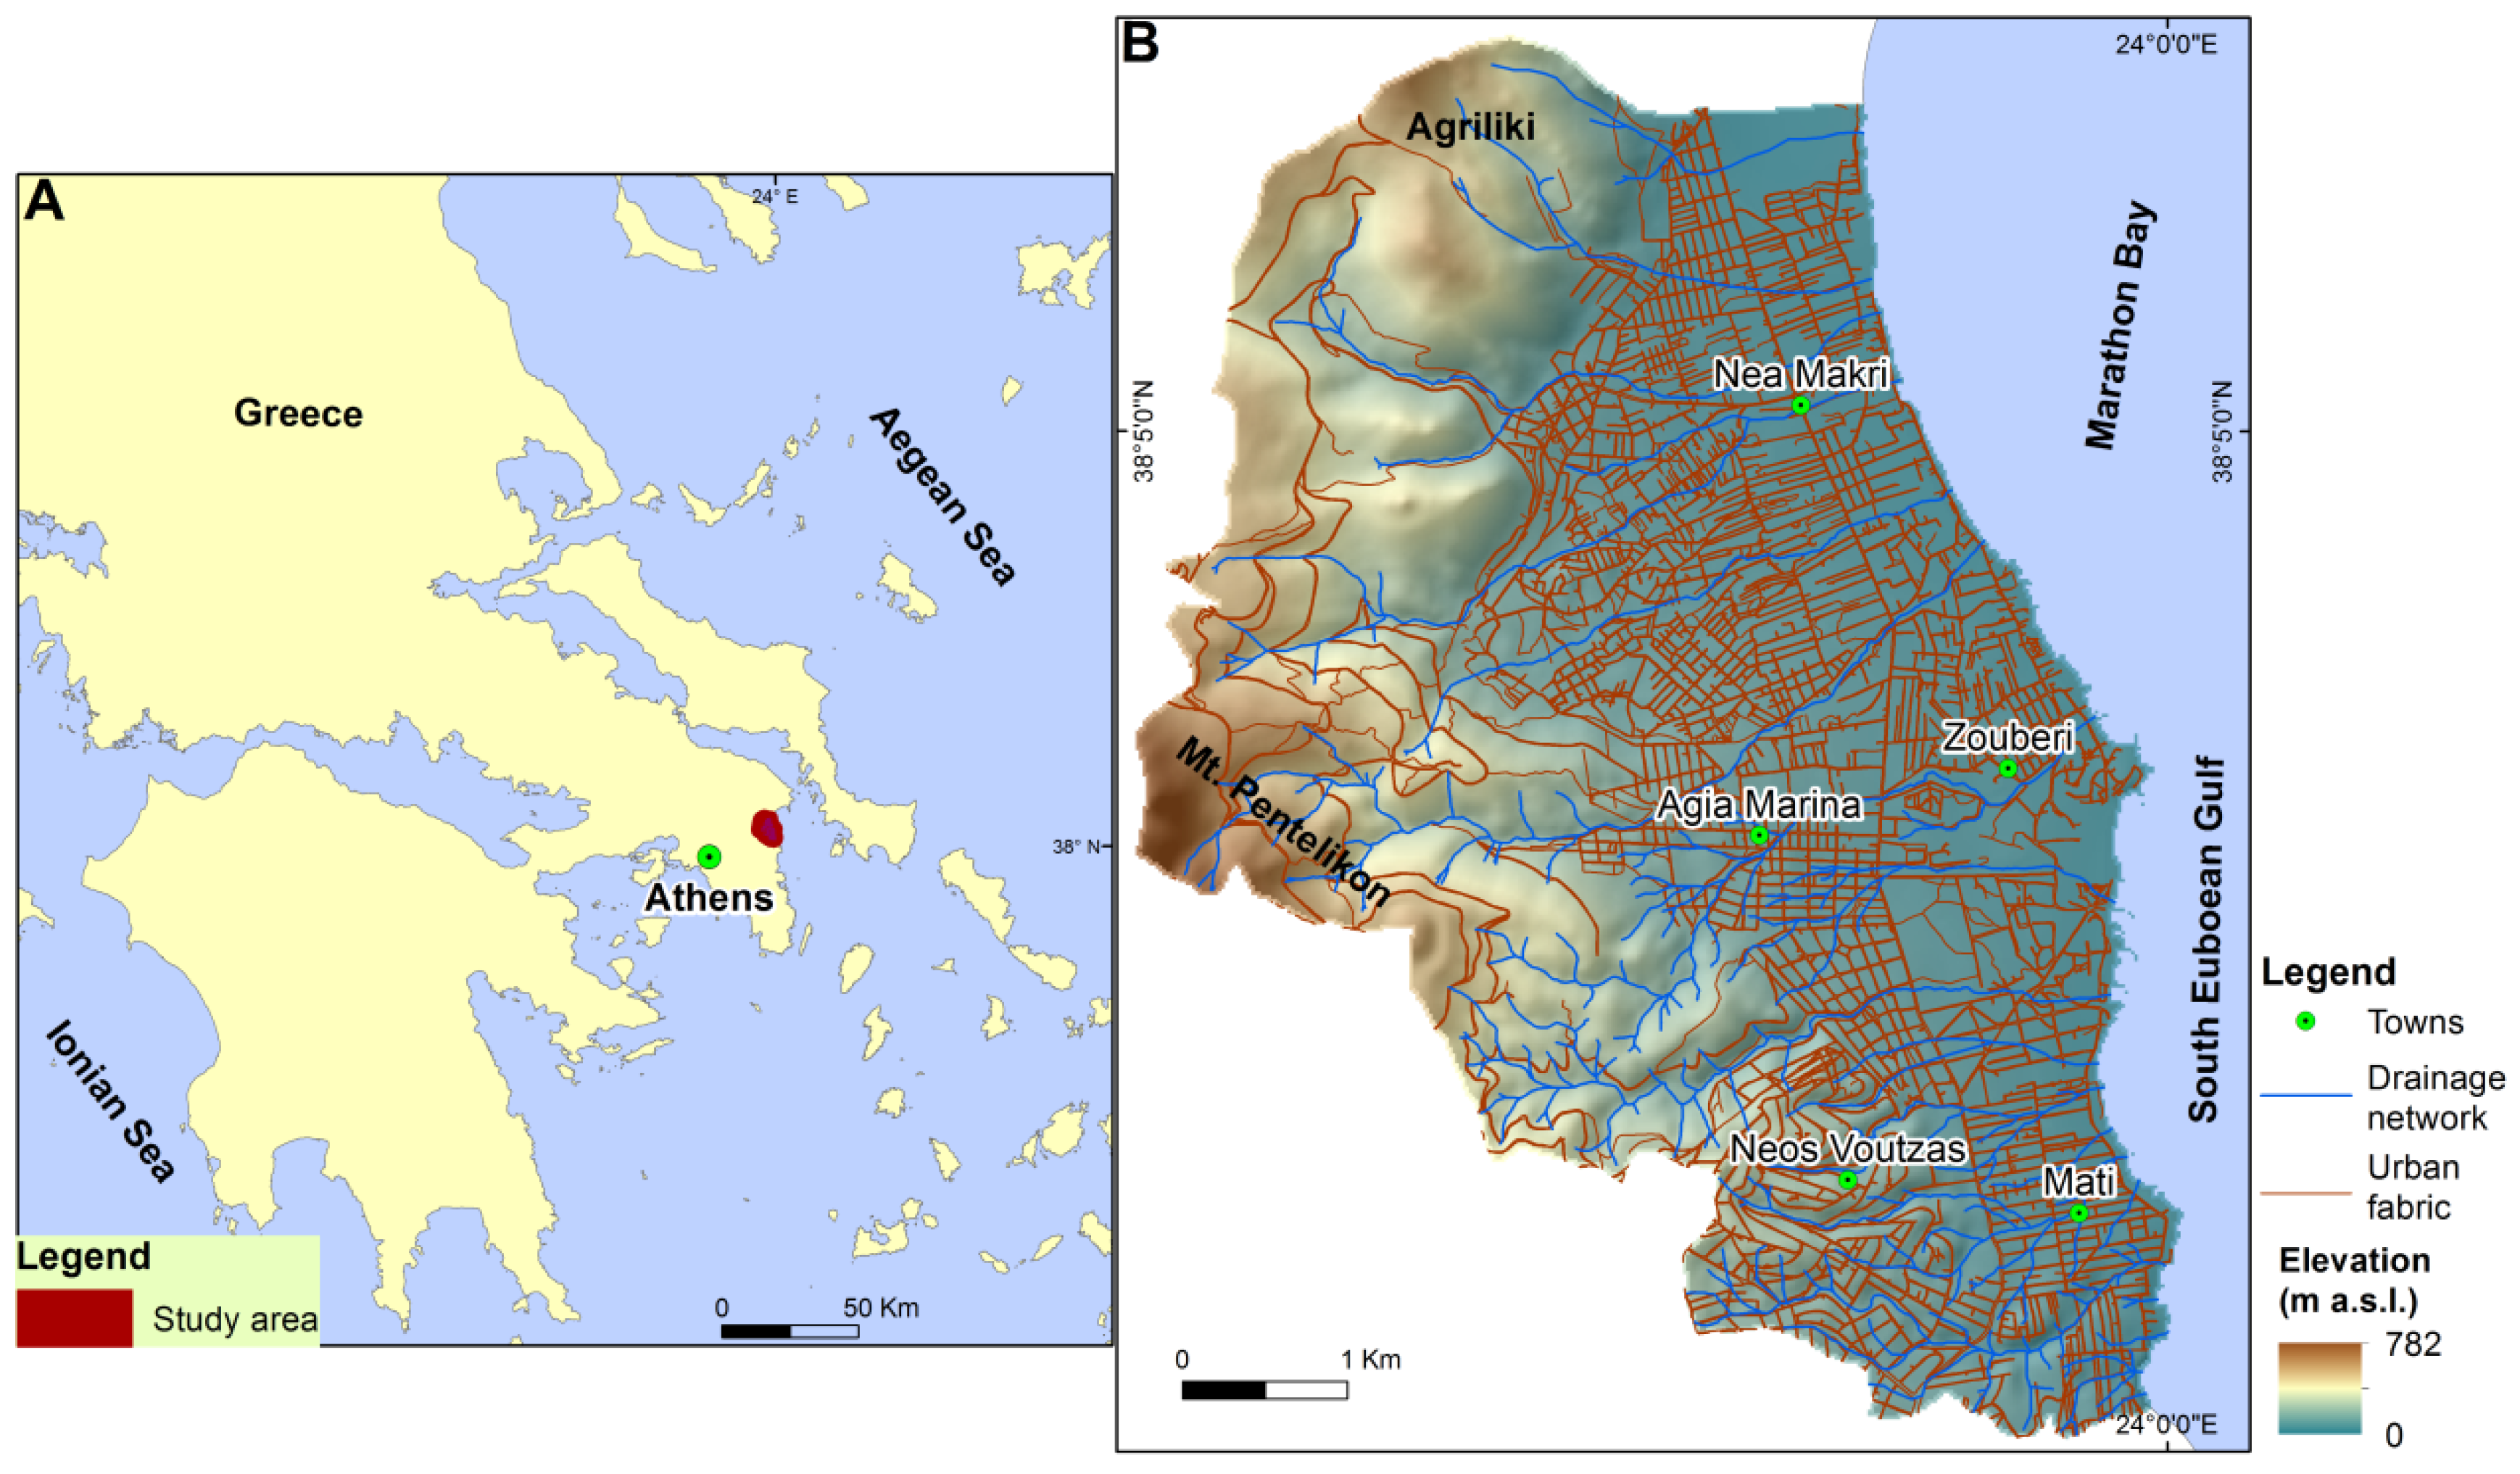
1. Introduction
2. Materials and Methods
3. Methodology
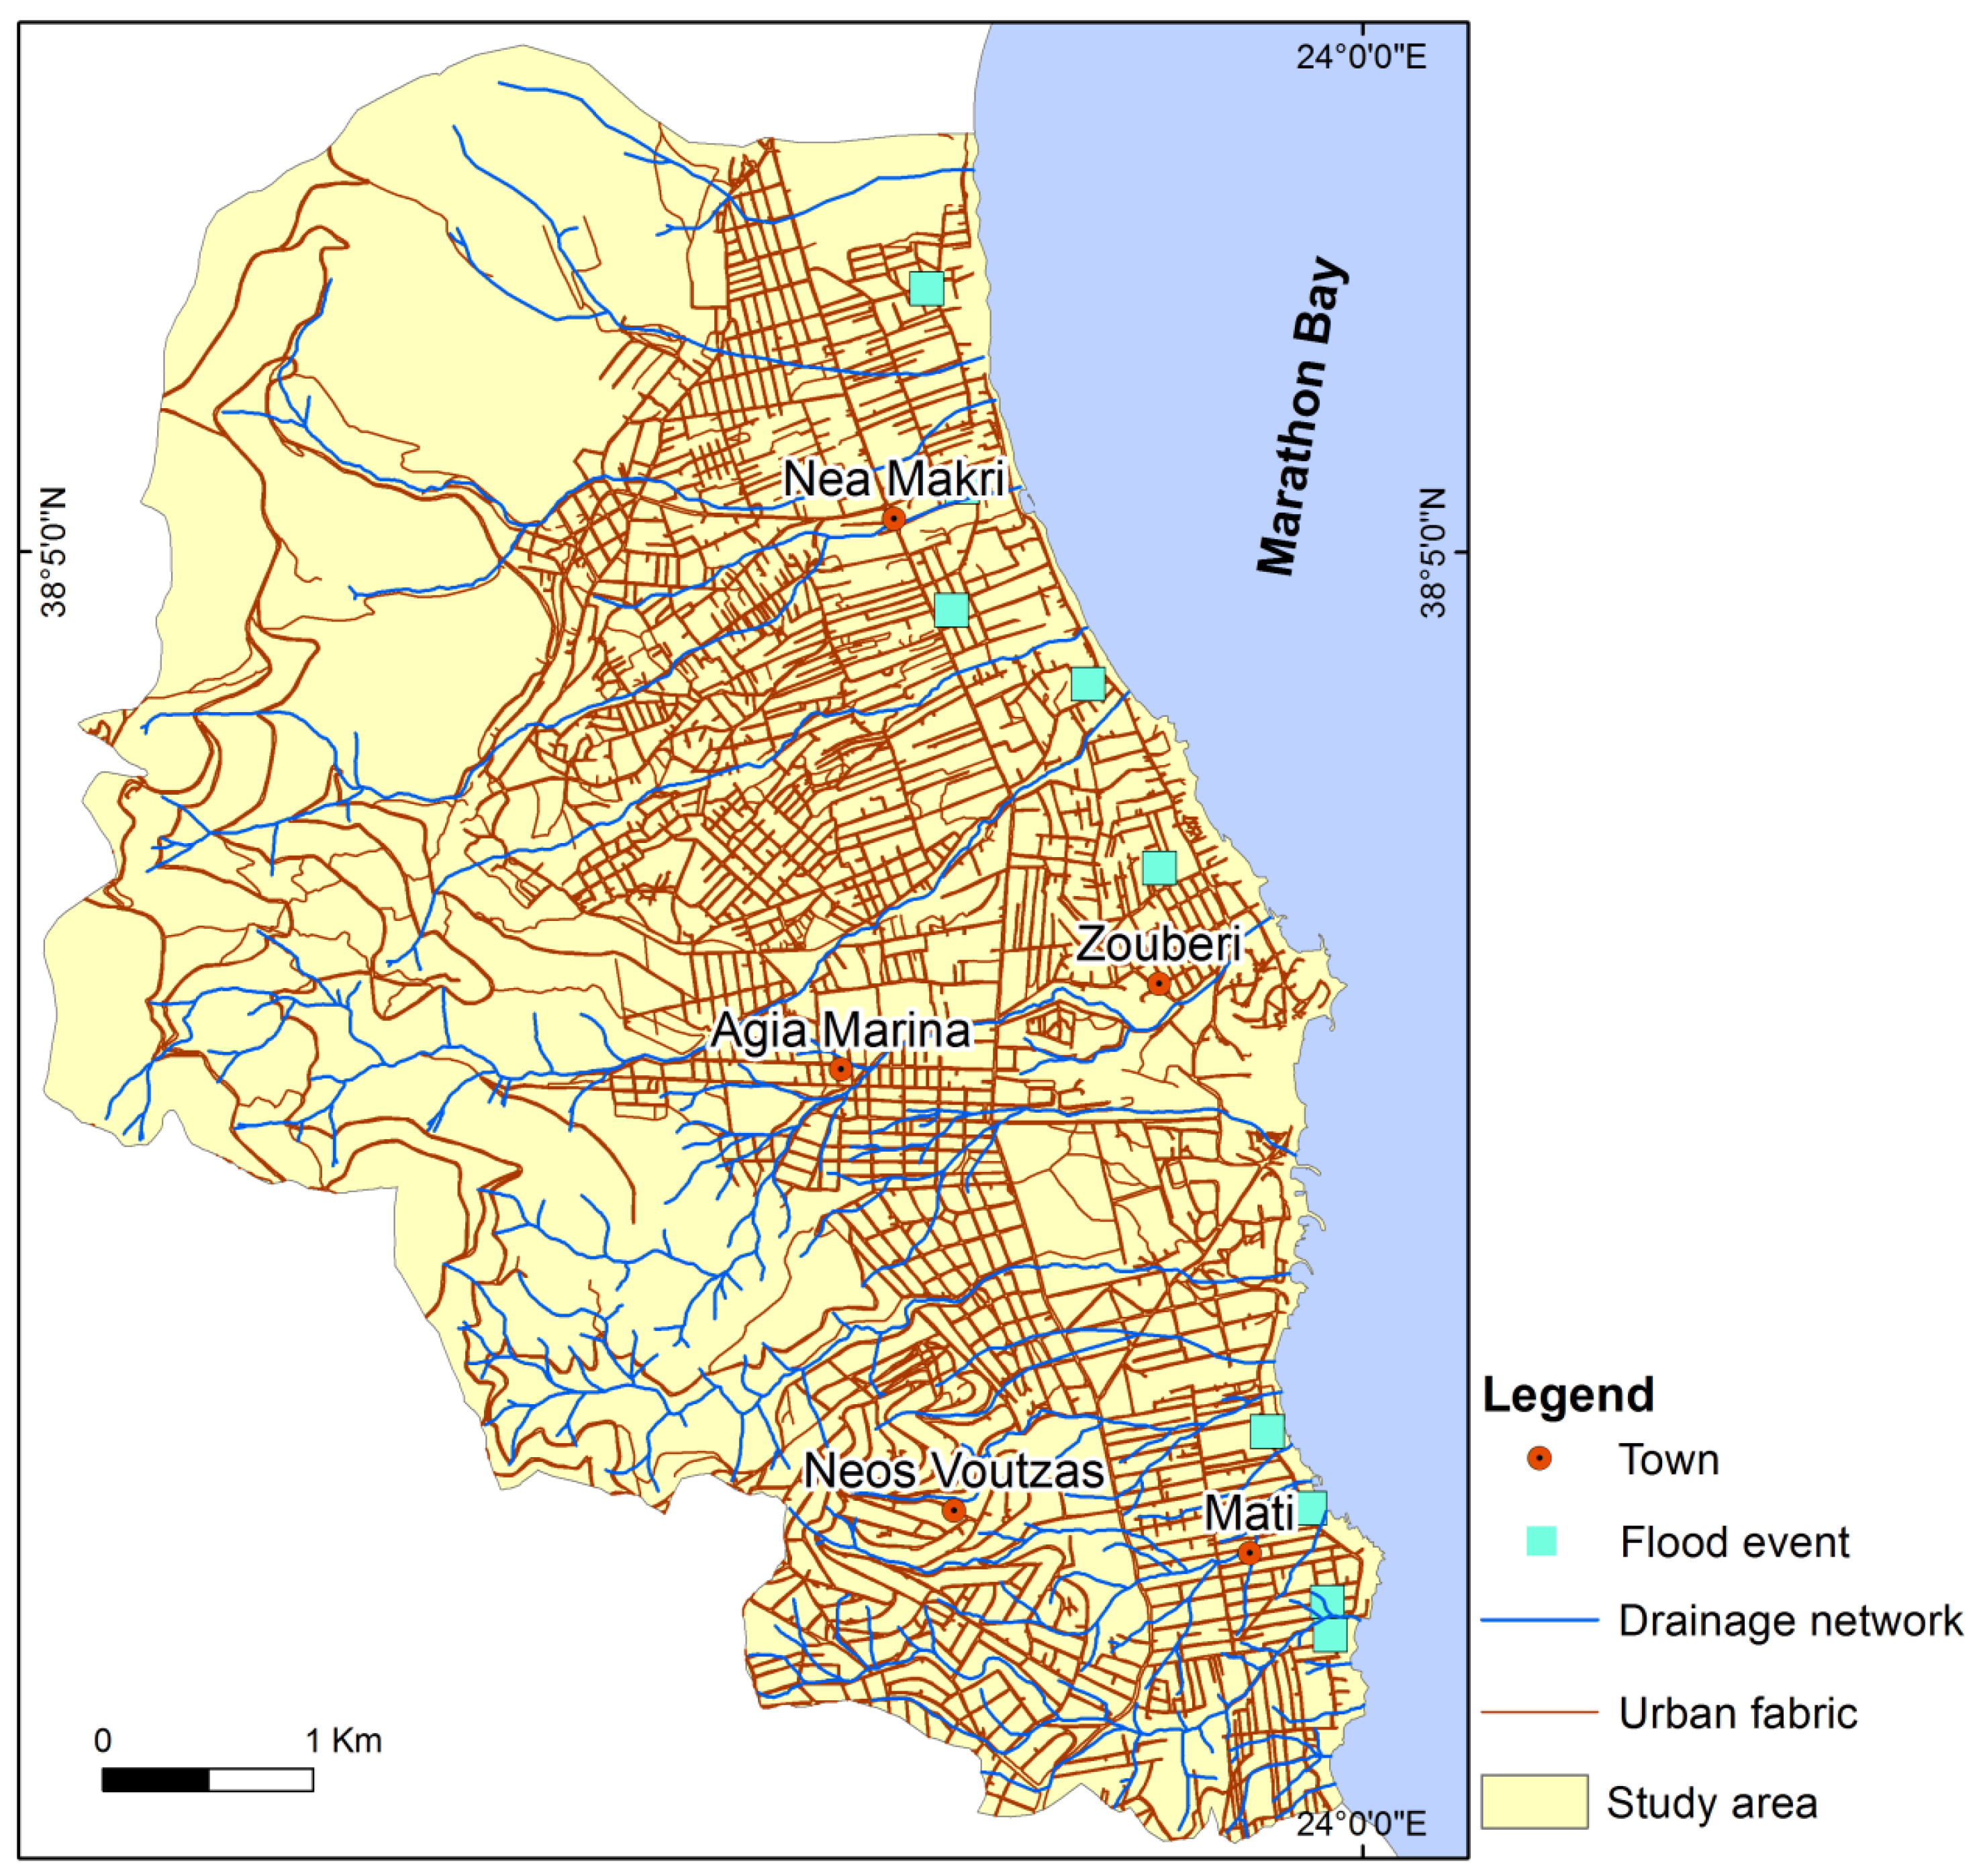
3.1. Data
- topographic maps at different scales (1:50,000, 1:25,000) along with topographic diagrams at scale 1:5000 from the Hellenic Military Geographical Service;
- the geological map sheet Kifisia (scale 1:50,000) from the Institute of Geology and Mineral Exploration of Greece, published in 2002;
- historical flood data [38];
- field data involving observations and mapping of the drainage networks of the study area.
3.2. Applied Method
3.3. Involved Factors
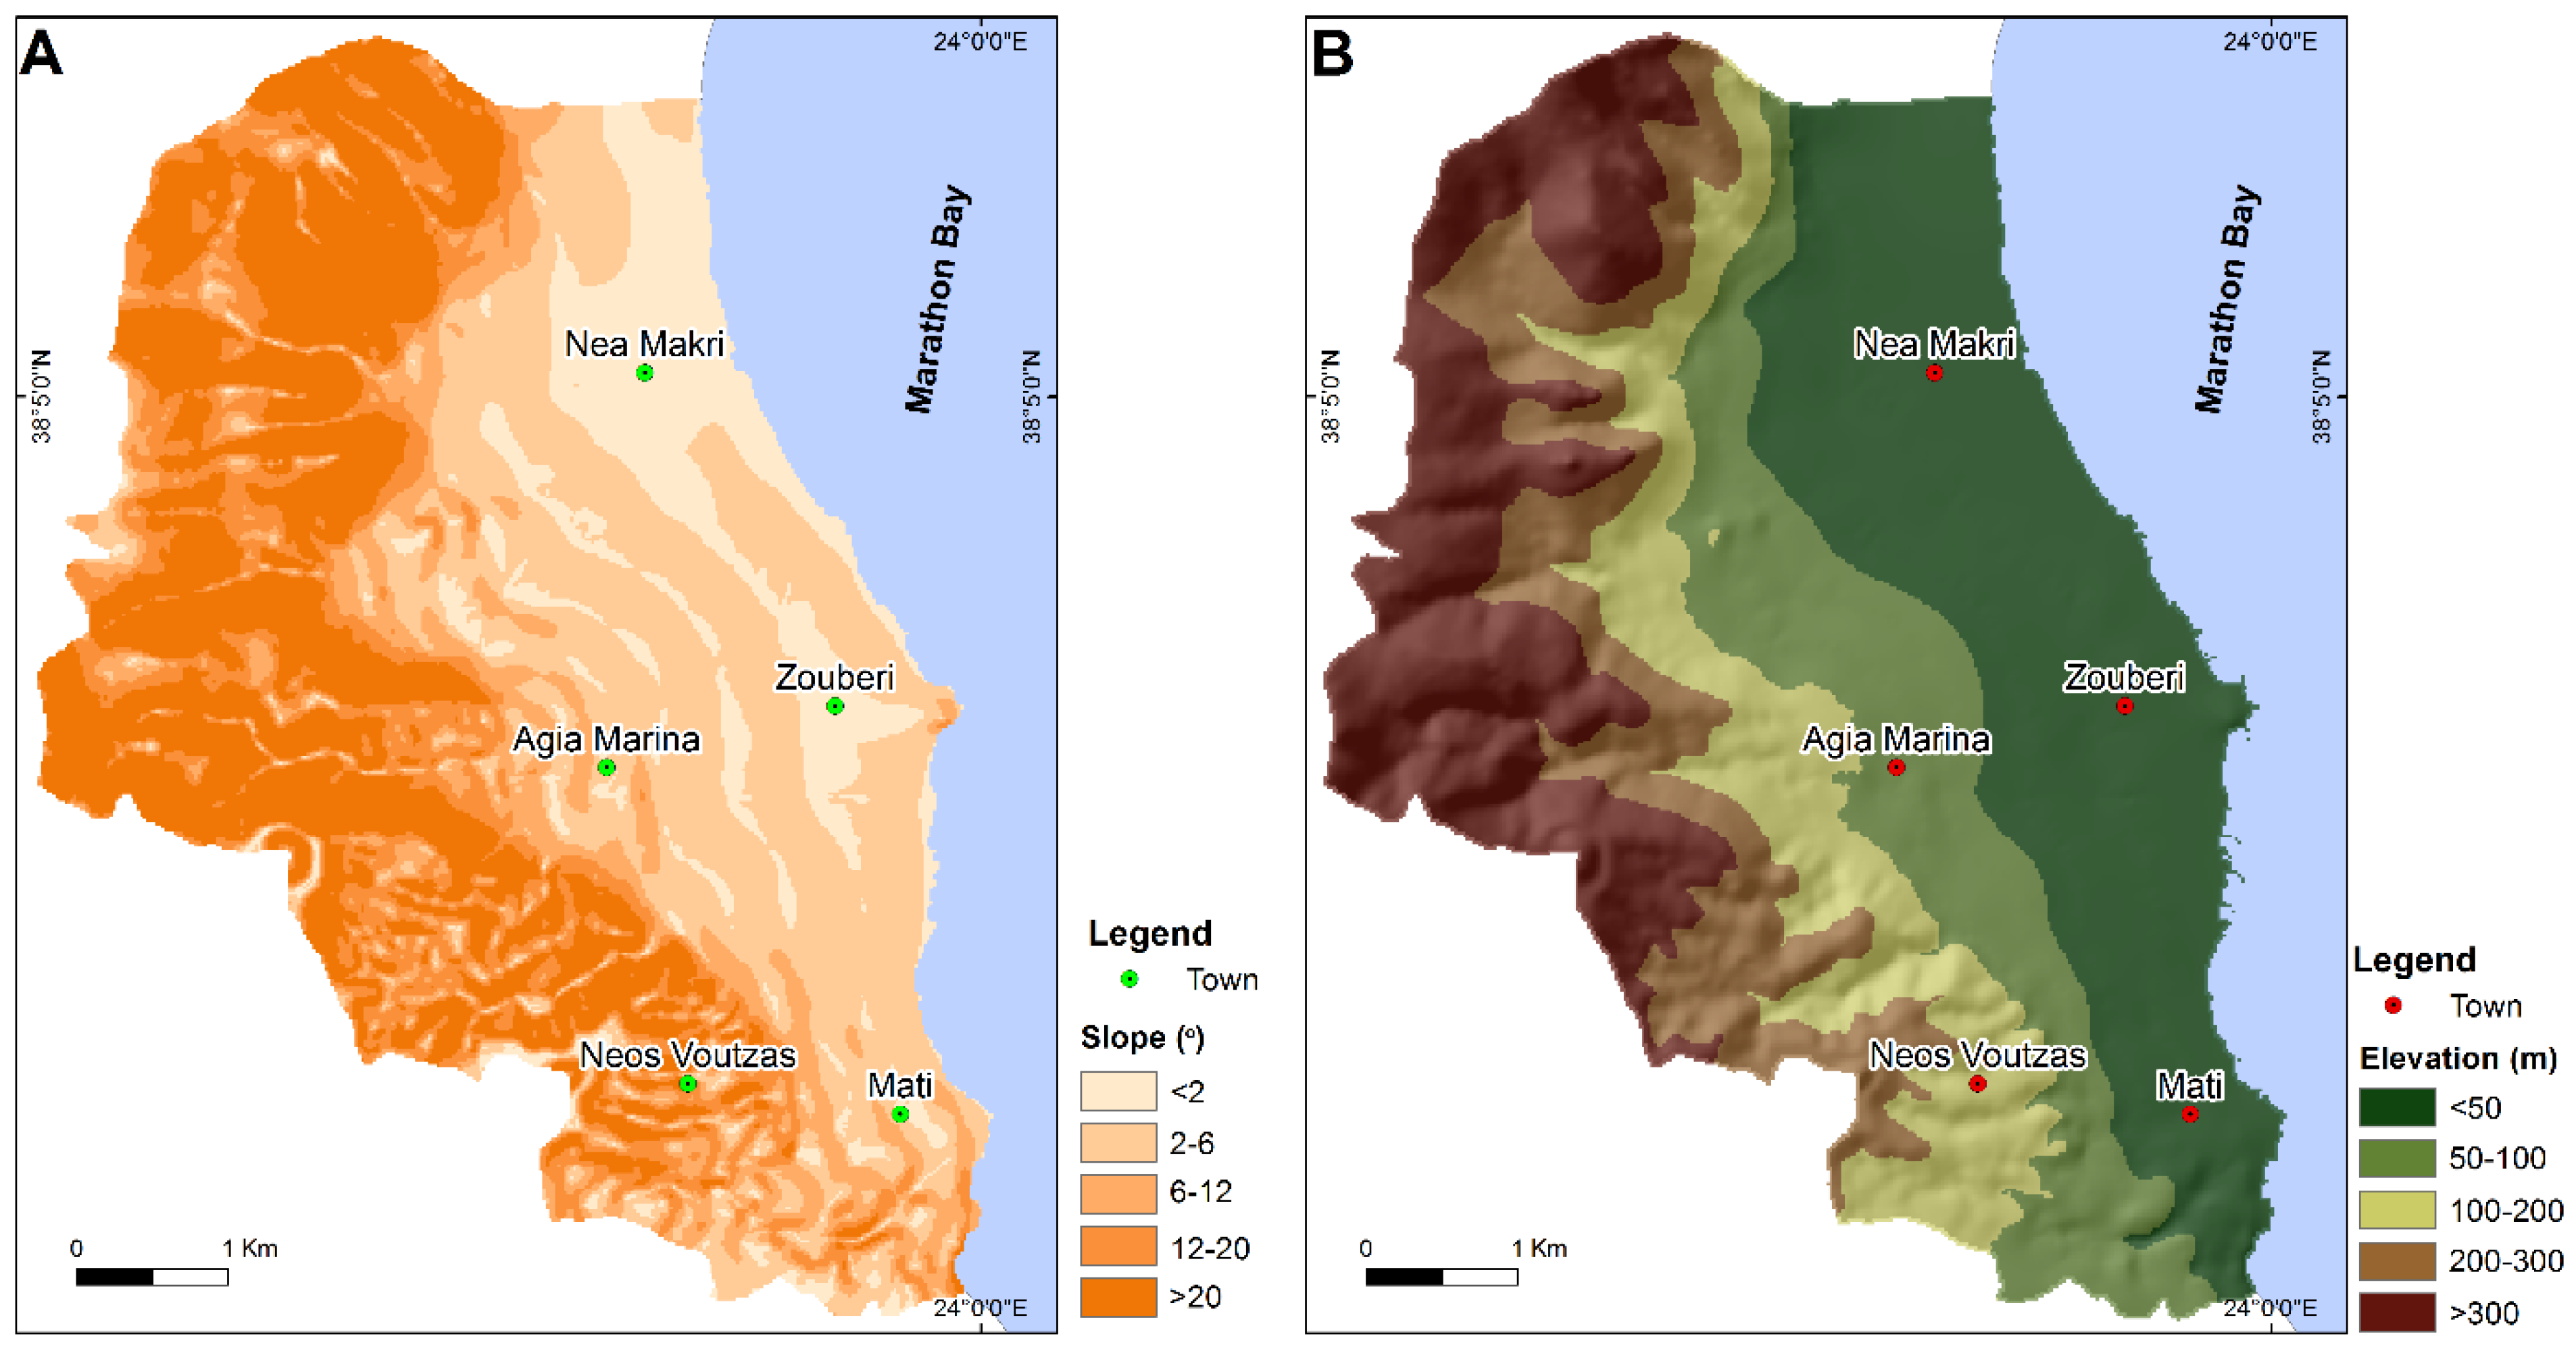
3.3.1. Slope
3.3.2. Elevation
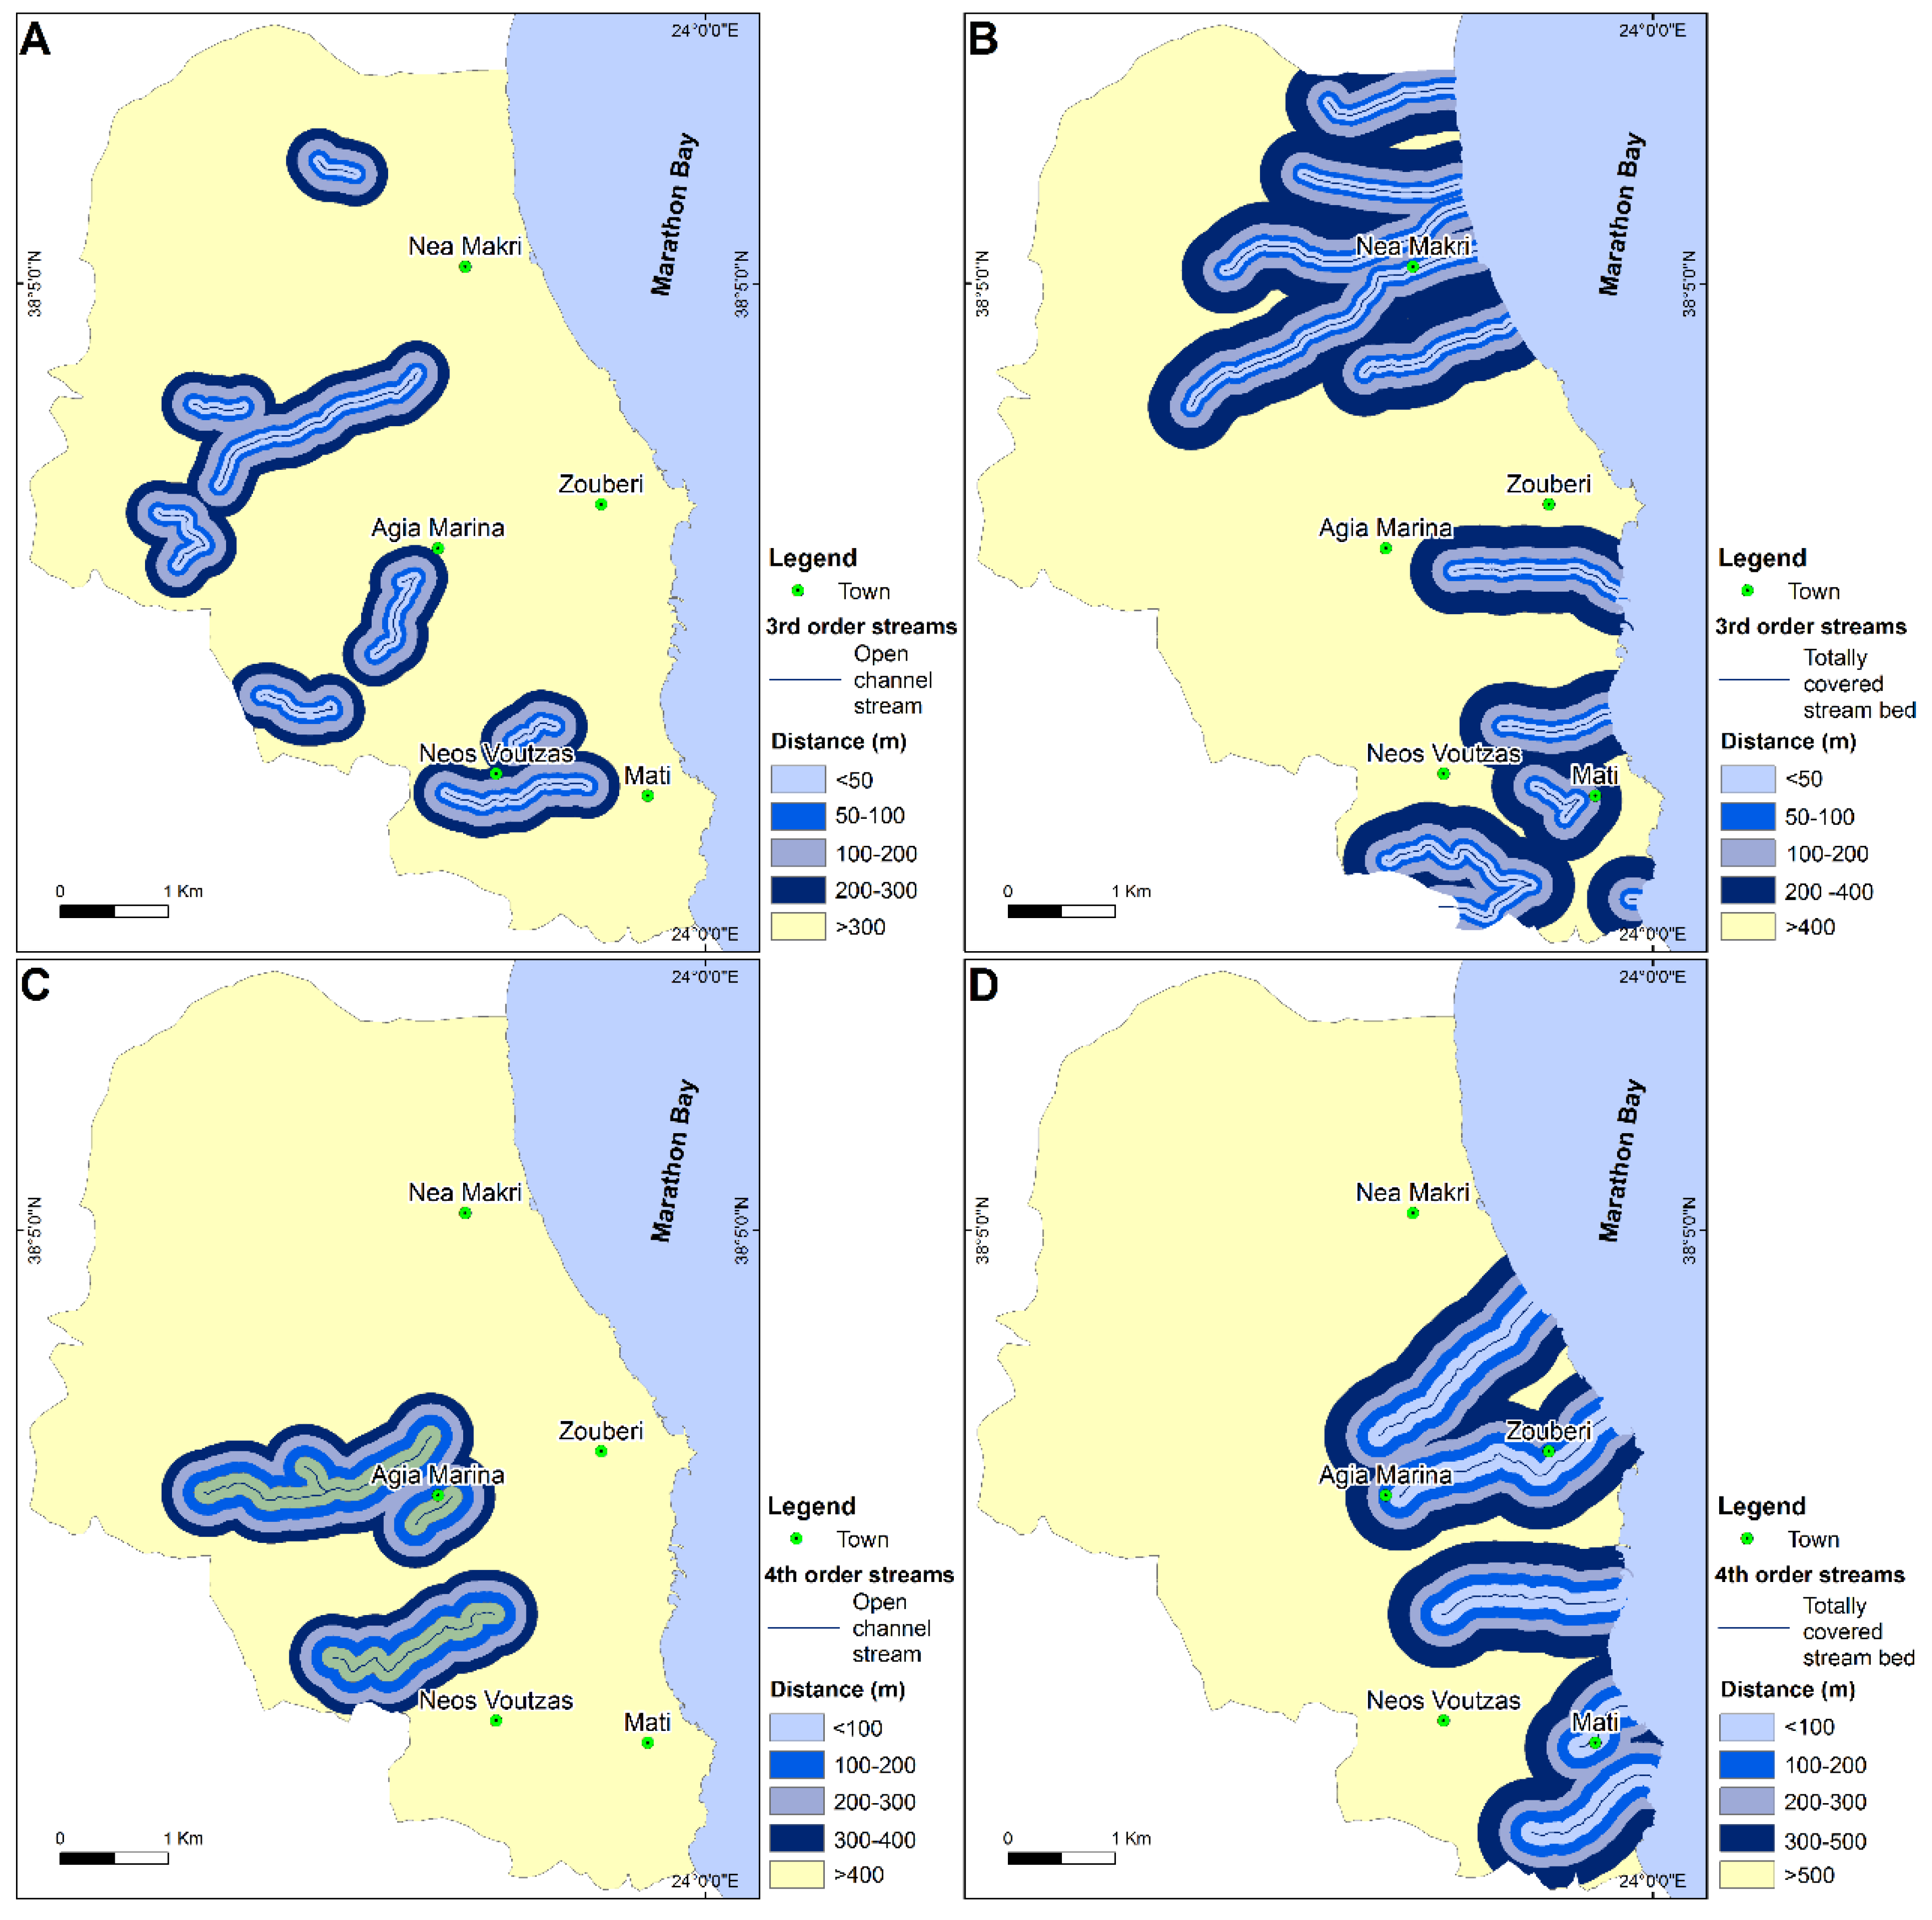
3.3.3. Distance from Open Channel Streams
3.3.4. Distance from Totally Covered Streams
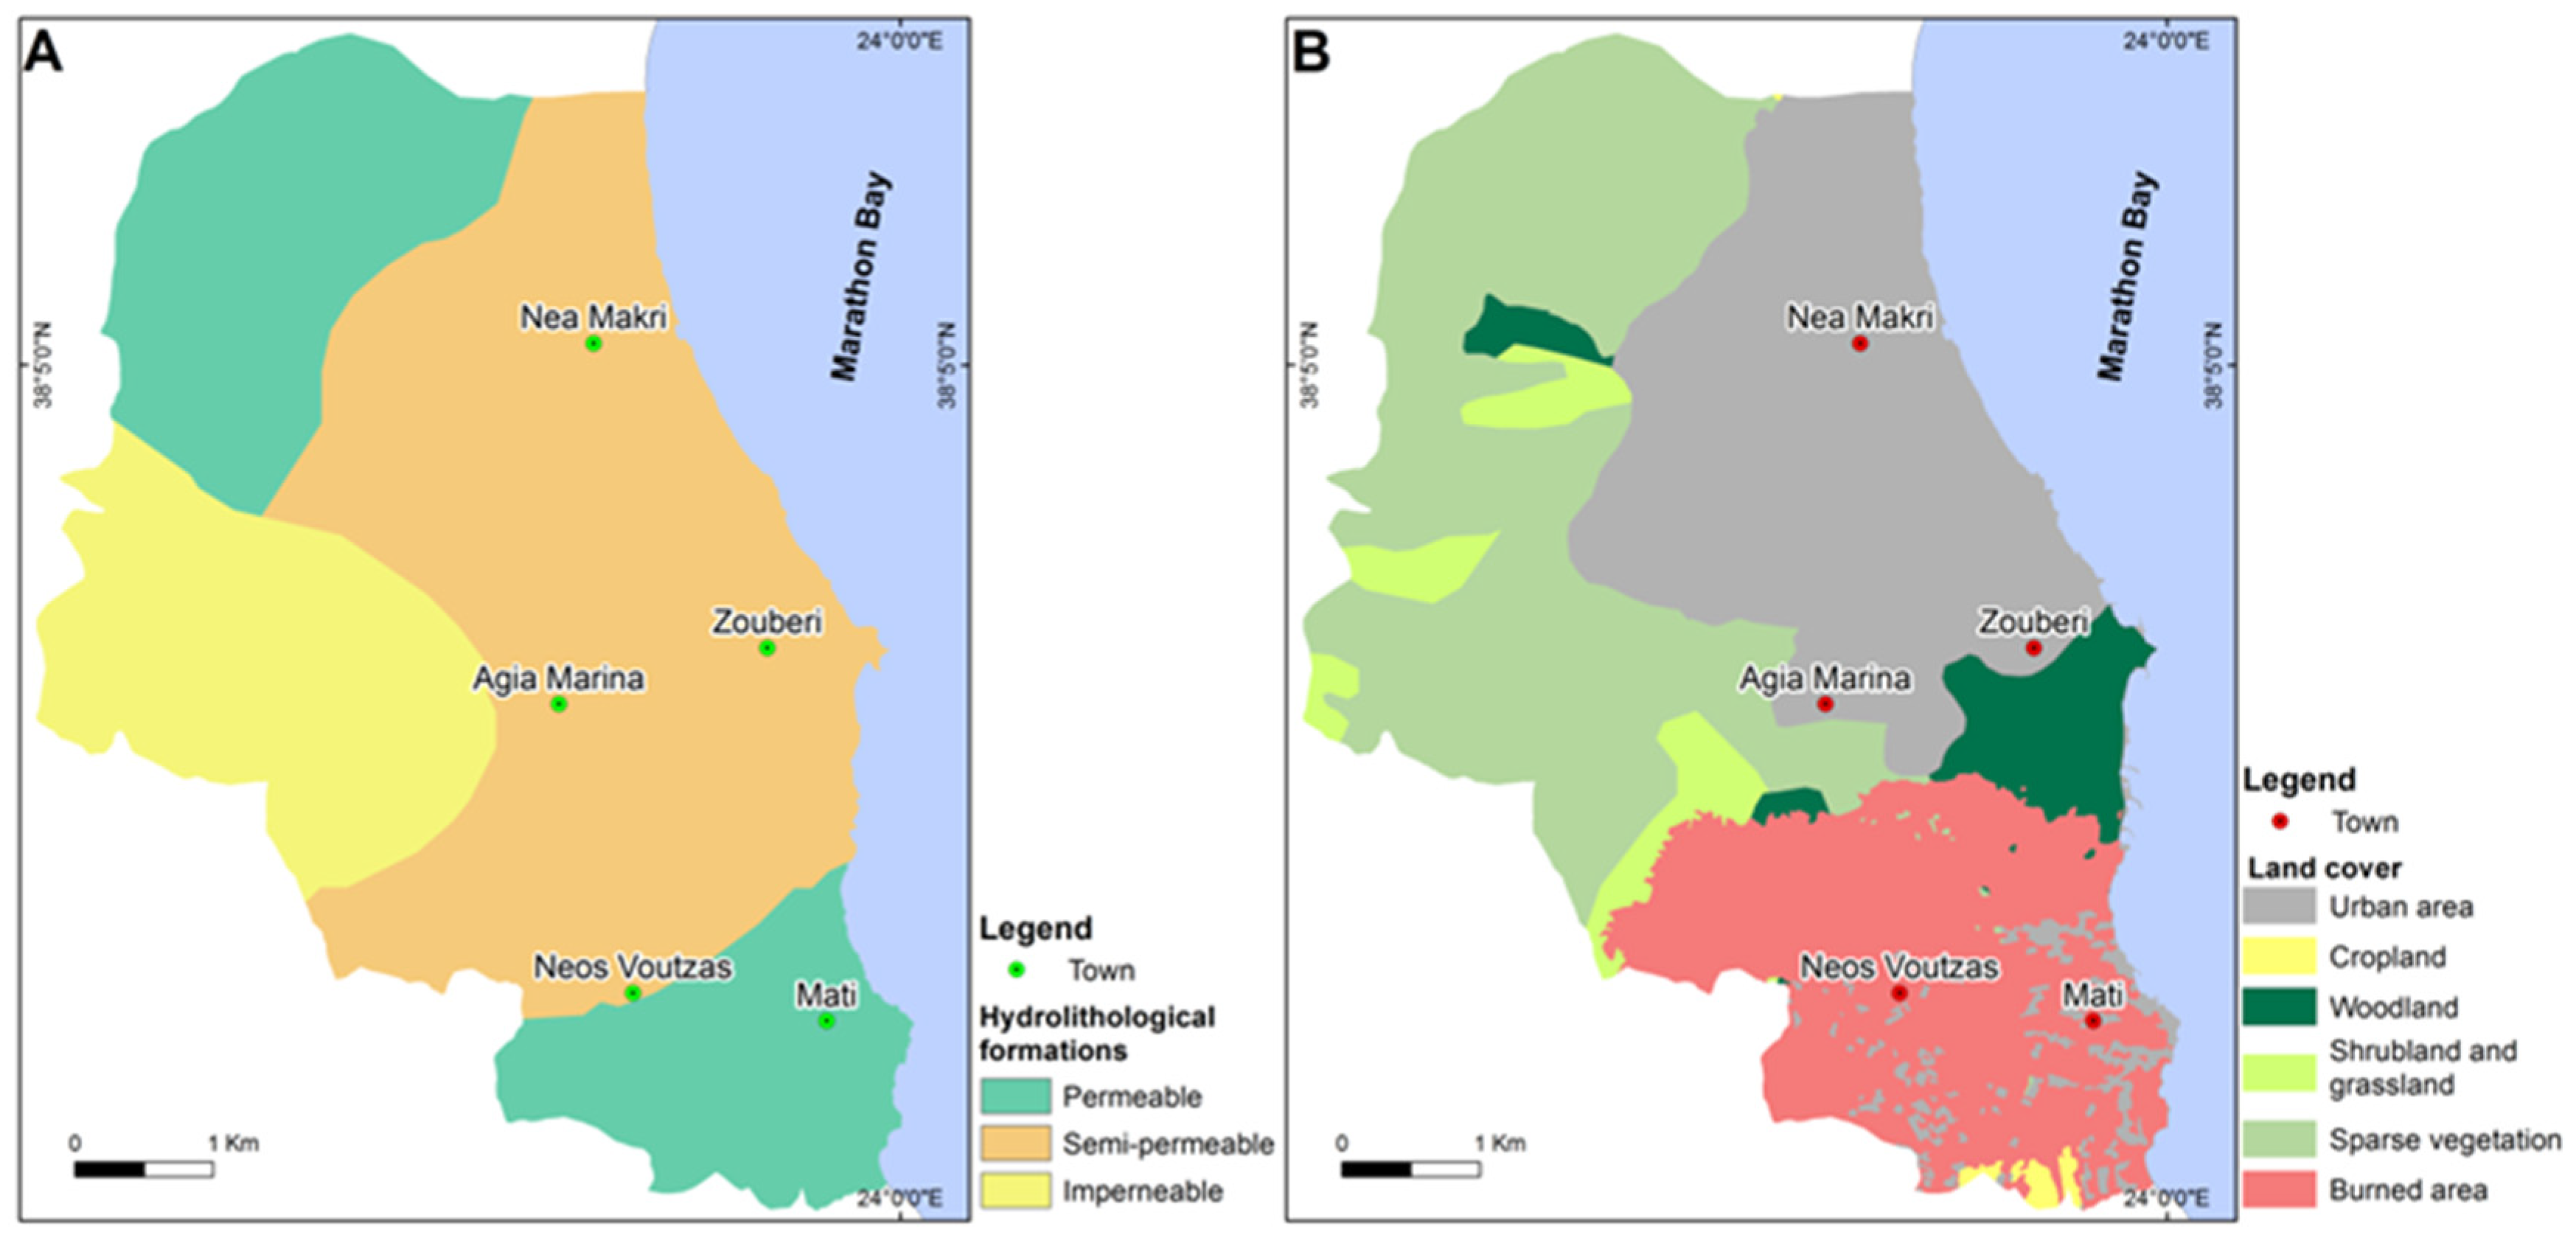
3.3.5. Hydrolithology
3.3.6. Land Cover
3.4. The Rating of Every Class and the Weighting of the Factors
3.5. The Flood Hazard Index Values and the Uncertainty
3.6. Verification and Correlation of the Flood Hazard Evaluation
4. Results
5. Discussion
6. Conclusions
Author Contributions
Funding
Institutional Review Board Statement
Informed Consent Statement
Data Availability Statement
Acknowledgments
Conflicts of Interest
References
- Cerdà, A. Effect of Climate on Surface Flow Along a Climatological Gradient in Israel: A Field Rainfall Simulation Approach. J. Arid Environ. 1998, 38, 145–159. [Google Scholar] [CrossRef]
- Bathrellos, G.D.; Skilodimou, H.D.; Maroukian, H. The spatial distribution of Middle and Late Pleistocene cirques in Greece. Geogr. Ann. 2014, 96, 323–338. [Google Scholar] [CrossRef]
- Skilodimou, H.D.; Bathrellos, G.D.; Maroukian, H.; Gaki-Papanastassiou, K. Late Quaternary evolution of the lower reaches of Ziliana stream in south Mt. Olympus (Greece). Geogr. Fis. Din. Quat. 2014, 37, 43–50. [Google Scholar]
- Bathrellos, G.D.; Skilodimou, H.D.; Maroukian, H.; Gaki-Papanastassiou, K.; Kouli, K.; Tsourou, T.; Tsaparas, N. Pleistocene glacial and lacustrine activity in the southern part of Mount Olympus (central Greece). Area 2017, 49, 137–147. [Google Scholar] [CrossRef]
- Kamberis, E.; Bathrellos, G.; Kokinou, E.; Skilodimou, H. Correlation between the structural pattern and the development of the hydrographic network in a portion of the Western Thessaly basin (Greece). Cent. Eur. J. Geosci. 2012, 4, 416–424. [Google Scholar] [CrossRef]
- Kokinou, E.; Skilodimou, H.D.; Bathrellos, G.D.; Antonarakou, A.; Kamberis, E. Morphotectonic analysis, structural evolution/pattern of a contractional ridge: Giouchtas Mt., Central Crete, Greece. J. Earth Syst. Sci. 2015, 124, 587–602. [Google Scholar]
- Chousianitis, K.; Del Gaudio, V.; Sabatakakis, N.; Kavoura, K.; Drakatos, G.; Bathrellos, G.D.; Skilodimou, H.D. Assessment of Earthquake-Induced Landslide Hazard in Greece: From Arias Intensity to Spatial Distribution of Slope Resistance Demand. Bull. Seismol. Soc. Am. 2016, 106, 174–188. [Google Scholar] [CrossRef]
- Bathrellos, G.D.; Skilodimou, H.D.; Maroukian, H. The significance of tectonism in the glaciations of Greece. Geol. Soc. 2017, 433, 237–250. [Google Scholar] [CrossRef]
- Papadopoulou-Vrynioti, K.; Bathrellos, G.D.; Skilodimou, H.D.; Kaviris, G.; Makropoulos, K. Karst collapse susceptibility mapping considering peak ground acceleration in a rapidly growing urban area. Eng. Geol. 2013, 158, 77–88. [Google Scholar] [CrossRef]
- Τsolaki-Fiaka, S.; Bathrellos, G.D.; Skilodimou, H.D. Multi-Criteria Decision Analysis for an Abandoned Quarry in the Evros Region (NE Greece). Land 2018, 7, 43. [Google Scholar] [CrossRef]
- Skilodimou, H.D.; Bathrellos, G.D.; Koskeridou, E.; Soukis, K.; Rozos, D. Physical and anthropogenic factors related to landslide activity in the Northern Peloponnese, Greece. Land 2018, 7, 85. [Google Scholar] [CrossRef]
- Bathrellos, G.D.; Kalivas, D.P.; Skilodimou, H.D. GIS-based landslide susceptibility mapping models applied to natural and urban planning in Trikala, Central Greece. Estud. Geol. 2009, 65, 49–65. [Google Scholar] [CrossRef]
- Bathrellos, G.D.; Skilodimou, H.D.; Soukis, K.; Koskeridou, E. Temporal and Spatial Analysis of Flood Occurrences in the Drainage Basin of Pinios River (Thessaly, Central Greece). Land 2018, 7, 106. [Google Scholar] [CrossRef]
- Skilodimou, H.D.; Livaditis, G.; Bathrellos, G.D.; Verikiou-Papaspiridakou, E. Investigating the flooding events of the urban regions of Glyfada and Voula, Attica, Greece: A contribution to Urban Geomorphology. Geogr. Ann. 2003, 85, 197–204. [Google Scholar] [CrossRef]
- Merz, B.; Kreibich, H.; Schwarze, R.; Thieken, A. Assessment of economic flood damage. Nat. Hazards Earth Syst. Sci. 2010, 10, 1679–1724. [Google Scholar] [CrossRef]
- European Environment Agency (EEA). Mapping the Impacts of Natural Hazards and Technological Accidents in Europe: An Overview of the Last Decade; Report 13/2010; Office for Official Publications of the European Communities, European Environment Agency (EEA): Luxembourg, 2010. [Google Scholar]
- Gaume, E.; Bain, V.; Bernardara, P.; Newinger, O.; Barbuc, M. A compilation of data on European flash floods. J. Hydrol. 2009, 367, 70–78. [Google Scholar] [CrossRef]
- Chuvieco, E.; Mouillot, F.; Pereira, J.M.C.; Oom, D. A new global burned area product for climate assessment of fire impacts. Glob. Ecol. Biogeogr. 2016, 5, 619–629. [Google Scholar] [CrossRef]
- Bassi, S.; Kettunen, M. Forest Fires: Causes and Contributing Factors in Europe; IP/A/ ENVI/ST/2007-15,PE401.003; European Parliament, Policy Department, Economic and Scientific Policy: Brussels, Belgium, 2008. [Google Scholar]
- Dennis, M.S.; Joseph, E.G.; Jason, W.K. Objective Definition of Rainfall Intensity-Duration Thresholds for Post-fire Flash Floods and Debris Flows in the Area Burned by the Waldo Canyon Fire, Colorado, USA. In Engineering Geology for Society and Territory; Lollino, G., Ed.; Springer: Cham, Switzerland, 2015; Volume 2. [Google Scholar]
- Fox, D.M.; Laaroussi, Y.; Malkinson, L.D.; Maselli, F.; Andrieu, J.; Bottai, L.; Wittenberg, L. POSTFIRE: A model to map forest fire burn scar and estimate runoff and soil erosion risks. Remote Sens. Appl. Soc. Environ. 2016, 4, 83–91. [Google Scholar] [CrossRef]
- Bathrellos, G.D.; Gaki-Papanastassiou, K.; Skilodimou, H.D.; Papanastassiou, D.; Chousianitis, K.G. Potential suitability for urban planning and industry development using natural hazard maps and geological–geomorphological parameters. Environ. Earth Sci. 2012, 66, 537–548. [Google Scholar] [CrossRef]
- Alexakis, D. Suburban areas in flames: Dispersion of potentially toxic elements from burned vegetation and buildings. Estimation of the associated ecological and human health risk. Environ. Res. 2020, 183, 109153. [Google Scholar] [CrossRef] [PubMed]
- Alexakis, D.; Kokmotos, I.; Gamvroula, D.; Varelidis, G. Wildfire effects on soil quality: Application on a suburban area of West Attica (Greece). Geosci. J. 2021, 25, 243–253. [Google Scholar] [CrossRef]
- Alexakis, D. Contaminated land by wildfire effect on ultramafic soil and associated human health and ecological risk. Land 2020, 9, 409. [Google Scholar] [CrossRef]
- Rahmati, O.; Zeinivand, H.; Besharat, M. Flood hazard zoning in Yasooj region, Iran, using GIS and multi-criteria decision analysis. Geomat. Nat. Hazards Risk 2016, 7, 1000–1017. [Google Scholar] [CrossRef]
- Fernández, D.S.; Lutz, M.A. Urban flood hazard zoning in Tucumán Province, Argentina, using GIS and multicriteria decision analysis. Eng. Geol. 2010, 111, 90–98. [Google Scholar] [CrossRef]
- Merwade, V.; Cook, A.; Coonrod, J. GIS techniques for creating river terrain models for hydrodynamic modeling and flood inundation mapping. Environ. Model. Softw. 2008, 23, 1300–1311. [Google Scholar] [CrossRef]
- Tate, E.C.; Maidment, D.R.; Olivera, F.; Anderson, D.J. Creating a terrain model for floodplain mapping. J. Hydrol. Eng. 2002, 7, 100–108. [Google Scholar] [CrossRef]
- De Moel, H.; van Alphen, J.; Aerts, J.C.J.H. Flood maps in Europe—Methods, availability and use. Nat. Hazards Earth Syst. Sci. 2009, 9, 289–301. [Google Scholar] [CrossRef]
- Stefanidis, S.; Stathis, D. Assessment of flood hazard based on natural and anthropogenic factors using analytic hierarchy process (AHP). Nat. Hazards 2013, 68, 569–585. [Google Scholar] [CrossRef]
- Bathrellos, G.D.; Karymbalis, E.; Skilodimou, H.D.; Gaki-Papanastassiou, K.; Baltas, E.A. Urban flood hazard assessment in the basin of Athens Metropolitan city, Greece. Environ. Earth Sci. 2016, 75, 319. [Google Scholar] [CrossRef]
- Saaty, T.L. A scaling method for priorities in hierarchical structures. J. Math. Psychol. 1977, 15, 234–281. [Google Scholar] [CrossRef]
- Saaty, T.L. How to make a decision: The Analytic Hierarchy Process. Eur. J. Oper. Res. 1990, 48, 9–26. [Google Scholar] [CrossRef]
- Saaty, T.L. Decision making—The Analytic Hierarchy and Network Processes (AHP/ANP). J. Syst. Sci. Syst. Eng. 2004, 13, 1–35. [Google Scholar] [CrossRef]
- Bathrellos, G.D.; Gaki-Papanastassiou, K.; Skilodimou, H.D.; Skianis, G.A.; Chousianitis, K.G. Assessment of rural community and agricultural development using geomorphological-geological factors and GIS in the Trikala prefecture (Central Greece). Stoch. Environ. Res. Risk Assess. 2013, 27, 573–588. [Google Scholar] [CrossRef]
- Bathrellos, G.D.; Kalivas, D.P.; Skilodimou, H.D. Landslide Susceptibility Assessment Mapping: A Case Study in Central Greece. In Remote Sensing of Hydrometeorological Hazards; Petropoulos, G.P., Islam, T., Eds.; CRC Press, Taylor & Francis Group: London, UK, 2017; pp. 493–512. ISBN 13978-1498777582. [Google Scholar]
- Georgiopoulos, G.; Kambas, M. ‘Armageddon’ Fire in Greece Kills at Least 80, Many Missing. In Reuters. 2018. Available online: https://www.reuters.com/article (accessed on 25 July 2018).
- Mitsopoulos, I.; Mallinis, G.; Dimitrakopoulos, A.; Xanthopoulos, G.; Eftychidis, G.; Goldammer, J.G. Vulnerability of peri-urban and residential areas to landscape fires in Greece: Evidence by wildland-urban interface data. Data Brief 2020, 31, 106025. [Google Scholar] [CrossRef]
- Authority, H.S. 2011 Population-Housing Census. 2011. Available online: www.statistics.gr/en/2011-census-pop-house (accessed on 27 December 2018).
- Ministry of Environment and Energy. Floods, Historic Floods. 2019. Available online: http://www.ypeka.gr/Default.aspx?tabid=252&language=el-GR (accessed on 21 February 2021).
- Copernicus. Copernicus Land Monitoring Service. 2016. Available online: http://land.copernicus.eu (accessed on 21 February 2021).
- Copernicus. Urban Atlas 2018. Copernicus Land Monitoring Service. 2021. Available online: https://land.copernicus.eu/local/urban-atlas/urban-atlas-2018 (accessed on 21 February 2021).
- European Council. EU Directive of the European Parliament and of the European Council on the Assessment and Management of Flood Risks (2007/60/EU); European Council: Brussels, Belgium, 2007. [Google Scholar]
- Papaioannou, G.; Vasiliades, L.; Loukas, A. Multi-criteria analysis framework for potential flood prone areas mapping. Water Resour. Manag. 2015, 29, 399–418. [Google Scholar] [CrossRef]
- Bathrellos, G.D.; Skilodimou, H.D.; Chousianitis, K.; Youssef, A.M.; Pradhan, B. Suitability estimation for urban development using multi-hazard assessment map. Sci. Total Environ. 2017, 575, 119–134. [Google Scholar] [CrossRef] [PubMed]
- Skilodimou, H.D.; Bathrellos, G.D.; Chousianitis, K.; Youssef, A.M.; Pradhan, B. Multi-hazard assessment modeling via multi-criteria analysis and GIS: A case study. Environ. Earth Sci. 2019, 78, 47. [Google Scholar] [CrossRef]
- Migiros, G.; Bathrellos, G.D.; Skilodimou, H.D.; Karamousalis, T. Pinios (Peneus) River (Central Greece): Hydrological—Geomorphological elements and changes during the Quaternary. Cent. Eur. J. Geosci. 2011, 3, 215–228. [Google Scholar] [CrossRef]
- Youssef, A.M.; Sefry, S.A.; Pradhan, B.; Al Fadail, E.A. Analysis on causes of flash flood in Jeddah city (Kingdom of Saudi Arabia) of 2009 and 2011 using multi-sensor remote sensing data and GIS. Geomat. Nat. Haz. Risk 2016, 7, 1018–1042. [Google Scholar] [CrossRef]
- Hutchinson, M.F.; Xu, T.; Stein, J.A. Recent progress in the ANUDEM elevation gridding procedure. Geomorphometry 2011, 2011, 19–22. [Google Scholar]
- Arun, P.V. A comparative analysis of different DEM interpolation methods. Egypt. J. Remote Sens. Space Sci. 2013, 16, 133–139. [Google Scholar]
- Bathrellos, G.D.; Skilodimou, H.D.; Kelepertsis, A.; Alexakis, D.; Chrisanthaki, I.; Archonti, D. Environmental research of groundwater in the urban and suburban areas of Attica region, Greece. Environ. Geol. 2008, 56, 11–18. [Google Scholar] [CrossRef]
- Van Westen, C.; Kappes, M.S.; Luna, B.Q.; Frigerio, S.; Glade, T.; Malet, J.P. Medium-scale multi-hazard risk assessment of gravitational processes. In Mountain Risks: From Prediction to Management and Governance; Springer: Dordrecht, The Netherlands, 2014; pp. 201–231. [Google Scholar]
- Lee, S.; Pradhan, B. Probabilistic landslide hazards and risk mapping on Penang Island, Malaysia. J. Earth Syst. Sci. 2006, 115, 661–672. [Google Scholar] [CrossRef]
- Rozos, D.; Skilodimou, H.D.; Loupasakis, C.; Bathrellos, G.D. Application of the revised universal soil loss equation model on landslide prevention. An example from N. Euboea (Evia) Island, Greece. Environ. Earth Sci. 2013, 70, 3255–3266. [Google Scholar] [CrossRef]
- Pradhan, B.; Lee, S. Delineation of landslide hazard areas on Penang Island, Malaysia, by using frequency ratio, logistic regression, and artificial neural network models. Environ. Earth Sci. 2010, 60, 1037–1054. [Google Scholar] [CrossRef]
- Hervás, J.; Bobrowsky, P. Mapping: Inventories, susceptibility, hazard and risk. In Landslides—Disaster Risk Reduction; Springer: Berlin/Heidelberg, Germany, 2009; pp. 321–349. [Google Scholar]
- Karymbalis, E.; Katsafados, P.; Chalkias, C.; Gaki-Papanastassiou, K. An integrated study for the evaluation of natural and anthropogenic causes of flooding in small catchments based on geomorphological and meteorological data and modeling techniques: The case of the Xerias torrent (Corinth, Greece). Z. Geomorphol. 2012, 56, 45–67. [Google Scholar] [CrossRef]
- Shakesby, R.A. Post-wildfire soil erosion in the Mediterranean: Review and future research directions. Earth Sci. Rev. 2011, 105, 71–100. [Google Scholar] [CrossRef]
- Rozos, D.; Bathrellos, G.D.; Skilodimou, H.D. Comparison of the implementation of rock engineering system and analytic hierarchy process methods, upon landslide susceptibility mapping, using GIS: A case study from the Eastern Achaia County of Peloponnesus, Greece. Environ. Earth Sci. 2011, 63, 49–63. [Google Scholar] [CrossRef]
- Nefeslioglu, H.A.; Sezer, E.A.; Gokceoglu, C.; Ayas, Z. A modified analytical hierarchy process (M-AHP) approach for decision support systems in natural hazard assessments. Comput. Geosci. 2013, 59, 1–8. [Google Scholar] [CrossRef]
- Kappes, M.S.; Keiler, M.; von Elverfeldt, K.; Glade, T. Challenges of analyzing multi-hazard risk: A review. Nat. Hazards 2012, 64, 1925–1958. [Google Scholar] [CrossRef]
- Bathrellos, G.D.; Skilodimou, H.D. Land Use Planning for Natural Hazards. Land 2019, 8, 128. [Google Scholar] [CrossRef]
- Makri, P.; Stathopoulou, E.; Hermides, D.; Kontakiotis, G.; Zarkogiannis, S.D.; Skilodimou, H.D.; Bathrellos, G.D.; Antonarakou, A.; Scoullos, M. The Environmental Impact of a Complex Hydrogeological System on Hydrocarbon-Pollutants’ Natural Attenuation: The Case of the Coastal Aquifers in Eleusis, West Attica, Greece. J. Mar. Sci. Eng. 2020, 8, 1018. [Google Scholar] [CrossRef]
- Panagopoulos, G.P.; Bathrellos, G.D.; Skilodimou, H.D.; Martsouka, F.A. Mapping Urban Water Demands Using Multi-Criteria Analysis and GIS. Water Resour. Manag. 2012, 26, 1347–1363. [Google Scholar] [CrossRef]
- Papadopoulou-Vrynioti, K.; Alexakis, D.; Bathrellos, G.D.; Skilodimou, H.D.; Vryniotis, D.; Vasiliades, E.; Gamvroula, D. Distribution of trace elements in stream sediments of Arta plain (western Hellas): The influence of geomorphological parameters. J. Geochem. Explor. 2013, 134, 17–26. [Google Scholar] [CrossRef]
- Papadopoulou-Vrynioti, K.; Alexakis, D.; Bathrellos, G.D.; Skilodimou, H.D.; Vryniotis, D.; Vasiliades, E. Environmental research and evaluation of agricultural soil of the Arta plain, western Hellas. J. Geochem. Explor. 2014, 136, 84–92. [Google Scholar] [CrossRef]
- Skilodimou, H.; Stefouli, M.; Bathrellos, G. Spatio-temporal analysis of the coastline of Faliro Bay, Attica, Greece. Estud. Geol.-Madrid 2002, 58, 87–93. [Google Scholar]


| Factors | Classes | Rating |
|---|---|---|
| Slope (°) | <2 | 4 |
| 2–6 | 3 | |
| 6–12 | 2 | |
| 12–20 | 1 | |
| >20 | 0 | |
| Elevation (m a.s.l.) | <50 | 4 |
| 50–100 | 3 | |
| 100–200 | 2 | |
| 200–300 | 1 | |
| >300 | 0 | |
| Distance from open channel streams (m) | third-order stream | |
| 0–50 | 4 | |
| 50–100 | 3 | |
| 100–200 | 2 | |
| 200–300 | 1 | |
| >300 | 0 | |
| fourth-order stream | ||
| 0–100 | 4 | |
| 100–200 | 3 | |
| 200–300 | 2 | |
| 300–400 | 1 | |
| >400 | 0 | |
| Distance from totally covered streams (m) | third-order stream | |
| 0–50 | 4 | |
| 50–100 | 3 | |
| 100–200 | 2 | |
| 200–400 | 1 | |
| >400 | 0 | |
| fourth-order stream | ||
| 0–100 | 4 | |
| 100–200 | 3 | |
| 200–300 | 2 | |
| 300–500 | 1 | |
| >500 | 0 | |
| Hydrolithology | permeable | 1 |
| semipermeable | 2 | |
| impermeable | 3 | |
| Land cover | urban area | 4 |
| cropland | 2 | |
| woodland | 0 | |
| shrubland and grassland | 1 | |
| sparse vegetation area | 3 | |
| burned area | 4 |
| F1 | F2 | F3 | F4 | F5 | F6 | Weights, Wi | |
|---|---|---|---|---|---|---|---|
| F1 | 1 | 4 | 1/2 | 3 | 1/2 | 2 | 0.207 |
| F2 | 1 | 1/3 | 1/2 | 1/4 | 1/4 | 0.058 | |
| F3 | 1 | 3 | 1 | 1/3 | 0.088 | ||
| F4 | 1 | 1/3 | 1 | 0.260 | |||
| F5 | 1 | 1/3 | 0.104 | ||||
| F6 | 0.283 |
| Factors | ΔWi |
|---|---|
| Slope | 0.041 |
| Elevation | 0.012 |
| Open streams | 0.018 |
| Covered streams | 0.052 |
| Hydrolithology | 0.021 |
| Land cover | 0.057 |
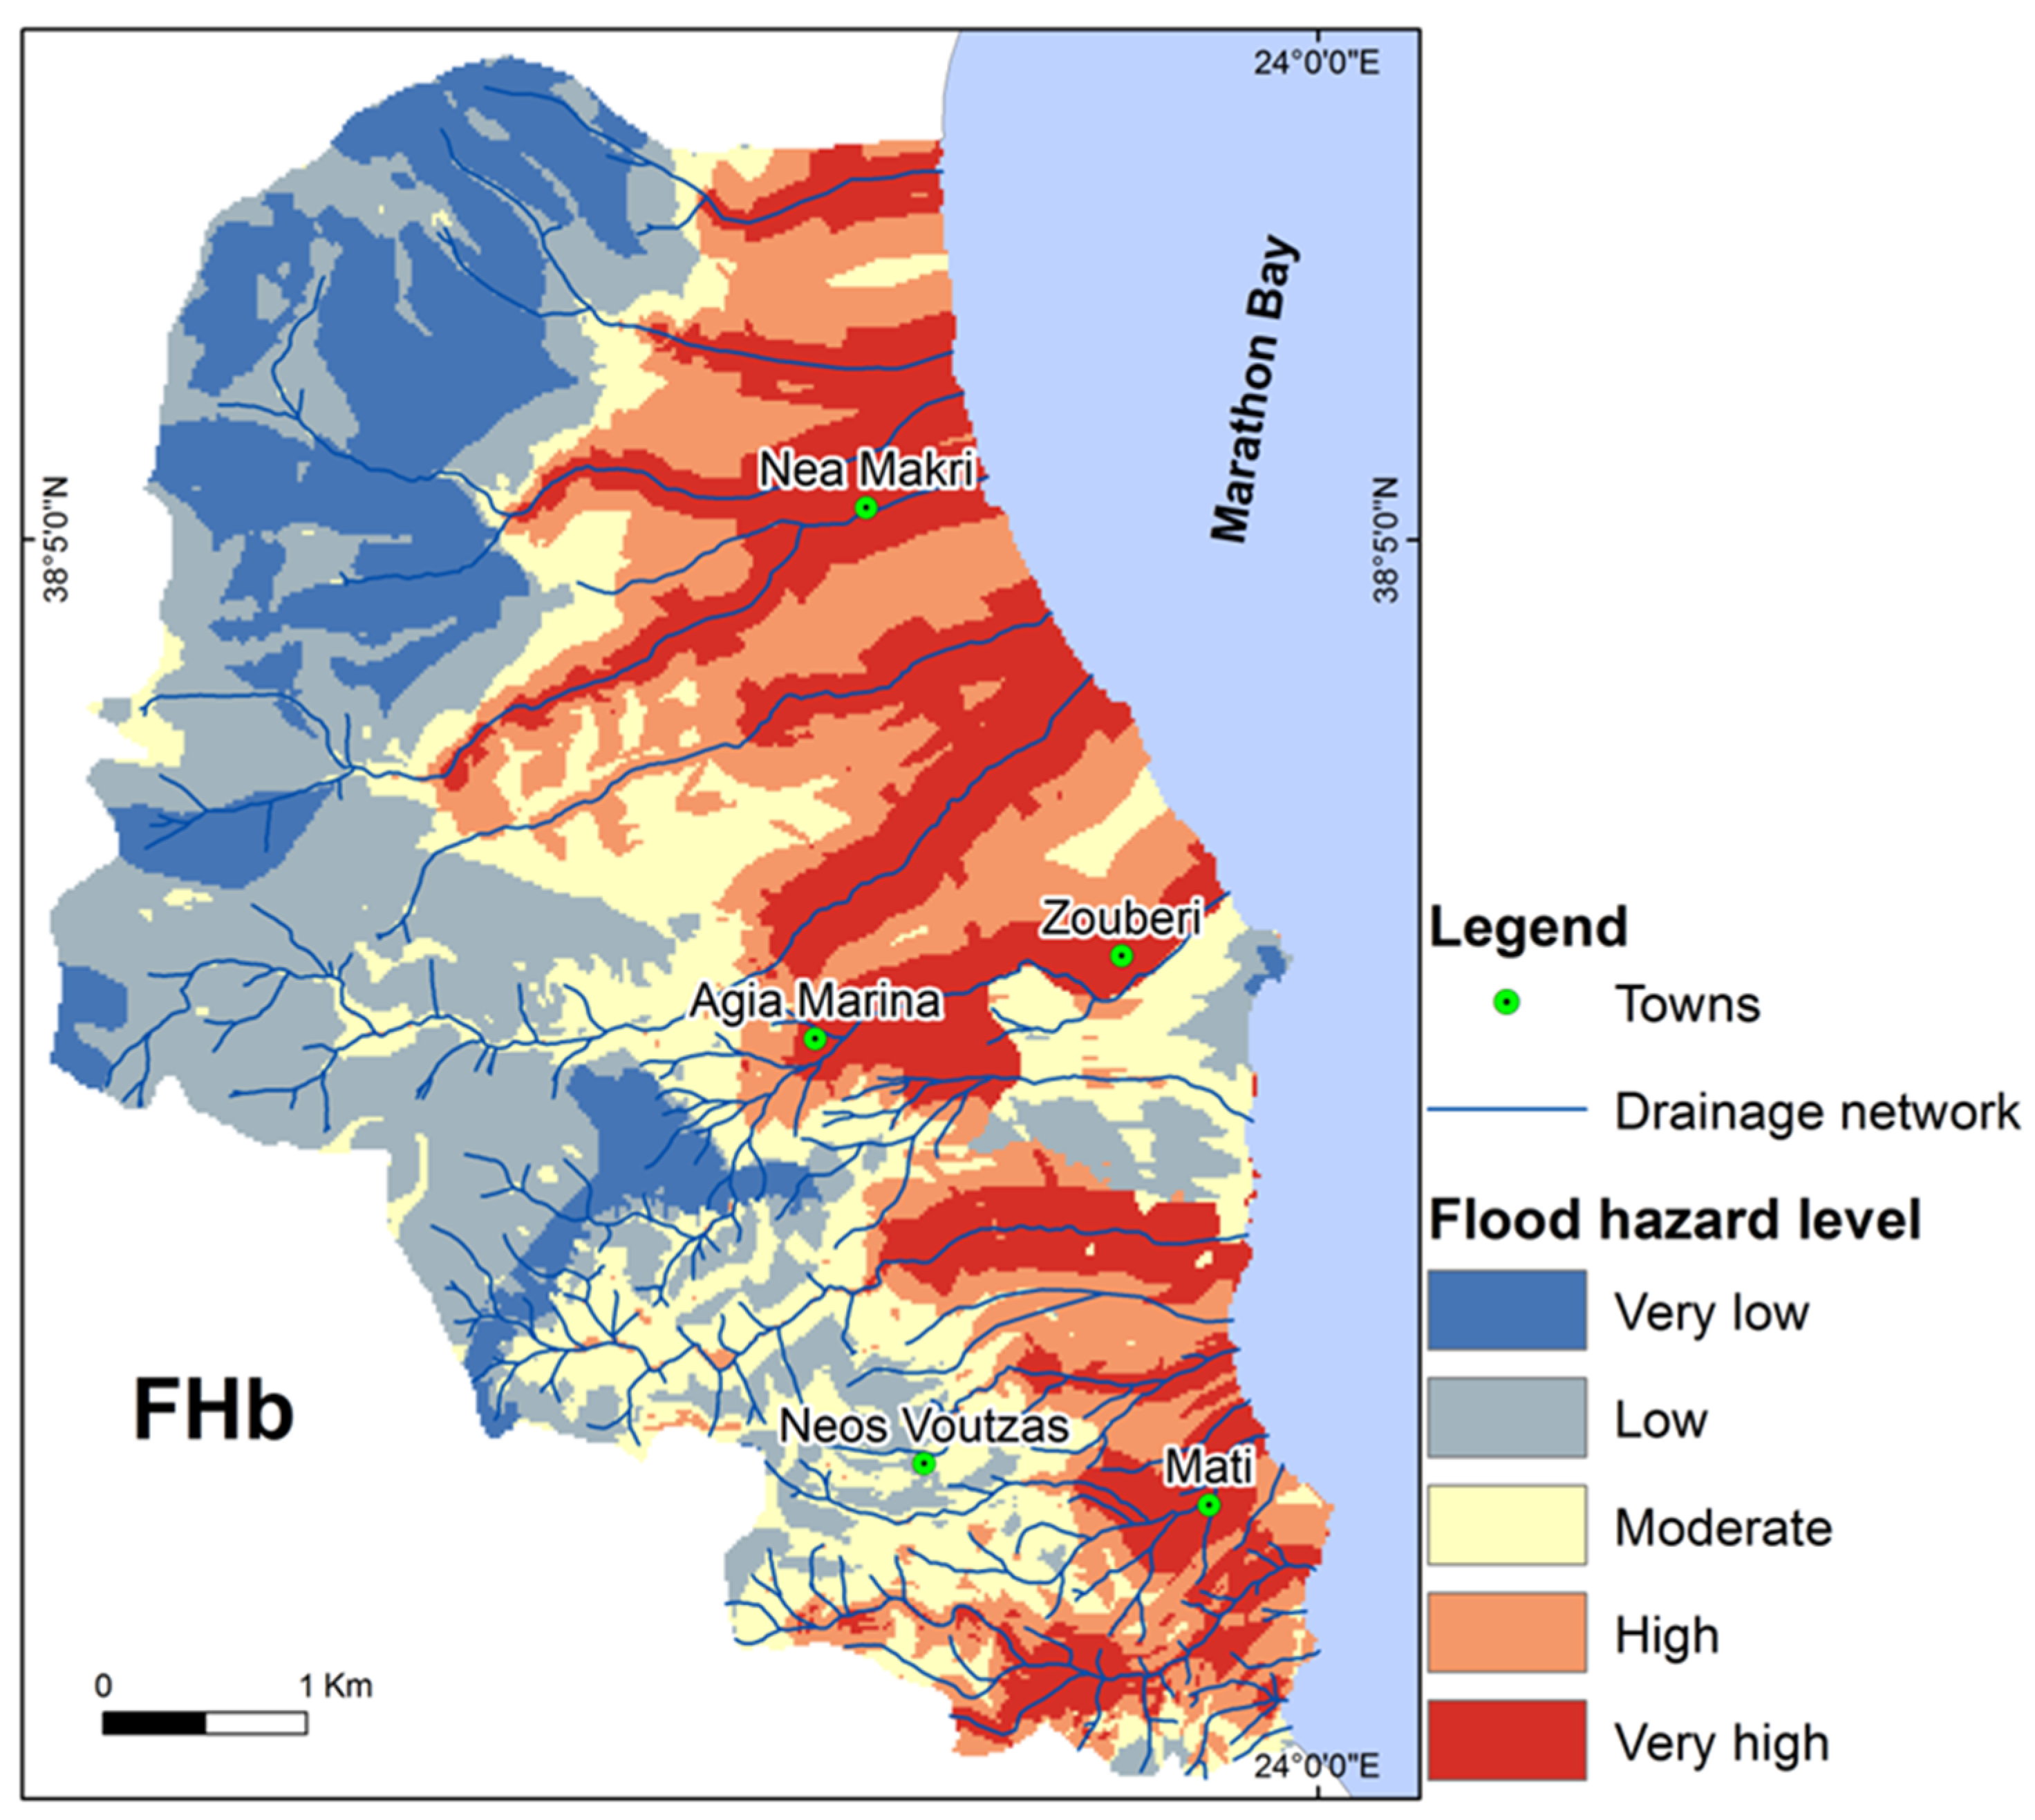
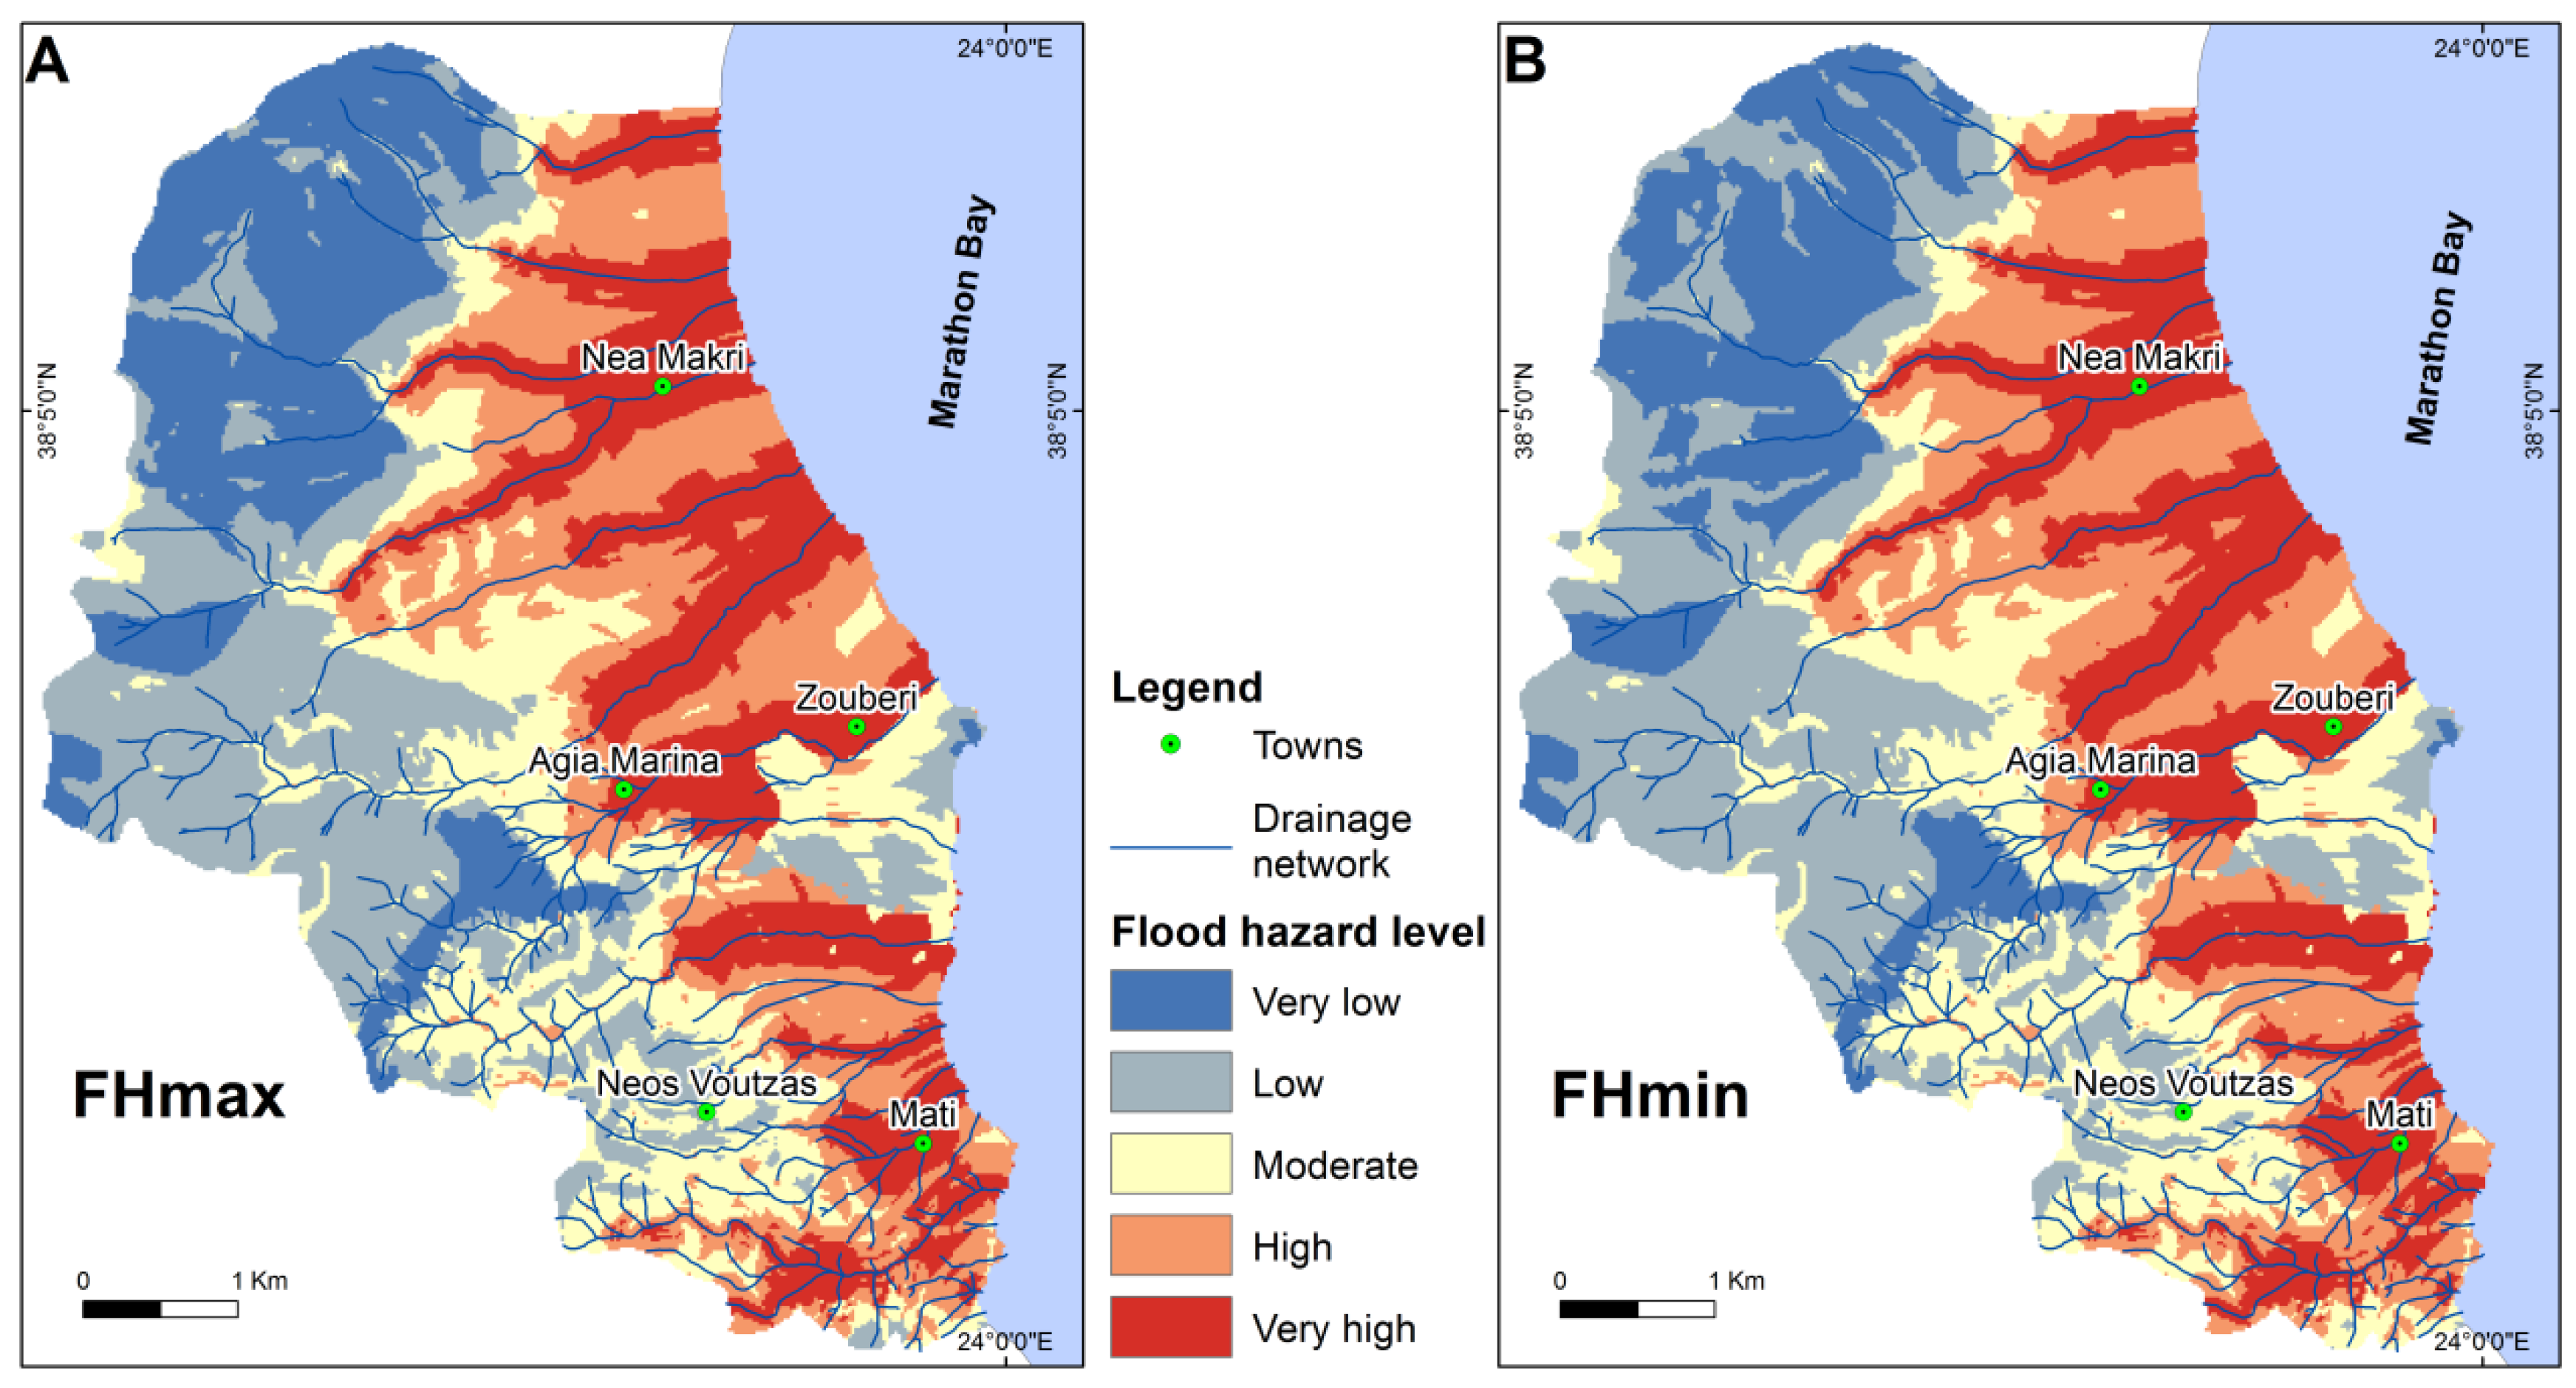
| Flood Hazard Zones | Percentage % of Total Study Area | ||
|---|---|---|---|
| FH | FHmax | FHmin | |
| Very low | 14.4 | 16.5 | 14.4 |
| Low | 25.6 | 23.5 | 25.3 |
| Moderate | 20.1 | 19.6 | 19.0 |
| High | 20.1 | 20.6 | 21.4 |
| Very high | 19.8 | 20.1 | 20.1 |
| Flood Hazard Zones | A | AC | FN | FF | FR |
|---|---|---|---|---|---|
| Very low | 4.7 | 14.4 | 0 | 0.0 | 0.0 |
| Low | 8.4 | 25.6 | 0 | 0.0 | 0.0 |
| Moderate | 6.6 | 20.1 | 1 | 11.1 | 0.6 |
| High | 6.6 | 20.1 | 3 | 33.3 | 1.7 |
| Very high | 6.5 | 19.8 | 5 | 55.6 | 2.8 |
| Flood Hazard Zones | UF (Km2) | % | RN (Km) | % |
|---|---|---|---|---|
| Very low | 0.0 | 0 | 22.5 | 6 |
| Low | 0.5 | 4 | 79.2 | 22 |
| Moderate | 2.7 | 19 | 82.0 | 22 |
| High | 5.4 | 37 | 83.4 | 23 |
| Very high | 5.7 | 40 | 99.4 | 27 |
| Total | 14.3 | 100 | 366.5 | 100 |
Publisher’s Note: MDPI stays neutral with regard to jurisdictional claims in published maps and institutional affiliations. |
© 2021 by the authors. Licensee MDPI, Basel, Switzerland. This article is an open access article distributed under the terms and conditions of the Creative Commons Attribution (CC BY) license (https://creativecommons.org/licenses/by/4.0/).
Share and Cite
Skilodimou, H.D.; Bathrellos, G.D.; Alexakis, D.E. Flood Hazard Assessment Mapping in Burned and Urban Areas. Sustainability 2021, 13, 4455. https://doi.org/10.3390/su13084455
Skilodimou HD, Bathrellos GD, Alexakis DE. Flood Hazard Assessment Mapping in Burned and Urban Areas. Sustainability. 2021; 13(8):4455. https://doi.org/10.3390/su13084455
Chicago/Turabian StyleSkilodimou, Hariklia D., George D. Bathrellos, and Dimitrios E. Alexakis. 2021. "Flood Hazard Assessment Mapping in Burned and Urban Areas" Sustainability 13, no. 8: 4455. https://doi.org/10.3390/su13084455
APA StyleSkilodimou, H. D., Bathrellos, G. D., & Alexakis, D. E. (2021). Flood Hazard Assessment Mapping in Burned and Urban Areas. Sustainability, 13(8), 4455. https://doi.org/10.3390/su13084455