Article

Modeling and Analysis of Optimal Strategies for Leveraging Ride-Sourcing Services in Hurricane Evacuation

C2SMART University Transportation Center, Tandon School of Engineering, New York University, Brooklyn, NY 11201, USA
*
Author to whom correspondence should be addressed.
Sustainability 2021, 13(8), 4444; https://doi.org/10.3390/su13084444
Submission received: 7 March 2021 / Revised: 26 March 2021 / Accepted: 31 March 2021 / Published: 15 April 2021
(This article belongs to the Special Issue Market Potential for Carsharing Services)

Abstract

:
In many large-scale evacuations, public agencies often have limited resources to evacuate all citizens, especially vulnerable populations such as the elderly and disabled people, and the demand for additional transportation means for evacuation can be high. The recent development of ride-sourcing companies can be leveraged in evacuations as an additional and important resource in future evacuation planning. In contrast to public transit, the availability of ride-sourcing drivers is highly dependent on the price, since surge pricing will occur when the demand is high and the supply is low. The key challenge is thus to find the balance between evacuation demand and driver supply. Based on the two-sided market theory, we propose mathematical modeling and analysis strategies that can help balance demand and supply through a pricing mechanism designed for ride-sourcing services in evacuation. A subsidy is considered in the model such that lower-income and vulnerable individuals could benefit from ride-sourcing services. A hypothetical hurricane evacuation scenario in New York City in the case study showed the feasibility of the proposed method and the applicability of subsidies for ride-sourcing services in evacuation. The methodology and results given in this research can provide useful insights for modeling on-demand ride-sourcing for future evacuation planning.

1. Introduction

Private cars usually serve as the main transportation mode during evacuations; however, in metropolitan cities, a dense population means that personal automobiles are often lacking. More than half the households in New York City (NYC) do not have personal automobiles. This statistic is lowest in Manhattan, where only 23% of households own cars [1]. Consequently, many people need to use public transport (such as buses, the subway, trains, etc.) to reach safer regions. Despite the increasing involvement of public transit in evacuations, many problems still exist. Limited resources were the first obstacle, for instance, during Hurricane Katrina in 2005. New Orleans has about 500 buses in regular service, but needed about 2000 buses to evacuate all residents who were not using private cars [2]. Social equity is another critical problem in evacuation [3]. Preparation for people in special categories (disabled, the elderly, infants, etc.) is inadequate, and some of them cannot even reach bus stations in emergency events. One of the main problems in New Orleans’ 2005 evacuation was the lack of planning to evacuate carless residents, the elderly, the disabled, and people with other special needs [2]. Recent research by Renne and Mayorga [4] reveals that only 16 of the 50 largest cities in the United States mention carless and vulnerable populations in evacuation plans, and only 13 plans have detailed information for such populations. New technologies and research are needed to ensure safe and more equitable evacuation, especially for vulnerable populations.
Improvements in technology and communication have led to the rise of the sharing economy and growth of private companies in transportation. Fast-growing ride-sourcing companies (e.g., Uber, Lyft), which provide an opportunity to mobilize their resources to increase evacuation compliance and support vulnerable populations, are especially popular in metropolitan cities [3,5,6,7,8]. Ride-sourcing services have many advantages, such as flexibility in terms of time and route, and GPS-enabled tools to easily connect riders, drivers, and vehicles. In an emergency evacuation, ride-sourcing services can serve not only as a complementary transit mode, but also offer access to mobility-impaired people who are difficult to evacuate. Ride-sourcing companies such as Uber and Lyft have been involved in many recent evacuation events [5,9,10,11,12,13,14], and many drivers are willing to participate in evacuations [7]. With the participation of ride-sourcing companies, resource limitations and social equity problems may be addressed in future evacuations.
Recent research has identified two major concerns for leveraging ride-sourcing services in evacuation: Driver availability and service price [3,5,6]. In contrast to public transit, driver availability for ride-sourcing services has a close relationship with pricing. To achieve market equilibrium, when the demand of riders is high and the supply of drivers is low, a price multiplier will be applied, which is called “surge pricing”. During evacuations, demand can be much higher than normal because many people want to evacuate from the dangerous area, while the availability of drivers can be lower than normal since some drivers need to evacuate their families and many may be afraid to get on the road. Uber indicated that increasing the price can motivate more drivers to participate in the evacuation [15]. Following Hurricane Sandy, Uber issued a surge of twice the base price on all trips, which received intense criticism [15,16]. Surge prices may get more drivers on the road, but people should not be required to pay for their lives. However, very limited research has addressed this problem.
During regular times, the objective of ride-sourcing companies is to maximize their profit, but during evacuations the main objective is to maximize the number of people evacuated within a limited time. To put more drivers on the road, the government or ride-sourcing companies can provide subsidies to drivers as an incentive. Uber and Lyft have offered free rides in multiple evacuation events [5]. Generally, giving subsidies to drivers while charging a lower price to passengers can increase the number of matched trips. With subsidies provided by the government or ride-sourcing companies, lower-income and vulnerable individuals can benefit substantially from ride-sourcing services. Although the cost of subsidies will also become a burden for governments or companies, maximizing the number of matched trips and minimizing the cost of subsidies is a trade-off.
Given the potential for leveraging ride-sourcing services in disasters as an alternative evacuation mode, this paper aims to provide a model that can help balance demand and driver supply through a pricing mechanism designed for ride-sourcing services in evacuations. A weighted multi-objective model is proposed that considers two important features: Spatial differentiation and time-dependent evacuation response behavior. The spatial differentiation allows the platform to have different price settings in different regions, since their demand and supply can be different. The time-dependent evacuation demand and supply functions are used to estimate the proportion of people likely to evacuate and the availability of services provided by drivers within each time step to demonstrate how the proposed model can adapt to different types of evacuation-response behaviors. More importantly, the weighted multi-objective model enables decision makers to find the best result that can evacuate more people within their budget by changing the weight parameters of the objective function.
The experience of Hurricane Irene (2011) shows large-scale mass evacuations under extreme conditions in NYC may overextend the public transit system [17]. With 1.61 million carless people in all evacuation zones, public transit might successfully support some range of evacuation, but it is hard to satisfy large numbers of evacuees and vulnerable populations in severe disasters. In the past few years, app-based electronic dispatch services, such as Uber and Lyft, have become very popular in NYC and are changing the way people get around. In the case study section, a hypothetical hurricane evacuation scenario in NYC is used to evaluate the performance of the proposed method for ride-sourcing services in evacuations, and the effect of different types of evacuation response behaviors will be analyzed in the case study.
The model is designed to analyze the working of the ride-sourcing market in evacuations. The model can help ride-sourcing companies like Uber and Lyft set prices as well as help the city emergency response department develop regulation policies in evacuations. The unique contributions of this study include: (1) Quantifying the relationship between demand, supply, and price for ride-sourcing services in evacuations; (2) analyzing the impact of different time-dependent evacuation response behaviors; (3) proposing a mathematical modeling approach to optimize price settings for ride-sourcing services in evacuations with the twin objectives of maximizing the number of matched trips and minimizing the cost of subsidies; and (4) evaluating the impact of spatial demand and supply on the optimal price settings.
The remainder of the study is organized as follows: Section 2 provides an overview of the related research in evacuation and shared mobility. Section 3 provides the problem description that will explain the available evacuation modes in NYC. Section 4 presents the modeling approach designed for ride-sourcing services in evacuations. Section 5 provides a hypothetical evacuation scenario in NYC to evaluate model performance. Section 6 will summarize the research limitations and potential future research directions.

2. Literature Review

Emergency evacuation plans are important to ensure the safest and most efficient evacuation when facing disasters. With more available data and advanced technology, researchers can optimize disaster preparation and post-disaster recovery planning [18,19,20,21,22,23,24,25,26,27]. Evacuation analysis and planning have been developed through mathematical models of evacuation demand, simulations, and optimization models of evacuation clearance time [21,28,29]. Extensive research in the literature uses discrete choice models to study evacuation choices [30,31,32,33,34], evacuation time [35,36,37], choice of destination [38,39], transportation mode in evacuations [39,40], and routing problems [39,41,42,43].
Traditionally, evacuees without access to personal automobiles are expected to use public transit to reach safer regions. Since transit has a much larger capacity than private cars, the importance of transit-based evacuation has been increasingly recognized during the past few decades [2]. Many studies have focused on improving transit operations during evacuations, such as resource allocation in transit-based emergency evacuation [44,45], transit-based evacuation planning for people with special needs [46,47,48], dynamic bus dispatching with stochastic demand [49], and bus driver availability [50]. However, transit-based evacuations have many problems in practice, such as limited resources and the lack of planning to evacuate the elderly, disabled, and people with other special needs [2].
The limited resources and the problem of social equity in evacuations are still unsolved [3,5]. The devastating events of Hurricane Katrina in 2005 demonstrated the limitations of current evacuation plans, with many of these lessons learned indicating the importance of equitable evacuation planning and the need to create a multimodal transportation system with more evacuation options [2]. During Hurricane Katrina, between 127,000 and 300,000 people did not have access to reliable transportation in the New Orleans metropolitan area, and about 100,000 people did not evacuate before landfall [51,52]. Although some cities now provide emergency plans to the carless population, the special needs of vulnerable populations remain unaddressed [4]. More research is needed in areas such as how to define the vulnerable population [4] and how they make choices during an evacuation [40]. Discussions of social equity problems can be found in the literature [4,53,54,55,56,57,58].
Recent studies show the resource limitations and social equity problems may be addressed by leveraging the sharing economy, which includes carsharing, homesharing, and ride-sourcing services [3,5,6]. The shared resources from private companies and citizens may supplement public resources in evacuations, which can yield several benefits that have been identified in the literature, such as increasing compliance to evacuation, improving evacuation efficiency, and providing services for vulnerable populations, but limitations also exist (e.g., liability and cost) [3,5,6]. The emergence of the sharing economy brought new opportunities for a more equitable transportation system by increasing accessibility, reducing costs of personal automobiles, and allowing more flexible travel patterns [59,60]. An overview of shared mobility can be found in the literature [61,62,63,64,65]. Equity and discrimination issues of shared mobility also exist and have been discussed in the literature [59,66,67].
Ride-sourcing services are especially popular in metropolitan regions; data shows Uber and Lyft cars outnumber yellow cabs in NYC by 4-to-1 [68]. The feasibility and limitation of using ride-sourcing services for evacuation have been studied in the literature [3,5,6,7,8]. Researchers have provided extensive recommendations and guidelines to understand and develop more equitable evacuation by leveraging the sharing economy. Furthermore, ride-sourcing services have been active in many disasters in the United States and received positive feedback [6]. In 2012, when Hurricane Sandy struck NYC, public transportation was very limited for a large number of carless residents, and the demand for Uber rides was astronomically high [15,16]. In 2017, before Irma made landfall in Florida, Uber and Lyft offered free rides to and from shelters near Tampa [9,10]. In the case of Hurricane Harvey, also in 2017, Uber provided free rides to or from shelters in multiple cities [11]. In 2018, Uber and Lyft also provided free rides to and from shelters as Hurricane Florence approached [12,13]. Figure 1 summarizes the actions of Uber and Lyft during hurricane evacuations in the United States [5,9,10,11,12,13,14].
Although on-demand ride-sourcing has many advantages in evacuations, inappropriate planning may lead to negative impacts. The ride-sourcing platforms consist of a typical two-sided market, and many influential works on the economics of two-sided markets have been studied in the literature [69,70,71,72,73,74]. The dynamic pricing strategy which helps to balance varying demand and supply is crucial for ride-sourcing platforms. Cachon et al. [75] studied the performance of the fixed price/wage and the optimal dynamic pricing contract, with results showing that the latter can substantially increase platforms’ profit. Castillo et al. [76] proposed a dynamic pricing method to avoid high prices when demand is high. The role of optimal prices and the intermediary’s share of revenue was studied by Bikhchandani [73]. The spatial differentiation and network externality in dynamic pricing has been explored by Wu et al. [74]. Zha et al. [77] studied the spatial difference between each region and proposed an optimization method for geometric matching and pricing for ride-sourcing markets.
Many studies have explored the need to improve the operation of on-demand ride-sourcing during regular times. However, very limited research has been conducted on emergency evacuations. The recent research found in the literature consists of survey-related studies to address questions such as whether drivers would be willing to provide rides in evacuations and the preference to use ride-sourcing platforms during evacuations [6,7,8]. Li et al. [7] investigated the use of ride-sourcing services for no-notice evacuations in China; the study shows that a majority of drivers are willing to participate in evacuations. Most male drivers (52 out of 59) are willing to provide service when their family members are in the safe area, and single, young, male drivers show strong willingness: 10 of the 11 indicated willingness to provide services in evacuation. The study in Wong and Shaheen [6] shows 59% to 72% of drivers are willing to share personal transportation during an evacuation. Borowski and Stathopoulos [8] explored evacuation demand from survey data collected in the three popular metropolitan areas in the United States. The result shows ride-sourcing was selected as a preferred evacuation mode 17.6% of the time, while driving was selected 49.5% of the time, transit 34.2%, and bike/walking 12.9%. The feasibility of leveraging the sharing economy in evacuations was studied in the literature [3,5,6], which pointed out that driver availability and price are the biggest concerns when using ride-sourcing services. However, to the best of our knowledge, no study has yet paid substantial attention to the modeling of this problem in the context of evacuation operations.

3. Problem Description and Methodology Overview

NYC Emergency Management (NYCEM) is responsible for emergency planning and preparation. Figure 2 shows the 2016 hurricane evacuation zone map provided by NYCEM; the zones are color coded and labeled as represented on the map. There are six hurricane evacuation zones, ranked by the risk of storm surge impact, with Zone 1 being the most likely to flood. During an evacuation, the city will order residents to evacuate depending on the hurricane’s track and the projected storm surge.

3.1. Available Traffic Modes in Evacuation

According to American Community Survey [1], car ownership in NYC and Manhattan is 46% and 23%, respectively. Assuming all members of a household will use the household car to evacuate, 46% of people in NYC will evacuate by themselves, and 54% of households without access to personal cars will need to find other ways to evacuate. Traditionally, transit is the main transportation mode. The experience of Hurricane Sandy indicated how much NYC depends on the mass transit system, especially buses because rail is often not available in the outer boroughs. However, large-scale mass evacuation may overextend the public transit system under extreme conditions [78]. For example, during Hurricane Irene (2011), the subway system in NYC halted service, and stations were damaged as a result of rain and flooding [17]. In addition, with 0.2 million carless people in Zone 1 and 1.61 million carless people in all evacuation zones, buses might be able to support some range of evacuation, but they cannot serve a large number of evacuees in severe disasters, not to mention members of the mobility-disabled population.
Taxis also played an important role during past evacuation events. Compared to buses and subways, taxis can be flexible in terms of time and location, and they can successfully evacuate a small population. However, for mass evacuation, the number of existing taxis would fall far short of satisfying the demand (NYC has about 17,000 taxicabs). Additionally, taxi companies’ rates are set by local governments and cannot rise because of evacuation, but without extra compensation, many taxi drivers may not be willing to work during extreme weather conditions.
Micromobility can be another alternative traffic mode during emergency evacuations. Bicycles and e-scooters are convenient vehicles for short-distance travel, especially in very densely populated urban areas such as NYC. The article by Martin [79] states that people who used bicycles during Hurricane Katrina were able to evacuate faster than car users because they could avoid sitting in traffic. The survey conducted by Borowski and Stathopoulos [8] shows that biking/walking was selected as a preferred evacuation mode 12.9% of the time. In the context of mass evacuation, however, the use of micromobility requires careful planning. The streets may need to be redesigned with dedicated micromobility lanes, and physical barriers such as bollards or curbs should be taken into consideration for safety issues.
NYC has the lowest rate of private car ownership in the nation and the highest number of ride-sourcing vehicles. In the past few years, the rapid growth of app-based electronic dispatch services, such as Uber and Lyft, has changed the way people get around. As of 2018, there were about 130,000 for-hire vehicles (FHVs), mainly ride-sourcing vehicles, in NYC [80]. Generally, ride-sourcing companies rely on mobile phones and internet to provide services. This may raise the concern that not everyone has access to mobile phones and internet. Research by Pew Research Center [81] found that 19% of Americans do not have a smartphone, and 4% of Americans do not have any kind of cell phone. Vulnerable people without access to mobile phones may require assistance during evacuations, perhaps in the form of public agencies working with ride-sourcing companies to plan these trips in advance. For most other people, the use of smartphones and real-time GPS location enables ride-sourcing services to connect riders, drivers, and vehicles more quickly and effectively in the case of natural disasters such as hurricanes, where evacuees have a relatively longer time to react to evacuation orders by the authorities. Moreover, service disruptions that make it difficult to use cell phones during no-notice events, such as earthquakes and human-made disasters, are not expected to occur in the case of hurricane evacuations. However, it is important to consider possible loss of wireless services in certain cases when planning to use ride-sourcing services that depend on cell phones [82].
Although public transit is dominant in NYC, ride-sourcing services can sometimes be more preferred than the transit system. Many New Yorkers use Uber or Lyft because they are comfortable, private, and easy to access. According to Metropolitan Transportation Authority (MTA) ridership reports [83] and Taxi & Limousine Commission (TLC) trip data [80], the percentage of annual ridership of FHVs and taxis in 2017 was 18%. The modal split between taxis and FHVs was estimated by their average daily trips in 2019—27% of trips were completed by taxis, while 73% of trips were completed by FHVs [84]. With positive feedback received for services provided during previous disasters, ride-sourcing services have the potential to be an important traffic mode in evacuations.

3.2. The Role of Ride-Sourcing Services in Evacuation Management

Russo and Rindone [85] classified emergency management actions into four categories: Prevention/mitigation, preparedness, response, and recovery. Prevention/mitigations comprise activities carried out in advance to reduce the impact of the disaster, including land management and planning, public information campaigns, and educational programs. Preparedness ensures communities, resources, and services can respond to the impact and includes activities such as evacuation planning, exercising, and training. Response activities, which control or modify the emergency, include implementation of emergency plans and mobilization of resources. The last category, recovery, includes activities and services to support community reconstruction after emergency situations. Successful evacuation is closely related to timing. When sufficient time is available, a predesignated evacuation plan can effectively move people to safe areas. However, it is hard to move all the people when evacuation time is limited. In this case, a well-designed emergency plan for short-notice events can help reduce risk and move more people. In many cities, there are also shelter-in-place plans for people who cannot evacuate [86].
Ride-sourcing services can play a promising role in each part of the emergency management process. In the prevention/mitigation stage, ride-sourcing companies can partner with governments to plan trips for individuals with special needs in advance, provide resource information, and help increase emergency education to improve people’s willingness to share. In the preparedness stage, ride-sourcing companies can partner with governments to plan trips for individuals with special needs in advance. Training activities are important in risk reduction and can improve evacuation planning [87]. Special training and exercises can be provided to interested drivers, who can then assist all people in emergencies [3,8]. In the response and recovery stages, ride-sourcing can help distribute resource information, transfer evacuees with special needs, and provide travel services during the evacuation and in the recovery period that follows. The methodology proposed in this paper can provide insights for public officials and ride-sourcing companies to use in their emergency management processes.

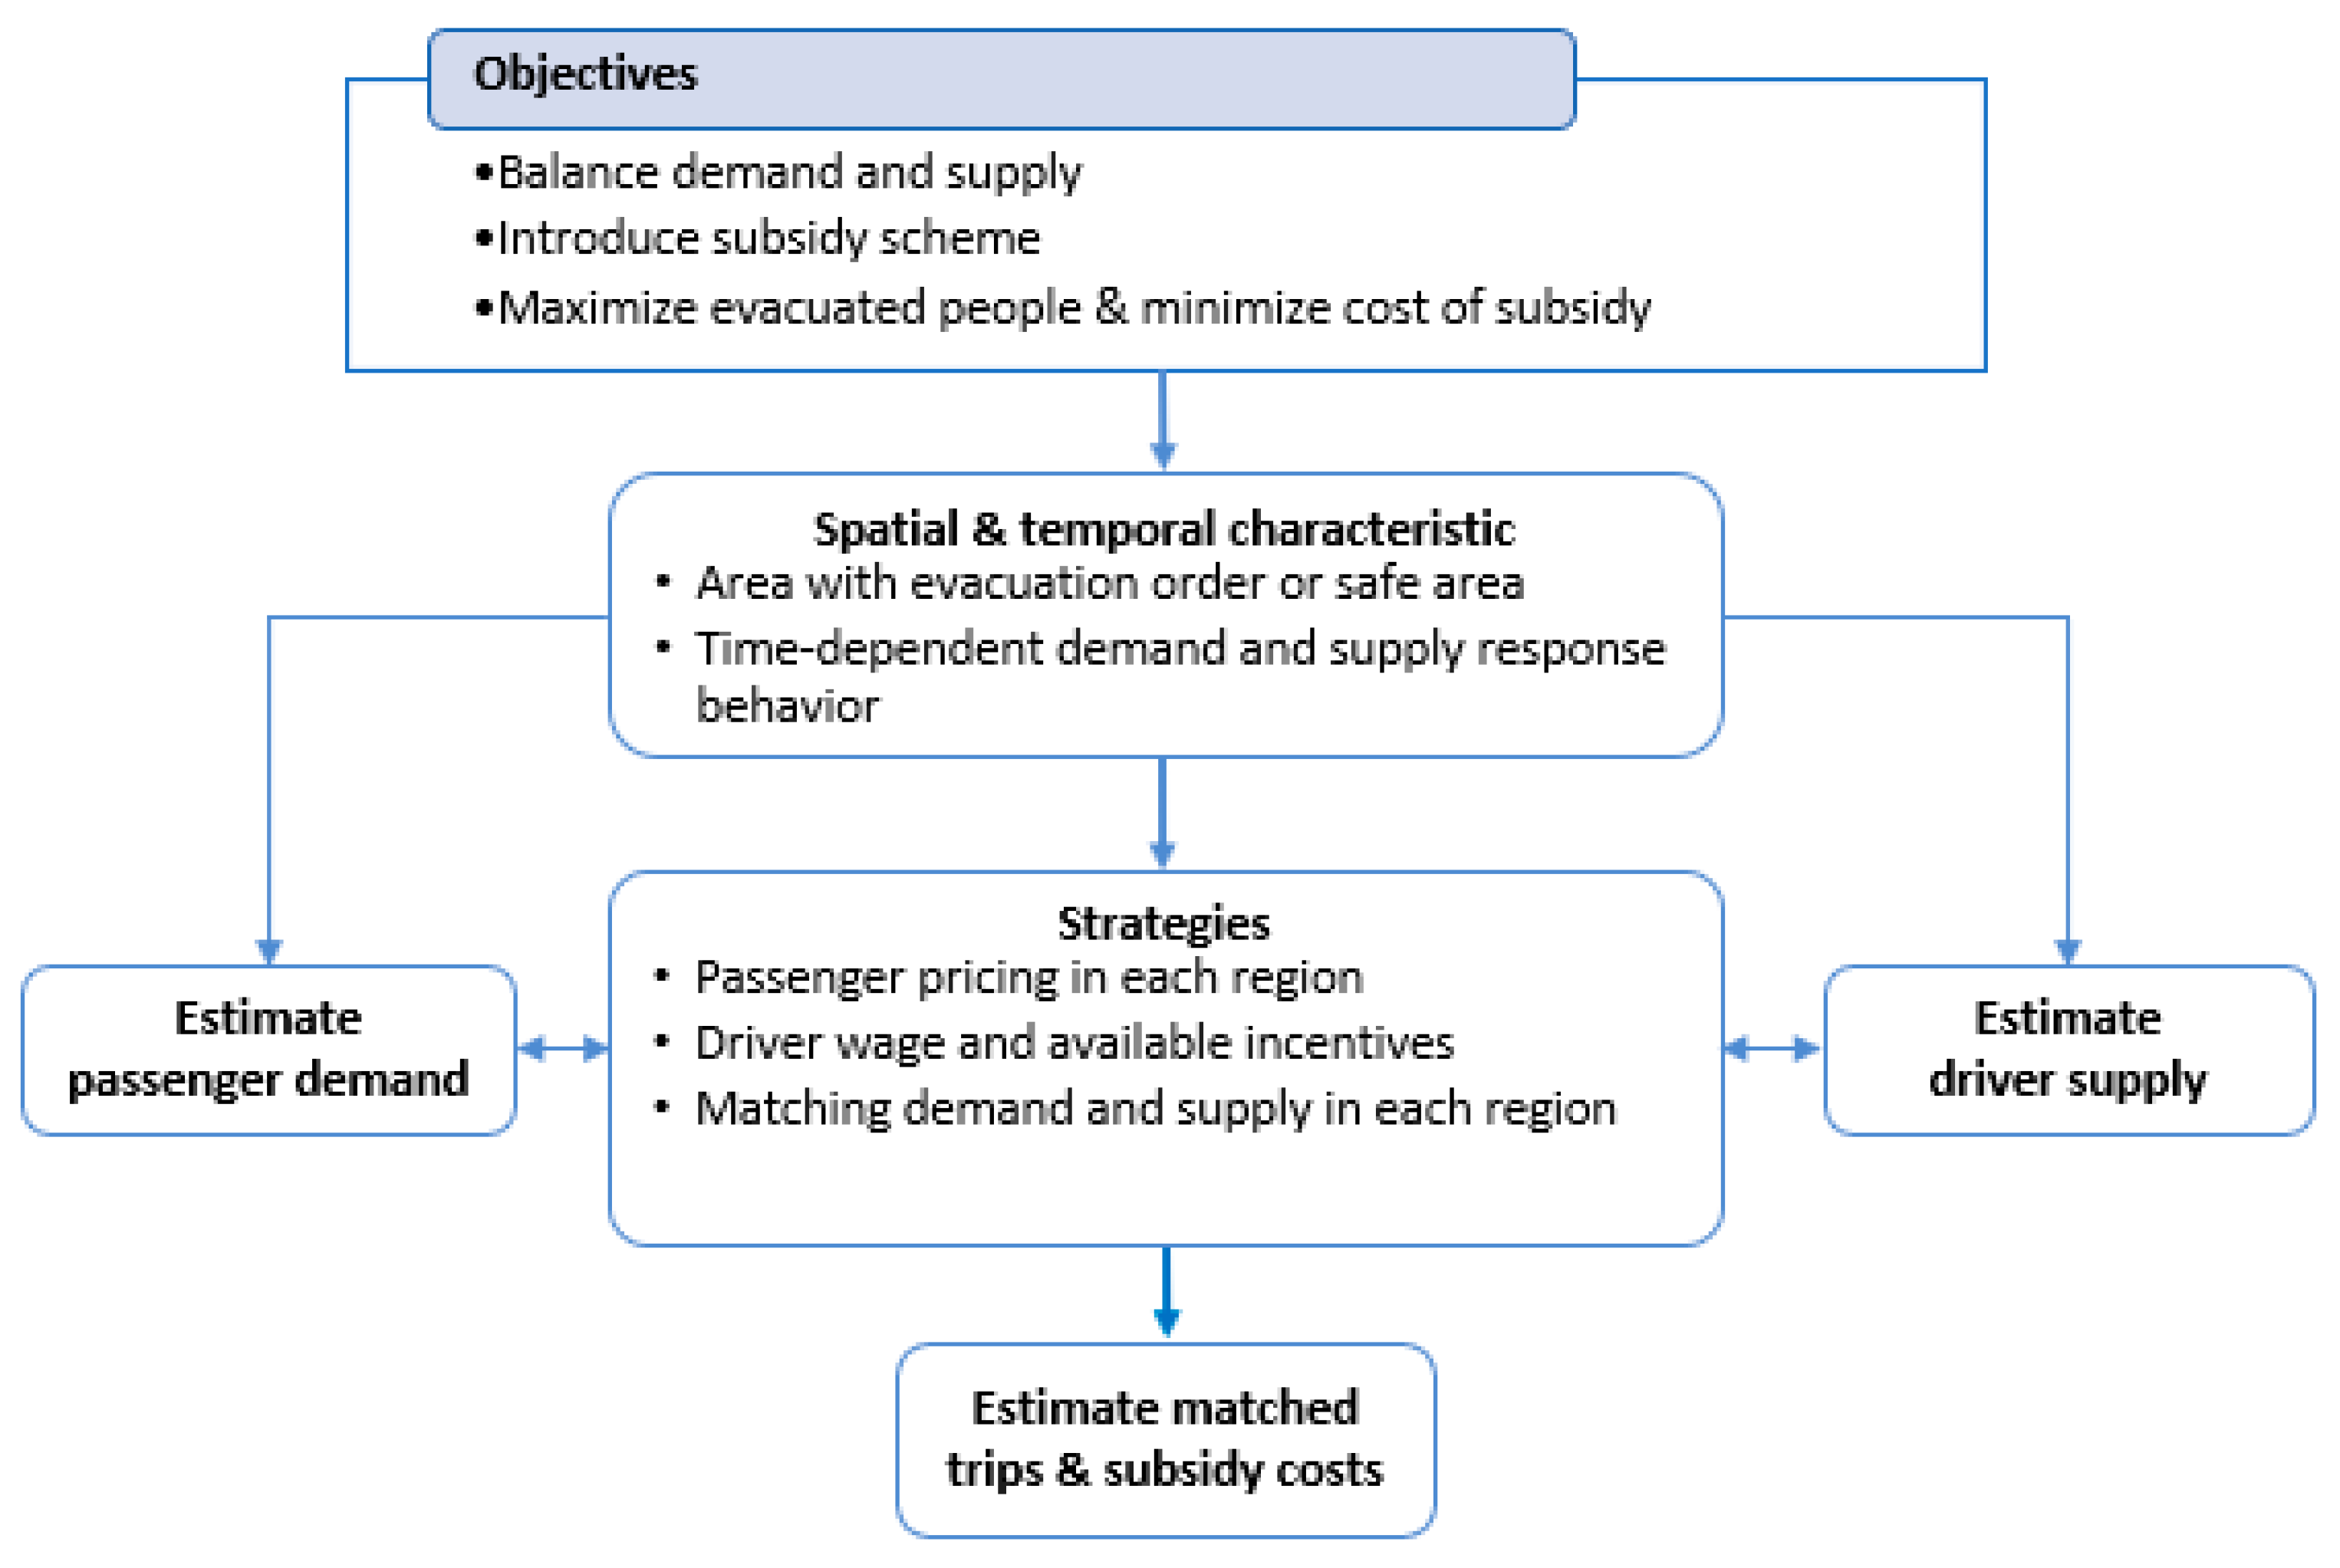
3.3. Methodology Overview

We propose a mathematical model designed to balance the demand and supply for ride-sourcing services in evacuations. The spatial characteristic of the model can provide different price settings in safe areas and evacuation areas. The temporal characteristic will quantify the proportion of people likely to evacuate in different time periods. The methodology framework is plotted in Figure 3. The bidirectional arrows indicate that elements interact with each other. For example, the price settings in the strategy box will affect demand and supply, which in turn will affect prices.

4. Modeling Approach

4.1. Notation

The list of variables used in this section is summarized in Table 1.

4.2. Demand, Supply, and Dynamic Pricing

The ride-sourcing services consist of a typical two-sided market, where price affects both demand and supply. Usually, we call the fare charged to passengers the price and remunerations paid to drivers the wage. There are two types of uncertainty during evacuation. The first is the drivers’ cost to provide services in evacuations. For example, since some drivers must also evacuate their families, participation can be costly for them, while the services of drivers who are available and willing to help the evacuees can be less costly. The second type of uncertainty occurs at the demand level. On regular days, the demand for ride-sourcing services can be higher during peak hours or lower at off-peak hours. In evacuations, however, the demand can be constantly much higher while the number of available drivers can be much lower than regular days.
To be specific, we consider a system with two regions: The disaster-impacted region, where evacuation orders are issued, and the safe/normal region. In this system, passengers can use either ride-sourcing services or other outside options (e.g., passengers can travel by public transit if the price of ride-sourcing service is too high for them). Following the previous studies on the two-sided market [73,74,77], we assume each passenger will have a utility v for taking ride-sourcing services, which is an independent draw from the cumulative distribution function Fb with density function fb, and each passenger also has the utility v b for choosing other outside options. On the supply side, drivers will have different costs for providing services in different regions. We assume the pair of cost ( c 1 , c 2 ) [ 0 , γ s ] 2 , which is independently distributed across drivers with cumulative distribution function F s and density function fs. Each driver also has the utility v s for choosing not to participate.
The ride-sourcing companies know the number of passengers and the number of drivers in region i , as well as the distributions of agents’ types F b , F s . However, each passengers’ value or drivers’ cost is not known, so in this paper we only focus on aggregate-level analysis and do not do perfect price discrimination. The transaction cost and other fixed costs are ignored since they do not have a major impact on the pricing strategy. Let i = 1 represent the region with evacuation order and i = 2 represent the safe region. The ride-sourcing companies will select a pair of prices ( p 1 , p 2 ) for passengers and a pair of wages ( w 1 , w 2 ) for drivers in different regions. For example, any passengers in region i with values greater than p i are willing to use the ride-sourcing service, and any driver in region i with cost less than wi are willing to provide services. At regular times, w i = δ p i , where δ is a fixed commission rate that enables the market to function and the platform to earn profits. As we are modeling the price in evacuations and Uber indicated they would waive all service fees, the fixed commission rate is not considered in this paper.
If μ i represents the number of demands in region i and the number of supply is one, μ i can be viewed as the number of demands per unit number of supply. We assume the number of matched trips in region i is a matching function of demand and supply M ( D i , S i ) . The matching function gives the maximal number of matched trips and has the following property:
M ( ρ D i , ρ S i ) = ρ M ( D i , S i )   for   any   ρ 0
Let θ i represent the market tightness in region i , which is equal to θ i = S i / D i . Based on the property of the matching function, the matching probability of passenger in region i is:
m b ( θ i ) = M ( 1 , θ i )
The matching probability of drivers in region i is:
m s ( θ i ) = M ( 1 / θ i , 1 )
We can find that m b ( θ i ) is strictly increasing for θ i [ 0 , 1 ] and m s ( θ i ) is strictly decreasing for θ i > 1 . In this paper, we assume the total number of matched trips is equal to the minimal number of demand and supply, which is equal to:
M ( D i , S i ) = m i n ( D i , S i )
To estimate the demand for ride-sourcing services, we assume passengers will accept the service only if the net payoff is larger than their outside options:
m b ( θ i ) ( v p i ) v b
The demand in region i under price p i will be:
D i = μ i ( 1 F b ( p i + v b / m b ( θ i ) )    
Similarly, drivers who choose to provide services with different wages in different regions will be willing to provide service in region i only if the earning in region i is higher than in another region and higher than the utility of not participating ( i   means not in region i ):
m s ( θ i ) ( w i c i ) m a x ( v s ,   m s ( θ i ) ( w i c i ) )
Equation (7) can be transferred to:
m s ( θ i ) ( w i c i ) v s     c i w i v s / m s ( θ i )
m s ( θ i ) ( w i c i ) m s ( θ i ) ( w i c i )     c i w i m s ( θ i ) m s ( θ i ) ( w i c i )
With drivers’ cost c i , the units of service provided in region i will be equal to:
Ω i = { ( c i , c i ) [ 0 , γ s ] 2 | c i w i v s / m s ( θ i ) , c i w i m s ( θ i ) m s ( θ i ) ( w i c i ) }

4.3. The Optimization Model for Pricing Strategy in Evacuation

We propose a model to optimize the ride-sourcing market in evacuations. We divide the study area into two regions: i = 1 represents the region with an evacuation order, while i = 2 represents the safe region. The ride-sourcing companies or government can determine the prices for passengers and wages for drivers in two regions ( p 1 , p 2 , w 1 , w 2 ) . At regular times, ride-sourcing companies set prices and wages to maximize their profit, while the main objective in evacuation modeling is to maximize the number of evacuated people within a limited time.
To increase the supply of drivers while charging a lower price to passengers during an evacuation, subsidies can be provided by private companies or the government as an incentive for drivers to participate. The simultaneous optimization of the system considering increasing matched trips and decreasing subsidy costs requires a designed trade-off. Generally, giving a higher wage to drivers while charging a lower price to passengers can increase the total number of matched trips, but subsidy costs will become a burden for the ride-sourcing companies or government. We propose to model the problem by optimizing the conflicting objective of maximizing the number of matched trips in the evacuation region while minimizing the cost of subsidies. To solve the multi-objective problem, a weighted approach was chosen so that the sum of two conflicting objectives will be maximized. Instead of having a single optimal solution, the model can provide a set of solutions by changing the weight parameters ( α , β ).
As we have mentioned, the service fee (commission rate) is not considered in evacuation, so all the prices charged to passengers will go to drivers. Additionally, the subsidy will only be provided for drivers in the evacuation region, so w 1 p 1 while w 2 = p 2 . This can be modified in future practices, such as adding the commission rate in the safe region so w 2 = δ p 2 , where δ is a fixed commission rate. The cost of subsidies for each trip equals wipi, which is the difference between the wage paid to drivers and the price charged to passengers. The nonlinearly constrained optimization problem is formulated in Model 1.
Model 1
                  m a x { p 1 , p 2 , w 1 , w 2 }     α M ( D 1 , S 1 ) β i M ( D i , S i ) ( w i p i )  
s .   t . D i = S i = μ i ( 1 F b ( p i + v b / m b ( θ i ) ) = Ω f s ( x , y ) d x d y  
w 1 p 1   a n d   w 2 = p 2
{ p 1 , p 2 , w 1 , w 2 } + 4
where α [ 0 , 1 ] , β [ 0 , 1 ] , and α + β = 1 . Generally, the optimal solution is hard to obtain from Model 1. However, with some appropriate assumptions for the distribution of F b (.) and F s (.), we can find the existence of the optimal solution.
Assumption 1.
The cumulative passenger value distribution F b (.) is strictly concave. The cumulative cost distribution F s (.) is strictly concave, so the joint distribution of supply function Ω f s ( x , y ) d x d y is strictly concave.
Assumption 1 requires that the density function f b is a decreasing function. Many commonly used distributions satisfy this assumption (e.g., uniform, exponential, Pareto). The joint strict concavity of Ω f s ( x , y ) d x d y also has a similar property. This shows that a higher passenger utility will lead to fewer passengers, while more service will be provided with higher wages. To simplify our analysis here, in the remainder of the paper we assume that Fb and F s are uniformly distributed on [ 0 , 1 ] and [ 0 , 1 ] 2 , respectively. Similar assumptions for ride-sourcing services at regular times can be found in Bikhchandani [73] and Wu et al. [74]. Since we only focus on the application of ride-sourcing services, to simplify the model, the outside options are assumed to be 0 ( v b = v s = 0 ). Then, we have the demand function in region i :
D i = μ i ( 1 F b ( p i ) )
From Equation (10), the provided services for the two regions are:
Ω i = { ( c i , c i ) [ 0 , 1 ] 2 | c i w i ,   c i w i w i + c i ) }
Proposition 1.
Based on Assumption 1, a unique tuple of optimal prices ( p 1 * , p 2 * , w 1 * , w 2 * )   for the objective function in Equation (11) can be obtained.
Proof. 
With the market equilibrium requirement, S i = D i , the objective function can be written as:
m a x { p 1 , p 2 , w 1 , w 2 } Π = α S 1 β i S i ( w i p i )
Based on Equation (15) and D i = S i , the passenger price is equal to:
p i = F b 1 ( 1 S i μ i )
The objective function can be written as:
m a x { p 1 , p 2 , w 1 , w 2 }   Π =   α S 1 β i S i ( w i F b 1 ( 1 S i μ i ) )
 □
Assumption 1 implies that F b 1 is convex and strictly increasing; the joint supply function Ω f s ( x , y ) d x d y is also a strictly concave function. The assumption on the distribution functions shows that the secondary derivative of the function Π is negative and Π is strictly concave, which guarantees the optimality and uniqueness of the solution in Model 1.
Remember we set two regions: i = 1 represents the region with the evacuation order, while i = 2 represents the safe region. We can divide any study area into these two regions. The supply functions can be obtained with Equation (16) and S i = Ω f s ( x , y ) d x d y under two conditions:
  • If the wage in Region 2 is higher than Region 1 w 1 w 2 :
    S 1 = 1 2 ( w 1 ) 2 + w 1 w 1 w 2 ,   S 2 = 1 2 ( w 1 ) 2 + w 2
  • If the wage in Region 1 is higher than Region 2 w 1 > w 2 :
    S 1 = 1 2 ( w 2 ) 2 + w 1 ,   S 2 = 1 2 ( w 2 ) 2 + w 2 w 1 w 2
With the equilibrium condition, the price for passengers can be obtained by having demand function equal supply function D i = S i . Using Equation (15), the prices will be:
p i = 1 S i / μ i
Equations (20) and (21) show that the wage in region i will directly affect the number of services supplied in that region: A higher w i will increase the supply S i in region i while decreasing the supply in another region S i . The price equation p i = 1 S i / μ i shows that the wage will affect the passenger price. This is because the spatial difference of wage will change the supply distribution in different regions, and the supply will in turn affect the demand in the same region. With Assumption 1, Model 1 can be transferred to Model 2 below.
Model 2
                m a x { p 1 , p 2 , w 1 , w 2 }           α S 1 β i S i ( w i + S i / μ i 1 )
s .   t . D i = S i = μ i ( 1 F b ( p i ) ) = Ω f s ( x , y ) d x d y
w 1 p 1   a n d   w 2 = p 2
{ p 1 , p 2 , w 1 , w 2 } + 4
The sequential quadratic programming (SQP) algorithm build in Python, which is an iterative method for constrained nonlinear optimization, is used to solve the problem.

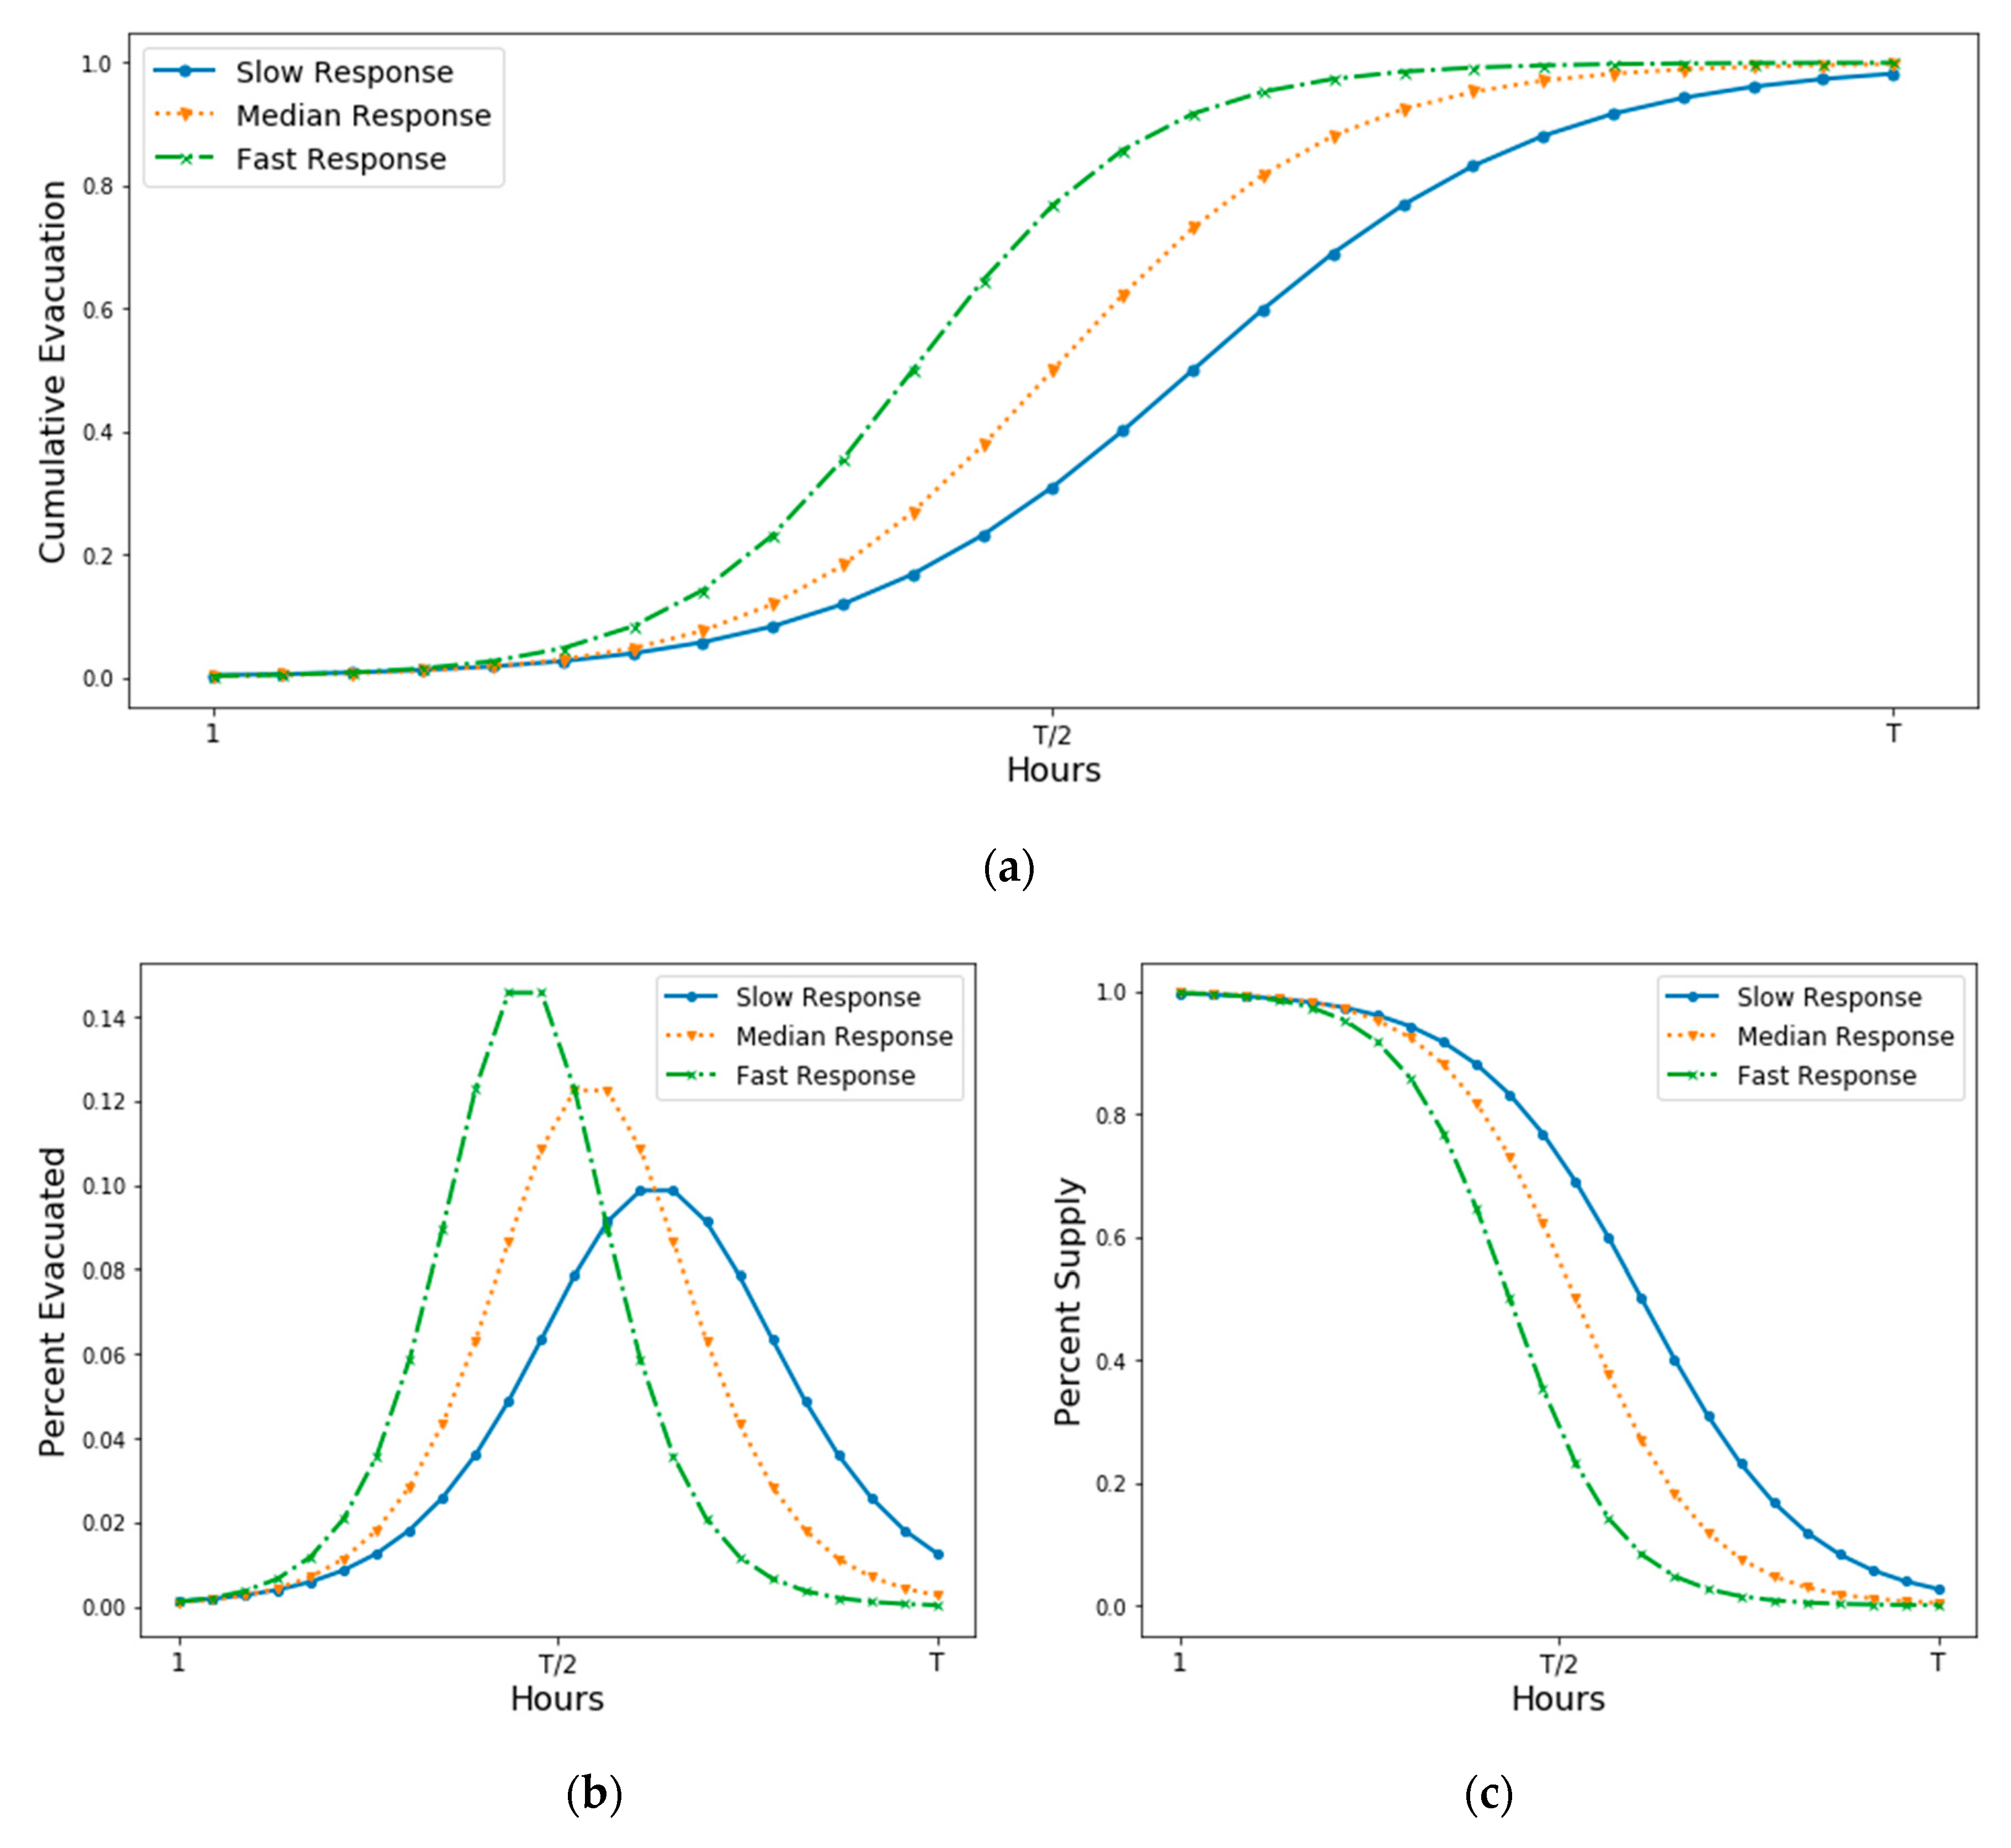
4.4. Time-Dependent Demand and Supply of Ride-Sourcing Services in Evacuation

In evacuations, the demand cannot be evenly distributed in each hour, so modeling time-dependent evacuation demand determines the number of people evacuating and spreads them temporally [26,88,89]. This is typically done by using a demand response curve, which estimates the proportion of people beginning to evacuate within each time interval. The U.S. Army Corps of Engineers (USACE) proposed three types of response curves—slow, median, and fast—based on behavioral analysis of past storms [90]. Li et al. [20] estimated the evacuation response curve during Hurricane Irene in Cape May County, New Jersey. As the calibrated S-curves obtained using logit functions are observed to fit the empirical data better, this will be used as the demand response function in this paper.
Similarly, we assume the availability of ride-sourcing drivers during an evacuation is time dependent. More drivers are willing to offer services at the beginning of the evacuation, but as time goes by it becomes more dangerous for drivers to provide services. As a result, the supply of drivers should be a time-dependent decreasing curve. Since the data and related studies are limited for estimating the supply response behavior of ride-sourcing services in past evacuations, we assume the supply is a decreasing S-curve similar to the demand model, but continuously decreasing with time t. The cumulative demand and percent supply functions are equal to:
P t , d = 1 / [ 1 + e x p ( a d ( t H d ) )   ]
P t , s = 1 / [ 1 + e x p ( a s ( t H s ) )   ]
where P t , d is the cumulative demand percentage of evacuees at time t, P t , s is the percentage of supply at time t, and a d , a s ,   H d , H s are shape parameters. a d gives the slope of the cumulative demand loading curve, and H d is the half loading time, when half of the evacuees in the system have departed. a s gives the slope of the traffic supply curve, and H s indicates the time when half of the services can be provided. The parameters should be calibrated using real data in the future if available.
Figure 4 shows examples of evacuation demand and supply response curves. Figure 4a shows the cumulative evacuation demand, Figure 4b,c show the percent population evacuated and percent service supplied in each time step (T is the total evacuation time), respectively. To study the impact of different evacuation response behaviors on the total matched trips and cost of subsidies in an evacuation, we can divide the entire evacuation into multiple time periods. For each time period, we can use Model 2 to optimize the price settings, then sum the matched trips and cost over the entire evacuation.

5. Numerical Study

Ride-sourcing services may help address the limited resources and social equity problems [3]. We proposed a mathematical model that can help balance demand and driver supply through a realistic pricing mechanism for ride-sourcing services in evacuations. Subsidies are considered an incentive to help increase the supply of drivers in evacuations. The main objective of evacuation-related modeling is to maximize the number of evacuated people within a limited time. A weighted multi-objective model is used to maximize the total number of matched trips in the evacuation region while minimizing the cost of subsidies. In future practice, ride-sourcing companies can use the model to determine prices, and government can develop regulation policies based on the model and results.
The proposed pricing strategy is tested using a hypothetical hurricane evacuation scenario in NYC. Taxi and FHV trip data are released by NYC TLC [80]. The taxi dataset is available from 2010, while FHV data is available from 2015. The most recent evacuation order was Hurricane Sandy in 2012. NYC officials issued mandatory evacuation orders for Evacuation Zone 1, which had about 370,000 residents, on Sunday, 28 October 2012. We use taxi data during Hurricane Sandy to estimate the demand and supply of ride-sourcing services because this is the safest way to evaluate the model performance with realistic data from previous evacuation events. This can be improved in the future with reliable data or survey results for demand and supply estimation of ride-souring services in evacuations. Figure 5 shows the number of taxi trips by pickup locations in the evacuation zone. We compared the taxi trips on Sunday, 28 October 2012 (evacuation order issued in Hurricane Sandy) and Sunday, 14 October 2012, which is two weeks before Sandy with normal weather condition. The colors in outer boroughs are lighter during the evacuation period compared to normal time periods, which indicates a lower number of taxi trips in the area after the evacuation order is issued before the landfall of Hurricane Sandy.
The case study area is located in Manhattan from 60th Street south, which is highlighted in Figure 5. The FHV trip records are only available from 2015, but the demand and supply of FHV trips in future evacuation events should have similar trends as taxi data during Hurricane Sandy. The number of taxi pickup trips and the corresponding ridership in each zone are shown in Table 2. Ridership is estimated by counting the number of passengers from the taxi trip data. The total ridership will be used as an approximate FHV demand. The average daily trips in Zone 1 during Sandy evacuation is 81% of the regular time, which can be an indication of decreased supply during the evacuation before the landfall of Hurricane Sandy. We assume the percent decreased supply in the case study will be similar in each zone as during Sandy. In October 2019, the average daily trips of high-volume FHVs and taxis was 682,635 trips and 243,641 trips, respectively. We assume the total supply of FHVs in this case study will be 2.8 times the number of taxi trips during Sandy. The average passenger in each trip is 1.7 persons per vehicle, according to taxi data from the Sandy evacuation, so we assume each supply can serve 1.7 demands.
Table 3 shows a list of major input parameters for the model. Three types of demand-supply response behaviors with different shape parameters are tested: Slow response, median response, and fast response. The slow response can represent more proactive evacuation planning or a less dangerous event in which people will initially evacuate slowly and continue to increase later. In a fast response, many people may react to evacuation quickly and begin to evacuate at an earlier time, so the supply will be mainly needed during early periods. When more evacuation trip data is available in the future, the shape parameters of the demand and supply response curve can be calibrated with real data.

5.1. Comparison between Different Pricing Strategies

Assume a hypothetical evacuation is ordered in Zone 1. Let i = 1 represent trips within Zone 1 and i = 2 represent trips in the study area outside of Zone 1. To study the impact of evacuation behaviors on the total matched trips and cost of subsidies, μ 1 at each time step will be estimated from Equations (27) and (28). The parameters of demand and supply curve are shown in Table 3; μ 2 is assumed to be 1. Other input parameters are given in Table 3. We compare three pricing strategies here. The objective of FHV platforms is to maximize their profit at regular times. Thus, Method 1 is to use the pricing strategy at regular times, allowing the passenger price to be higher or lower than the drivers’ wage in both regions by setting the objective function to be equal to:
m a x { p 1 , p 2 , w 1 , w 2 } i S i ( p i w i )
Then, we test the model performance with different weight parameters in the objective function. We select two extreme conditions where α = 0 , β = 1 and α = 1 , β = 0 as Method 2 and Method 3. The three methods are briefly described below:
  • Method 1: Pricing strategy at regular times with the objective in Equation (29).
  • Method 2: Proposed pricing strategy in Model 2 designed for evacuations, w1p1 in the evacuation region,   w 2 = p 2 in the safe region. The weight parameters in the objective function are equal to α = 0 , β = 1 .
  • Method 3: Similar to Method 2, but the weight parameters are equal to α = 1 , β = 0 .
We optimize the price settings in each time period, then sum all matched trips and costs. Table 4 shows the model results under different methods and evacuation response behaviors. The objective of Method 1 is to maximize the profit, so the costs are negative. Compared to Method 1, Method 2 can increase the number of trips by 52%, 43%, and 43% without any cost in slow response, median response, and fast response, respectively. After adding subsidies to drivers’ wages, Method 3 can increase the matched trips in Method 2 by 62%, 53%, and 48% (which will be 148%, 120%, and 113% compared to Method 1) in slow response, median response, and fast response, respectively. Method 2 and Method 3 can be considered as two extreme versions of the proposed model where more trips can be matched with more subsidies. With subsidies provided by the city government or companies, lower-income and vulnerable individuals can benefit substantially from reduced costs of transportation.
Different evacuation behaviors are found to have significant impacts on the results. In Method 3, for example, compared to the slow response condition, the median response has 12% fewer matched trips, while in the case of the fast response, the matched trips are 25% fewer than the slow response. Therefore, evacuation behavior is shown to be a crucial component of an evacuation study involving ride-sourcing services where the demand and supply are mainly controlled through pricing.

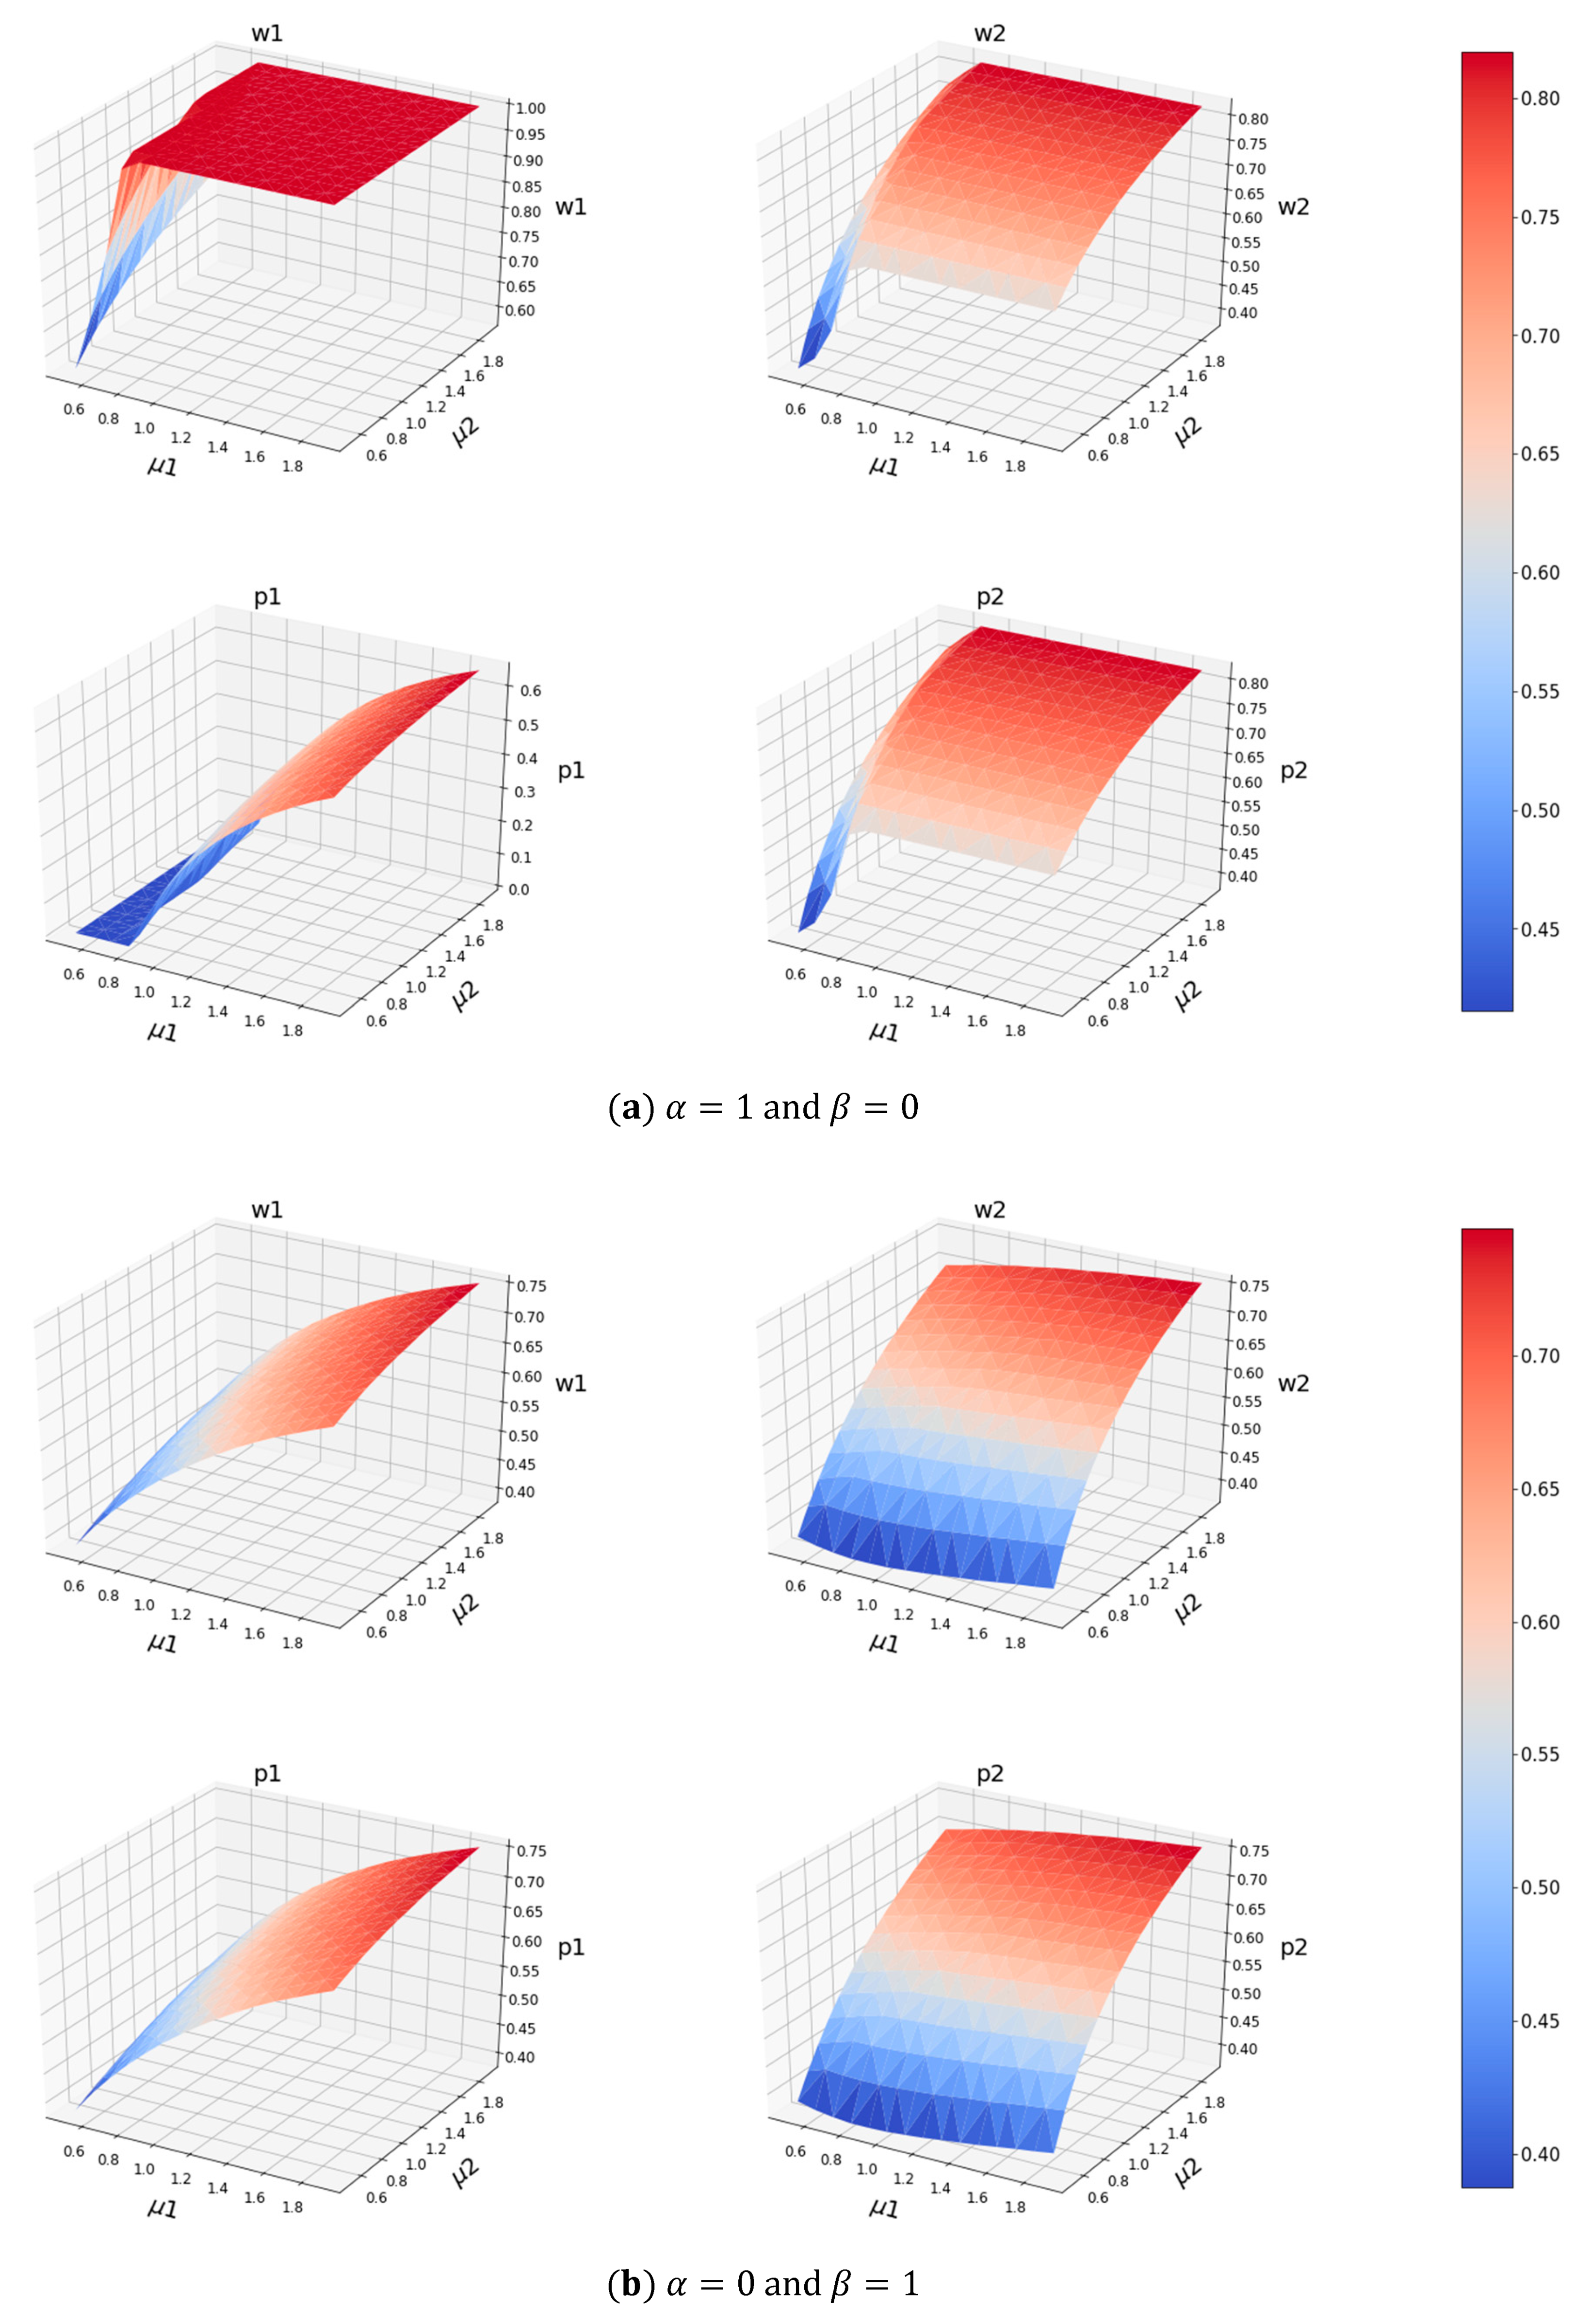
5.2. Sensitivity Analysis of Demand and Supply

The sensitivity of the model with respect to the demands μ i in different regions is also tested. The variable μ i shows the amount of demand per unit number of supply, which is one of the key factors that will affect the model results. Changes in demand (e.g., mode share, car ownership) and supply (e.g., available drivers) are essentially changes in μ i . Figure 6 shows the impact of μ i on the set of optimal pricings ( p 1 * , p 2 * , w 1 * , w 2 * ) with different weight parameters. Region 1 is the evacuation region, while Region 2 is the safe region. From the model result, we can conclude that increase of μ i in one region increases the passenger prices and drivers’ wages in this region. This result shows that the model is increasing the drivers’ wages to attract more drivers while decreasing the demand by increasing the passengers’ prices. The optimal pricing sets with different weight parameters are shown in Figure 6. In Figure 6a, drivers’ wages are always higher than the prices paid by passengers in Region 1, while prices are equal to wages in Region 2. In Figure 6b, the prices are always equal to the wages in both regions because α = 0   and   β = 1 .

6. Conclusions and Future Work

With limited public resources available to evacuate all citizens, especially vulnerable populations like the elderly and disabled people, alternative transportation strategies must be considered for optimizing and expanding resources. The shared mobility of ride-sourcing companies may help address problems of limited resources and social equity [3,5,6,7,8]. This paper proposes a mathematical modeling approach to optimize the efficiency of evacuations by leveraging ride-sourcing services. Most importantly, this study shows that more equitable evacuations can be achieved in the future with subsidies provided by governments or companies, such that lower-income and vulnerable individuals could benefit substantially from ride-sourcing services. The models and solution methods proposed in this paper can provide decision-making support for emergency management officials as well as local and regional transportation agencies. The case study section of the paper showed the feasibility of the proposed method and the applicability of subsidies for ride-sourcing services in evacuations.
This paper provides initial insights for modeling ride-sourcing services in evacuations. There are some limitations in this research that may be addressed in future work. First, the demand and supply of ride-sourcing services in evacuations should be more accurately estimated in future practice by using real data if available. People’s choices among these new alternative transportation modes during an evacuation require further research. Russo and Rindone [85] indicated that the target evacuees include four categories: Residents within the evacuation area, nonresidents who systematically travel to the evacuation area for work (employees), occasional nonresidents who occasionally travel to the evacuation area for shopping or other activities, and users with special needs. Therefore, when estimating the evacuation demand, it is important to understand the behavior of local residents as well as the transitionary population, such as commuters and tourists. Second, assumptions in the modeling section (e.g., passenger value distribution function F b and driver cost distribution function Fs) can be calibrated in the future with available data. Different types of subsidies can be added to the model for different population groups. The compatibility between travel time and evacuation time can be enhanced in future research with evacuation route planning. Finally, it should be noted that the feasibility of the proposed method depends on the size of the carless population and the availability and size of ride-sourcing services. Large cities with large carless populations (e.g., NYC, San Francisco, New Orleans) can benefit from the increase in resources during an evacuation, while in many small cities or rural areas where there are not enough FHVs to start with, it may be more efficient to use private cars or coordinate some kind of emergency carpooling with neighbors.
There are many uncertainties in developing shared resources and providing social equity services to fill the gaps in current disaster preparation. Several key directions for future research regarding leveraging shared resources in evacuations can be found in recent research [3,5,6,7,8]. More research and policies are needed in this field to support collaborative disaster response through public–private partnerships. Many challenges also remain in the use of ride-sourcing services in evacuations, including the effects of increased road congestion, methods to prevent drivers from accessing a dangerous region, and the physical and psychological impact of the evacuation process on drivers. The recent COVID-19 pandemic also adds new risks for hurricane evacuation with the social distancing requirement [91].
Although many challenges remain in developing shared mobility strategies for evacuations, public agencies and private companies should consider ride-sourcing to be an additional and important resource in future evacuation planning. The methodology and results in this paper can provide useful insights for modeling on-demand ride-sourcing for evacuations.

Author Contributions

Study conception and design: D.W. and K.O.; data collection and model construction: D.W., Z.B. and K.O.; analysis and interpretation of results: D.W. and K.O.; manuscript preparation: D.W., K.O. and Z.B. All authors have read and agreed to the published version of the manuscript.

Funding

This research and APC were funded by the Connected Cities for Smart Mobility towards Accessible and Resilient Transportation (C2SMART), a Tier 1 University Center awarded by U.S. Department of Transportation under contract 69A3351747124.

Institutional Review Board Statement

Not applicable.

Informed Consent Statement

Not applicable.

Data Availability Statement

The data presented in this study is publicly available from NYC Taxi & Limousine Commission website [80].

Acknowledgments

The contents of this paper only reflect the views of the authors and do not represent any official views of any organization or agency.

Conflicts of Interest

The authors declare that they have no competing interests.

References

  1. ACS. American Community Survey (ACS) Microdata (2014–2018). 2018. Available online: https://www.census.gov/acs/www/data/data-tables-and-tools/data-profiles/ (accessed on 10 July 2020).
  2. Litman, T. Lessons from Katrina and Rita: What Major Disasters Can Teach Transportation Planners. J. Transp. Eng. 2006, 132, 11–18. [Google Scholar] [CrossRef] [Green Version]
  3. Wong, S.D.; Broader, J.C.; Shaheen, S.A. Can Sharing Economy Platforms Increase Social Equity for Vulnerable Populations in Disaster Response and Relief? A Case Study of the 2017 and 2018 California Wildfires. Transp. Res. Interdiscip. Perspect. 2020, 5, 100131. [Google Scholar] [CrossRef]
  4. Renne, J.L.; Mayorga, E. What has America learned since Hurricane Katrina? Evaluating evacuation plans for carless and vulnerable populations in 50 large cities across the United States. In Proceedings of the 97th Transportation Research Board Annual Meeting, Washington, DC, USA, 7–11 January 2018. [Google Scholar]
  5. Wong, S.D.; Walker, J.L.; Shaheen, S.A. Bridging the gap between evacuations and the sharing economy. Transportation 2020, 1–50. [Google Scholar] [CrossRef] [Green Version]
  6. Wong, S.; Shaheen, S. Current State of the Sharing Economy and Evacuations: Lessons from California; University of California, Institute of Transportation Studies: Berkeley, CA, USA, 2019. [Google Scholar]
  7. Li, M.; Xu, J.; Liu, X.; Sun, C.; Duan, Z. Use of Shared-Mobility Services to Accomplish Emergency Evacuation in Urban Areas via Reduction in Intermediate Trips—Case Study in Xi’an, China. Sustainability 2018, 10, 4862. [Google Scholar] [CrossRef] [Green Version]
  8. Borowski, E.; Stathopoulos, A. On-demand ridesourcing for urban emergency evacuation events: An exploration of message content, emotionality, and intersectionality. Int. J. Disaster Risk Reduct. 2020, 44, 101406. [Google Scholar] [CrossRef]
  9. Lipschultz, B. Uber Gives Free Rides to Shelters in Hurricane Irma’s Path. 2017. Available online: https://www.bloomberg.com/news/articles/2017-09-10/uber-gives-free-rides-to-shelters-in-hurricane-irma-s-path (accessed on 10 July 2020).
  10. Lyft. Lyft Offers Help during Hurricane Irma. 2017. Available online: https://www.masstransitmag.com/alt-mobility/shared-mobility/car-sharing/press-release/12366748/lyft-lyft-offers-help-during-hurricane-irma (accessed on 10 July 2020).
  11. Uber. Uber Hurricane Harvey Relief Efforts. 2017. Available online: https://www.uber.com/blog/texas/428454/ (accessed on 10 July 2020).
  12. Lyft. Lyft Help during Hurricane Florence. 2018. Available online: https://blog.lyft.com/posts/2018/9/12/help-during-hurricane-florence (accessed on 20 June 2020).
  13. Uber. Hurricane Michael Relief Efforts. 2018. Available online: https://www.uber.com/blog/florida/hurricane-michael-relief-efforts/ (accessed on 20 June 2020).
  14. Diaz, J. Need a Ride to a Hurricane Shelter? Uber and Lyft Will Take You There for Free during Dorian. 2019. Available online: https://www.sun-sentinel.com/news/weather/hurricane/fl-ne-hurricane-dorian-uber-lyft-free-rides-20190902-2fx4cqfprndndknv7g6xbcooma-story.html (accessed on 20 June 2020).
  15. Weiner, J. Is Uber’s Surge Pricing Fair? 2014. Available online: https://www.washingtonpost.com/blogs/she-the-people/wp/2014/12/22/is-ubers-surge-pricing-fair/?utm_term=.9ce9071bac21 (accessed on 20 June 2020).
  16. Walk, H. Uber NYC and the Sandy Surge. 2012. Available online: http://fortune.com/2012/11/02/uber-nyc-and-the-sandy-surge/ (accessed on 10 July 2020).
  17. Barron, J. With Hurricane Irene Near, 370,000 in New York City Get Evacuation Order. 2011. Available online: https://www.nytimes.com/2011/08/27/nyregion/new-york-city-begins-evacuations-before-hurricane.html (accessed on 10 July 2020).
  18. Akter, S.; Wamba, S.F. Big data and disaster management: A systematic review and agenda for future research. Ann. Oper. Res. 2019, 283, 939–959. [Google Scholar] [CrossRef] [Green Version]
  19. Bayram, V. Optimization models for large scale network evacuation planning and management: A literature review. Surv. Oper. Res. Manag. Sci. 2016, 21, 63–84. [Google Scholar] [CrossRef]
  20. Li, J.; Ozbay, K.; Bartin, B.; Iyer, S.; Carnegie, J.A. Empirical evacuation response curve during Hurricane Irene in Cape May County, New Jersey. Transp. Res. Rec. 2013, 2376, 1–10. [Google Scholar] [CrossRef] [Green Version]
  21. Lindell, M.K.; Murray-Tuite, P.; Wolshon, B.; Baker, E.J. Large-Scale Evacuation: The Analysis, Modeling, and Management of Emergency Relocation from Hazardous Areas; CRC Press: Boca Raton, FL, USA, 2018. [Google Scholar]
  22. Thompson, R.R.; Garfin, D.R.; Silver, R.C. Evacuation from Natural Disasters: A Systematic Review of the Literature. Risk Anal. 2016, 37, 812–839. [Google Scholar] [CrossRef] [PubMed] [Green Version]
  23. Xie, K.; Ozbay, K.; Zhu, Y.; Yang, H. Case studies for data-oriented emergency management/planning in complex urban systems. In Transactions on Large-Scale Data-and Knowledge-Centered Systems XXVII; Springer: Berlin/Heidelberg, Germany, 2016; pp. 190–207. [Google Scholar]
  24. Zhu, Y.; Ozbay, K.; Xie, K.; Yang, H. Using big data to study resilience of taxi and subway trips for hurricanes Sandy and Irene. Transp. Res. Rec. 2016, 2599, 70–80. [Google Scholar] [CrossRef]
  25. Xie, K.; Ozbay, K.; Yang, H. Spatial analysis of highway incident durations in the context of Hurricane Sandy. Accid. Anal. Prev. 2015, 74, 77–86. [Google Scholar] [CrossRef]
  26. Ozbay, K.; Yazici, M.A.; Iyer, S.; Li, J.; Ozguven, E.E.; Carnegie, J.A. Use of regional transportation planning tool for modeling emergency evacuation: Case study of northern New Jersey. Trans. Res. Rec. 2012, 2312, 89–97. [Google Scholar] [CrossRef]
  27. Yazici, A.; Ozbay, K. Evacuation network modeling via dynamic traffic assignment with probabilistic demand and capacity constraints. Trans. Res. Rec. 2010, 2196, 11–20. [Google Scholar] [CrossRef]
  28. Lindell, M.K. Evacuation planning, analysis, and management. In Handbook of Emergency Response; CRC Press: Boca Raton, FL, USA, 2013; pp. 156–185. [Google Scholar]
  29. Murray-Tuite, P.; Wolshon, B. Evacuation transportation modeling: An overview of research, development, and practice. Transp. Res. Part C Emerg. Technol. 2013, 27, 25–45. [Google Scholar] [CrossRef]
  30. Deka, D.; Carnegie, J. Analyzing evacuation behavior of transportation-disadvantaged populations in northern New Jersey. In Proceedings of the Transportation Research Board 89th Annual Meeting, Washington, DC, USA, 10–14 January 2010. [Google Scholar]
  31. Solís, D.; Thomas, M.; Letson, D. An empirical evaluation of the determinants of household hurricane evacuation choice. J. Dev. Agric. Econ. 2010, 2, 188–196. [Google Scholar]
  32. Hasan, S.; Ukkusuri, S.; Gladwin, H.; Murray-Tuite, P. Behavioral model to understand household-level hurricane evacuation decision making. J. Transp. Eng. 2011, 137, 341–348. [Google Scholar] [CrossRef] [Green Version]
  33. Xu, J.; Yin, X.; Chen, D.; An, J.; Nie, G. Multi-criteria location model of earthquake evacuation shelters to aid in urban planning. Int. J. Disaster Risk Reduct. 2016, 20, 51–62. [Google Scholar] [CrossRef]
  34. Yin, W.; Murray-Tuite, P.; Ukkusuri, S.V.; Gladwin, H. Modeling shadow evacuation for hurricanes with random-parameter logit model. Transp. Res. Rec. 2016, 2599, 43–51. [Google Scholar] [CrossRef]
  35. Gudishala, R.; Wilmot, C. Comparison of time-dependent sequential logit and nested logit for modeling hurricane evacuation demand. Transp. Res. Rec. 2012, 2312, 134–140. [Google Scholar] [CrossRef]
  36. Hasan, S.; Mesa-Arango, R.; Ukkusuri, S. A random-parameter hazard-based model to understand household evacuation timing behavior. Transp. Res. Part C Emerg. Technol. 2013, 27, 108–116. [Google Scholar] [CrossRef]
  37. Sarwar, M.T.; Anastasopoulos, P.C.; Ukkusuri, S.V.; Murray-Tuite, P.; Mannering, F.L. A statistical analysis of the dynamics of household hurricane-evacuation decisions. Transportation 2018, 45, 51–70. [Google Scholar] [CrossRef]
  38. Mesa-Arango, R.; Hasan, S.; Ukkusuri, S.V.; Murray-Tuite, P. Household-level model for hurricane evacuation destination type choice using hurricane Ivan data. Nat. Hazards Rev. 2013, 14, 11–20. [Google Scholar] [CrossRef] [Green Version]
  39. Wong, S.; Shaheen, S.; Walker, J. Understanding Evacuee Behavior: A Case Study of Hurricane Irma; Institute of Transportation Studies Berkeley: Berkeley, CA, USA, 2018. [Google Scholar]
  40. Sadri, A.M.; Ukkusuri, S.V.; Murray-Tuite, P.; Gladwin, H. Analysis of hurricane evacuee mode choice behavior. Transp. Res. Part C Emerg. Technol. 2014, 48, 37–46. [Google Scholar] [CrossRef]
  41. Sadri, A.M.; Ukkusuri, S.V.; Murray-Tuite, P.; Gladwin, H. How to evacuate: Model for understanding the routing strategies during hurricane evacuation. J. Transp. Eng. 2014, 140, 61–69. [Google Scholar] [CrossRef]
  42. Akbarzadeh, M.; Wilmot, C.G. Time-dependent route choice in hurricane evacuation. Nat. Hazards Rev. 2015, 16, 04014021. [Google Scholar] [CrossRef]
  43. Sadri, A.M.; Ukkusuri, S.V.; Murray-Tuite, P.; Gladwin, H. Hurricane evacuation route choice of major bridges in Miami Beach, Florida. Transp. Res. Rec. 2015, 2532, 164–173. [Google Scholar] [CrossRef]
  44. Kulshrestha, A.; Lou, Y.; Yin, Y. Pick-up locations and bus allocation for transit-based evacuation planning with demand uncertainty. J. Adv. Transp. 2014, 48, 721–733. [Google Scholar] [CrossRef]
  45. Aalami, S.; Kattan, L. Fair dynamic resource allocation in transit-based evacuation planning. Transp. Res. Procedia 2017, 23, 400–419. [Google Scholar] [CrossRef]
  46. Hess, L.S. An Emergency Evacuation Planning Model for Special Need Populations Utilizing Public Transit Systems; Florida Atlantic University: Boca Raton, FL, USA, 2009. [Google Scholar]
  47. Bian, R.; Wilmot, C.G. Measuring the vulnerability of disadvantaged populations during hurricane evacuation. Nat. Hazards 2017, 85, 691–707. [Google Scholar] [CrossRef]
  48. Bian, R.; Wilmot, C.G. An analysis on transit pick-up points for vulnerable people during hurricane evacuation: A case study of New Orleans. Int. J. Disaster Risk Reduct. 2018, 31, 1143–1151. [Google Scholar] [CrossRef]
  49. Goerigk, M.; Grün, B. A robust bus evacuation model with delayed scenario information. OR Spectr. 2014, 36, 923–948. [Google Scholar] [CrossRef]
  50. Morgul, E.F.; Cavus, O.; Ozbay, K.; Iyigun, C. Modeling of bus transit driver availability for effective emergency evacuation in disaster relief. Transp. Res. Rec. 2013, 2376, 45–55. [Google Scholar] [CrossRef] [Green Version]
  51. Wolshon, B. Planning for the evacuation of New Orleans. Inst. Transp. Eng. ITE J. 2002, 72, 44. [Google Scholar]
  52. Boyd, E.; Wolshon, B.; Van Heerden, I. Risk Communication and Public Response during Evacuations: The New Orleans Experience of Hurricane Katrina. Public Perform. Manag. Rev. 2009, 32, 437–462. [Google Scholar] [CrossRef]
  53. Fothergill, A.; Maestas, E.G.; Darlington, J.D. Race, ethnicity and disasters in the United States: A review of the literature. Disasters 1999, 23, 156–173. [Google Scholar] [CrossRef]
  54. Cahalan, C.; Renne, J. Emergency Evacuation of the Elderly and Disabled; National Emergency Training Center: Emmitsburg, MD, USA, 2007.
  55. Sorensen, J.H.; Sorensen, B.V. Community processes: Warning and evacuation. In Handbook of Disaster Research; Springer: Berlin/Heidelberg, Germany, 2007; pp. 183–199. [Google Scholar]
  56. Renne, J.L.; Sanchez, T.W.; Litman, T. Carless and special needs evacuation planning: A literature review. J. Plan. Lit. 2011, 26, 420–431. [Google Scholar] [CrossRef] [Green Version]
  57. Sanchez, T.W.; Brenman, M. Transportation equity and environmental justice: Lessons from hurricane Katrina. Environ. Justice 2008, 1, 73–80. [Google Scholar] [CrossRef]
  58. Renne, J.L.; Sanchez, T.W.; Peterson, R.C. National Study on Carless and Special Needs Evacuation Planning: Case Studies; University of New Orleans Transportation Institute: New Orleans, LA, USA, 2009. [Google Scholar]
  59. Shaheen, S.; Bell, C.; Cohen, A.; Yelchuru, B. Travel Behavior: Shared Mobility and Transportation Equity; U.S. Department of Transportation: Washington, DC, USA, 2017.
  60. Rauch, D.E.; Schleicher, D. Like Uber, but for local government law: The future of local regulation of the sharing economy. Ohio St. LJ 2015, 76, 901. [Google Scholar]
  61. Chan, N.D.; Shaheen, S.A. Ridesharing in North America: Past, present, and future. Transp. Rev. 2012, 32, 93–112. [Google Scholar] [CrossRef]
  62. Furuhata, M.; Dessouky, M.; Ordóñez, F.; Brunet, M.-E.; Wang, X.; Koenig, S. Ridesharing: The state-of-the-art and future directions. Transp. Res. Part B Methodol. 2013, 57, 28–46. [Google Scholar] [CrossRef]
  63. Shaheen, S.A.; Cohen, A.P. Carsharing and personal vehicle services: Worldwide market developments and emerging trends. Int. J. Sustain. Transp. 2013, 7, 5–34. [Google Scholar] [CrossRef]
  64. Rayle, L.; Dai, D.; Chan, N.; Cervero, R.; Shaheen, S. Just a better taxi? A survey-based comparison of taxis, transit, and ridesourcing services in San Francisco. Transp. Policy 2016, 45, 168–178. [Google Scholar] [CrossRef] [Green Version]
  65. Shaheen, S.; Cohen, A.; Zohdy, I. Shared Mobility: Current Practices and Guiding Principles; U.S. Federal Highway Administration: Washington, DC, USA, 2016.
  66. Ge, Y.; Knittel, C.R.; MacKenzie, D.; Zoepf, S. Racial and Gender Discrimination in Transportation Network Companies; National Bureau of Economic Research: Cambridge, MA, USA, 2016. [Google Scholar]
  67. Edelman, B.; Luca, M.; Svirsky, D. Racial discrimination in the sharing economy: Evidence from a field experiment. Am. Econ. J. Appl. Econ. 2017, 9, 1–22. [Google Scholar] [CrossRef] [Green Version]
  68. Sugar, R. Uber and Lyft Cars Now Outnumber Yellow Cabs in NYC 4 to 1. 2017. Available online: https://ny.curbed.com/2017/1/17/14296892/yellow-taxi-nyc-uber-lyft-via-numbers (accessed on 20 June 2020).
  69. Armstrong, M. Competition in two-sided markets. RAND J. Econ. 2006, 37, 668–691. [Google Scholar] [CrossRef] [Green Version]
  70. Rochet, J.C.; Tirole, J. Two-sided markets: A progress report. RAND J. Econ. 2006, 37, 645–667. [Google Scholar] [CrossRef] [Green Version]
  71. Rysman, M. The economics of two-sided markets. J. Econ. Perspect. 2009, 23, 125–143. [Google Scholar] [CrossRef] [Green Version]
  72. Weyl, E.G. A price theory of multi-sided platforms. Am. Econ. Rev. 2010, 100, 1642–1672. [Google Scholar] [CrossRef]
  73. Bikhchandani, S. Intermediated surge pricing. J. Econ. Manag. Strategy 2020, 29, 31–50. [Google Scholar] [CrossRef]
  74. Wu, T.; Zhang, M.; Tian, X.; Wang, S.; Hua, G. Spatial differentiation and network externality in pricing mechanism of online car hailing platform. Int. J. Prod. Econ. 2020, 219, 275–283. [Google Scholar] [CrossRef]
  75. Cachon, G.P.; Daniels, K.M.; Lobel, R. The role of surge pricing on a service platform with self-scheduling capacity. Manuf. Serv. Oper. Manag. 2017, 19, 368–384. [Google Scholar] [CrossRef]
  76. Castillo, J.C.; Knoepfle, D.; Weyl, G. Surge pricing solves the wild goose chase. In Proceedings of the 2017 ACM Conference on Economics and Computation, Cambridge, MA, USA, 26–30 June 2017. [Google Scholar]
  77. Zha, L.; Yin, Y.; Xu, Z. Geometric matching and spatial pricing in ride-sourcing markets. Transp. Res. Part C Emerg. Technol. 2018, 92, 58–75. [Google Scholar] [CrossRef]
  78. Zhu, Y.; Xie, K.; Ozbay, K.; Zuo, F.; Yang, H. Data-driven spatial modeling for quantifying network-wide resilience in the aftermath of hurricanes Irene and Sandy. Transp. Res. Rec. 2017, 2604, 9–18. [Google Scholar] [CrossRef] [Green Version]
  79. Martin, K.W. Your Bike—The Coolest Part of Your Disaster Kit. 2011. Available online: https://blog.sfgate.com/bicycle/2011/04/08/your-bike-the-coolest-part-of-your-disaster-kit/ (accessed on 24 March 2021).
  80. TLC. TLC Trip Record Data. 2019. Available online: https://www1.nyc.gov/site/tlc/about/tlc-trip-record-data.page (accessed on 10 July 2020).
  81. Pew Research Center. Demographics of Mobile Device Ownership and Adoption in the United States. 2019. Available online: https://www.pewresearch.org/internet/fact-sheet/mobile/ (accessed on 24 March 2021).
  82. Blumenthal, E. Staying Connected When the World Falls Apart: How Carriers Keep Phones Working. 2020. Available online: https://www.cnet.com/features/staying-connected-when-the-world-falls-apart-how-carriers-keep-phones-working/ (accessed on 24 March 2021).
  83. MTA. Ridership Trends: New York City Transit. 2018. Available online: http://web.mta.info/mta/news/books/docs/Ridership_Trends_FINAL_Jul2018.pdf (accessed on 10 July 2020).
  84. Schneider, T. Taxi and Ridehailing Usage in New York City. 2019. Available online: https://toddwschneider.com/dashboards/nyc-taxi-ridehailing-uber-lyft-data/ (accessed on 14 July 2020).
  85. Russo, F.; Rindone, C. Planning in Road Evacuation: Classification of Exogenous Activities. WIT Trans. Built Environ. 2011, 116, 639–651. [Google Scholar]
  86. Department of Homeland Security. Planning Considerations: Evacuation and Shelter-in-Place. 2018. Available online: https://www.fema.gov/sites/default/files/2020-07/planning-considerations-evacuation-and-shelter-in-place.pdf (accessed on 24 March 2021).
  87. Russo, F.; Rindone, C.; Trecozzi, M. The role of training in evacuation. WIT Trans. Inf. Commun. Technol. 2012, 44, 491–502. [Google Scholar]
  88. Fu, H.; Wilmot, C.G.; Zhang, H.; Baker, E.J. Modeling the hurricane evacuation response curve. Transp. Res. Rec. 2007, 2022, 94–102. [Google Scholar] [CrossRef]
  89. Yazici, M.A.; Ozbay, K. Evacuation modelling in the United States: Does the demand model choice matter? Transp. Rev. 2008, 28, 757–779. [Google Scholar] [CrossRef]
  90. USACE. Alabama Hurricane Evacuation Study Technical Data Report: Behavioral Analysis; Final Report; U.S. Army Corps of Engineers: Washington, DC, USA, 2000.
  91. Wang, D.; He, B.Y.; Gao, J.; Chow, J.Y.; Ozbay, K.; Iyer, S. Impact of COVID-19 Behavioral Inertia on Re-opening Strategies for New York City Transit. Int. J. Transp. Sci. Technol. 2021. [Google Scholar] [CrossRef]
Figure 1. Participation of ride-sourcing services in hurricane evacuations.
Sustainability 13 04444 g001
Figure 2. Hurricane evacuation zones in NYC (Source: NYCEM).
Sustainability 13 04444 g002
Figure 3. The logical framework of the methodology.
Sustainability 13 04444 g003
Figure 4. Examples of evacuation response curves by the logit model; (a) cumulative evacuation curves; (b) percent evacuated at each hour; (c) percent supply at each hour.
Sustainability 13 04444 g004
Figure 5. The number of taxi trips by pickup location in the evacuation zones; (a) the mandatory evacuation ordered on 28 October 2012 during Hurricane Sandy; (b) normal time two weeks before Sandy on 14 October 2012. (The highlighted area is the case study area located in Manhattan from 60th Street south). (Data source: NYC TLC data).
Sustainability 13 04444 g005
Figure 6. The impact of demand μ i on the price and wage under different α, β.
Sustainability 13 04444 g006
Table 1. List of variables.
NotationDescription Variables
p i Price to passengers in region i
w i Wage to drivers in region i
v Passengers’ utility for taking ride-sourcing services
c i Drivers’ cost for providing services in region i
F b The cumulative distribution of passenger utility v with density function f b
F s The cumulative distribution of drivers’ cost with density function f b
v b Passengers’ utility for choosing other outside options, such as transit
v s Drivers’ utility for choosing not to participate
D i Demand of ride-sourcing services in region i
S i Supply of ride-sourcing services in region i
μ i The number of demands in region i , the number of supplies is one, μ i can be viewed as the number of demands per unit number of supplies
θ i Market tightness in region i , equal to θ i = S i / D i
M ( D i , S i ) The matching function of demand and supply, indicating the number of matched trips in region i
m b ( θ i ) Matching probability of passengers in region i
m s ( θ i ) Matching probability of drivers in region i
α,βWeight parameters
Table 2. Taxi data during and before Hurricane Sandy in the case study area.
Evacuation ZoneSandy EvacuationBefore Sandy
Taxi TripsTaxi RidershipTaxi TripsTaxi Ridership
Zone 123,48241,66628,95450,878
Zone 215,08927,03116,66629,385
Zone 317,86131,62220,82537,022
Zone 424,11242,66926,73347,252
Zone 540,17170,01143,47276,030
Zone 633,63258,96734,21559,373
Table 3. Input parameters.
Parameter Symbol Unit Value
1. Evacuation time THour24
2. Passenger value distribution Fb [ 0 , γ b ] $ [ 0 , 1 ]
3. Driver cost distribution Fs   [ 0 , γ s ] 2 $ [ 0 , 1 ] 2
4. Demand and supply curve parameters
  - Slow response [ a d , H d , a s , H s ] - [ 0.2 , 14 , 0.2 , 14 ]
  - Median response [ a d , H d , a s , H s ] - [ 0.3 , 12 , 0.3 , 12 ]
  - Fast response [ a d , H d , a s , H s ] - [ 0.4 , 10 , 0.4 , 10 ]
Table 4. Model performance comparison.
Method Slow Response Median Response Fast Response
Matched TripsCost ($)Matched TripsCost ($)Matched TripsCost ($)
Method 1 6382−27006347−26145591−2330
Method 2 975609126080380
Method 3 15,838984413,982770611,9136124
Publisher’s Note: MDPI stays neutral with regard to jurisdictional claims in published maps and institutional affiliations.

