1. Introduction
The use of mobile phones, especially smartphones, has become a basic habit for people all over the world. According to study [
1], 77% of the world’s population owned a mobile phone in 2016, and the numbers have continued to rise, especially with the affordability of the internet and smartphones. This has allowed people to stay connected on social media even while doing other basic tasks, such as walking. Researchers [
2] studied the behavior of pedestrians while talking on the phone and discovered that both men and women exhibited unsafe maneuvers as they crossed the road, with women exhibiting a slower path and not checking the street before crossing or waiting for traffic to stop. Furthermore, the results suggest [
1] that there is a direct relationship between cell phone use and pedestrian deaths and injuries. This information was further confirmed by [
3], who advanced that more than two million pedestrian injuries related to cell phone use were estimated from emergency department reports in the United States in 2010.
The problem of digital distraction has been recognized by the scientific community, and various efforts have been made to study it, especially in relation to drivers [
4,
5,
6].
The authors of [
4] investigated the influence of talking on a mobile phone or listening to music, on response time and its components, reaction time and movement time, during the action of braking. Having developed an indoor experiment on a driving simulator, the authors found an increase in drivers’ reaction time from 390 ms to 450 ms when they were involved in a phone conversation. Researchers in [
5] emphasized a slowing of drivers’ reaction time when they studied the effect of mobile texting on drivers’ attention. They also emphasized a reduction in driving speed and an increase in the headway kept on motorways. The literature review developed in [
6] summarizes well the researchers’ efforts on the topic of drivers distracted by phones. They emphasize three different branches of studies: epidemiological, simulator and field studies. The main common findings highlighted by the authors are an overall reduction in driving performance when handling the phone, reflected in higher reaction times and loss of the correct position of the vehicle in the lane.
Interestingly, the behavior of cyclists has also been analyzed. De Waard et al. [
7] developed a three-step investigation that examined the influence of mobile phones on cyclists’ performance. The first step consisted in the study of video recordings taken at three different locations, the second step was the analysis of questionnaire results and the last step was a controlled experiment. These steps allowed the identification of the most recurrent behaviors of cyclists, and the study of the effect of different tasks on their performance by examining speed, lateral position, self-reported mental effort and risk, and the number of correctly detected objects. Among the results, they emphasized that texting and talking on the phone had the highest effect on cycling speed by consistently lowering it, and texting also affected lane position.
The purpose of the present study is to move the interest to the pedestrian portion of traffic, particularly younger adults who are likely to be most accustomed to smartphones and, therefore, most susceptible to injuries related to this type of distraction. Reaction time, crossing time, and speed, as well as gaze characteristics such as fixations and gaze paths, are analyzed in this paper, and comparisons are drawn between two defined conditions: undistracted behavior and distracted behavior.
2. Related Works
Pedestrian behavior at signalized intersections has been the focus of various authors, who stressed different aspects of pedestrian behavior (e.g., pedestrian crossing speed and time) and diverse factors affecting it, from individual human factors, to infrastructural elements, to other distracting causes. One of the features that has been mainly tackled is pedestrian speed at crosswalks. Muley et al. [
8] studied the effect of crossing length and direction on pedestrian entry, exit and crossing speeds. Starting from video recordings of different locations, they analyzed the recalled magnitudes and found mean crossing speeds of 1.45, 1.50 and 1.72 m·s
−1, respectively, for the three locations they studied. In their study [
9], Ištoka Otković et al. developed a model of pedestrian crossing speeds at signalized intersections and analyzed the influence of 14 factors (both individual and infrastructure-related) on the considered characteristic. Looking specifically at children, they found a mean crossing speed of 1.36 m·s
−1. Pedestrian crossing time at signalized intersections has also been the focus of interest for several researchers. Malinovskiy et al. [
10] extracted pedestrian crossing and waiting times from 126 crossing events and reported values of 9.2 s, 8.4 s and 4.5 s, respectively, for three signalized pedestrian crossings around the University of Washington in Seattle. Both walking speed and crossing time were the focuses of Duim et al.’s study [
11], which they contextualized in relation to older pedestrians. They found that older pedestrians’ speed dropped to an average of 0.75 m·s
−1 for normal walking abilities and was even lower for those who reported difficulties. Among the factors that influence pedestrian behavior at signalized intersections, the use of technological devices was also identified. An observational study was conducted by Thompson et al. [
12] in which two trained observers commented on three different tasks, i.e., talking on the phone, writing messages, and listening to music, and the authors examined the changes in pedestrian crossing behavior that these tasks elicited. They found that the use of technological devices increased crossing time by 18%. Jiang et al. [
13], focusing on the same tasks studied in [
12], elaborated an outdoor experimental study and showed the differences in crossing behavior and visual mapping for pedestrians walking under the three experimental conditions. They emphasized that listening to music was the least influential task, involving less cognitive load, that telephone conversations influenced pedestrians’ pace, while texting was the task that showed the greatest differences from non-distracted behavior.
As the preceding literature review demonstrates, great efforts have been spent to gain insight into pedestrian crossing behavior, and several factors have been identified that influence this behavior. Distraction caused by digital devices is one of these aspects and, due to the great growth of technology and the widespread use of smartphones during our everyday activities, there is a need to increase knowledge of the associated effects. This paper focuses specifically on this aspect and examines the impact of smartphone use on pedestrian crossing behavior at signalized intersections. Specifically, it focuses on the behavior of young adults (20–25 years old) checking their social media apps. The choice of this age group and this task was related to desire to understand a real problem that is spreading in our cities and possibly find solutions to the same.
The article is structured in five sections: first, a brief literature review is developed; followed by the definition of the purpose of the study. The third section explains the experimental design and the data elaboration approach carried out. The fourth section discusses the obtained results, divided into reaction time, crossing time and speed, fixation characteristics and gaze plot analysis, while the fifth section draws conclusions.
3. Purpose and Limitations of the Study
The purpose of this study is to understand the extent to which smartphone use influences pedestrian behavior when crossing the street at signalized intersections. Specifically, it examines how checking social media apps affects pedestrians’ reaction time, crossing time, and crossing speed, and how this shifts pedestrians’ attention to different elements. The study is based on the use of eye-tracking technology, which allows the acquisition of qualitative and quantitative data about pedestrian gaze movements, which undoubtedly has many advantages. Nevertheless, it has some limitations that should be taken into account. First, although the glasses were very comfortable, participants were aware that they are wearing them, and this could cause unpleasant feelings in some cases. In addition, people often used their peripheral vision to capture elements that did not fall within their main cone of vision. These dynamics could not be captured by eye-tracking technology, which is limited to the camera scene. Another limitation relates to the calculation of reaction times. Considering the specific case of pedestrian green light, although the direct eye-tracking output provided the time when a participant first focused on the light, this was not necessarily his/her reaction time, as it was related to the traffic light cycle (for a detailed explanation, see
Section 5.1. Reaction time). The value obtained by eye-tracking should therefore be filtered from the red-light duration.
4. Methodology
In the following subsections, the experimental design, the selected variables and the elaboration process are explained. First, the selection criteria of the participants, the main characteristics of the wearable eye-tracking glasses used in the experiment and the location of the same are discussed, then the steps taken to achieve the three selected variables, i.e., reaction time, crossing time and crossing speed, are discussed.
4.1. The Experimental Design
4.1.1. Location of the Experiment
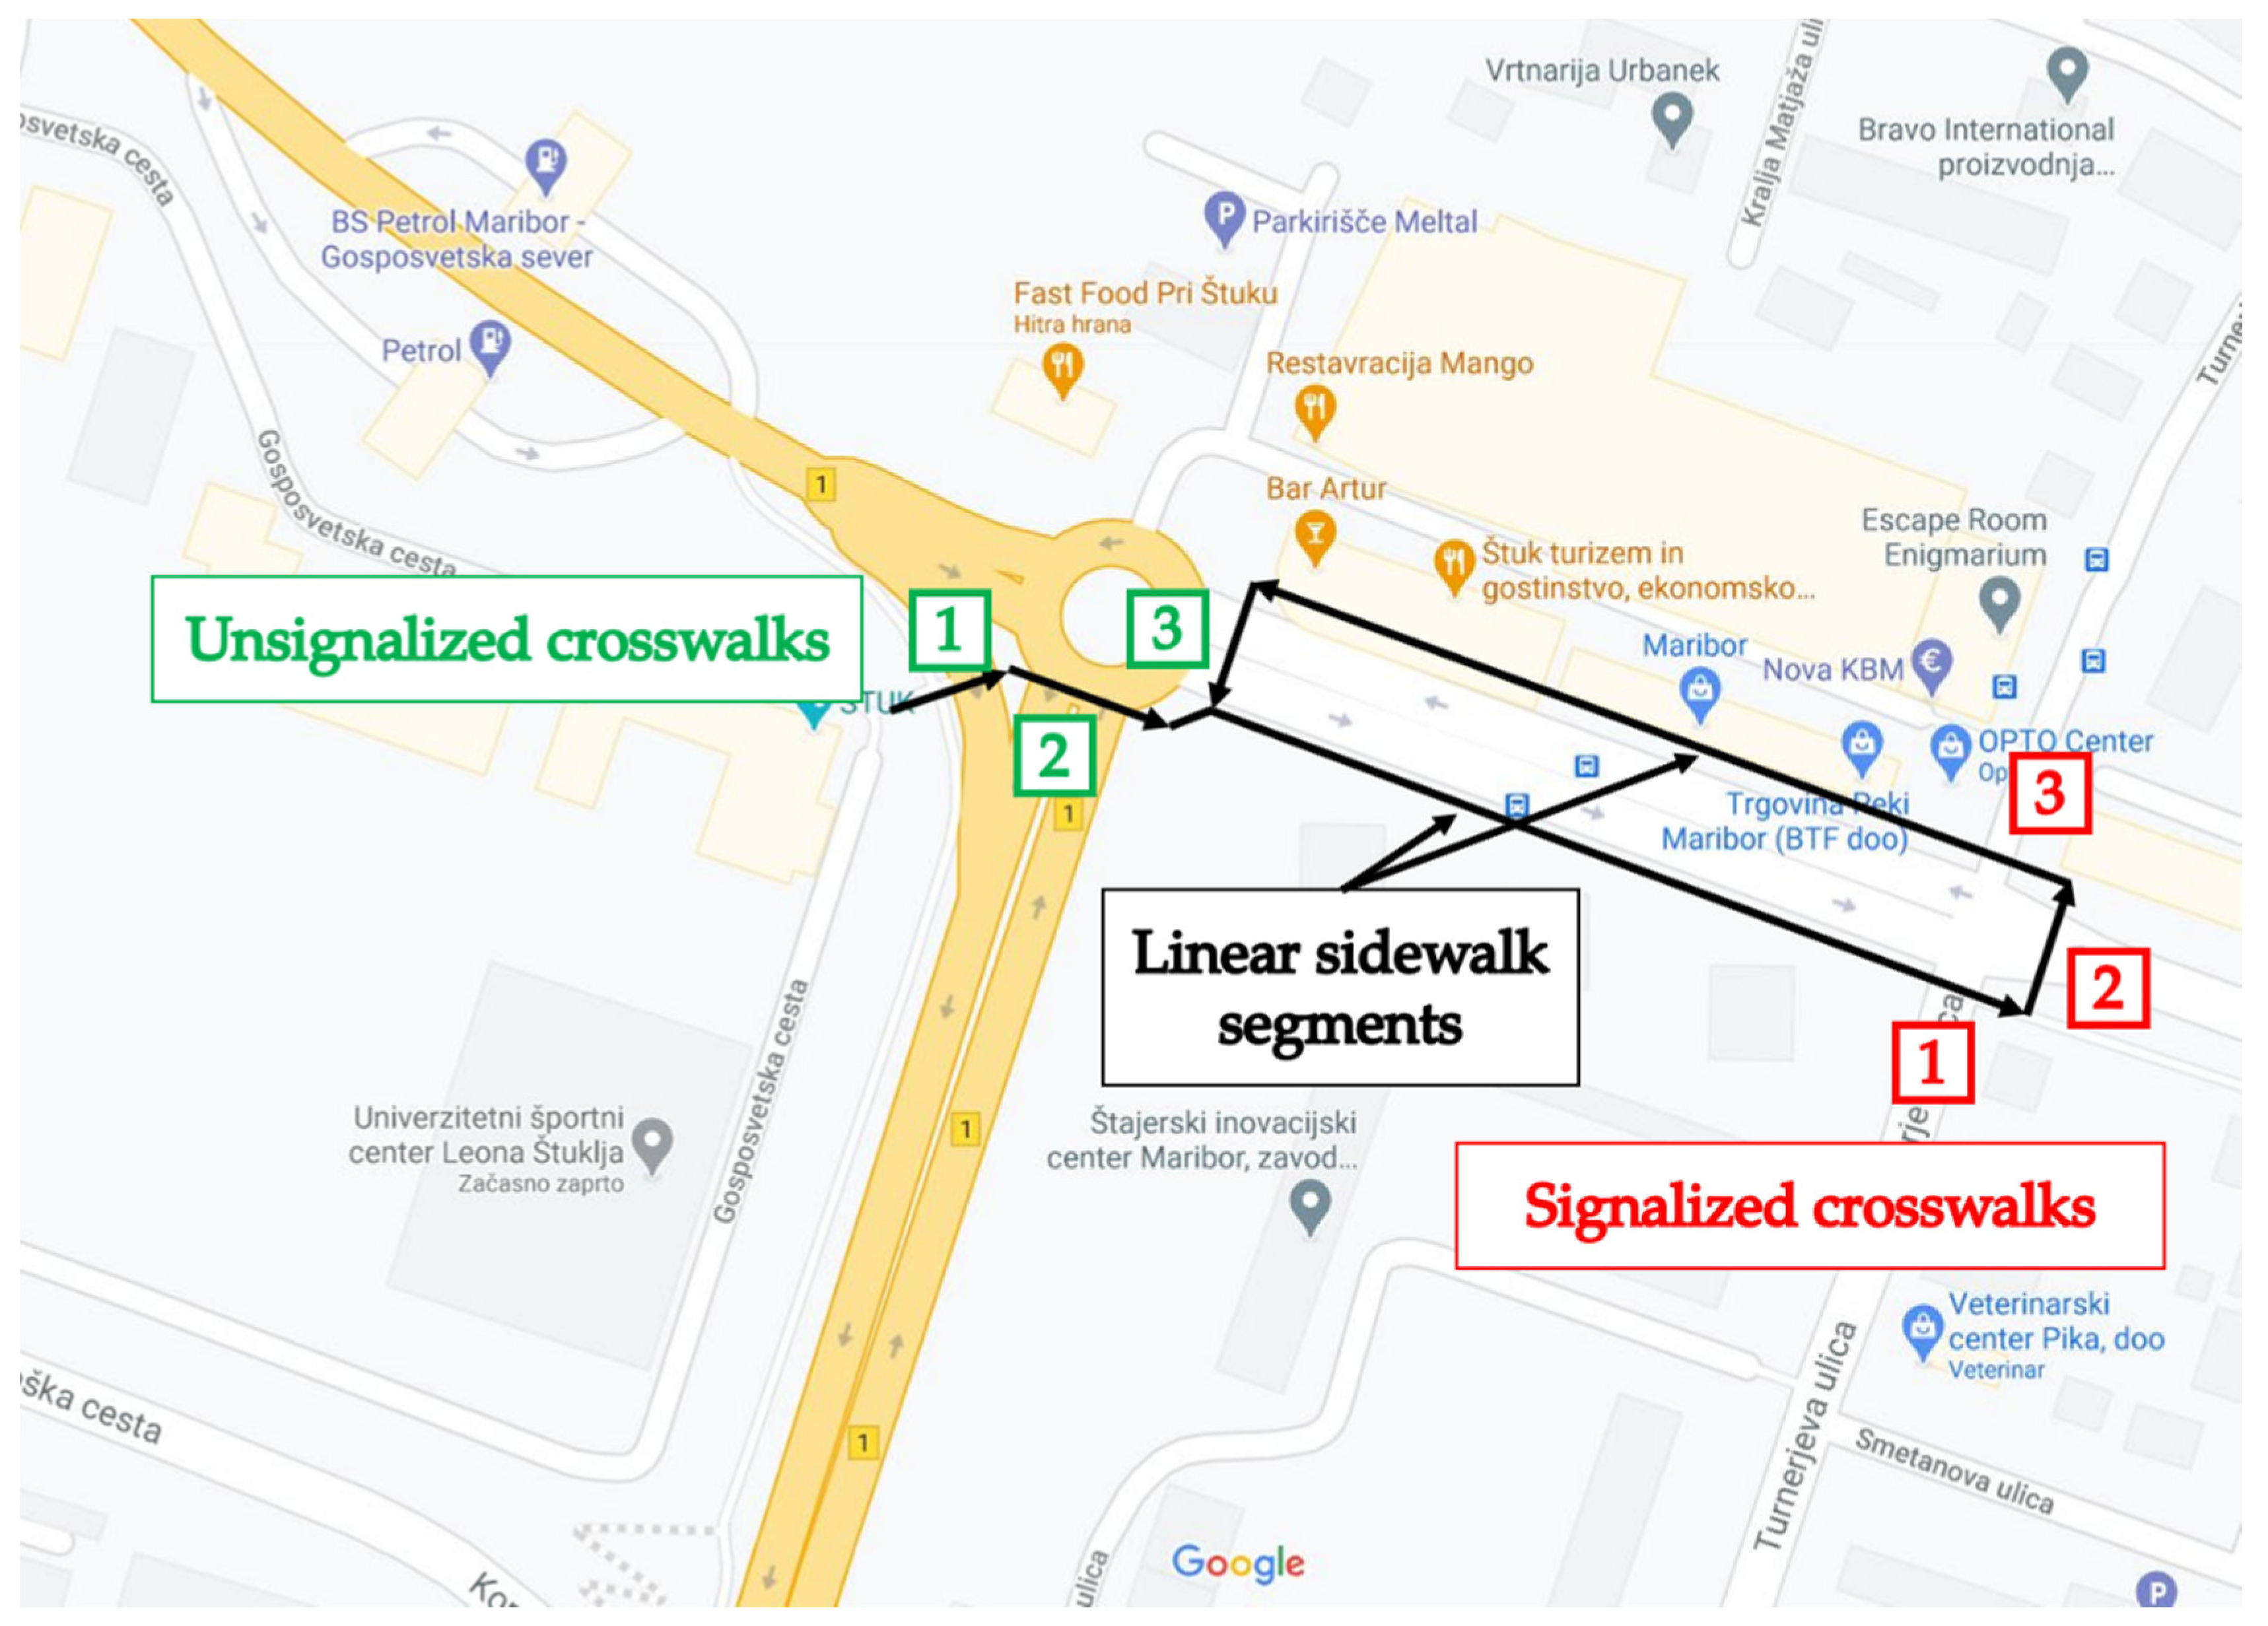
An outdoor experiment was set up in the urban area of Maribor (Slovenia), with a well-defined route to be followed by participants (
Figure 1). The total length of the route was approximately 740 m. Three unsignalized intersections at roundabout entry/exit legs, three signalized crosswalks and two linear sidewalk segments characterized the route. All signalized intersections, which are the focus of this paper, pass over two-lane roads.
4.1.2. Equipment
The eye-tracking system used in this research was Tobii Pro 2 glasses, which mainly consist of two components: the wearable glasses with a sampling rate of 50 Hz and a video resolution of 1920 × 1080 pixels with a frame rate of 25 fps, and the recording unit connected to the head one via an HDMI cable. The wearable glasses consist of four eye-tracking sensors, a microphone, a gyroscope and an accelerometer. In addition to the eye-tracking hardware, the controller and the analyzing software are also included. The controller software allows real-time control of the recorded videos and is connected to the head and recording units via Wi-Fi. Regarding the smartphones, since each participant used its own device with its particular specifications, a common background was created by limiting the use of the devices to two social media applications that work similarly on all types of smartphones.
4.1.3. Participant Selection
Due to the specific purpose of the research, i.e., to study the influence of smartphones on pedestrians crossing the street, some selection criteria were established in order to have common characteristics for all participants. The main inclusion criteria chosen for this research were related to normal physical abilities, i.e., (i). individuals with a normal gait and no physical impairment; (ii). no to mild vision correction was a requirement, as well as not wearing glasses. These first two criteria were chosen to represent well the majority of the pedestrian population (i), and to ensure the normal functioning of the eye-tracking technology (ii). Indeed, the frame of ordinary glasses and/or the presence of important vision corrections could lead to erroneous data.
To ensure that all participants had experience with smartphones, two additional criteria were established. First, participants were selected to be between 20 and 25 years old (iii), and should own their own smartphone (iv). These last criteria prevent problems of unfamiliarity with new devices and ensure an unbiased use of the device by each participant.
Eighteen individuals met all the criteria and were selected as participants for the experiment. Of these, eleven were female and seven were male. One participant was selected as a tester to determine what the best conditions were for conducting the experiment, and his data were not used further. Three individuals only participated in the laboratory portion of the experiment, which was not the focus of this study, and two were excluded from the analyses due to a change in daylight conditions, which may have skewed some data. The number of participants, though restrained, was similar to other studies found in the literature [
14,
15,
16,
17], which had a mean of fifteen participants.
4.1.4. Experimental Procedure
First, participants were provided with a document to agree to the local privacy policy, then they were given instructions. Each attendee should walk the set route twice. First checking their social media apps on their smartphone, then not doing so. The reason for this order was to avoid learning effects during the walk with the smartphone. In addition, two further cues were given to ensure natural but safe behavior, i.e., to behave as naturally as possible, and to be aware of interacting vehicles when crossing to avoid impacts.
After receiving instructions, each participant put on the eye-tracking glasses and a calibration step was performed. This procedure consisted of each participant staring at the center of a calibration card to work out the one-point calibration of the system. The calibration was successful when a green check mark was displayed on the controller interface. Two validations were also performed for this experiment: the first was conducted indoors, where the participant was asked to view specific items on images displayed on a computer screen. The second validation was developed outdoors so that the participant could become familiar with the system and the researcher could verify the correctness of the calibration and note if there were any deviations of the gaze from the indicated point.
After the calibration and validation steps, the actual experiment began. Each student walked the route for the first time with their smartphone, returned to the starting point where they were asked about their feelings and impressions, and walked for the second time without their smartphone. The experiment was conducted in the late afternoon on different days characterized by similar dry and cloudy weather conditions to avoid sunlight affecting the eye-tracking sensors. Each trial lasted 15 min: seven minutes for each walk and a one-minute break.
4.2. Data Elaboration Approach
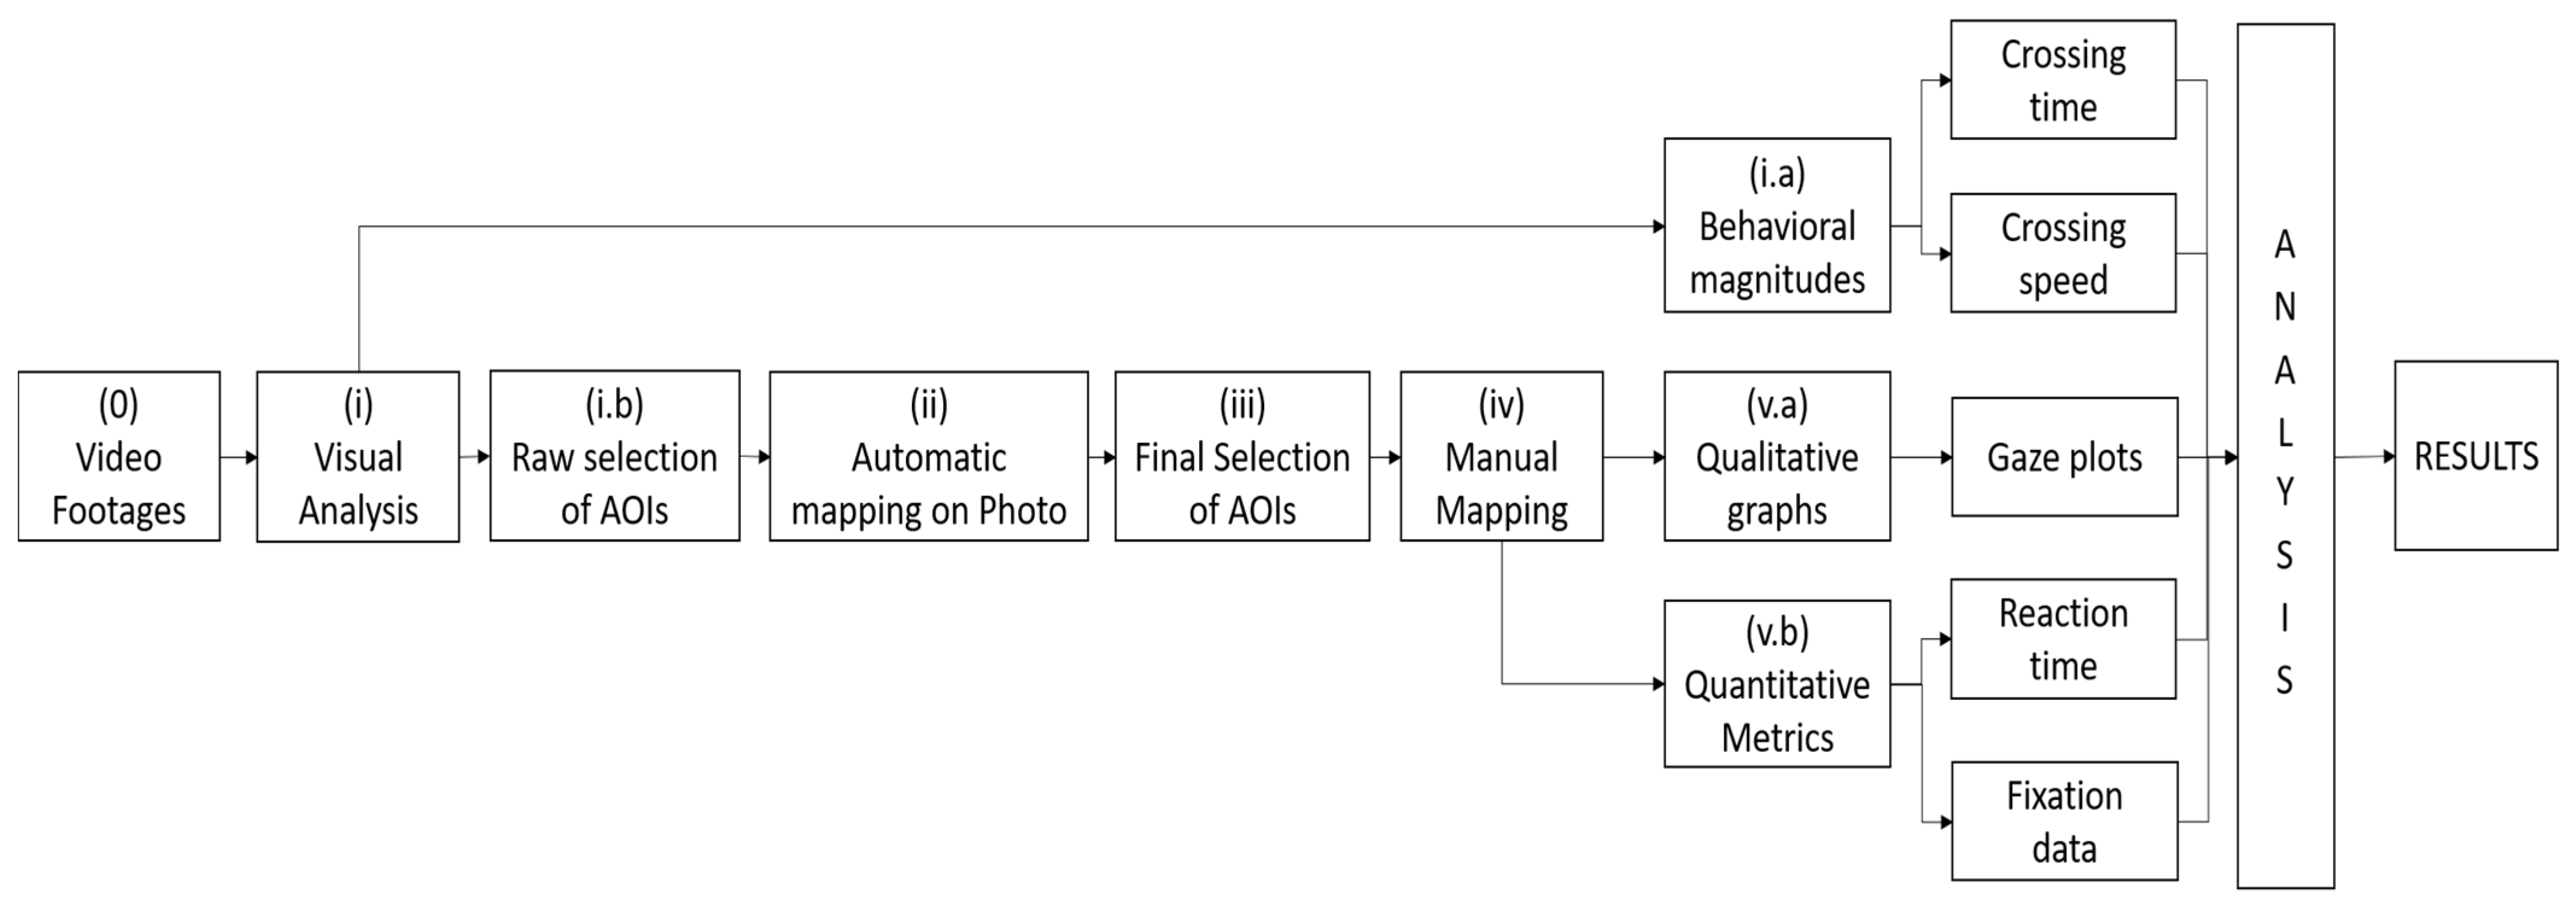
The approach followed was composed of different steps (
Figure 2) that led to the definition of pedestrian behavior both qualitatively and quantitatively in terms of gaze dynamics and crossing time and speed.
After obtaining video footages, an initial visual analysis was performed (i). This allowed, on the one hand, the calculation of pedestrians’ crossing time and speed (i.a), and, on the other hand, a first raw selection of Areas of Interest (AOIs) (i.b), i.e., objects that attract participants’ attention. Then, an automatic mapping (ii) of the gaze onto a screenshot of the captured scene was developed, which allowed evaluating the previous AOI selection and improving the selection of items of interest. This step led to the final choice of the AOIs (iii), and the creation of a coding label image, i.e., a schematic representation of the AOIs, to perform the manual mapping.
Manual mapping was the next step (iv) and, by tracking each fixation for each participant, allowed us to identify the participants’ gaze behavior. The output was both qualitative, by displaying heat maps and gaze plots, and quantitative, by providing eye-tracking metrics. Ultimately, the analysis of eye-tracking outputs (v.a, v.b) and crossing characteristics led to the identification of pedestrian behavior and to the comparison of the two conditions with and without phones. To ensure an appropriate confidence level, only eye-tracking videos with data quality samples higher than 80% were evaluated.
At this point, it is fundamental to briefly describe the selected AOIs and the variables considered in the further analysis. In step (iii), 10 groups of AOIs (
Table 1) were identified. These were: the path, which included the pavement/sidewalk and zebras/cycling lane; other pedestrians, considering both pedestrians waiting on the sidewalk in both directions and pedestrians walking on the crosswalk in both directions; bicyclists riding on zebras or on cycle lanes; oncoming and outgoing cars on the left and right sides that could interact with the participant; the road, which took into account the left and right empty segments of the road; phone, necessary AOI to define the distraction caused by phone use; button, which identified the button that must be pressed to “call” the green pedestrian light; red and green traffic light, which represented the two pedestrian lights “stop” and “go” signals at the signalized intersections; and other elements, which summarized traffic signs and other objects not necessarily related to road design.
Table 1 summarizes all of the applied areas of interest.
The output of the metrics was a large Excel file containing all the tracked data. The variables considered in this study were time to first fixation, average duration of first fixation, total fixation count and total fixation duration. These variables were the starting point for the calculation of reaction times and all measurements associated with fixations.
Four variables were considered in the analysis of quantitative outputs: reaction time, crossing time, crossing speed, and fixations. Reaction time is defined as the time it takes a participant to respond to a stimulus. Here, the stimulus was represented by the green pedestrian light. In the present study, reaction time is defined as the amount of time it takes each participant to first recognize that the traffic light turns green from the moment they stop at the crosswalk. It was measured in (s) and calculated starting from the time to the first fixation included in the metrics file. Crossing time is the time taken by a person to complete the action of crossing the road. It was calculated from video footages (as well as the crossing speed) as the time it took the participant to walk from one safe side of the intersection to the opposite one. It was expressed in (s). Crossing speed is the speed it takes a person to cross the road and was calculated as the ratio between the length of the crosswalk and the crossing time (m s
–1). Fixations are periods of time when the eye interrupts scanning and holds its gaze on certain elements to obtain information about them [
18,
19]. To study pedestrian attention/distraction phenomena, fixation counts (absolute number), the average duration (s) and the total percentage of time (%) were used in this study. Fixations and their qualitative representation, gaze plots, were used in this research to identify different typologies of pedestrian behavior.
5. Results and Discussion
In this section, the results are presented in four subsections. The first three refer to each of the analyzed characteristics of pedestrian behavior, i.e., reaction time, crossing time and speed and fixations, while the last section is dedicated to some qualitative observations obtained through the analysis of gaze plots.
5.1. Reaction Time
Reaction time was calculated using as a starting point AOI’s time to first fixation. This time value denotes the period of time after which participants look at a selected object (AOI) for the first time during their journey. This implies that this specific object was not perceived before, so that the participants’ reaction to it occurred just after the time interval indicated by time to first fixation.
In this research, the AOI considered to derive pedestrians’ reaction time was the green traffic light. The objective was to calculate how much time pedestrians needed to detect the appearance of the green light from the moment he/she stopped at the boundary of the sidewalk. At this point, a limitation of the study should be highlighted in that reaction times obtained through eye-tracking data are necessarily tied to the traffic light cycle, and more specifically to the moment during the red-light duration when the participant arrives at the sidewalk. To overcome this limitation, the eye-tracking data were first analyzed and then filtered by subtracting the red-light duration derived from the video recordings.
Table 2 reports the filtered reaction times. A significantly lower reaction time for pedestrians without cell phones can be observed, which is shown in an increase of 0.92 s in the condition with cell phones. In addition, the maximum reaction time of pedestrians checking their phone was higher by a factor of two. In fact, from the visual analysis of the recordings it could be observed that when handling their smartphones, pedestrians often did not look at the traffic light, even though they knew it was green. Indeed, various recordings showed that participants did not look at the traffic light until they were already crossing the street: they simply relied on the actions of other pedestrians around them.
An Anderson-Darling test was performed on the reaction time data to determine whether or not it followed a normal distribution. Since in both cases the calculated p-value is less than the set confidence level α = 0.05, the null hypothesis of the test, i.e., the data sample is normally distributed, should be rejected. At this point, it becomes interesting to understand whether the difference between the two samples is statistically significant. To derive this, and considering the non-normality of the data samples, Bonett and Levene tests for two variances were devised.
At the 90% confidence level, which is acceptable for preliminary analyses, both the ratio between the standard deviations of the samples and that between the variances of the same were smaller than 1, namely 0.628and 0.395, respectively, and their confidence intervals did not contain the unit. The ratios and the confidence intervals are reported in
Table 3.
Although the statistical distribution of the data samples was not normal, a t-test was conducted due to its robustness. Results at the 90% confidence level confirmed the statistical difference found by Bonett’s and Levene’s tests and are shown in
Table 4.
5.2. Crossing Time and Crossing Speed
Crossing time was calculated as the time from the moment a participant left the sidewalk where they were waiting for the green, to the moment they reached the other safe side of the crosswalk.
Table 5 compares the crossing time at the three signalized intersections in the two conditions and the mean value.
It can be seen that while checking their phones, participants moved only slightly slower, taking on average 0.29 s longer to complete their passage, confirming the results of [
9], which highlight a smaller impact of phone use on crossing time and speed than on reaction time. When plotting the crossing time in
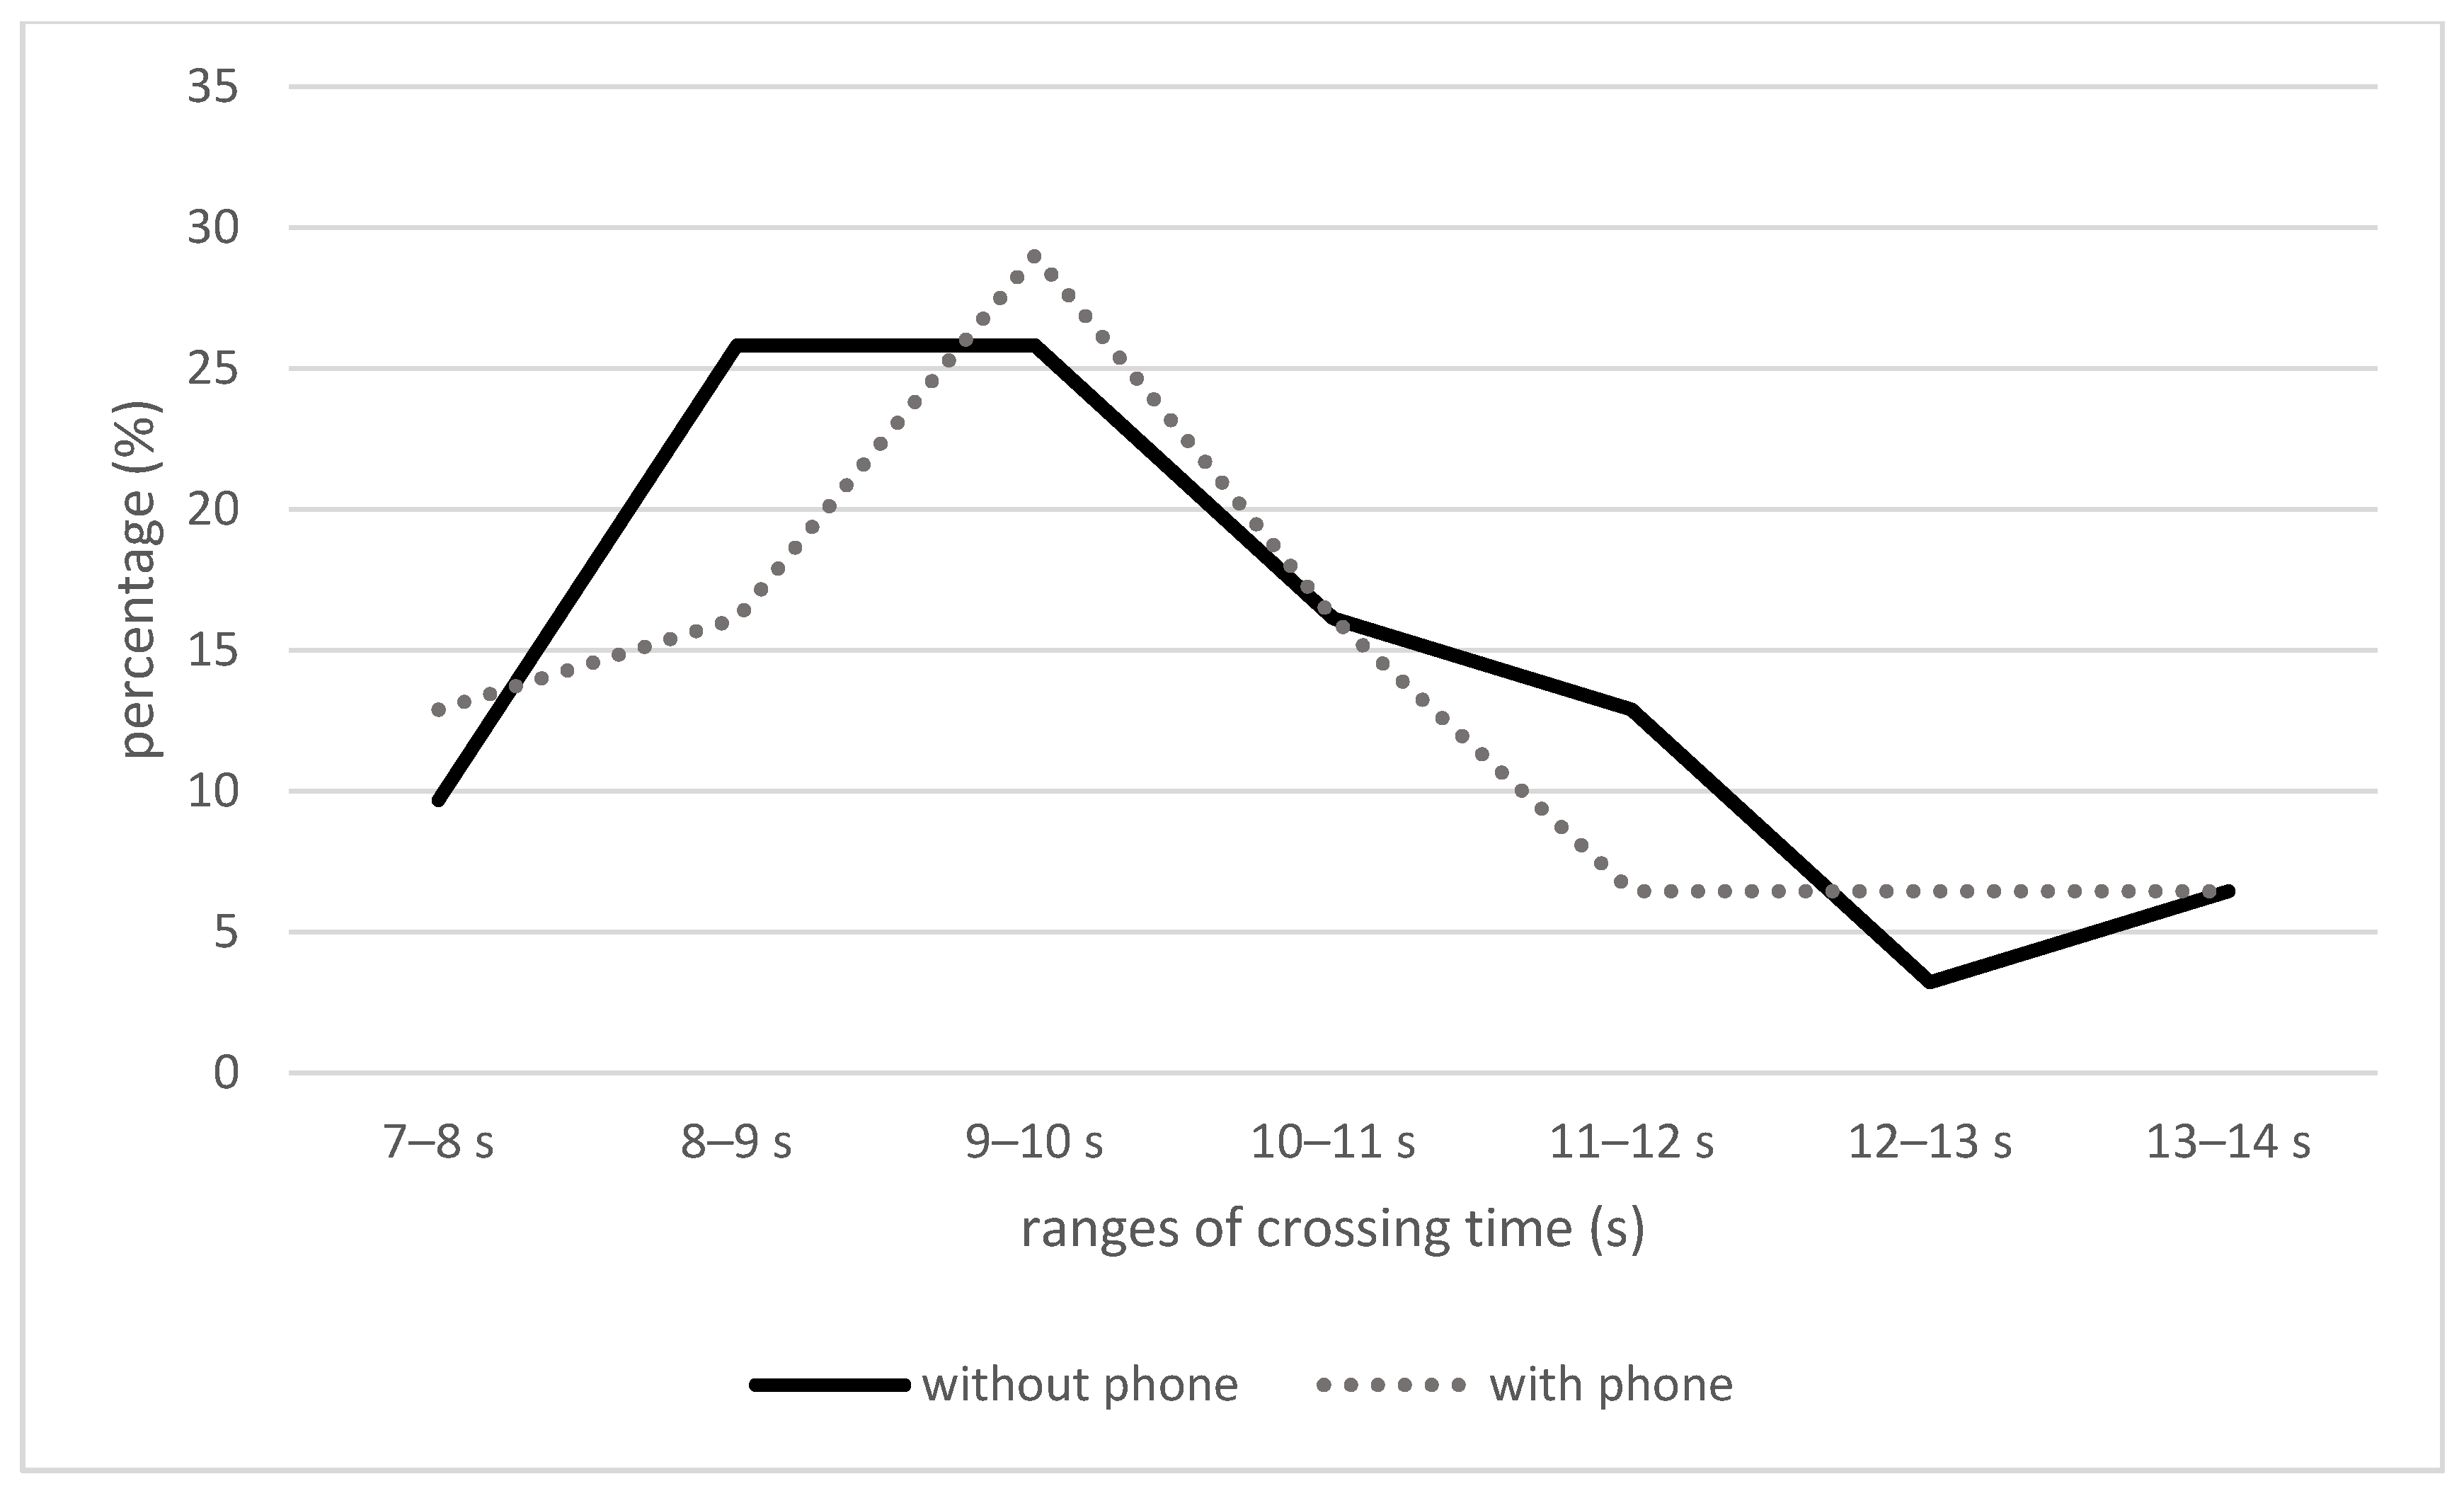
Figure 3, it was found that the range of crossing time when walking with the phone was between 8 s and 11 s, with a peak at 10 s when participants checked their phones. On the other hand, when participants were not handling their devices, the range of time taken to cross the road was 7–10 s, with a visible plateau from 8 s to 10 s.
Since pedestrian crossing time could be influenced by the crossing length, pedestrian speed was analyzed for an objective comparison of pedestrian behavior across all crossings (
Table 6). Consistent with previous findings, the phone checking condition showed a mean pedestrian speed that was slightly lower, i.e., 1.57 m·s
−1, compared to 1.61 m·s
−1, which was the speed of pedestrians walking without phones. These mean values were associated with two different standard deviations, 0.167 for the “without phone” condition, and 0.229 for the “with phone” condition. It is also interesting to note the range of crossing speeds. In the condition without the phone, the range was quite limited, with a higher minimum value of 1.26 m·s
−1 and a lower maximum value of 1.93 m·s
−1, while for the second condition the speed range was wider, (1.22–2.07 m·s
−1). This fact indicates higher variability in pedestrians’ crossing behavior while holding phones, which could play an important role in their safety.
A look at the descriptive statistics in
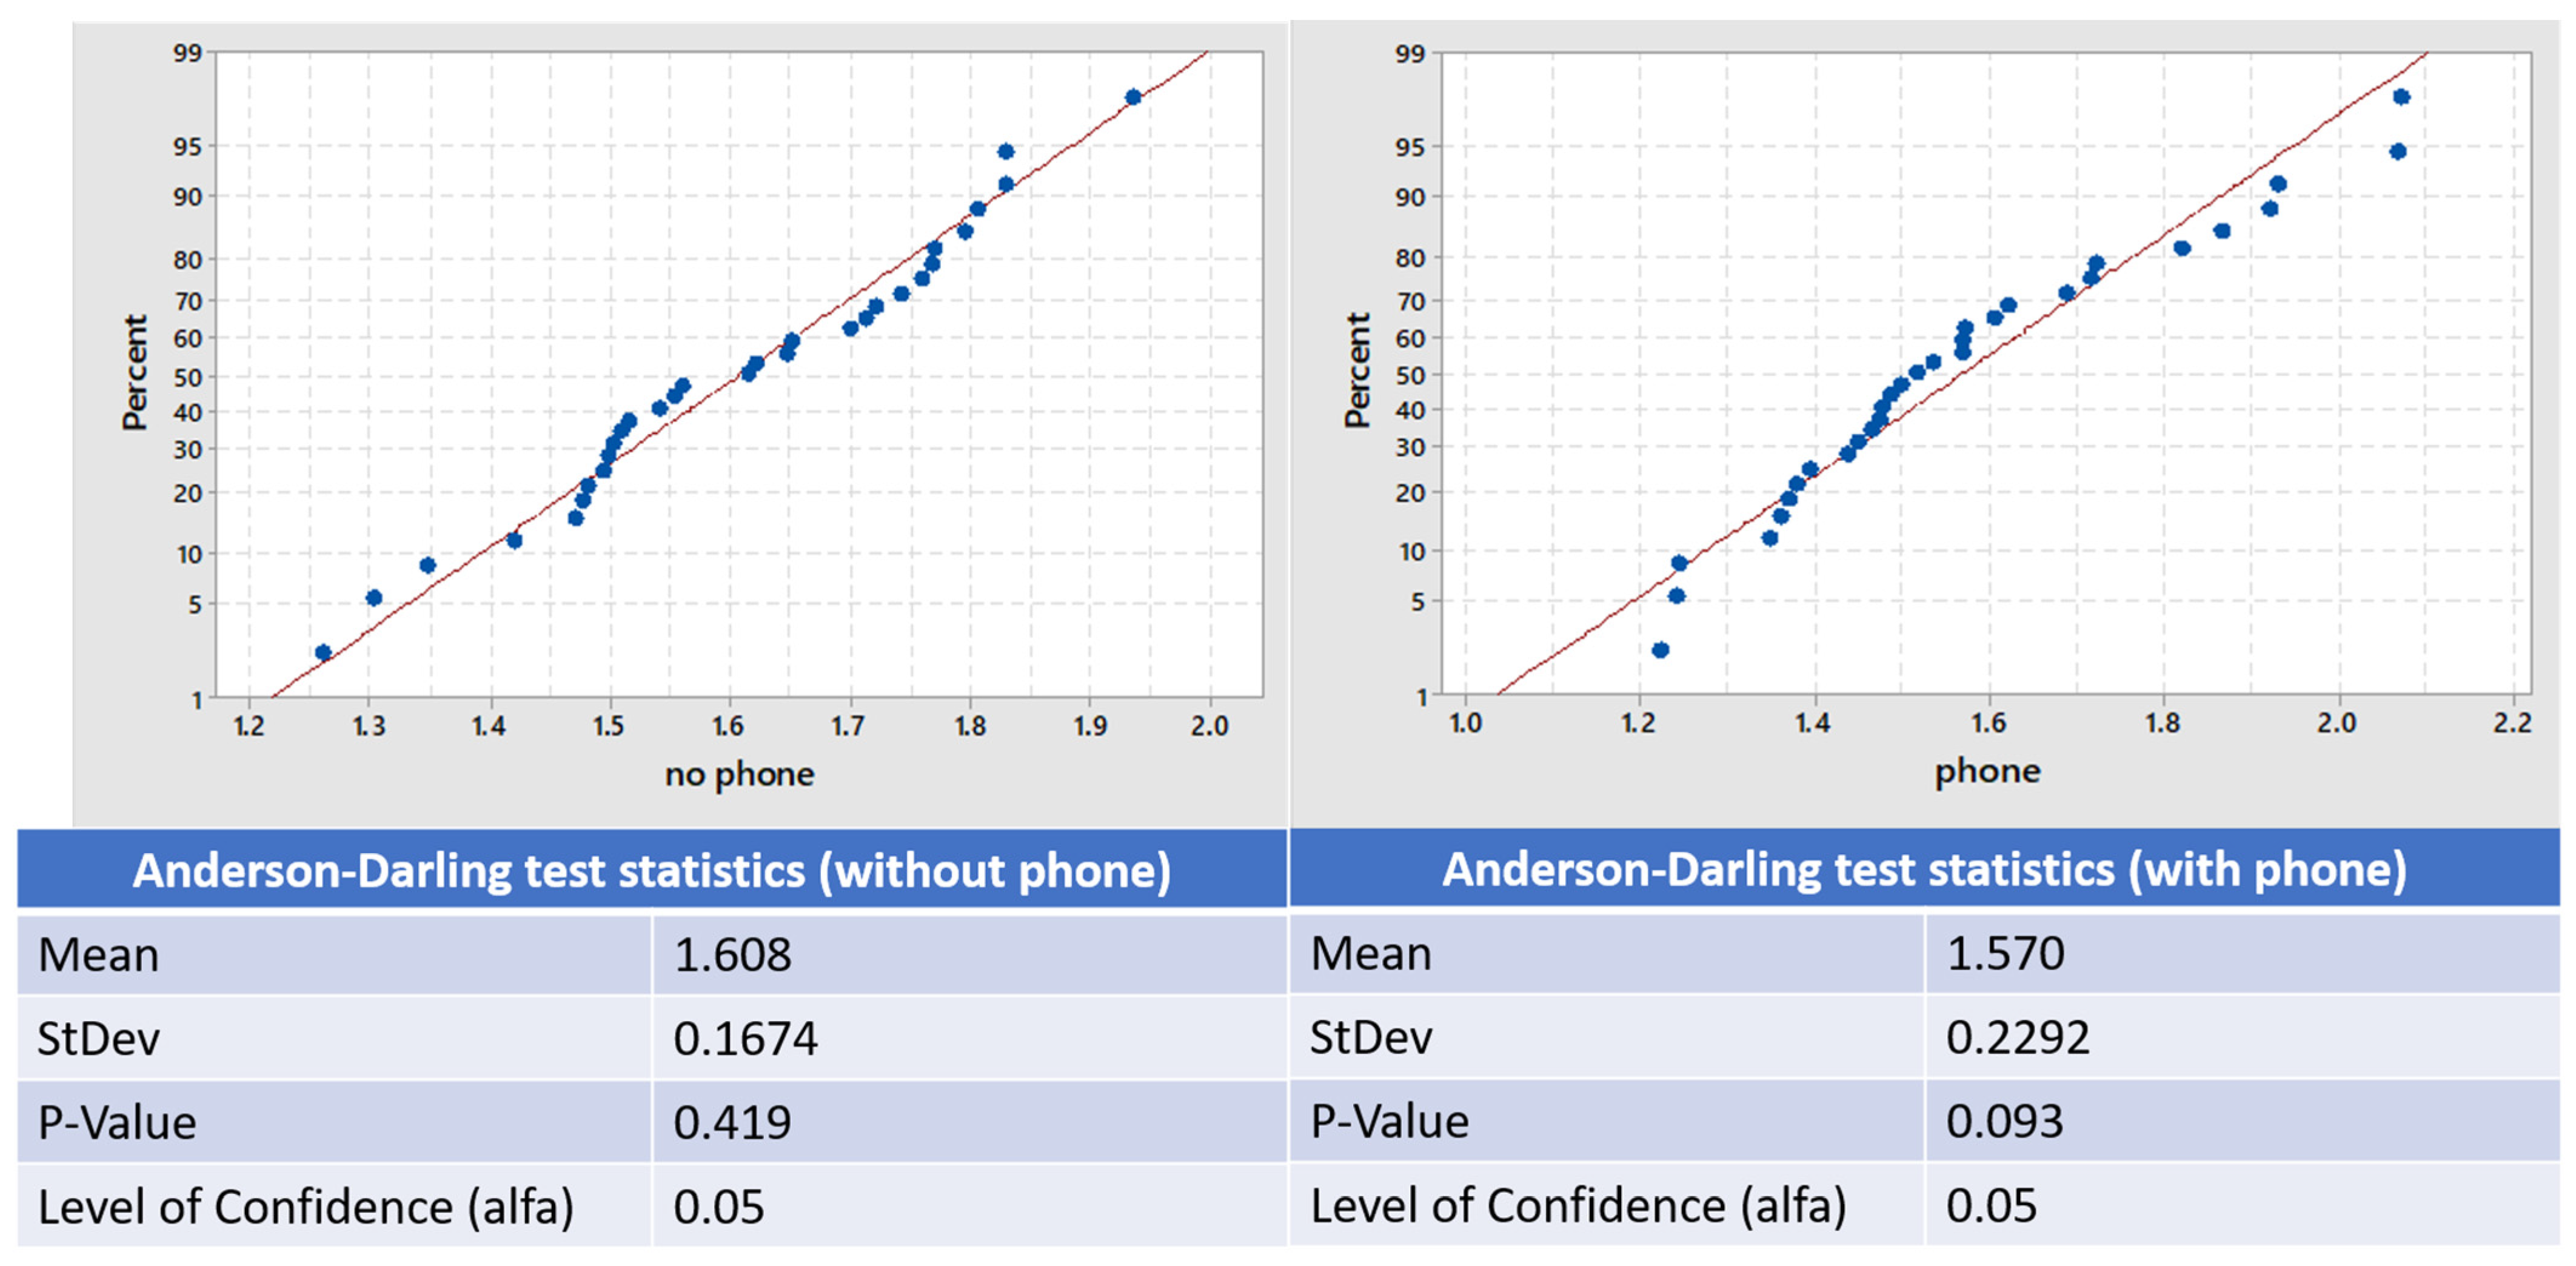
Table 6 shows a slight asymmetry of the two samples, which as higher for the “with phone” condition. To understand whether a normal distribution of crossing speed could be assumed, an Anderson-Darling test was performed. This statistical test checks the null hypothesis “the sample has a normal distribution”. If the calculated
p-value is less than the specified confidence level (alfa), the null hypothesis should be rejected, which means that the sample does not follow a normal distribution. Otherwise, the hypothesis cannot be stated. The results presented in
Figure 4 confirmed the null hypothesis for both samples in that the calculated
p-values were higher than the confidence level α (0.419 and 0.093 for the “without phone” and “with phone” condition, respectively).
Considering the results of the previous test, an F-test for two variances was devised to emphasize whether the two samples were statistically different. The ratio between the two standard deviations and that between the two variances were different from 1.0 and equal to 0.730 and 0.533. Both confidence intervals at 95% contained the unit, and the
p-value was slightly higher than the confidence level (
Table 7). Therefore, no clear statistical difference could be detected.
5.3. Fixations
Fixations were studied in terms of fixation counts, total fixation duration (s) and average fixation duration (s), in order to understand the elements most attracting pedestrians while crossing. It is important to underline that while fixation counts and total fixation duration refer to the total number and time that participants fixated a defined item, the average fixation duration reflected the mean time interval that each participant spent on a defined item. Thus, while the total fixation duration consisted of the sum of all the time spans spent on a given AOI, the average fixation duration value could be considered as the interest that an item aroused in a participant by determining the average time he/she spent looking at it. Bar charts in
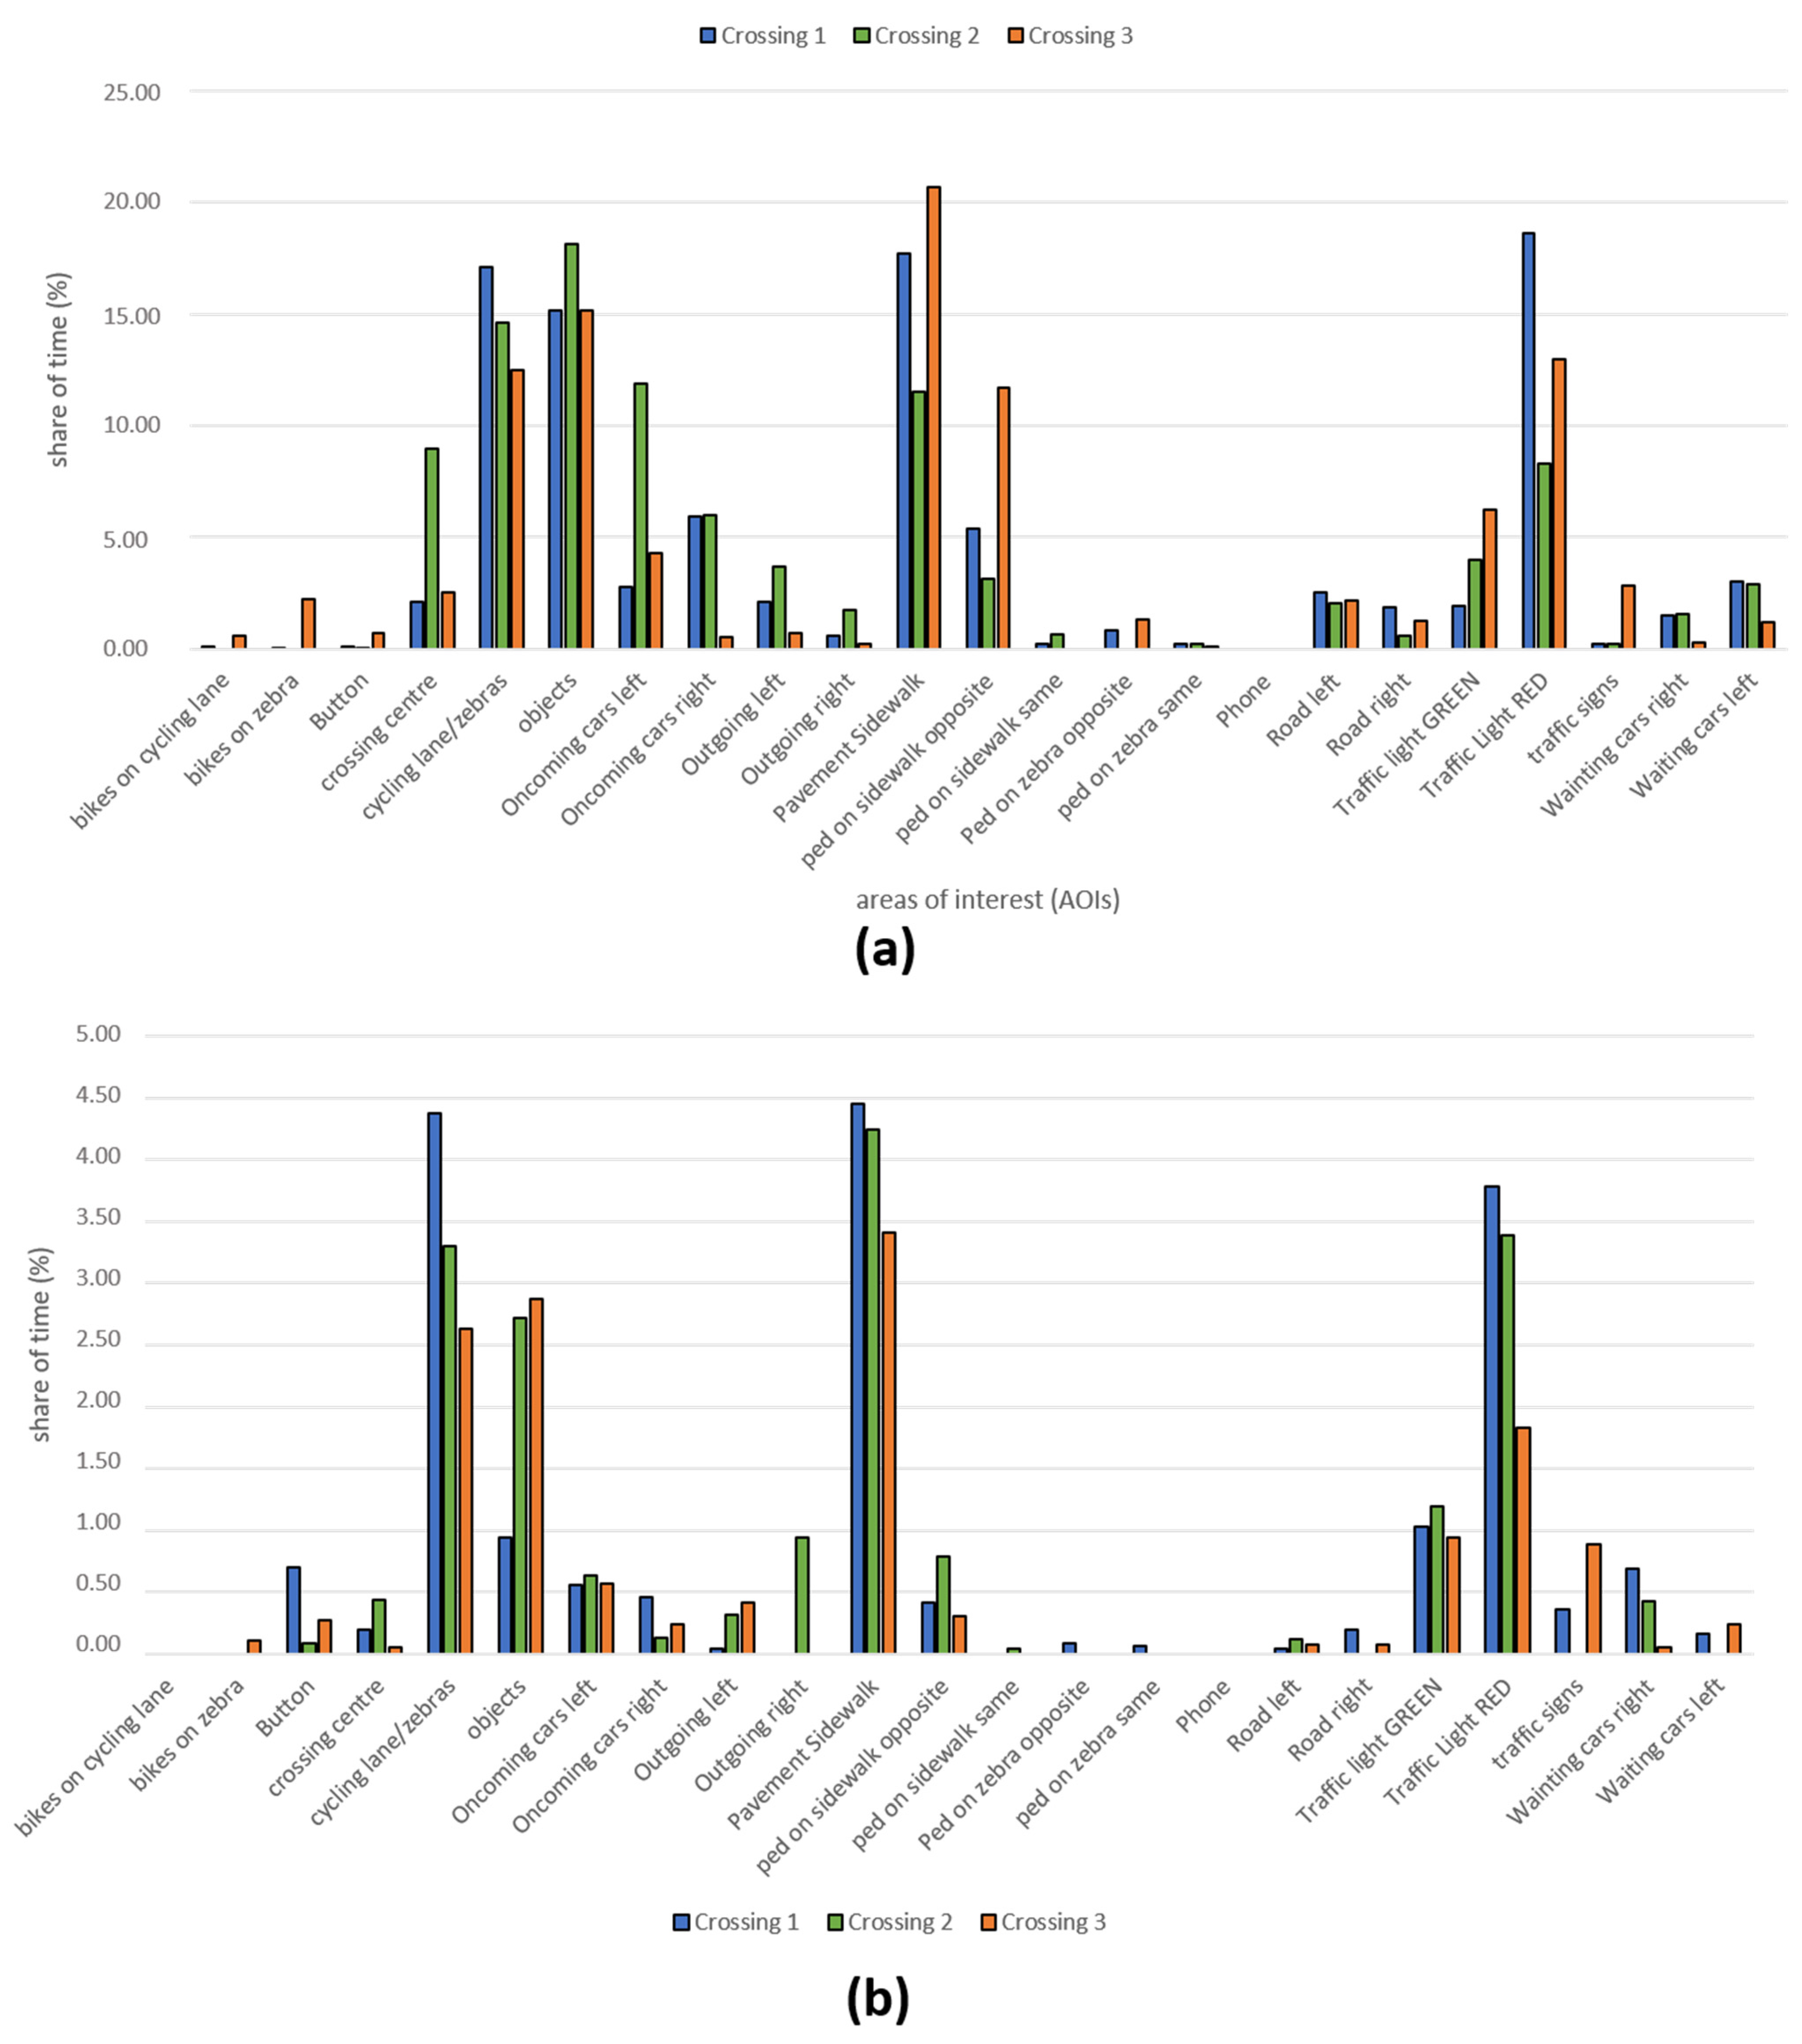
Figure 5a,b show the share of time participants spent at each defined area of interest when they were walking without their phone (a) and with it (b). Interestingly, in the first condition, the highest share of time was spent on path elements, with 16.64% for pavement/sidewalk and 14.73% for cycling lane/zebras, respectively, objects (16.14%), and the red traffic light, which was observed for the 13.29% of the time. In the second condition, the smartphone occupied the majority of the participants’ attention at all the intersections considered (82.54% of the time was spent checking the apps), followed by the path. Pavement/sidewalk had a percentage of 4.03% and cycling lanes/zebras occupied 3.44% of the time, while the red traffic light was fixed for only 3% of the time. It is worth noticing how the percentages of fixed time decreased from the “without phone” condition to the “with phone” condition.
Although the number of fixations is related to the total fixation duration, it gives a clearer insight into the most and least observed elements.
Table 8 shows the AOIs and their associated fixation counts in the two conditions under study.
The elements that attracted the most interest were objects that were not part of the road environment when considering the “without phone” condition, while it was the phone in the other condition. The least observed elements were the phone in the first condition, followed by the button to press to bring up the green light, while participants were less attracted by bicycles when checking their phones. While walking without the phone, participants paid much more attention to each of the defined areas of interest. The presence of the phone reduced and restricted participants’ attention to a smaller group of elements strictly related to the directly interacting elements, such as the traffic light, interacting cars and the crossing center.
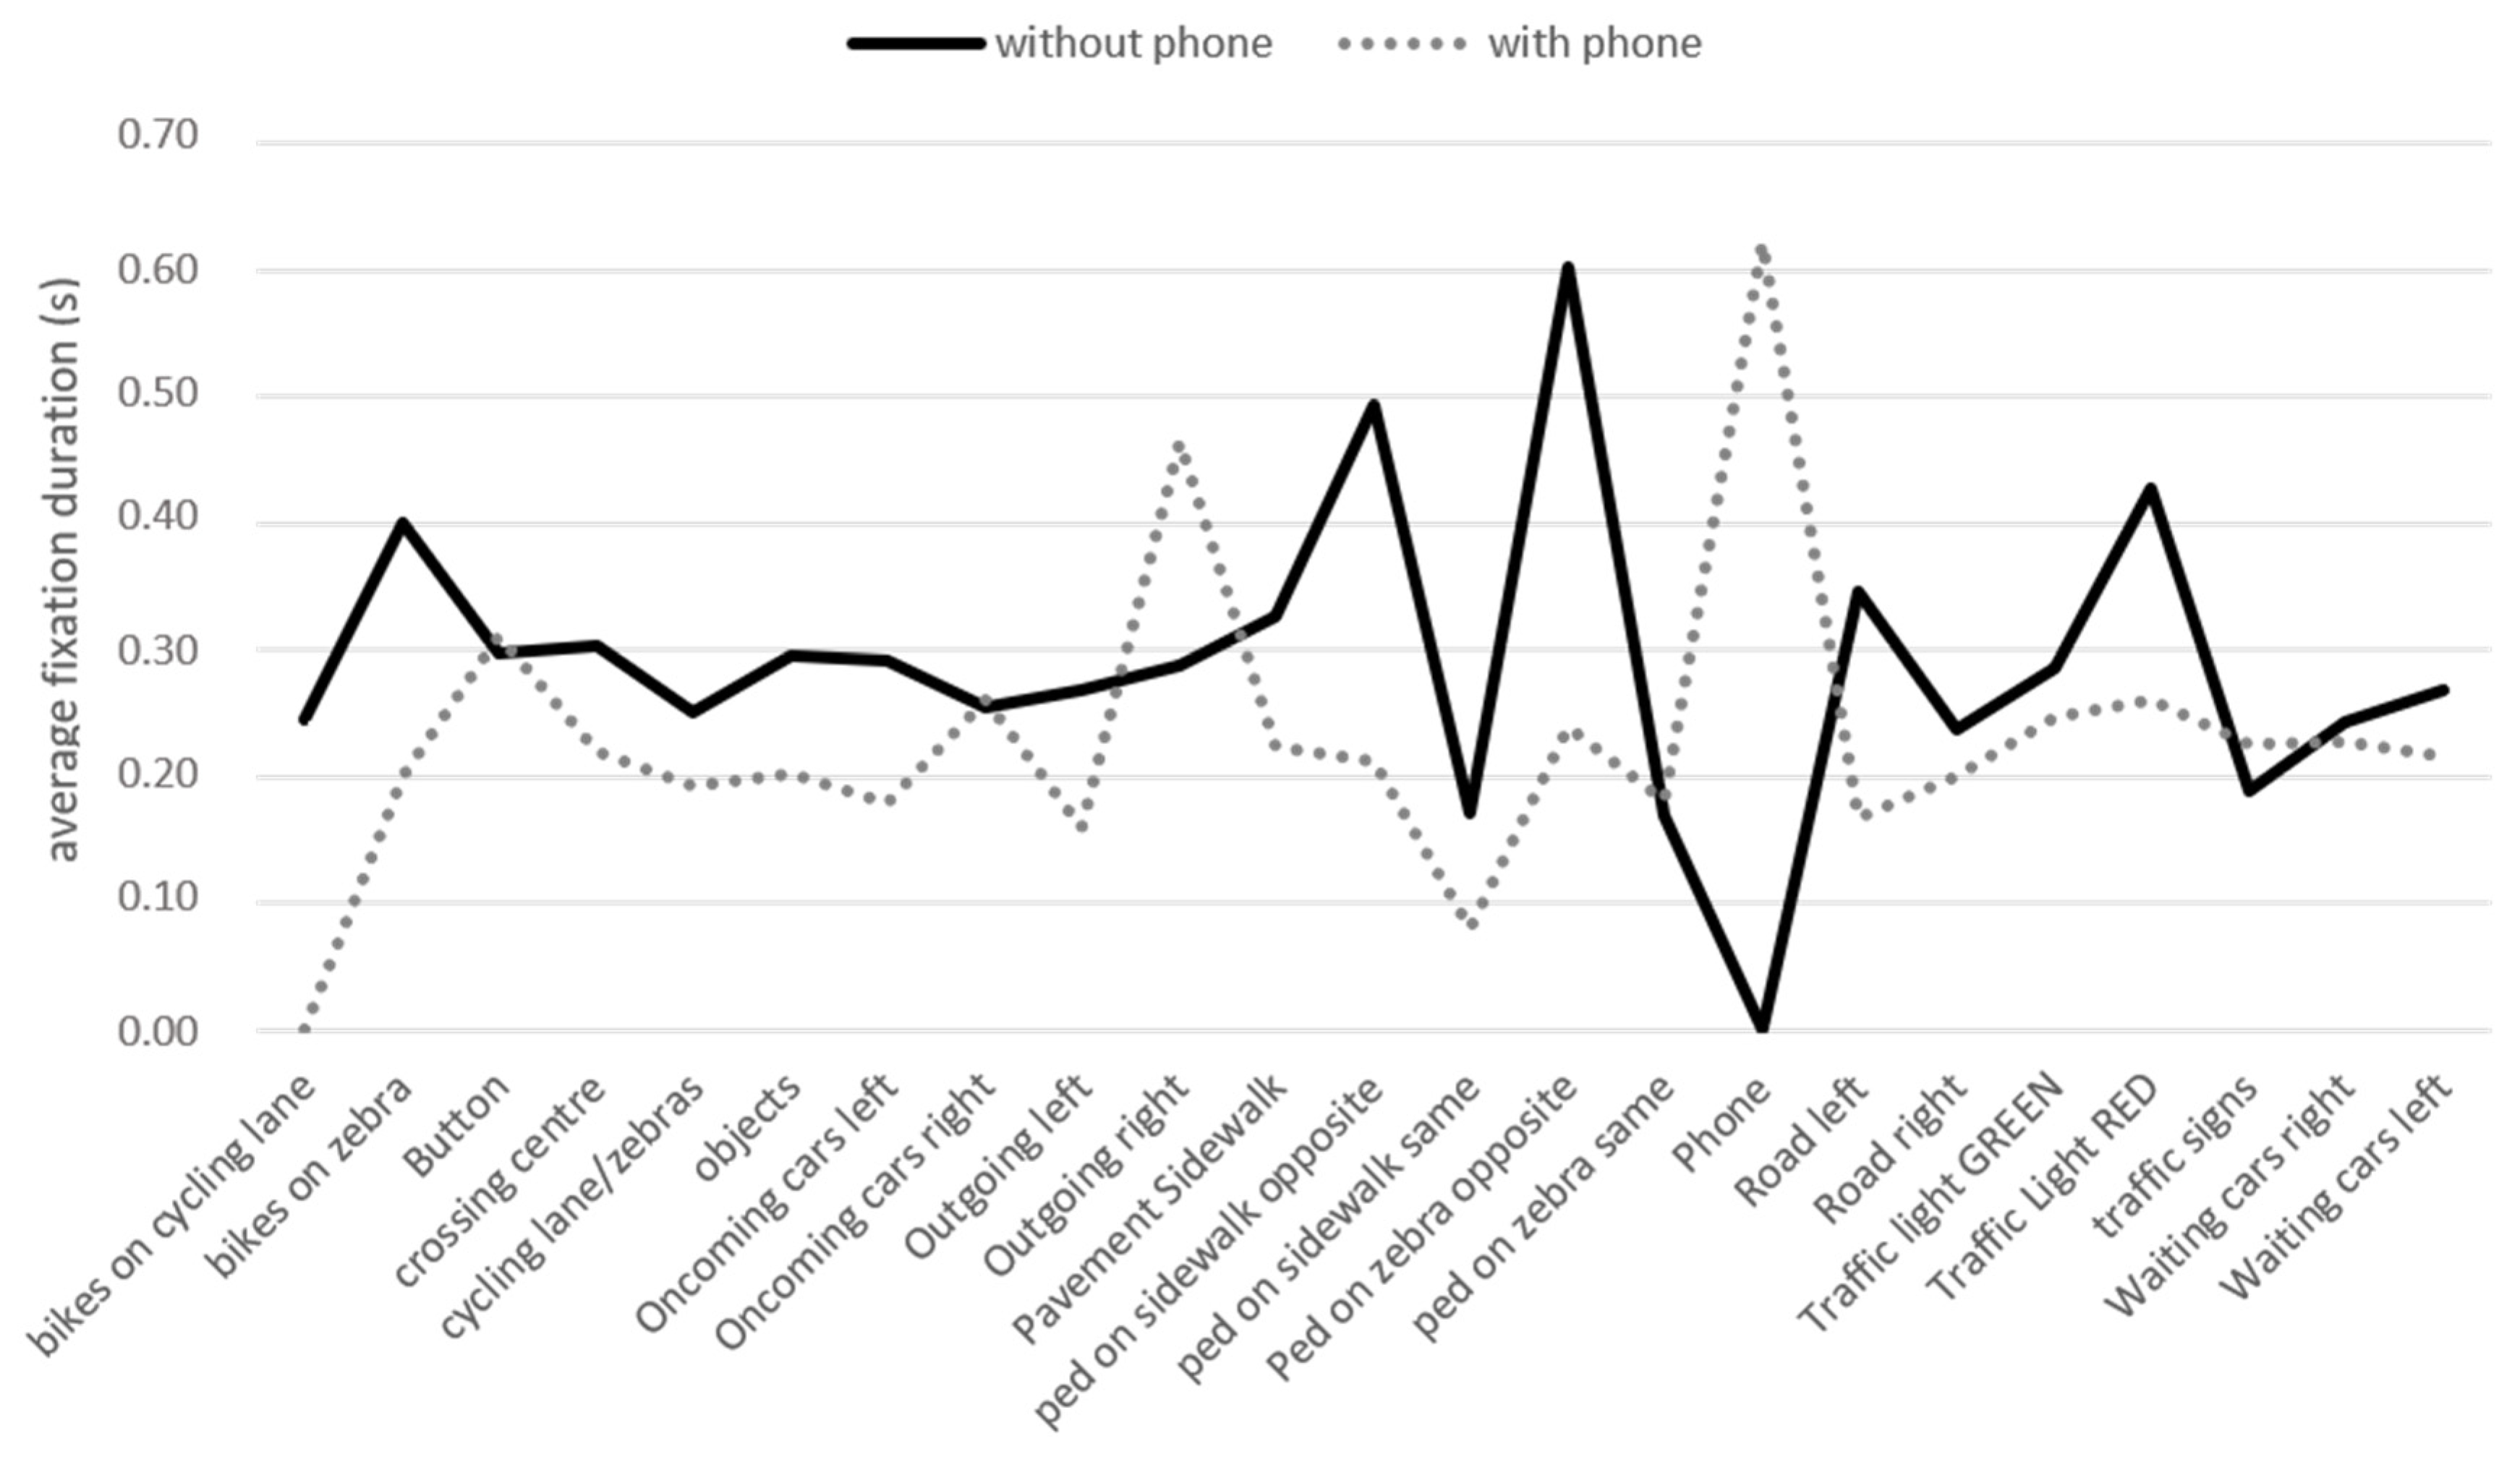
Finally, the average duration of fixation should be pointed out. This element, indeed reflects each participant’s interest in a particular item by calculating the average time he/she spent on the selected element.
Figure 6 compares the average fixation durations on different AOIs in the two conditions, with and without phone. As can be seen, pedestrians walking on zebras in the opposite direction were the element fixated longer by participants in the “without phone” condition, while outgoing cars were the most observed element (after the phone itself) in the second condition.
Table 9 summarizes the difference in average fixation duration in the two conditions. It can be seen that outgoing cars and traffic signs were observed much more frequently in the condition with phone, while the other AOIs had a longer duration in the condition without phone.
5.4. Eye-Path
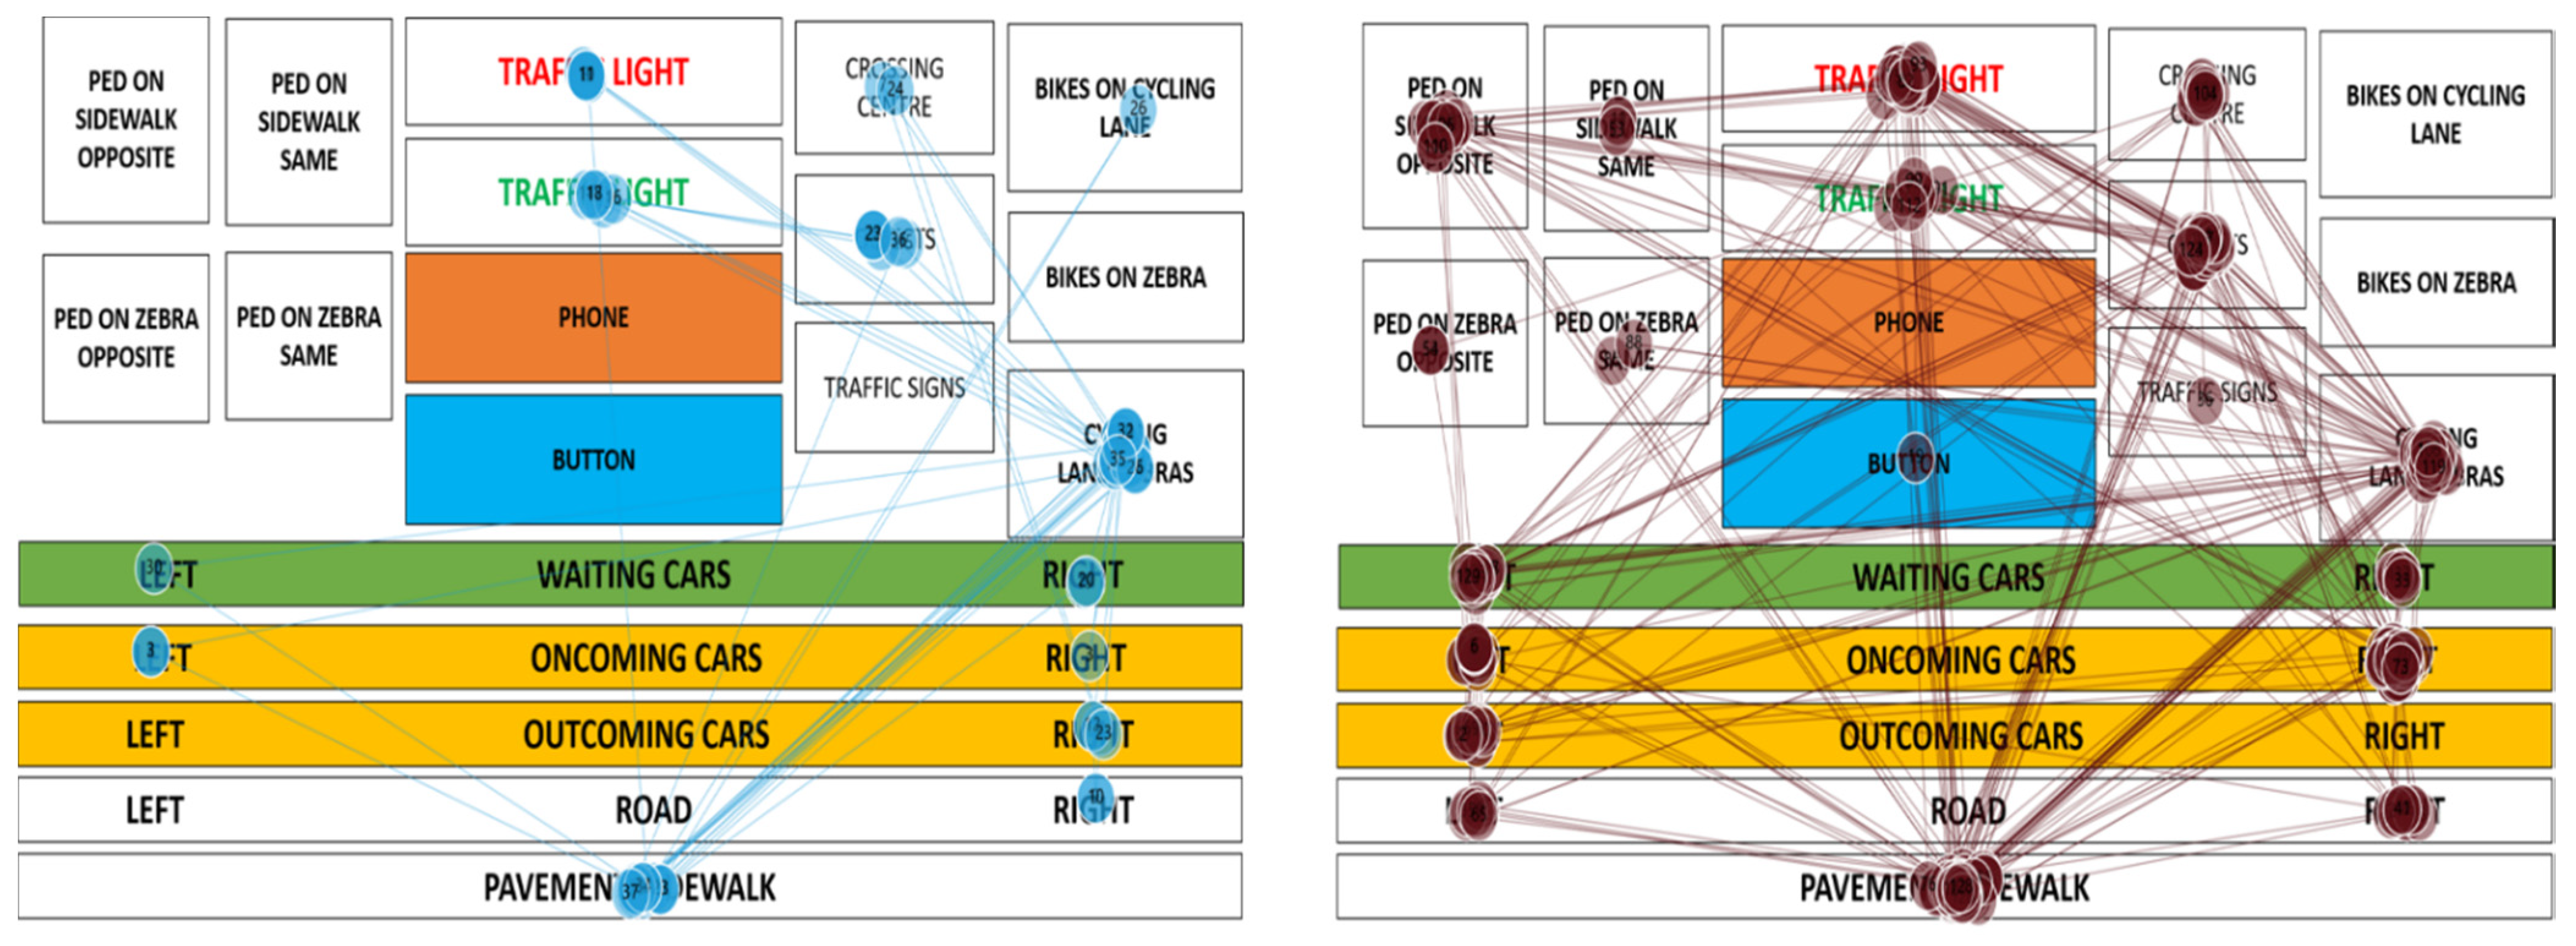
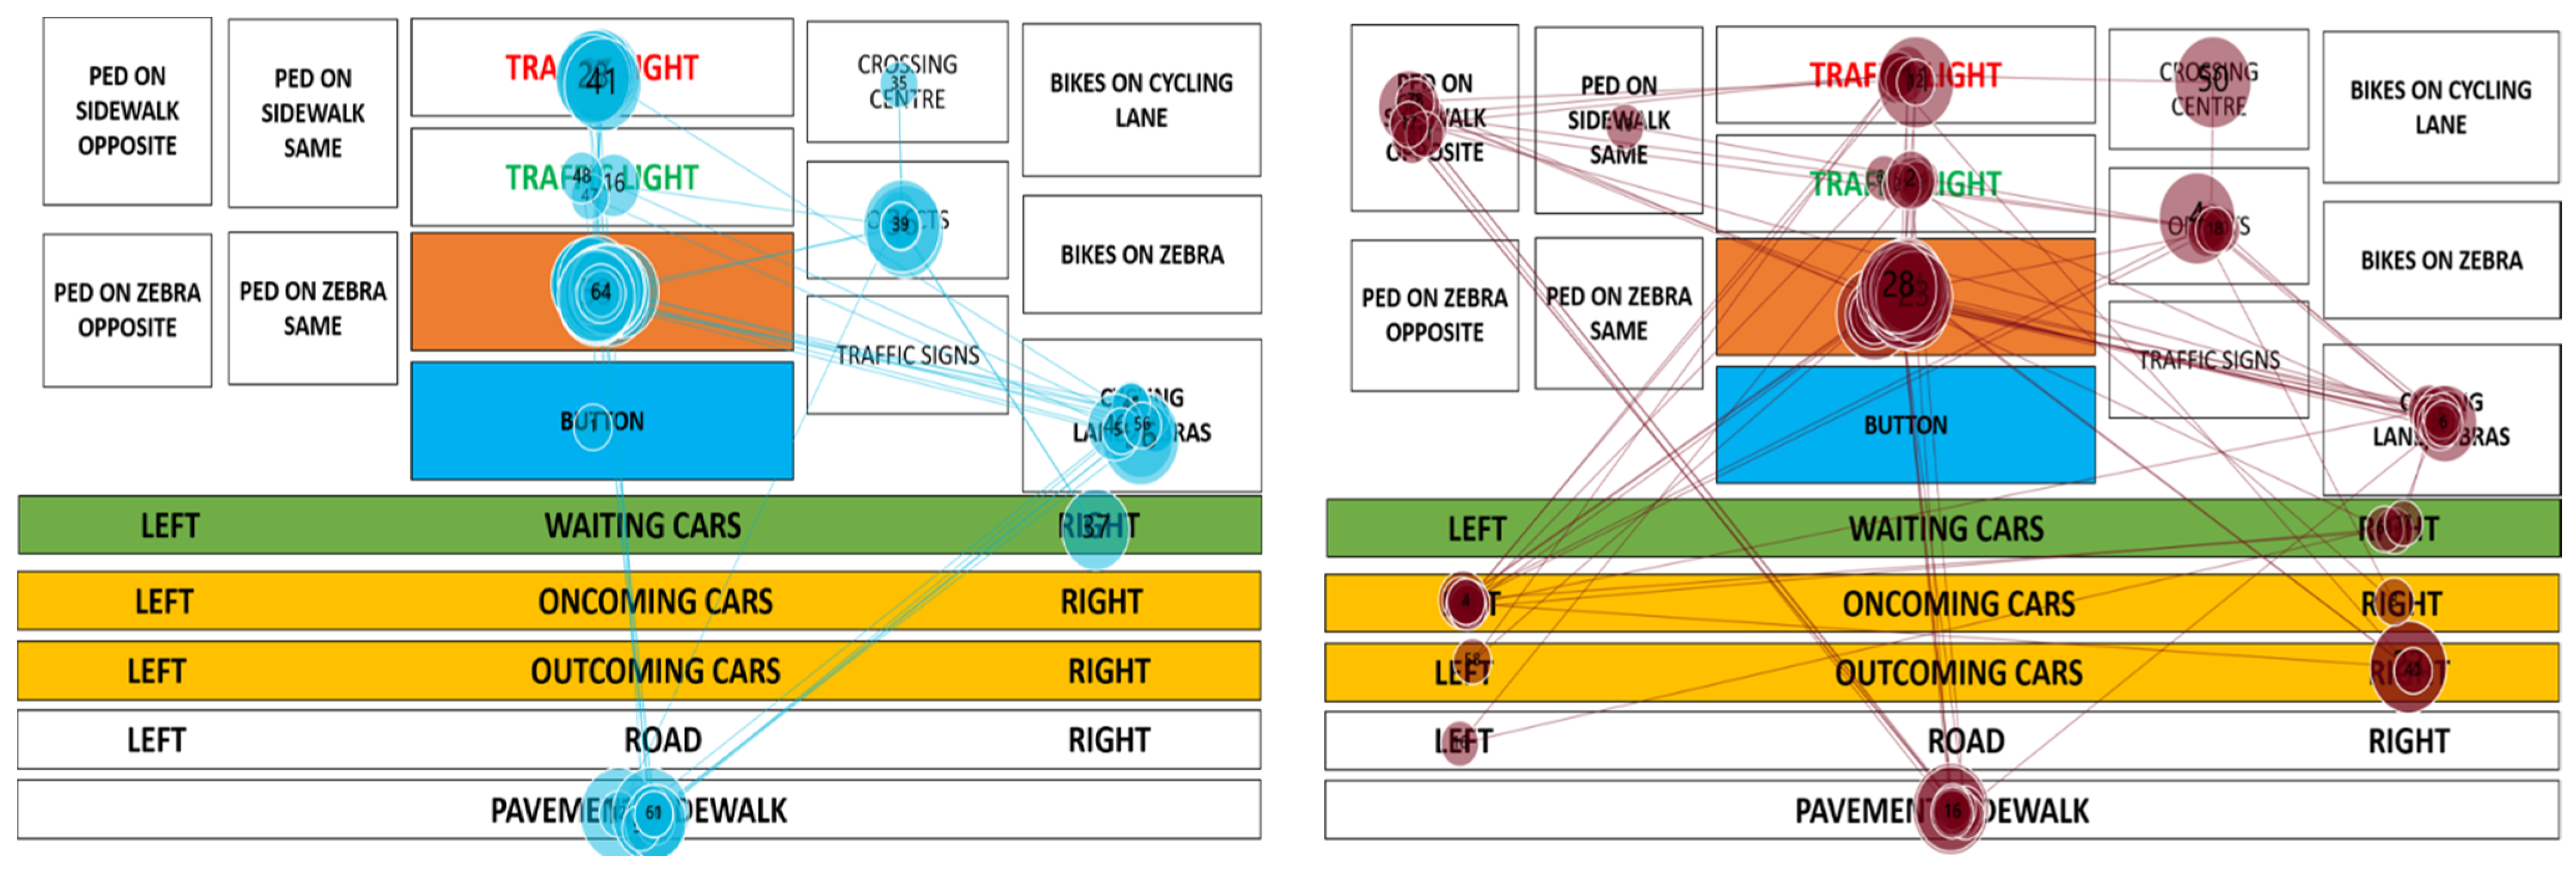
An interesting tool offered by eye-tracking technology is gaze plots. These are graphical representations of the path the eye follows during the experiment. Each participant had their own gaze plot, which can be displayed individually or together with the gaze paths of all other participants.
Observing the recorded videos, it became clear that some subjects in both situations (with phone and without phone) were highly focused on their tasks, while others were distracted by various elements of the surroundings. This difference also seemed to translate to the participants’ crossing behavior. Therefore, two groups of individuals were defined, namely, attentive pedestrians and inattentive pedestrians, corresponding respectively to the two aforementioned ways of paying attention to the task or to the environment. It was interesting to understand which eye-paths were followed by individuals belonging to these two groups. Individual gaze diagrams were used for this purpose.
Figure 7 and
Figure 8 compare the gaze paths of attentive (light blue) and inattentive (dark red) pedestrians in the two conditions. As can be observed, the former focused their attention on a small number of specific elements, all closely related to the crossing situation they were in. On the other hand, the inattentive participants were also captured by elements that were not directly related to their crossing situation, e.g., outgoing cars that did not interact with them, the empty road and other pedestrians on different sidewalks. This different way of focusing on road items could also be reflected in the overall crossing behavior. Since the number of participants was too small to form two statistically appropriate groups of attentive and inattentive pedestrians, only a general calculation of crossing times and speeds was made to provide a basis for further research. Inattentive pedestrians were found to exhibit safer behaviors characterized by higher speeds (1.7 m·s
−1 and 1.67 m·s
−1 for the no phone and with phone conditions, respectively) and lower crossing times (8.31 s and 8.41 s on average in the two conditions). In contrast, inattentive pedestrians had lower speed values and higher crossing times. As with reaction times, the variability of the data was too high to draw valid conclusions.
6. Conclusions
The research presents the results of an outdoor experiment using eye-tracking technology conducted in the urban area of Maribor (Slovenia). The aim of the study was to investigate the extent to which a widespread activity such as phone handling (a common task performed by young adults while walking) influences pedestrian behavior at signalized intersections. Two conditions were examined: the non-distracted condition consisted of participants focusing only on the task of walking and crossing the street, without any device; the distracted condition consisted of pedestrians checking their social media apps throughout the duration of the experiment. A total of 12 people participated in the experiment, crossing three different signalized intersections. The limited sample of participants and the study of only one intersection typology is a limitation of the study that should be considered. Nonetheless, further research is underway to address both of these gaps by both increasing the sample of participants and analyzing other intersection typologies.
The results highlight an important effect of smartphones on pedestrian attention and behavior. Analysis of reaction times highlights a 0.923 s slower response for pedestrians who focus their attention on their social media and crossing time and speed were also affected by smartphone use, although slightly. Crossing speed decreased when pedestrians check their phones, and crossing times covered a wider range, highlighting a behavioral variability issue that could translate into unpredictability of pedestrian behavior for drivers. Fixations also showed a significant influence of the distracting task, highlighting that pedestrians’ attention to potentially interacting objects decreased when they were captured by their device. The striking differences in the values of reaction times were also confirmed by statistical tests at the 90% confidence level, proving that the use of a phone is a significant distractor and highly affects pedestrian behavior in traffic, whereas the differences in the values of crossing speed were not detected by the tests performed.
Finally, a qualitative analysis of gaze behavior highlighted two distinct pedestrian typologies that were not directly related to smartphone use: attentive and inattentive pedestrians. Although an in-depth analysis of these two groups was not yet possible, some observations could be made to serve as a basis for further research. Specifically, the first group (attentive pedestrians) was characterized by more focused behavior, as evidenced by lower crossing times and higher crossing speeds. The second group was inattentive individuals whose attention was captured by a variety of elements in the road environment: these have longer crossing times as well as lower speeds.
The results of this study have important implications for pedestrian safety, as they show a concrete impact of smartphone use on young pedestrians. By strongly affecting reaction time, smartphones reduce pedestrians’ performance at the beginning of a crossing event, which may translate into a higher risk for the same. It should be kept in mind that pedestrians are the most vulnerable road users, but also the ones who can react the fastest to dangerously interacting vehicles. When their attention is tied up by other devices, these responses are slowed. Furthermore, the research findings highlight that there is an effective need for new infrastructure design solutions, especially at intersections where pedestrians’ attention needs to be diverted from smartphones to the road and its interacting elements. Innovative road elements, such as smart traffic lights, could improve the current situation and lead to safer pedestrian behavior.
Future studies are needed and planned to support these preliminary findings. These studies should consider larger participant samples as well as examine other intersections. Indeed, we expect that on a larger database the difference between the two samples will crystallize even more clearly. In addition, it would be interesting to investigate whether there are differences in attention allocation and crossing behavior among pedestrians of different age groups.
Author Contributions
Conceptualization, C.G., I.I.O. and M.Š.; methodology, C.G.; software, C.G.; validation, C.G., I.I.O. and M.Š.; formal analysis, C.G., I.I.O.; investigation, C.G., M.Š.; resources, I.I.O. and M.Š; data curation, C.G.; writing—original draft preparation, C.G.; writing—review and editing, C.G., I.I.O. and M.Š.; visualization, C.G.; supervision, I.I.O. and M.Š.; project administration, I.I.O. and M.Š. All authors have read and agreed to the published version of the manuscript.
Funding
This research received no external funding.
Institutional Review Board Statement
The study was conducted according to the guidelines of the Declaration of Helsinki, and approved by the Ethics Committee of Josip Juraj Strossmayer University of Osijek, Faculty of Civil Engineering and Architecture, dated 5 February 2021 reference number 2158-77-18-21-01, issued for the research within the bi-lateral Slovenian-Croatian project “Development of a prediction model of pedestrian children behavior in the urban transport network”.
Informed Consent Statement
Informed consent was obtained from all subjects involved in the study.
Data Availability Statement
Data available on request due to privacy restrictions.
Acknowledgments
The authors would like to acknowledge that this research was worked out in the frame of the international bi-lateral Slovenian-Croatian project “Development of prediction model of pedestrian children behavior in the urban transport network”.
Conflicts of Interest
The authors declare no conflict of interest.
References
- Alejalil, N.; Davoodi, S.R. Mobile phone use and its effects on pedestrian distraction. Int. J. High Risk Behav. Addict. 2016, 6. [Google Scholar] [CrossRef]
- Hatfield, J.; Murphy, S. The effects of Mobile phone use on pedestrian crossing behavior at signalized and unsignalized intersections. Accid. Anal. Prev. 2007, 39, 197–205. [Google Scholar] [CrossRef] [PubMed]
- Naser, J.L.; Troyer, D. Pedestrian injuries due to mobile phone use in public places. Accid. Anal. Prev. 2013, 57, 91–95. [Google Scholar] [CrossRef] [PubMed]
- Belliger, D.B.; Budde, B.M.; Machida, M.; Richardson, G.B.; Berg, W.P. The effect of cellular telephone conversation and music listening on response time in braking. Transp. Res. Part F: Traffic Psychol. Behav. 2009, 12, 441–451. [Google Scholar] [CrossRef]
- Yannis, G.; Laiou, A.; Papantoniou, P.; Gkartzonikas, C. Simulation of texting impact on young drivers’ behavior and safety on motorways. Transp. Res. Part F: Traffic Psychol. Behav. 2016, 41, 10–18. [Google Scholar] [CrossRef]
- Lipovac, K.; Đerić, M.; Tešić, M.; Andrić, Z.; Marić, B. Mobile phone use while driving-literary review. Transp. Res. Part F Traffic Psychol. Behav. 2017, 47, 132–142. [Google Scholar] [CrossRef]
- De Waard, D.; Schepers, P.; Ormel, W.; Brookhuis, K. Mobile phone use while cycling: Incidence and effects on behavior and safety. Ergonomics 2010, 53, 30–42. [Google Scholar] [CrossRef] [PubMed]
- Muley, D.; Alhajyaseen, W.; Kharbeche, M.; Al-Salem, M. Pedestrians’ Speed Analysis at Signalized Crosswalk. Procedia Comput. Sci. 2018, 130, 567–574. [Google Scholar] [CrossRef]
- Ištoka Otković, I.; Deluka-Tibljaš, A.; Šurdonja, S.; Campisi, T. Development of Models for Children—Pedestrian Crossing Speed at Signalized Crosswalks. Sustainability 2021, 13, 777. [Google Scholar] [CrossRef]
- Malinovskiy, Y.; Wu, Y.-J.; Wang, Y. Video-Based Monitoring of Pedestrian Movements at Signalized Intersections. Transp. Res. Rec. 2008, 2073, 11–17. [Google Scholar] [CrossRef]
- Duim, E.; Lebrao, M.L.; Antunes, J.L.F. Walking speed of folder people and pedestrian crossing time. J. Transp. Health 2017, 5, 70–76. [Google Scholar] [CrossRef]
- Thompson, L.L.; Rivara, F.P.; Ayyagari, R.C.; Ebel, B.E. Impact of social and technological distraction on pedestrian crossing behavior: An observational study. Inj. Prev. 2013, 19, 232–237. [Google Scholar] [CrossRef] [PubMed]
- Davounian, N.; Raynham, P. What do pedestrians look at night? Lighting Res. Technol. 2012, 44, 438–448. [Google Scholar] [CrossRef]
- Fotios, S.; Uttely, J.; Cheal, C.; Hara, N. Using eye-tracking to ideltify pedestrians’ critical visual tasks, Part 1. Dual task approach. Lighting Res. Technol. 2015, 47, 133–148. [Google Scholar] [CrossRef]
- Fotios, S.; Uttely, J.; Yang, B. Using eye-tracking to identify pedestrians’ critical visual tasks. Part 2. Fixation on pedestrians. Lighting Res. Technol. 2015, 47, 149–160. [Google Scholar] [CrossRef]
- Foulsham, T.; Walker, E.; Kingstone, A. The where, what and when of gaze allocation in the lab and the natural environment. Vis. Res. 2011, 51, 1920–1931. [Google Scholar] [CrossRef] [PubMed]
- Jiang, K.; Ling, F.; Feng, Z.; Ma, C.; Kumfer, M.; Sao, C.; Wang, K. Effects of mobile phone distraction on pedestrians’ crossing behavior and visual attention allocation at a signalized intersection: An outdoor experimental study. Accid. Anal. Prev. 2018, 115, 170–177. [Google Scholar] [CrossRef] [PubMed]
- Tobiipro. Tobii Pro Lab User’s Manual v. 1.86-en-US; Tobii Pro AB: Stockholm, Sweden, 2018. [Google Scholar]
- Tobiipro. How Do Tobii Eye-Trackers Work? Available online: https://www.tobiipro.com/learn-and-support/learn/eye-tracking-essentials/how-do-tobii-eye-trackers-work/ (accessed on 16 September 2020).
Figure 1.
Representation of the whole route walked by the attendees during the experiment. The unsignalized crosswalks are highlighted in green and numbered from 1 to 3; the two linear sidewalk segments are flagged in black, while the signalized crossings numbered in red from 1 to 3 are the ones considered in this paper.
Figure 2.
Methodological process followed to achieve behavioral features and gaze data.
Figure 2.
Methodological process followed to achieve behavioral features and gaze data.
Figure 3.
Ranges of crossing time observed during the experiment.
Figure 3.
Ranges of crossing time observed during the experiment.
Figure 4.
Results of Anderson-Darling tests worked out on crossing speed samples.
Figure 4.
Results of Anderson-Darling tests worked out on crossing speed samples.
Figure 5.
Bar charts representing the share of time participants spent on each of the considered AOIs (a) in the undistracted condition and (b) in the distracted one. In (b) the share of time spent by participants on phone (85%) has been omitted, in order to make the other values more visible.
Figure 5.
Bar charts representing the share of time participants spent on each of the considered AOIs (a) in the undistracted condition and (b) in the distracted one. In (b) the share of time spent by participants on phone (85%) has been omitted, in order to make the other values more visible.
Figure 6.
Average fixation duration (given in seconds) over the defined AOIs.
Figure 6.
Average fixation duration (given in seconds) over the defined AOIs.
Figure 7.
Comparison of the gaze plots of focused and distracted pedestrians when they walk without the phone (graphical representation on the code labeling image).
Figure 7.
Comparison of the gaze plots of focused and distracted pedestrians when they walk without the phone (graphical representation on the code labeling image).
Figure 8.
Comparison of the gaze plots of focused and distracted pedestrians when they walk with the phone (graphical representation on the code labeling image).
Figure 8.
Comparison of the gaze plots of focused and distracted pedestrians when they walk with the phone (graphical representation on the code labeling image).
Table 1.
Groups of Areas of Interest (AOI) defined in this study. Each AOI represents an item that could influence pedestrian attention.
Table 1.
Groups of Areas of Interest (AOI) defined in this study. Each AOI represents an item that could influence pedestrian attention.
| AOI Groups | AOIs |
|---|
| Path | Zebra |
| Pavement/sidewalk |
| Other pedestrians | Ped on sidewalk opposite |
| Ped on sidewalk same |
| Ped on zebra opposite |
| Ped on zebra same |
| Bicyclists | Bikes on cycling lane |
| Bikes on zebra |
| Oncoming cars | Oncoming cars left |
| Oncoming cars right |
| Cars on zebra |
| Outgoing cars | Outgoing cars left |
| Outgoing cars right |
| Road | Road left |
| Road right |
| Button | Call for pedestrian green light |
| Traffic lights | The “stop” (red-light) and “go” (green light) signals of pedestrian traffic lights |
| Phone | Phone |
| Other elements | Traffic signs |
| Objects |
Table 2.
Reaction times obtained after data filtering.
Table 2.
Reaction times obtained after data filtering.
| Reaction Time (s) |
|---|
| | without Phone | with Phone |
|---|
| mean | 2.092 | 3.015 |
| st. err. | 0.316 | 0.394 |
| asymmetry | 0.880 | 1.620 |
| min | 0.000 | 0.000 |
| max | 7.785 | 14.581 |
Table 3.
Confidence intervals for the standard deviation and variance ratios as calculated by Bonett’s and Levene’s tests at confidence level 90%.
Table 3.
Confidence intervals for the standard deviation and variance ratios as calculated by Bonett’s and Levene’s tests at confidence level 90%.
| Test Method | St. Dev. Ratio | CI for Ratio of St. Dev. | Variances Ratio | CI for Ratio of Variances | p-Value |
|---|
| Bonett | 0.628 | (0.479; 0.896) | 0.395 | (0.230; 0.804) | 0.039 |
| Levene | (0.516; 0.941) | (0.266; 0.885) | 0.055 |
Table 4.
Results of t-test at confidence level 90%. μ1−μ2 identifies the difference between the means of the two samples.
Table 4.
Results of t-test at confidence level 90%. μ1−μ2 identifies the difference between the means of the two samples.
| Test Method | μ1–μ2 | Range for μ1–μ2 | p-Value |
|---|
| t-test | −0.923 | (−1.760; −0.087) | 0.070 |
Table 5.
Comparison of crossing time in the two conditions under study, for each of the crossings.
Table 5.
Comparison of crossing time in the two conditions under study, for each of the crossings.
| | Crossing 1 | Crossing 2 | Crossing 3 | Mean Value |
|---|
| without phone (s) | 10.50 | 7.50 | 8.35 | 8.86 |
| with phone (s) | 11.01 | 7.95 | 8.32 | 9.15 |
| difference (s) | 0.51 | 0.45 | −0.03 | 0.29 |
Table 6.
Comparison of descriptive statistics for crossing speed in the distracted and undistracted conditions.
Table 6.
Comparison of descriptive statistics for crossing speed in the distracted and undistracted conditions.
| | Without Phone-Crossing Speed | With Phone-Crossing Speed |
|---|
| Mean | 1.61 | 1.57 |
| St. Err. | 0.03 | 0.04 |
| Median | 1.61 | 1.52 |
| Asymmetry | −0.14 | 0.69 |
| Min | 1.26 | 1.22 |
| Max | 1.93 | 2.07 |
Table 7.
Results of F-test for two variances on crossing speeds.
Table 7.
Results of F-test for two variances on crossing speeds.
| Test Method | CI for Ratio St. Dev. | Ci for Ratio of Variances | p-Value |
|---|
| F | (0.507; 1.052) | (0.257; 1.106) | 0.090 |
Table 8.
Fixation counts for the defined AOIs in the without phone and with phone condition.
Table 8.
Fixation counts for the defined AOIs in the without phone and with phone condition.
| AOIS | without Phone | with Phone |
|---|
| bikes on cycling lane | 1.50 | 0.00 |
| bikes on zebra | 2.00 | 1.00 |
| Button | 1.00 | 1.50 |
| crossing center | 3.95 | 1.33 |
| cycling lane/zebras | 9.44 | 3.89 |
| objects | 10.35 | 2.84 |
| Oncoming cars left | 5.95 | 2.58 |
| Oncoming cars right | 6.81 | 1.00 |
| Outgoing left | 2.47 | 1.22 |
| Outgoing right | 2.67 | 4.00 |
| Pavement Sidewalk | 8.50 | 4.56 |
| ped on sidewalk opposite | 4.39 | 2.50 |
| ped on sidewalk same | 3.75 | 1.00 |
| Ped on zebra opposite | 2.50 | 1.00 |
| ped on zebra same | 1.67 | 1.00 |
| Phone | 0.00 | 32.93 |
| Road left | 2.61 | 1.00 |
| Road right | 2.02 | 1.50 |
| Traffic light GREEN | 2.18 | 1.42 |
| Traffic Light RED | 5.61 | 4.00 |
| traffic signs | 1.39 | 1.41 |
| Waiting cars right | 2.13 | 1.16 |
| Waiting cars left | 3.20 | 1.00 |
Table 9.
Difference in average fixation duration between the two recalled conditions. Negative differences identify longer durations for the distracted condition.
Table 9.
Difference in average fixation duration between the two recalled conditions. Negative differences identify longer durations for the distracted condition.
| AOIs | Difference |
|---|
| bikes on cycling lane | 0.24 |
| bikes on zebra | 0.20 |
| Button | −0.01 |
| crossing center | 0.08 |
| cycling lane/zebras | 0.06 |
| objects | 0.09 |
| Oncoming cars left | 0.11 |
| Oncoming cars right | −0.01 |
| Outgoing left | 0.11 |
| Outgoing right | −0.18 |
| Pavement Sidewalk | 0.10 |
| ped on sidewalk opposite | 0.28 |
| ped on sidewalk same | 0.09 |
| Ped on zebra opposite | 0.36 |
| ped on zebra same | −0.01 |
| Road left | 0.18 |
| Road right | 0.04 |
| Traffic light GREEN | 0.04 |
| Traffic Light RED | 0.17 |
| traffic signs | −0.04 |
| Waiting cars right | 0.02 |
| Waiting cars left | 0.05 |
| Publisher’s Note: MDPI stays neutral with regard to jurisdictional claims in published maps and institutional affiliations. |
© 2021 by the authors. Licensee MDPI, Basel, Switzerland. This article is an open access article distributed under the terms and conditions of the Creative Commons Attribution (CC BY) license (https://creativecommons.org/licenses/by/4.0/).


