Article

Market Foods, Own Production, and the Social Economy: How Food Acquisition Sources Influence Nutrient Intake among Ecuadorian Farmers and the Role of Agroecology in Supporting Healthy Diets

1
Nutrition Department, Faculty of Medicine, Université de Montréal, P.O. Box 6128, Succ. Centre-Ville, Montréal, QC H3C 3J7, Canada
2
Centre de Recherche en Santé Publique de l’Université de Montréal et du CIUSSS du Centre-Sud-de-l’Île-de-Montréal (CReSP), 7101 Avenue du Parc, CP 6128, Succursale Centre-Ville, Montréal, QC H3C 3J7, Canada
3
HealthBridge Foundation of Canada, 1 Nicholas Street, Suite 1004, Ottawa, ON KIN 7B7, Canada
4
Dalla Lana School of Public Health, 155 College St, Toronto, ON M5T 3M7, Canada
5
Fair Fields, 221689 Concession 14, RR1, Neustadt, ON N0G 2M0, Canada
*
Authors to whom correspondence should be addressed.
Sustainability 2021, 13(8), 4410; https://doi.org/10.3390/su13084410
Submission received: 11 March 2021 / Revised: 9 April 2021 / Accepted: 12 April 2021 / Published: 15 April 2021
(This article belongs to the Special Issue Diet, Human Health and Wellbeing in Traditional Food Systems)

Abstract

:
Rural Ecuadorians are experiencing a double burden of malnutrition, characterized by simultaneous nutrient inadequacies and excesses, alongside the social and environmental consequences of unsustainable agriculture. Agriculture can support farmer nutrition by providing income for market purchases and through the consumption of foods from own production. However, the nutritional contributions of these food acquisition strategies vary by context. We surveyed smallholder women farmers (n = 90) in Imbabura province to assess the dietary contributions of foods obtained through market purchase, own production, and social economy among farmers participating in agroecology—a sustainable farming movement—and neighboring reference farmers. We found that foods from farmers’ own production and the social economy were relatively nutrient-rich, while market foods were calorie-rich. Consumption of foods from own production was associated with better nutrient adequacy and moderation, whereas market food consumption was associated with a worse performance on both. Food acquisition patterns differed between farmer groups: agroecological farmers obtained 44%, 32%, and 23% of their calories from conventional markets, own production, and the social economy, respectively, while reference neighbors obtained 69%, 17%, and 13%, respectively. Our findings suggest that, in this region, farmer nutrition is better supported through the consumption of their own production than through market purchases, and sustainable farming initiatives such as agroecology may be leveraged for healthy diets.

1. Introduction

Smallholder family farmers feed the world: they produce an estimated 80% of the world’s food [1]. Yet paradoxically, many are malnourished [1,2]. Whereas in the past this primarily took on the form of nutrient inadequacies, now rural people, and especially Indigenous rural people, increasingly experience a double burden of malnutrition, wherein families or individuals have simultaneous nutrient inadequacies and excesses [3,4,5]. As a result, obesity and diet-related chronic diseases are becoming increasingly prevalent in rural areas even as the health problems associated with nutrient deficiencies continue [3,6]. This widespread double burden of malnutrition has been linked to the displacement of traditional food systems in favor of new productionist paradigms that deteriorate diversity at multiple levels, including in agricultural production from global to local scales, the availability of products in the food environment, household food access, and individual dietary intake [7].
In Ecuador, much of the Indigenous population is concentrated in the rural sector of the highland region, where smallholder farming is the predominant livelihood activity [8,9] and nutritional disparities are evident: 38% of rural children under five are stunted, compared to 27% of their urban counterparts [10], and Indigenous children are disproportionately affected [5]. Meanwhile, overweight and obesity prevalence among rural children (10%) is similar to that of their urban counterparts (8%). Among adults in the highland region, rural overweight and obesity prevalence (56%) is catching up to that among the urban population (64%), and so is the prevalence of associated chronic diseases [10]. Meanwhile, rural people’s access to health care services lags far behind that of their urban counterparts [11]. The nutritional inequalities lived by farming populations around the world have spurred much interest in how to effectively mobilize agriculture for nutritional health outcomes [12,13,14].
Discourse has reached a growing consensus that agriculture can positively impact dietary diversity of nutritious foods among farming populations through multiple pathways. Two pathways that have received strong attention are: (i) the purchase of foods using income generated by selling agricultural products and (ii) the subsistence consumption of foods from own production [15]. For both of these pathways, agrobiodiversity can be an important mediator; for example, by diversifying products for market sale or by producing diverse foods for own consumption [16,17]. Recently, a debate has emerged regarding which of these pathways is most effective and should be prioritized [18]. In some locations, subsistence consumption (i.e., consuming foods from own production) appears to be the main pathway by which higher agricultural diversity translates to higher dietary diversity [19,20]. Others challenge the role of own production as a primary source of farmer dietary intake [21], and instead propose that strengthening access to rural markets is key to improving dietary quality [22]. Still, others point out that heavy prioritization of the market purchase pathway can be problematic because of inequalities in market access [23], insufficient diversity of foods in local markets [18], or otherwise unhealthy market food environments [24].
These discussions often utilize dietary diversity as their outcome of interest, which serves as a useful proxy for nutrient adequacy [25], but unfortunately speaks little to the pressing problem of overweight and diet-related chronic disease. A body of literature is instead developing on how the types of foods obtained through the retail environment can differentially influence overweight and obesity prevalence, with special attention to the availability of processed and ultra-processed foods [26]. In high-income countries, the numerous studies assessing how the food environment affects obesity have produced uncertain and often contradictory results [27], reflecting the complexity of the relationship between environmental factors and dietary health [28]. This subject has received less attention in low- and middle-income countries, but the evidence thus far predominantly suggests that proximity to urban markets and consumption from supermarkets is associated with higher overweight and obesity prevalence and associated chronic diseases [29,30,31]. In these settings, retail markets appear to encourage the consumption of inexpensive calorie-rich and nutrient-poor foods [3,26], and increasingly, even the most remote regions are becoming flooded with products that supplant traditional diets and instead propagate a nutrition transition toward diets high in sugar, saturated fat, and sodium [32,33]. This tendency may undermine the gains to nutritional health that may otherwise be made through market purchases [24].
The sum of these arguments underlines a need to better understand the nutritional contributions made by foods acquired through distinct pathways to farmers’ diets. Alongside this need, a growing chorus is now voicing the urgency of better understanding how agriculture-nutrition linkages can nurture positive feedback cycles with environmental sustainability [7,34,35]. This aligns with the growing understanding that undernutrition, obesity, and climate change constitute an inextricable global syndemic [36], and that food and agriculture need to be transformed together to systematically support planetary health [37]. In this article, we turn to Ecuador’s highland Imbabura province to assess the linkages between farmers’ food acquisition practices and their diets, and we further give special attention to farmers participating in the local agroecology movement to better understand how sustainable agriculture rooted in traditional farming practices may be mobilized for farmers’ nutritional health.

1.1. Agroecology

In the Ecuadorian highlands, Indigenous farmers’ organizations, NGOs, and other actors have coalesced around agroecological farming as a path toward environmentally and culturally restorative agricultural ecosystems, and for escaping the noxious health effects of heavy pesticide use [38,39]. As a result, some groups of smallholder farmers across the highlands are organized in agroecological farmers’ associations, through which they commercialize their products in alternative food networks such as farmers’ markets and share certain norms and values around food and agricultural practices; among these norms, they emphasize consuming foods from their own farms and through the social economy, perceiving these acquisition pathways to be better aligned with cultural traditions [40,41]. We are interested in the dietary dynamics of these farmers because agroecology in Ecuador has taken on the form of a social movement [42,43] that is expanding endogenously among farmers to influence their food practices, and that aspires to create a healthier, more sustainable food system for both producers and consumers [38]. Our previous research in the region identified that participation in the agroecology movement was associated with stronger performance on measures of nutrient adequacy and dietary moderation, even when controlling for socioeconomic variables. One of the outcomes of this research was the need to better understand how participation in agroecology impacts farmers’ food acquisition practices, and whether this explains the relative nutritional advantage that agroecological farmers displayed over their neighbors [44].

1.2. Social Economy

While most studies on farmers’ food acquisition practices and nutritional outcomes distinguish between market foods and own production, the sociocultural context in rural Ecuador calls for consideration of a third food source, summarized as the social economy [40,44]. Related to the popular economy or solidarity economy, the social economy emphasizes transactions with social intentions that transcend profit maximization [45]. In Ecuador and elsewhere in the Andes, social economy practices are rooted in the Indigenous emphasis on reciprocity, and they include barter, gifting, and direct monetary transactions between people that have meaningful relationships with each other [40,46,47]. These three social economy practices—barter, gifting, and direct purchase—occur on a continuum, wherein goods, money, and services can simultaneously enter the exchange, and the relationship between the trading parties not only determines the terms of the transaction, but the transaction is also utilized to strengthen the relationship [48,49]. In Imbabura province, social economy practices are rooted in the region’s history as a bartering center for goods from the country’s coastal, highland, and Amazonian regions [48], and they have endured not only in spite of, but largely as a reaction to, modern capitalist economies [49]. Although the social economy has not received much attention for its potential to support farmers’ nutritional health, it may hold several relevant linkages. For example, Andean farmers utilize the social economy to exchange foods from distinct eco-zones, to support each other in times of need, and to exchange seeds, which can be sown to generate production diversity [40,47,50].

1.3. Study Aims and Overview

A first objective of this study was to assess the nutritional contribution of foods obtained from market purchase, own production, and the social economy. We used dietary recall data with information on the acquisition source of each ingredient consumed to evaluate the types of foods consumed from each source and the contributions to measures of nutrient adequacy (i.e., meeting key nutrient needs) and dietary moderation (i.e., avoiding harmful excesses). We further compared the micronutrient density and caloric density of the three food acquisition sources. A second objective was to explore the influence of the local agroecology movement on farmers’ food acquisition practices. To these ends, our study compared the food acquisition practices of female smallholder farmers from two groups: (i) farmers that participate in agroecological associations (hereafter, “agroecological farmers”); and (ii) neighbors of the first group who have never participated in agroecological associations (hereafter, “reference farmers”).

2. Methods

2.1. Setting and Study Population

This study was conducted with women smallholder farmers in Imbabura province. Participants lived at altitudes between 1550 and 3570 m above sea level, spanning a range of ecosystems and agricultural zones from hot, humid subtropical valleys to the wet montane páramo ecosystem. Across the study region, rainfall patterns permit most farmers to grow a diversity of crops with little or no irrigation [51]. Imbabura has the third largest Indigenous population of Ecuador’s 24 provinces, most of whom identify as Kichwa and live in rural areas [9,52]. Rural poverty in Imbabura is estimated at 54% [53], with the highest poverty rates found among Indigenous people [9]. Rural highland diets are predominated by grains and tubers and by a nutrition transition that is increasing the intake of simple sugars, sodium, edible oils, and processed and ultra-processed foods [10,54].

2.2. Study Design and Instruments

Data were derived from a survey applied to 90 smallholder women farmers in 2017. Only women were surveyed because of their predominant cultural role in household food procurement and preparation [55], and given previous studies suggesting that intrahousehold food distribution in rural highland Ecuador is not affected inequitably by gender disparities [56,57]. This study population was comprised of 60 agroecological farmers, who were selected at random from the rosters of agroecological associations, and 30 reference farmers, who were the randomly selected neighbors of the agroecological farmers. The survey included an open, quantitative 24-h dietary recall instrument [58], as well as modules to collect socioeconomic and production data. Full details of this study’s conceptualization of agroecological and reference farmers, sampling methods, survey development, 24-h recall instrument, and data collection protocols are described in Deaconu et al. [44].

2.3. Sociodemographic and Production Variables

The sociodemographic variables in this study included age, monthly income per capita (in USD, the official currency of Ecuador), time to market (in the participant’s usual transport), household size, household livelihood sources, and education completed by the respondent. We used monthly income per capita to establish household poverty levels, based on the 2014 income-based poverty line [53]. For household livelihood sources, agroecological market sales were excluded because our sampling strategy stipulated that all agroecological farmers sold in these markets, whereas no reference farmers did. Participants also reported their monthly food expenditures. Production variables included production diversity, access to irrigation, and land surface in agricultural use. Production diversity was a species richness measure of crops and animals used for food. Land surface was a measure of land utilized, not land possessed, and could include land that was rented or borrowed. These variables are further described in Deaconu et al. [44].

2.4. Food Acquisition Variables

The survey’s 24-h recall instrument collected the quantities of all foods and beverages consumed, and for each item, it queried on the source of food acquisition. Enumerators then coded responses according to the following categories: own production, wild harvest, direct purchase from other farmer, barter with other farmer, purchase from an alternative food network (e.g., farmers’ market), barter within an alternative food network, gifting economy, purchase from a conventional market (wet markets, supermarkets, corner stores, ambulatory salesmen, grocers, and all other points of sale). For meals that were not prepared at home, respondents listed the main ingredients that they could identify in the meal and all the products in the meal were categorized in their most appropriate category. Meals that were eaten at a neighbor’s house were categorized as gifted; meals that were purchased from a restaurant were categorized as purchased from a conventional market.
Food acquisition sources were then re-coded into three categories: (i) conventional markets; (ii) own harvest, including both own production and wild harvest; and (iii) social economy, including direct purchases from other farmers, barter with other farmers, purchases or barter from an alternative food network, and the gifting economy. Decisions on food source categorization were based on our exploratory qualitative research in the region, which involved ethnographic observation and key informant interviews [40]. This informed two decisions: (i) since farmers’ management of wild foods often meant that the line was blurred between their own production and wild harvest, these were grouped into “own harvest”; and (ii) all forms of direct monetary and non-monetary exchange between farmers, including that which occurs within alternative food networks, were grouped together because there was frequently no clear distinction between these types of exchange.

2.5. Nutrient Contributions of Food Acquisition Sources

We obtained calorie and other nutrient contents of each food item consumed in 24-h recalls using the United States Department of Agriculture nutrient database [59] as well as the Ecuadorian nutrient database for local foods that were not available in the former [60]. Doing so permitted us to understand the relative intake of foods from the three food acquisition sources, which we assessed as the proportion of total caloric energy obtained from each. Further, we assessed the contribution of each source to five other macronutrients (proteins, carbohydrates, fats, saturated fats, and fiber) and nine micronutrients (vitamin A, vitamin C, calcium, iron, zinc, thiamin, riboflavin, niacin, and folate).

2.6. Dietary Variables

Given the double burden of malnutrition in our study region, we are interested in measures of both nutrient adequacy and dietary moderation. To assess nutrient adequacy, we utilized the 24-h recall data to apply both a food variety score (FVS) and a dietary diversity score (DDS). FVS counts individual foods eaten, whereas DDS separates foods into food groups [61]. Our DDS followed the 10 food group protocol established by the minimum dietary diversity for women score (where the 10 food groups are: grains, white roots and tubers, and plantains; legumes; nuts and seeds; dairy; eggs; meat; dark green leafy vegetables; other vitamin A-rich fruits and vegetables; other vegetables; other fruits.) [62]. Both FVS and DDS have been associated with numerous nutritional status indicators, including energy and micronutrient adequacy, across multiple country contexts [25]. We applied both because the relative strength of each as an indicator of nutrient adequacy varies according to context [25,61].
Unfortunately, validated dietary indexes assessing moderation in low- and middle-income countries are largely lacking [63]. We evaluated dietary moderation by assessing processed food consumption following an Ecuadorian protocol [64] for applying the NOVA food classification system [26]. NOVA assesses the level of food processing in the diet by comparing the percentage of calories obtained from four food categories: (i) unprocessed or minimally processed foods, (ii) processed culinary ingredients such as oils and sugar, (iii) processed foods, and (iv) ultra-processed foods [26]. This classification system has successfully predicted overweight and diet-related chronic diseases in Latin American contexts [65]. Consuming foods from the first NOVA category is consistent with recommendations for healthy diets, whereas consuming an excess of foods from the remaining categories, and particularly the fourth, can lead to harmful nutrient imbalances [66]. In rural Ecuador, the most widespread manifestation of the nutrition transition up to this point appears to be in its propagation of culinary ingredients such as sugar and edible oils [10,54], making the second NOVA category particularly informative.

2.7. Analysis Approach

We conducted bivariate analyses using SAS Software, version 9.4 (SAS Institute Inc, Cary, North Carolina, USA) to compare agroecological and reference farmers’ performance on sociodemographic and production variables, as well as on caloric intake from distinct food acquisition sources. To explore how the three food acquisition sources contributed to distinct DDS food groups, we generated line graphs representing pattern profiles; for each source, these profiles illustrated the proportion of farmers that had consumed a food item pertaining to a given food group. We then evaluated the relative nutrient contributions of the three food acquisition sources by assessing each source’s mean contribution to farmers’ daily intake of distinct nutrients, stratified by farmer group. That is, the mean contributions of conventional markets, farmers’ own harvest, and the social economy to a farmer group’s intake of a given nutrient were expressed as percentages X, Y, and Z, respectively, which add up to 100% of daily intake for that nutrient. Using this information, we then evaluated the relative nutrient density of each food acquisition source. For this analysis, we divided each source’s contribution to a given nutrient by its contribution to caloric energy. Values over 1 were considered relatively nutrient-rich and those under 1 were considered relatively calorie-rich. For example, a hypothetical source contributing to 40% of the mean daily iron intake and 30% of the caloric energy intake would produce an iron density of 1.33, meaning that it was relatively iron-rich. Finally, we assessed correlations between the three food acquisition sources and other study variables. Correlations producing r-values near or above 0.5 were considered strong, those with values near or above 0.3 were considered moderate, and the remainder were considered weak [67].

3. Results

3.1. Socioeconomic and Production Variables

Table 1 provides a sample description as well as a comparison of women agroecological and reference farmers on sociodemographic, land, and production variables. The two groups were largely similar on sociodemographic variables, and poverty emerged as a pressing concern in the study population. Agricultural income contributed to the livelihoods of both farmer groups, although the majority also had non-agricultural livelihood sources. Production diversity was high among the study population (pooled mean = 39). Agroecological farmers had significantly greater production diversity and utilized more land for productive purposes.

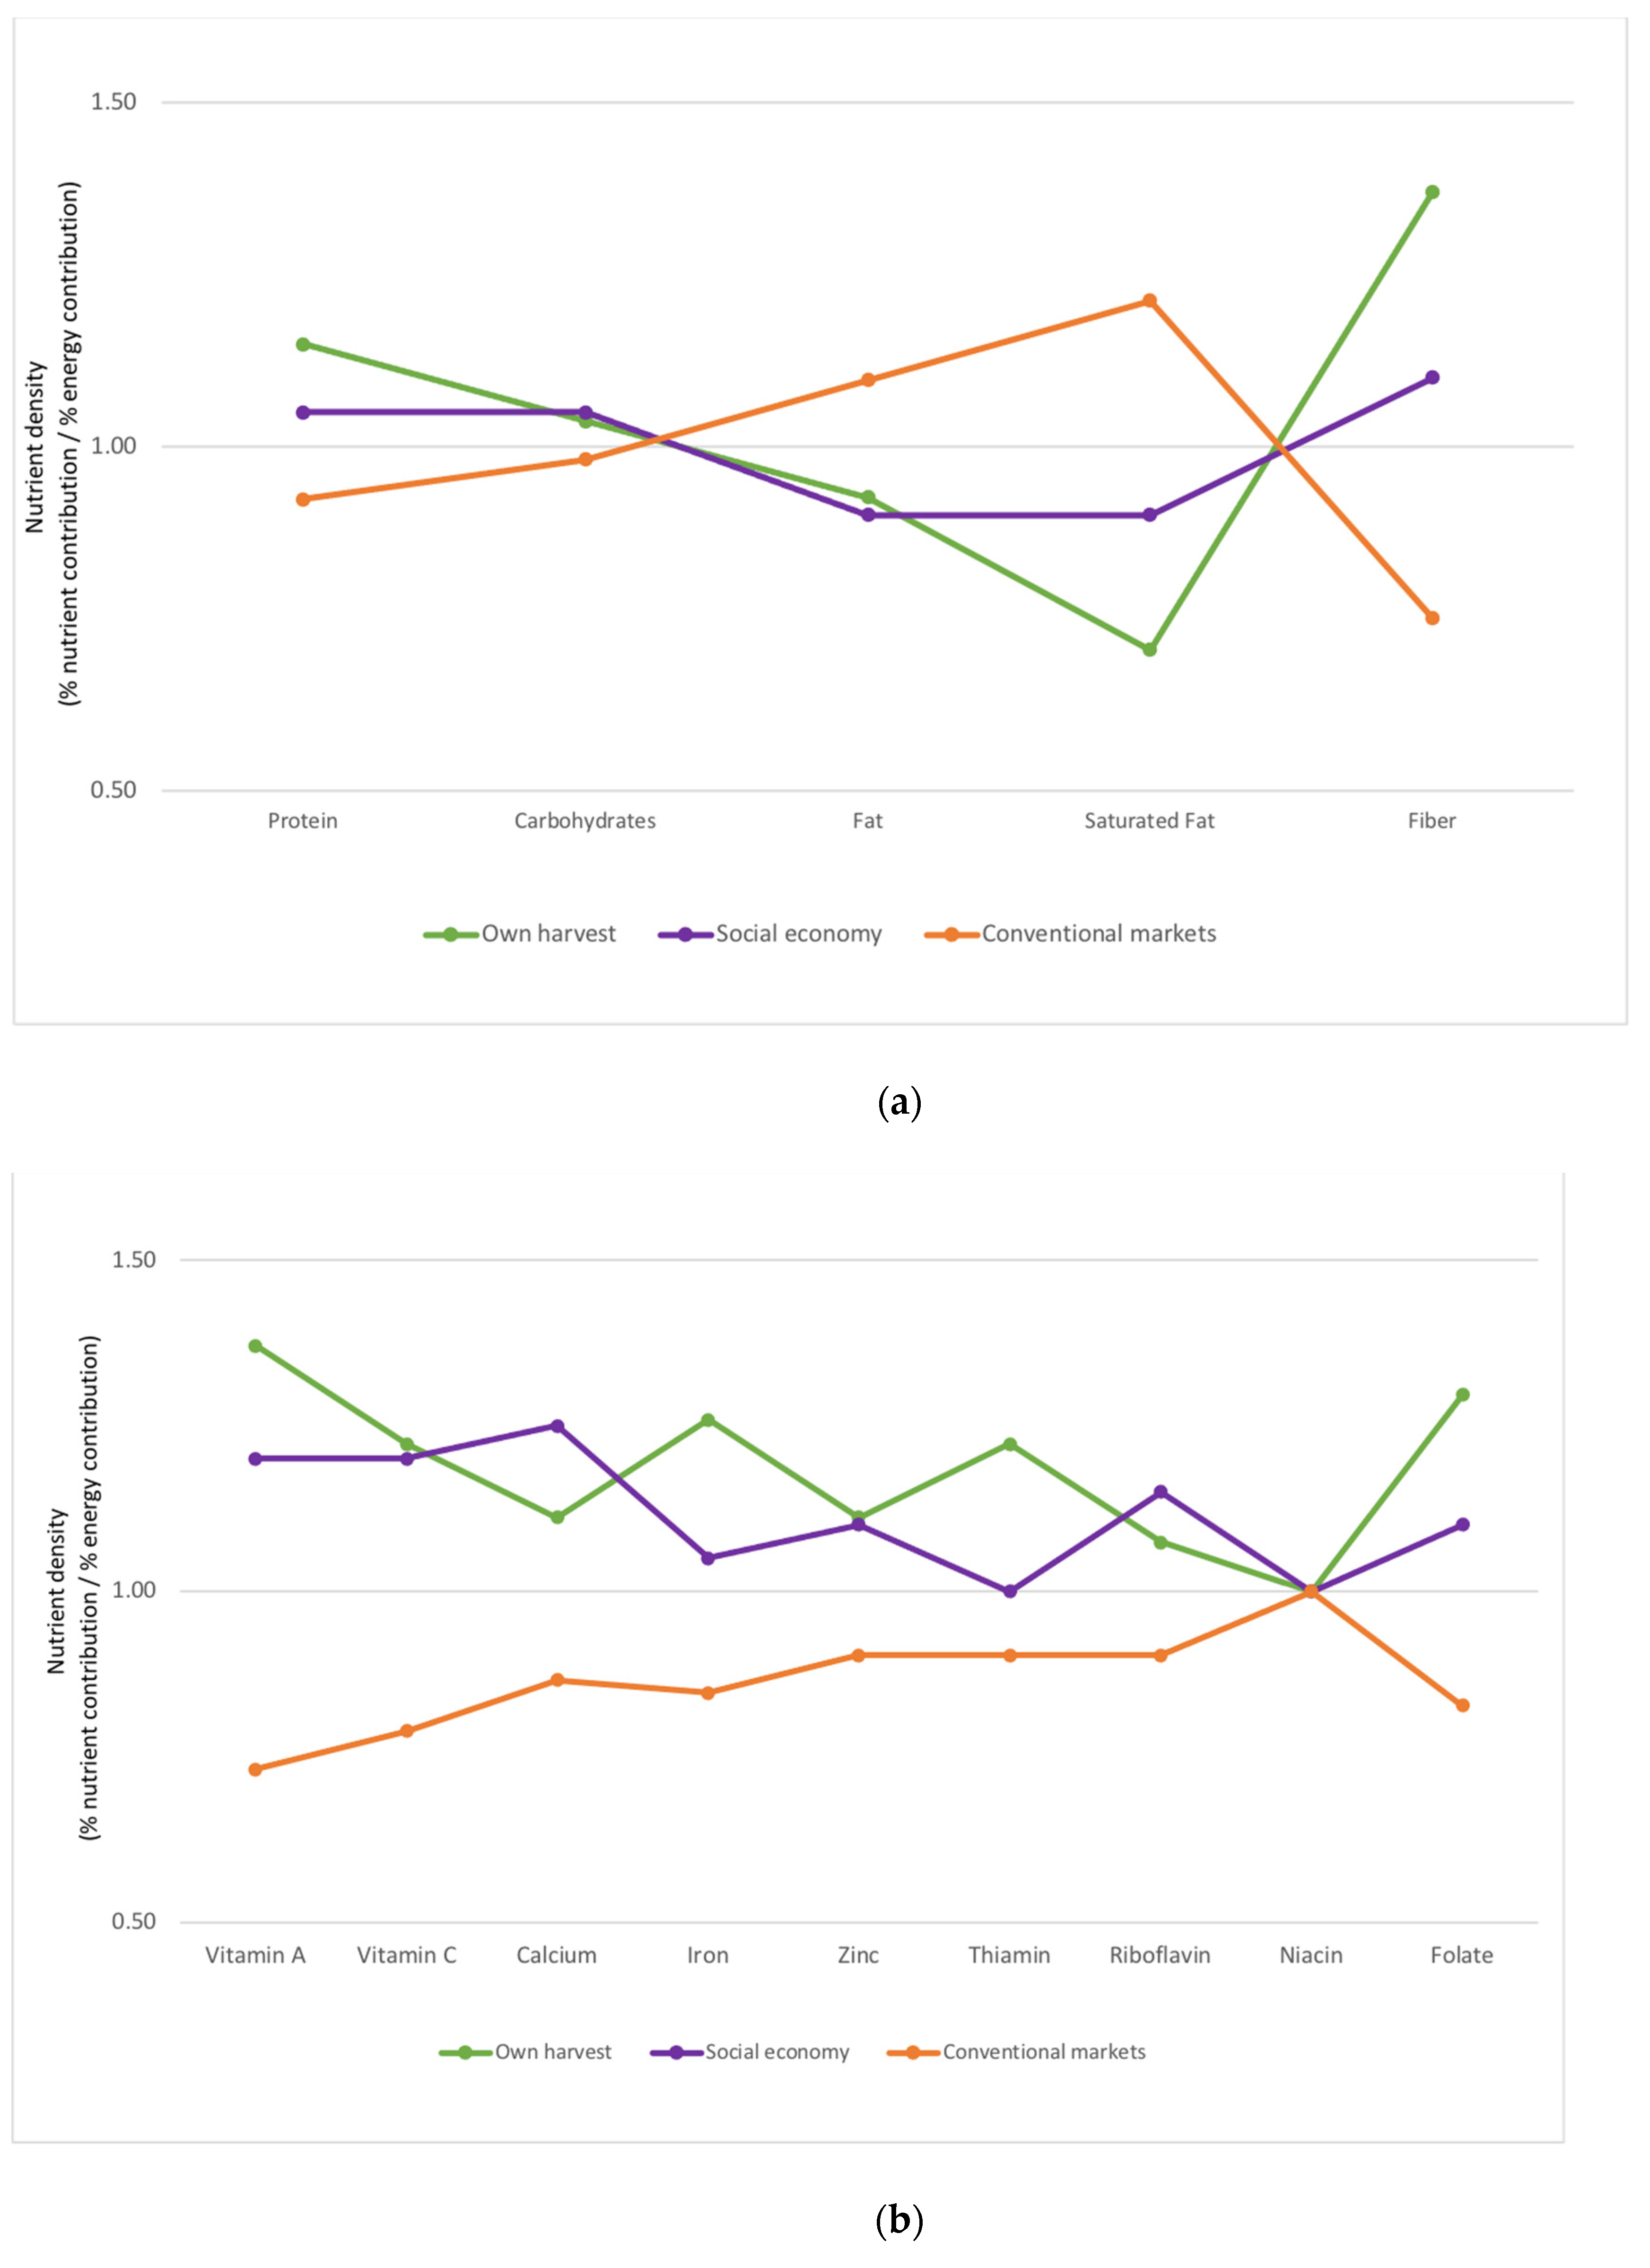
3.2. Food Acquisition Sources and Their Nutrient Contributions

Farmers obtained different types of foods from a diversity of food acquisition sources, often relying on multiple sources for the same food group. Figure 1a,b,c show the proportions of agroecological and reference farmers who consumed items of each food group from conventional markets, their own harvest, and the social economy, respectively. Conventional markets stood out as a ubiquitous source of starchy staples (grains, white roots and tubers, and plantains) (Figure 1a), although these were also frequently obtained from their own harvest (Figure 1b) and the social economy (Figure 1c). Both conventional markets and farmers’ own harvest were important sources of vegetables and fruits for both farmer groups. Differences appeared between agroecological farmers and reference farmers with respect to their acquisition sources of distinct food groups. Compared to reference farmers, agroecological farmers relied less on conventional markets and more on their own harvest for the majority of the food groups assessed. Further, among agroecological farmers, the social economy made relevant contributions to starchy staples, dairy, meat, vitamin A-rich fruits and vegetables, other vegetables, and other fruits. Among reference farmers, the social economy was much less important, primarily contributing to starchy staples and vegetables.
Figure 2 illustrates that, for both farmer groups, conventional markets presented the greatest energy source of the three food acquisition sources. The two farmer groups exhibited differences in their reliance on distinct food sources for dietary energy intake. Compared to reference farmers, agroecological farmers obtained a significantly greater proportion of their dietary energy from their own harvest (p = 0.005) and the social economy (p = 0.002), and a significantly smaller proportion from conventional markets (p = 0.000).
Table 2 shows the mean contributions made by the three food acquisition sources to distinct macronutrients and micronutrients, stratified by farmer group. When compared to contribution to dietary energy, each food source’s relative contribution to each nutrient followed similar trends between the two farmer groups. We thus assessed the pooled sample for subsequent analyses on nutrient density.
Figure 3a,b illustrate the macronutrient and micronutrient contributions of each food acquisition source in terms of nutrient density. On a per-calorie basis, conventional markets made disproportionately high contributions to fat and saturated fat, and low contributions to fiber, protein, and to most micronutrients. In contrast, foods from farmers’ own harvest made disproportionately low contributions to fat and saturated fat and high contributions to fiber, protein, and most micronutrients. Nutrient density contributions of the social economy generally followed the same trends as those of farmers’ own harvest, although they were generally less pronounced.

3.3. Sociodemographic, Productive, and Dietary Correlates of Distinct Food Acquisition Patterns

Table 3 shows the correlations between dietary intake (as the proportion of caloric energy) from the three food acquisition patterns and sociodemographic, production, and dietary variables. In the pooled sample, dietary intake from conventional markets was positively correlated with monthly income and food expenditures and negatively correlated with education, production diversity, and land surface in use. Correlations were moderate (r-value near or above 0.3) or weak (r-value below 0.3). Intake from own harvest consistently demonstrated correlations of similar strength, but in the opposite direction of those identified for conventional markets. With respect to dietary measures, intake from conventional markets was negatively correlated with the food variety score and with intake of foods in the NOVA 1 category (unprocessed and minimally processed foods). Instead, it was moderately positively correlated with consumption of foods from the NOVA 2 category (processed culinary ingredients). Again, intake from farmers’ own harvest predominantly presented correlations that were of similar strength, but the opposite direction, to those found for conventional markets. No significant correlations were identified with the social economy.
Identified correlations differed between the two farmer groups. For example, a higher monthly income was clearly identified to correlate with a higher dietary intake from conventional markets (r = 0.44) among reference farmers, but not among agroecological farmers. Moreover, most dietary correlates were only identified among agroecological farmers (n = 60) and the pooled sample (n = 90), for which sample sizes were substantially larger than for reference farmers (n = 30). However, the magnitude of correlation remained similar between the agroecological sample and pooled sample. For example, the correlation between consumption from markets and of foods from NOVA 2 (processed culinary ingredients) was similar in the agroecological (r = 0.29) and pooled sample (r = 0.32), indicating that the direction was likely similar among reference farmers, but the smaller sample size may have failed to detect it.

4. Discussion

In the interest of better understanding how agriculture can be mobilized to impact farmers’ nutritional health, this study turned to smallholder women farmers in Ecuador’s Imbabura highland province to evaluate the dietary contributions of foods obtained from three different sources: conventional markets, farmers’ own harvest, and the social economy. We further assessed how food acquisition differed between agroecological farmers (i.e., women farmers who are members of agroecological associations) and reference farmers (i.e., women farmers who are the neighbors of the first group, but are not involved with agroecology), with the intent of better understanding how sustainable agriculture initiatives may interact with farmers’ dietary practices.

4.1. Food Acquisition Sources and Dietary Health

Our findings shed light on how different food sources contribute to the nutrient intake and dietary health of farmers in this region. On balance, market foods consumed by study participants tended to be more calorie-dense than micronutrient-dense, and they made disproportionately high contributions to fat and saturated fat intake on a per-calorie basis. On the other hand, foods that were obtained from farmers’ own harvest tended to be more micronutrient-dense than they were calorie-dense, and they also made key contributions to dietary fiber. Meanwhile, foods obtained through the social economy (e.g., gifting, barter, or direct purchase from other farmers) tended to follow the same trends as those obtained from a farmer’s own harvest, although to a lesser degree; this is not surprising, as these are, for the most part, foods that are simply obtained through another farmer’s harvest.
These distinct nutrient contributions were reflected in dietary outcomes. Farmers with higher energy intake from markets tended to fare worse on indicators of both nutrient adequacy and of dietary moderation: they consumed a lower diversity of foods, obtained a smaller share of their daily energy from unprocessed and minimally processed foods (such as fruits and vegetables), and they obtained a greater share of their daily energy from processed culinary ingredients (such as sugar and oils). This resounds with the growing concerns implicating retail environments in promoting access to unhealthy foods [3,26], particularly in low- and middle-income settings [29,30,31]. Meanwhile, we found higher energy intake from farmers’ own harvest to be associated with both stronger nutrient adequacy and dietary moderation, aligning with previous research demonstrating that the consumption of foods from farmers’ own production remains an important resource for farmer health in many settings [17]. Although the relationship between food acquisition practices and dietary outcomes appeared for our pooled farmer sample, the correlation was significant among agroecological farmers, but not among reference farmers. As the magnitude of the correlation was similar across the agroecological sample and pooled sample, the direction of these relationships between food acquisition and dietary outcomes were likely similar for reference farmers, but not significant due to their smaller sample size.
Our findings also appear to be consistent with previous research in Ecuador. An early study from the Ecuadorian highlands found that families who consumed a greater share of foods from subsistence production had higher dietary adequacy [68]. In more recent studies in the highlands, greater reliance on market foods was associated with protein deficiencies and carbohydrate excesses [69], and markets were posited to supplant nutritious foods from the farm with less nutritious sugars, oils, refined grains, and sugar-sweetened beverages [70]. Studies with Indigenous people in the Ecuadorian Amazon found that greater subsistence orientation and lower market integration was associated with healthier outcomes among children in terms of both stunting and overweight prevalence [71], and that higher consumption of market foods was associated with higher cholesterol levels among adults [72]. Despite pronounced cultural, economic, and ecological differences across the rural sectors of Ecuador’s biogeographic regions [8], it appears that foods from farmers’ own harvest are consistently healthier than those purchased from markets.

4.2. Social Economy

Although the social economy made the least important contribution to dietary intake of the three food acquisition pathways assessed, it nevertheless contributed close to a quarter of agroecological farmers’ energy intake, and for reference farmers, it was nearly as important as their own harvest. The social economy can be effective for obtaining products that are not available on one’s own farm, but are otherwise available locally [47], as well as for filling dietary and other resource gaps during times of difficulty, as was evidenced during market disturbances related to the Covid-19 pandemic [50]. The social economy is largely distinguished from other food acquisition strategies because of its reliance on social capital [48,49], a resource that is constructed through the norms, relationships, and interactions in a network, and is particularly important in farming communities [73]. Numerous studies have illustrated how social capital can beget other forms of capital, including by providing access to resources and lowering transaction costs [73]. Through the social economy, farmers may mobilize social capital to bridge other resource gaps (e.g., money, livestock, productive land) that may limit their ability to obtain certain foods. This may be a particularly important means to supplement food acquisition for farmers who otherwise lack sufficient resources to engage in equal financial or material transactions (i.e., paying the full cost for food, or exchanging foods of equal monetary value).
The social economy has been documented for its relevance as a traditional source of food not only in the rural Andes [47,48], but also among other farming communities [74,75,76]. Nevertheless, it has not received explicit attention in predominant agriculture-nutrition linkage frameworks [44]. Even so, the connection is tenable, as farmers can mobilize the social economy both for productive resources (e.g., seeds) as well as directly for foods, both of which can contribute to their dietary health. We sustain that the Ecuadorian agroecology movement clearly illustrates the role of the social economy in agriculture-nutrition pathways. Although the movement is rooted in specific agricultural practices, it has evolved to transcend agriculture per-se, and to also create norms around the importance of engaging in barter, gifting, and direct purchase of seeds and foods with other farmers [40,44]. As our data show, the social economy contributed to agroecological farmers’ privileged access to a wide variety of food groups, including dairy, meat, vitamin A-rich fruits and vegetables, and other fruits and vegetables, and provided a quarter of their daily caloric intake. Some caution is warranted, as foods obtained through the social economy are not guaranteed to be healthy. For example, in the Ecuadorian highlands, processed foods, such as soft drinks and sweets, play an increasing role in norms around gifting and sharing, especially in celebratory contexts [77]. However, we found the foods obtained through the social economy to be overall more micronutrient-dense than calorie-dense, suggesting that this is a promising local pathway for supporting nutritional health.

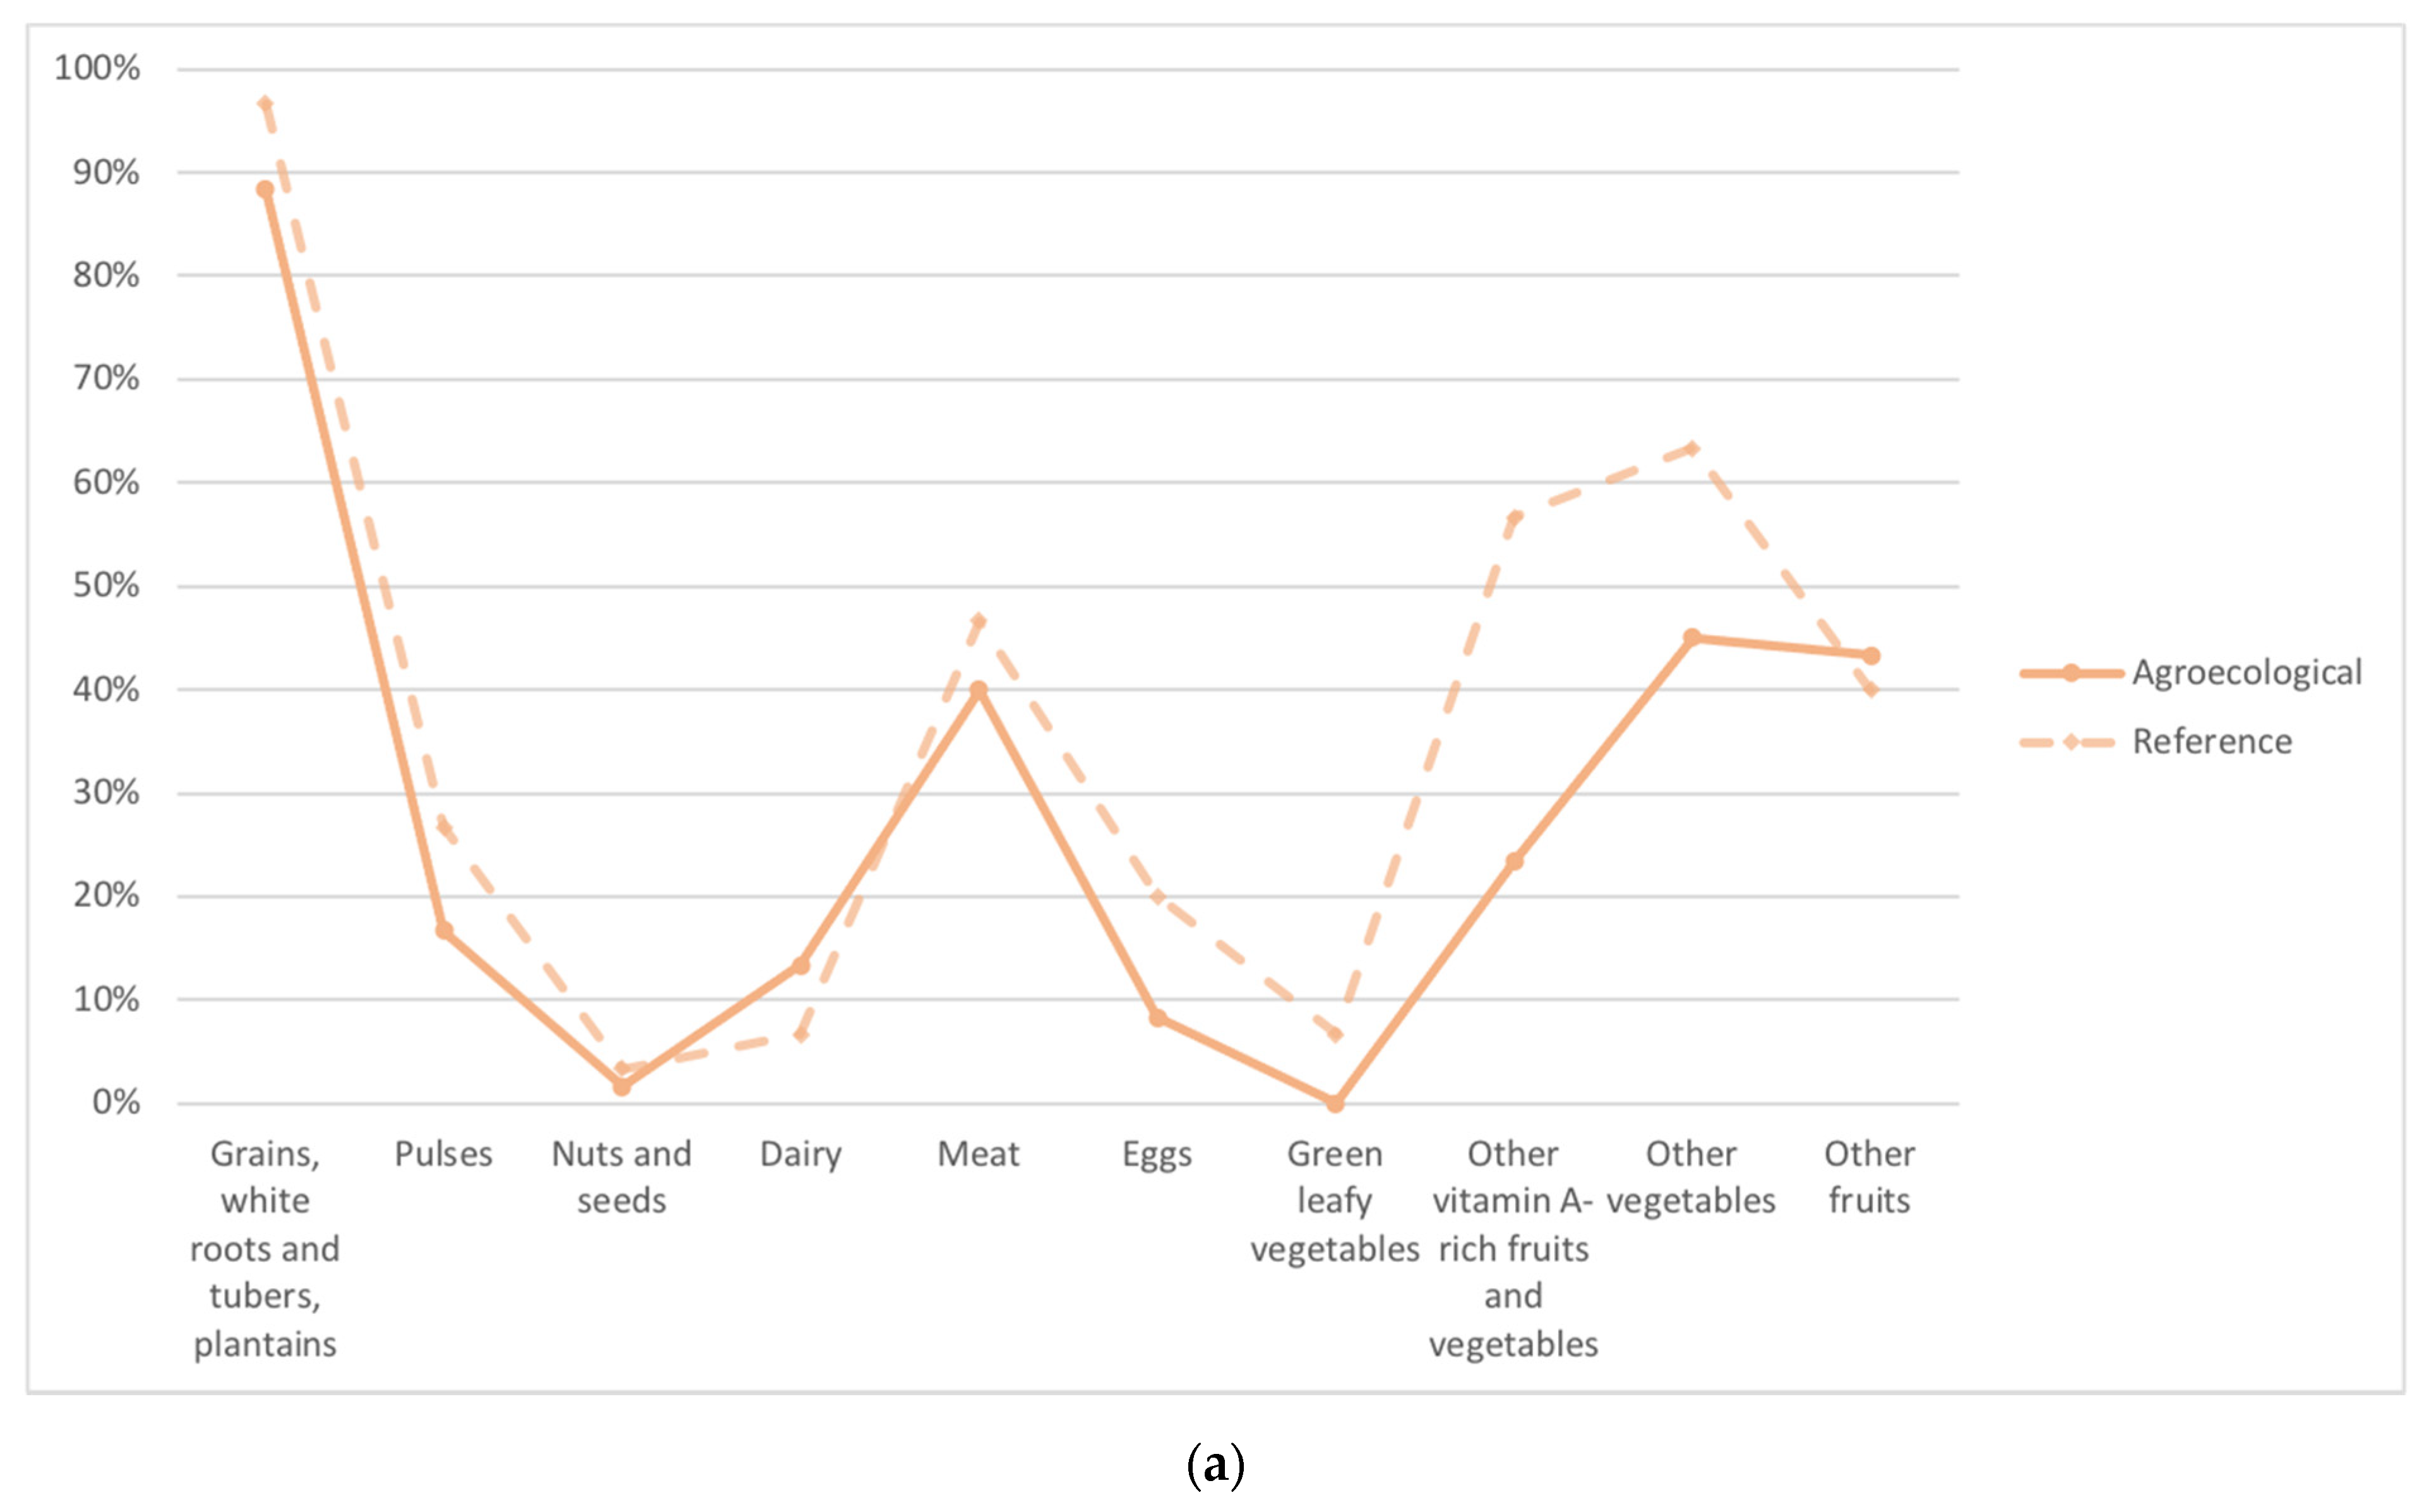
4.3. Food Acquisition among Agroecological and Reference Farmers

The different approaches to food acquisition among agroecological and reference farmers in our study may provide key lessons on how to support health-promoting practices. In general, agroecological farmers obtained a greater share of their energy intake from their own harvest and the social economy than did their reference neighbors, who instead relied more heavily on conventional markets. Moreover, the acquisition of distinct food groups varied between the two farmer groups. For example, famers’ own harvest and the social economy were much more important sources of fruits and vegetables for agroecological farmers than for reference farmers, who instead were more likely to purchase fruits and vegetables from markets. Additionally, agroecological farmers obtained animal source foods from all three food acquisition sources, while the vast majority of reference farmers exclusively obtained them through conventional market purchase. Previous studies have linked key protein and micronutrient deficiencies in the Ecuadorian rural highlands to a low intake of animal source foods [57,78]. A national nutrition study also identified important deficiencies in vitamin A, iron, zinc, and calcium, which are primarily present in animal source foods, as well as in fiber and vitamin C, which are primarily present in fruits and vegetables [10]. By maintaining diversified food acquisition strategies that include farmers’ own harvest and the social economy, agroecological farmers may have superior access to critical food groups and nutrients.
These findings are not surprising in light of our previous research showing that social norms developed in Imbabura’s agroecological farmers’ associations promote consumption from farmers’ own harvest as well as from the social economy [40,44], and that agroecological farmers take advantage of a higher production diversity—which is a central practice in agroecological farming [35,79]—in order to support dietary diversity [44]. Specifically, our previous analyses found that agroecological farmers achieved a mean dietary diversity score (DDS) of 5.9 food groups (out of a maximum of 10) and a mean food variety score (FVS) of 20 food items; this was significantly larger than the mean DDS and FVS among reference farmers, which were 4.8 and 17, respectively [44]. Agroecological farmers’ privileged access to animal source foods may also be a result of agroecology’s emphasis on the integration of livestock, which is raised not only as a source of food, but also to support soil fertility [35,79]. These connections between ecologically restorative farming practices and farmers’ food acquisition underline how agroecology may simultaneously serve as an environmentally-sustainable and as a nutrition-sensitive agricultural paradigm.
The socioeconomic correlates of distinct food acquisition practices also revealed a curious difference in how the two farmer groups mobilized income in their food practices. Among reference farmers, higher incomes were strongly associated with consumption from conventional market purchases. This was not observed among agroecological farmers, despite a larger sample size that would otherwise make detecting correlations easier. Interventions to increase incomes have been frequently proposed and implemented as a means to support farmers’ dietary health [80,81], albeit to varying degrees of success [80]. However, among reference farmers in our study, who are presumably more representative of farmers in the region than are the agroecological farmers, higher incomes seemed to support food acquisition patterns that undermine, rather than support, dietary health. The fact that this was not the case for agroecological farmers is compelling, especially because their low-income levels were comparable to those of the reference farmers and market purchases also made the largest relative contribution to their caloric intake. Possibly, the knowledge around food, nutrition, and agriculture developed in agroecological associations [40,44] may be intervening to determine how incomes are used. If this is the case, it would be valuable to better understand how the knowledge that is spread among farmers participating in agroecology could be scaled outward.

4.4. Relevance for Agriculture-Nutrition Pathways

Pathways between agriculture and nutrition have been observed to operate differently in distinct contexts [17,80]. Because there is no one-size-fits-all approach, it is necessary to have a contextual understanding of how agriculture can impact nutrition in order to leverage promising pathways. Our data suggest that, for farmers in the Ecuadorian highlands, it is more appropriate to support dietary health through the consumption of farmers’ own production rather than through income generation for food purchases. The foods that the farmers in our study population obtained from their own harvest were nutrient-rich, and farmers who consumed a greater share of their dietary energy from this source performed better on indicators of nutrient adequacy and moderation.
Previous research in the Ecuadorian highlands [44,70,82] points to a role for production diversity in supporting this outcome. Indeed, our data show that farmers who relied more strongly on their own harvest also had higher production diversity, although the relationship was not strong. This is consistent with numerous studies showing that production diversity can support farmers’ nutrient adequacy when they consume the foods that they produce [17]. However, the low magnitude of the correlation that we detected, and that has otherwise been detected in Ecuadorian studies [70,82], calls into question whether this relationship is being measured and analyzed appropriately. This issue has received increased attention [17,83], with multiple explanations available for the dissonance between the relationships that farmers perceive between production diversity and dietary diversity, and that which is quantitatively measured [44]. Regardless of the precise role of production diversity, what remains clear in our data is that the consumption of foods from farmers’ own harvest is associated with healthier dietary habits.
Regarding income generation for market food purchases, our findings corroborate concerns that markets can promote access to the calorie-dense, micronutrient-poor foods that characterize the nutrition transition and drive the increase in overweight and obesity prevalence in low-income settings [3,29,30,31,70]. Even so, many studies support the role of markets in providing access to dietary diversity and in reducing acute and chronic malnutrition [18,22,29]. As a result, some scholars have proposed that markets are in need of a healthier equilibrium between their simultaneous potentials to strengthen and to undermine dietary health [29]. However, in our study context, farmers who relied more strongly on market foods performed worse on both dietary moderation and nutrient adequacy assessments, suggesting that the potential of markets to make positive contributions to health in this particular food environment is severely compromised. This recalls the concerns voiced by Herforth and Ahmed, who proposed that the agriculture-nutrition evidence base needs to lend more attention to the role of market food environments, and that better tools for assessing food environments in rural, low-income settings can enable a stronger understanding for how to support nutritional health [24].
Conventional markets nevertheless represented the greatest source of food intake for our study population, in terms of both energy intake and the consumption of distinct food groups, and they were particularly important for accessing animal source foods. It would therefore be imprudent to attempt to ignore the role of markets. Instead, local programs and policies would be wise to support nutrition-sensitive markets alongside nutrition-sensitive agriculture approaches. In Afghanistan, for example, well-functioning markets with a strong diversity of healthy foods made important contributions to rural people’s nutritional health [18]. However, until we have a greater understanding of how Ecuadorian farmers can utilize markets to their nutritional advantage, our data suggest that income generation for market purchases is unlikely to achieve positive dietary effects, whereas foods from farmers’ own harvest deserve greater protagonism.
Agroecological farmers in the Ecuadorian highlands provide a unique example of how a farmers’ agriculture movement, rather than a top-down intervention, can influence food acquisition practices [44], and our data further show that their food acquisition practices are more likely to result in healthy diets. It is recognized that norms and knowledge around food and nutrition are important for agriculture initiatives to have meaningful nutritional impacts [15], and agroecology may be well-positioned to curate and facilitate the spread of these norms. Agroecology’s orientation around sustainable agriculture, rooted largely in traditional practices [35], may also mean that pathways to human health can simultaneously support environmental health through culturally-appropriate means, thereby acting as a much-needed interdisciplinary resource for tackling the global syndemic of undernutrition, obesity and climate change [36].

4.5. Methodological Reflections

Like most dietary research in low- and middle-income countries [84], this study relied on 24-h recall. While this instrument has numerous practical advantages [84], it also has several recognized limitations, including a tendency to underestimate energy intake and overestimate micronutrient intake [85], as well as an inability to capture intraindividual variation when a single recall is deployed [86]. Our study also had a relatively small sample size, which undoubtedly affected our ability to assess certain relationships between variables. Among reference farmers in particular, where the sample size was only 30, we were unable to detect certain statistically significant correlations that otherwise appeared for both the agroecological (n = 60) and pooled sample (n = 90). We thus inferred the likely relationships within the reference farmer group by comparing the difference in the magnitude of correlations between the agroecological and pooled samples, though this practice runs the risk of producing spurious correlations [87].
These limitations notwithstanding, we found that our assessment of food acquisition practices by querying for the source of each item in 24-h recalls provided a useful means of measuring how farmers obtain distinct foods and nutrients. This differed from the approaches observed in many other studies, such as those reviewed by Jones [17], that primarily rely on more distant proxies (e.g., market distance, cash crop production, self-reported reliance) to infer the pathways by which farmers acquire their foods. Additionally, we believe our attention to nutrient-density—calculated as a ratio between a food source’s relative contribution to key nutrients and its relative contribution to caloric energy—is well-suited for better understanding how different food acquisition sources contribute to nutritional health in the context of the double burden of malnutrition, particularly given the complexity of interactions between food environments and diets [28]. Despite a breadth of research on farmer nutritional health, we have not identified previous studies that have measured how all three food acquisition sources assessed (market foods, farmers’ own production, and the social economy) contribute to nutrient density. Finally, we echo the words of others [7] who encourage future studies concerning rural populations in low- and middle-income settings to consider not only measures of nutrient adequacy, but also of moderation. While we found the NOVA classification scheme to be suitable for assessing dietary moderation in our context, we are aware that new indexes are currently being developed that may be even more appropriate.

5. Conclusions

Several salient points emerged from our study on food acquisition and dietary health among smallholder women farmers in the Ecuadorian highlands. First, we found that foods obtained from farmers’ own harvest and the social economy tended to be micronutrient-dense, whereas those purchased in conventional markets tended to be more calorie-dense and micronutrient-poor. Similarly, farmers who obtained a greater proportion of their caloric intake from their own harvest tended to perform better on indicators of both nutrient adequacy and dietary moderation, whereas those who relied more heavily on conventional markets tended to perform worse on both. This finding supports the notion that, in this particular food environment, farmers’ consumption of foods from their own production is likely a more effective means for agriculture to support dietary health. In contrast, increasing agricultural income for food purchases may inadvertently undermine both nutrient adequacy and moderation. We further identified the social economy as a traditional food acquisition source that remains relevant in this sociocultural context, and that has an underexplored potential to contribute to farmers’ dietary health. Our evidence from Ecuador’s agroecological farmers indicates that this movement toward sustainable farming practices may also be an existing means to support healthy food acquisition practices. In doing so, it can contribute to the much needed systemic transformation of the food system, which holds the formidable duty to simultaneously support human and environmental health in both agricultural production and in the food environment [7,24,36,37].

Author Contributions

Conceptualization, A.D., M.B., and P.R.B.; methodology, A.D., M.B., P.R.B., and D.C.C.; software, A.D.; formal analysis, A.D.; investigation, A.D.; resources, M.B.; data curation, A.D.; writing—original draft preparation, A.D.; writing—review and editing, M.B., P.R.B., D.C.C., and G.M.; visualization, A.D.; supervision, M.B. and G.M.; project administration, M.B.; funding acquisition, M.B., P.R.B., and D.C.C. All authors have read and agreed to the published version of the manuscript.

Funding

This research was funded by Ekomer Research Consortium under grants from the International Development Research Centre, Ottawa, Canada, grant numbers CR-48490 and 109101-001, as well as the Canadian Institutes of Health Research, grant number HA1-164002. The views expressed herein do not necessarily represent those of the IDRC or its Board of Governors. A.D. received support from the Fonds de Recherche du Québec en Santé, grant number 262314, from the Université de Montréal Faculty of Medicine, as well as the Quebec Population Health Research Network. M.B. is supported by the Canada Research Chair program. The APC was funded by the Canadian Institutes of Health Research, grant number 109101-001.

Institutional Review Board Statement

The study was conducted according to the guidelines of the Declaration of Helsinki, and approved by the Health Research Ethics Committee of the Université de Montréal in Canada (certificate number 17–053-CERES-P, approved on 2 May 2017) and by the Institutional Review Board of the Universidad San Francisco de Quito in Ecuador (certificate number 2016-118E, on 12 May 2017).

Informed Consent Statement

Informed consent was obtained from all subjects involved in the study.

Data Availability Statement

The datasets analyzed during the current study are available from the corresponding author on reasonable request.

Acknowledgments

The authors sincerely thank the study participants for their time, knowledge, and interest in this research, and Leonardo Velasco for his diligent support in data collection. We further thank the EkoRural Foundation and the Ekomer research team, whose members include: Stephen Sherwood, Myriam Paredes, Sara Latorre, Bana Salameh, Kate Zinszer, Fabián Muñoz, Pablo López, Ross Borja, Pedro Oyarzún, Gabriel April-Lalonde, Marcelo Aizaga, and Eliana Estrella.

Conflicts of Interest

The authors declare no conflict of interest.

References

  1. The State of Food and Agriculture: Innovation in Family Farming; Food and Agriculture Organization of the United Nations (FAO): Rome, Italy, 2014; ISBN 978-92-5-108536-3.
  2. The State of Food Insecurity in the World 2015: Meeting the 2015 International Hunger Targets: Taking Stock of Uneven Progress; Food and Agriculture Organization of the United Nations (FAO): Rome, Italy, 2015.
  3. Popkin, B.M.; Adair, L.S.; Ng, S.W. Global Nutrition Transition and the Pandemic of Obesity in Developing Countries. Nutr. Rev. 2012, 70, 3–21. [Google Scholar] [CrossRef] [Green Version]
  4. Ramirez-Zea, M.; Kroker-Lobos, M.F.; Close-Fernandez, R.; Kanter, R. The Double Burden of Malnutrition in Indigenous and Nonindigenous Guatemalan Populations. Am. J. Clin. Nutr. 2014, 100, 1644S–1651S. [Google Scholar] [CrossRef] [PubMed] [Green Version]
  5. Ramírez-Luzuriaga, M.J.; Belmont, P.; Waters, W.F.; Freire, W.B. Malnutrition Inequalities in Ecuador: Differences by Wealth, Education Level and Ethnicity. Public Health Nutr. 2020, 23, S59–S67. [Google Scholar] [CrossRef] [PubMed]
  6. FAO; IFAD; UNICEF; WFP; WHO. The State of Food Security and Nutrition in the World 2020: Transforming Food Systems for Affordable Healthy Diets; Food and Agriculture Organization of the United Nations: Rome, Italy, 2020; ISBN 978-92-5-132901-6. [Google Scholar]
  7. Herforth, A.; Johns, T.; Creed-Kanashiro, H.M.; Jones, A.D.; Khoury, C.K.; Lang, T.; Maundu, P.; Powell, B.; Reyes-García, V. Agrobiodiversity and Feeding the World: More of the Same Will Result in More of the Same. In Agrobiodiversity: Integrating Knowledge for a Sustainable Future; Zimmerer, K.S., De Haan, S., Eds.; The MIT Press: Cambridge, MA, USA, 2019; pp. 185–211. ISBN 0-262-03868-4. [Google Scholar]
  8. Molestina, R.C.; Villagómez Orosco, M.; Sili, M. Atlas Rural Del Ecuador, 1st ed.; Instituto Geográfico Militar del Ecuador: Quito, Ecuador, 2017; ISBN 978-9942-22-128-5. [Google Scholar]
  9. La Población Indígena Del Ecuador; Instituto Nacional de Estadística y Censos (INEC): Quito, Ecuador, 2006.
  10. Freire, W.B.; Ramírez, M.; Belmont, P. Tomo I: Encuesta Nacional de Salud y Nutrición de La Población Ecuatoriana de Cero a 59 Años, ENSANUT-ECU 2012. Rev. Latinoam. Políticas Acción Pública 2015, 2, 117. [Google Scholar]
  11. Lopez-Cevallos, D.F.; Chi, C. Health Care Utilization in Ecuador: A Multilevel Analysis of Socio-Economic Determinants and Inequality Issues. Health Policy Plan. 2010, 25, 209–218. [Google Scholar] [CrossRef] [PubMed] [Green Version]
  12. Haddad, L. A Conceptual Framework for Assessing Agriculture–Nutrition Linkages. Food Nutr. Bull. 2000, 21, 367–373. [Google Scholar] [CrossRef] [Green Version]
  13. Arimond, M.; Hawkes, C.; Ruel, M.; Sifri, Z.; Berti, P.R.; Leroy, J.L.; Low, J.W.; Brown, L.R.; Frongillo, E.A. Agricultural interventions and nutrition: Lessons from the past and new evidence. In Combating Micronutrient Deficiencies: Food-Based Approaches; Thompson, B., Amoroso, L., Eds.; Food and Agriculture Organization of the United Nations (FAO): Rome, Italy, 2011; pp. 41–75. [Google Scholar]
  14. Herforth, A.; Lidder, P.; Gill, M. Strengthening the Links between Nutrition and Health Outcomes and Agricultural Research. Food Secur. 2015, 7, 457–461. [Google Scholar] [CrossRef] [Green Version]
  15. Herforth, A.; Harris, J. Understanding and Applying Primary Pathways and Principles Brief#1; Improving nutrition through agriculture brief series; USAID/Strengthening Partnerships, Results, and Innovations in Nutrition Globally (SPRING) Project: Arlington, VA, USA, 2014. [Google Scholar]
  16. Frison, E.A.; Cherfas, J.; Hodgkin, T. Agricultural Biodiversity Is Essential for a Sustainable Improvement in Food and Nutrition Security. Sustainability 2011, 3, 238–253. [Google Scholar] [CrossRef] [Green Version]
  17. Jones, A.D. Critical Review of the Emerging Research Evidence on Agricultural Biodiversity, Diet Diversity, and Nutritional Status in Low- and Middle-Income Countries. Nutr. Rev. 2017, 75, 769–782. [Google Scholar] [CrossRef] [Green Version]
  18. Zanello, G.; Shankar, B.; Poole, N. Buy or Make? Agricultural Production Diversity, Markets and Dietary Diversity in Afghanistan. Food Policy 2019, 87, 101731. [Google Scholar] [CrossRef]
  19. Jones, A.D.; Creed-Kanashiro, H.; Zimmerer, K.S.; De Haan, S.; Carrasco, M.; Meza, K.; Cruz-Garcia, G.S.; Tello, M.; Plasencia Amaya, F.; Marin, R.M. Farm-Level Agricultural Biodiversity in the Peruvian Andes Is Associated with Greater Odds of Women Achieving a Minimally Diverse and Micronutrient Adequate Diet. J. Nutr. 2018, 148, 1625–1637. [Google Scholar] [CrossRef]
  20. Ecker, O. Agricultural Transformation and Food and Nutrition Security in Ghana: Does Farm Production Diversity (Still) Matter for Household Dietary Diversity? Food Policy 2018, 79, 271–282. [Google Scholar] [CrossRef]
  21. Sibhatu, K.T. Farm-Level Agricultural Biodiversity Is Not the Principal Contributor to Diverse and Micronutrient-Rich Diets, nor to Overall Food Consumption in Smallholder Farm Households. J. Nutr. 2019, 149, 1482–1483. [Google Scholar] [CrossRef] [PubMed]
  22. Sibhatu, K.T.; Qaim, M. Rural Food Security, Subsistence Agriculture, and Seasonality. PLoS ONE 2017, 12, e0186406. [Google Scholar] [CrossRef] [Green Version]
  23. Remans, R.; DeClerck, F.A.J.; Kennedy, G.; Fanzo, J. Expanding the View on the Production and Dietary Diversity Link: Scale, Function, and Change over Time. Proc. Natl. Acad. Sci. USA 2015, 112, E6082. [Google Scholar] [CrossRef] [Green Version]
  24. Herforth, A.; Ahmed, S. The Food Environment, Its Effects on Dietary Consumption, and Potential for Measurement within Agriculture-Nutrition Interventions. Food Secur. 2015, 7, 505–520. [Google Scholar] [CrossRef] [Green Version]
  25. Ruel, M.T. Operationalizing Dietary Diversity: A Review of Measurement Issues and Research Priorities. J. Nutr. 2003, 133, 3911S–3926S. [Google Scholar] [CrossRef]
  26. Monteiro, C.A.; Cannon, G.; Moubarac, J.-C.; Levy, R.B.; Louzada, M.L.C.; Jaime, P.C. The UN Decade of Nutrition, the NOVA Food Classification and the Trouble with Ultra-Processing. Public Health Nutr. 2018, 21, 5–17. [Google Scholar] [CrossRef] [PubMed] [Green Version]
  27. Cobb, L.K.; Appel, L.J.; Franco, M.; Jones-Smith, J.C.; Nur, A.; Anderson, C.A. The Relationship of the Local Food Environment with Obesity: A Systematic Review of Methods, Study Quality, and Results. Obesity 2015, 23, 1331–1344. [Google Scholar] [CrossRef] [PubMed] [Green Version]
  28. Lam, T.M.; Vaartjes, I.; Grobbee, D.E.; Karssenberg, D.; Lakerveld, J. Associations between the Built Environment and Obesity: An Umbrella Review. Int. J. Health Geogr. 2021, 20, 1–24. [Google Scholar] [CrossRef]
  29. Darrouzet-Nardi, A.F.; Masters, W.A. Urbanization, Market Development and Malnutrition in Farm Households: Evidence from the Demographic and Health Surveys, 1986–2011. Food Secur. 2015, 7, 521–533. [Google Scholar] [CrossRef] [Green Version]
  30. Demmler, K.M.; Klasen, S.; Nzuma, J.M.; Qaim, M. Supermarket Purchase Contributes to Nutrition-Related Non-Communicable Diseases in Urban Kenya. PLoS ONE 2017, 12, e0185148. [Google Scholar] [CrossRef] [PubMed] [Green Version]
  31. Otterbach, S.; Oskorouchi, H.R.; Rogan, M.; Qaim, M. Using Google Data to Measure the Role of Big Food and Fast Food in South Africa’s Obesity Epidemic. World Dev. 2021, 140, 105368. [Google Scholar] [CrossRef]
  32. de Jesus Silva, R.; Garavello, M.E.D.P.E.; Nardoto, G.B.; Mazzi, E.A.; Martinelli, L.A. Factors Influencing the Food Transition in Riverine Communities in the Brazilian Amazon. Environ. Dev. Sustain. 2017, 19, 1087–1102. [Google Scholar] [CrossRef]
  33. Popkin, B.M. Nutrition Transition and the Global Diabetes Epidemic. Curr. Diab. Rep. 2015, 15, 64. [Google Scholar] [CrossRef] [PubMed]
  34. HLPE Nutrition and Food Systems. A Report by the High Level Panel of Experts on Food Security and Nutrition of the Committee on World Food Security; Food and Agriculture Organization of the United Nations (FAO): Rome, Italy, 2017. [Google Scholar]
  35. High Level Panel of Experts on Food Security and Nutrition of the Committee on World Food Security (HLPE) Agroecological and Other Innovative Approaches for Sustainable Agriculture and Food Systems That Enhance Food Security and Nutrition; Committee on World Food Security: Rome, Italy, 2019; p. 163.
  36. Swinburn, B.A.; Kraak, V.I.; Allender, S.; Atkins, V.J.; Baker, P.I.; Bogard, J.R.; Brinsden, H.; Calvillo, A.; De Schutter, O.; Devarajan, R. The Global Syndemic of Obesity, Undernutrition, and Climate Change: The Lancet Commission Report. Lancet 2019, 393, 791–846. [Google Scholar] [CrossRef]
  37. Willett, W.; Rockström, J.; Loken, B.; Springmann, M.; Lang, T.; Vermeulen, S.; Garnett, T.; Tilman, D.; DeClerck, F.; Wood, A.; et al. Food in the Anthropocene: The EAT–Lancet Commission on Healthy Diets from Sustainable Food Systems. Lancet 2019, 393, 447–492. [Google Scholar] [CrossRef]
  38. Sherwood, S.; Arce, A.; Berti, P.R.; Borja, R.; Oyarzun, P.; Bekkering, E. Tackling the New Materialities: Modern Food and Counter-Movements in Ecuador. Food Policy 2013, 41, 1–10. [Google Scholar] [CrossRef]
  39. Intriago, R.; Gortaire Amézcua, R.; Bravo, E.; O’Connell, C. Agroecology in Ecuador: Historical Processes, Achievements, and Challenges. Agroecol. Sustain. Food Syst. 2017, 41, 311–328. [Google Scholar] [CrossRef]
  40. Deaconu, A.; Mercille, G.; Batal, M. The Agroecological Farmer’s Pathways from Agriculture to Nutrition: A Practice-Based Case from Ecuador’s Highlands. Ecol. Food Nutr. 2019, 58, 142–165. [Google Scholar] [CrossRef] [PubMed]
  41. Agroecology Is Here to Stay: Mapping Agroecological Farmers and the Status of Agroecology in Ecuador’s Highlands and Coastal Regions; Heifer Foundation-Ecuador: Quito, Ecuador, 2014.
  42. Wezel, A.; Bellon, S.; Doré, T.; Francis, C.; Vallod, D.; David, C. Agroecology as a Science, a Movement and a Practice. A Review. Agron. Sustain. Dev. 2009, 29, 503–515. [Google Scholar] [CrossRef] [Green Version]
  43. Sherwood, S.; Van Bommel, S.; Paredes, M. Self-Organization and the Bypass: Re-Imagining Institutions for More Sustainable Development in Agriculture and Food. Agriculture 2016, 6, 66. [Google Scholar] [CrossRef] [Green Version]
  44. Deaconu, A.; Berti, P.R.; Cole, D.C.; Mercille, G.; Batal, M. Agroecology and Nutritional Health: A Comparison of Agroecological Farmers and Their Neighbors in the Ecuadorian Highlands. Food Policy 2021. [Google Scholar] [CrossRef]
  45. Utting, P.; van Dijk, N.; Matheï, M.-A. Social and Solidarity Economy: Is There a New Economy in the Making? UNRISD Occasional Paper: Potential and Limits of Social and Solidarity Economy; United Nations Research Institute for Social Development (UNRISD): Geneva, Switzerland, 2014. [Google Scholar]
  46. Jiménez, J. Movimiento de Economía Social y Solidaria Del Ecuador: Circuitos Económicos Solidarios Interculturales. Rev. Sociol. 2014, 24, 123–140. [Google Scholar]
  47. Argumedo, A.; Pimbert, M. Bypassing Globalization: Barter Markets as a New Indigenous Economy in Peru. Development 2010, 53, 343–349. [Google Scholar] [CrossRef]
  48. Ferraro, E. Trueque: An Ethnographic Account of Barter, Trade and Money in Andean Ecuador. J. Lat. Am. Caribb. Anthropol. 2011, 16, 168–184. [Google Scholar] [CrossRef]
  49. Robelly Espinoza, A. Barter, Old Fashioned or a Modern Alternative? Master’s Thesis, Wageningen University, Wageningen, The Netherlands, 2019. [Google Scholar]
  50. Córdoba, D.; Peredo, A.M.; Chaves, P. Shaping Alternatives to Development: Solidarity and Reciprocity in the Andes during COVID-19. World Dev. 2021, 139, 105323. [Google Scholar] [CrossRef]
  51. 51. In Plan Provincial de Riego y Drenaje de Imbabura 2017—2037; Prefectura de Imbabura, Gobierno Autónomo Descentralizado de Imbabura: Imbabura, Ecuador, 2017.
  52. Fascículo Provincial Imbabura. Resultados Del Censo 2010; Instituto Nacional de Estadística y Censos (INEC): Quito, Ecuador, 2010. [Google Scholar]
  53. Reporte de Pobreza Por Consumo Ecuador 2006-2014; Instituto Nacional de Estadística y Censos (INEC): Quito, Ecuador, 2016.
  54. Gross, J.; Guerrón Montero, C.; Hammer, M.; Berti, P.R. Creating Healthy Bodies in Rural Ecuador at a Time of Dietary Shift. In Food, Agriculture and Social Change; Sherwood, S., Arce, A., Paredes, M., Eds.; Routledge: Oxfordshire, UK, 2017; pp. 34–47. ISBN 978-1-315-44008-8. [Google Scholar]
  55. Soto, M. Prácticas Alimentarias: Género y Globalización en Cuatro Comunidades de Saquisilí. Master’s Thesis, Facultad Latinoamericana de Ciencias Sociales sede Ecuador (FLACSO), Quito, Ecuador, 2014. [Google Scholar]
  56. Berti, P.R.; Leonard, W.R.; Berti, W.J. Malnutrition in Rural Highland Ecuador: The Importance of Intrahousehold Food Distribution, Diet Composition, and Nutrient Requirements. Food Nutr. Bull. 1997, 18, 1–11. [Google Scholar]
  57. Berti, P.R.; Krasevec, J.; Cole, D. Diet Inadequacies and Neurobehavioural Impairment in Rural Highland Ecuadoreans; HealthBridge: Ottawa, Canada, 2004; p. 23. [Google Scholar]
  58. Shim, J.-S.; Oh, K.; Kim, H.C. Dietary Assessment Methods in Epidemiologic Studies. Epidemiol. Health 2014, 36. [Google Scholar] [CrossRef]
  59. FoodData Central. USDA. Available online: Fdc.nal.usda.gov (accessed on 1 June 2020).
  60. Ramírez-Luzuriaga, M.J.; Silva-Jaramillo, M.; Belmont, P.; Freire, W. Tabla de Composición de Alimentos Del Ecuador: Compilación Del Equipo Técnico de La ENSANUT-ECU 2012; Ministerio de Salud Pública del Ecuador: Quito, Ecuador, 2014. [Google Scholar]
  61. Steyn, N.P.; Nel, J.H.; Nantel, G.; Kennedy, G.; Labadarios, D. Food Variety and Dietary Diversity Scores in Children: Are They Good Indicators of Dietary Adequacy? Public Health Nutr. 2006, 9, 644–650. [Google Scholar] [CrossRef] [Green Version]
  62. Minimum Dietary Diversity for Women: A Guide for Measurement; Food and Agriculture Organization of the United Nations (FAO): Rome, Italy, 2016.
  63. Trijsburg, L.; Talsma, E.F.; De Vries, J.H.; Kennedy, G.; Kuijsten, A.; Brouwer, I.D. Diet Quality Indices for Research in Low-and Middle-Income Countries: A Systematic Review. Nutr. Rev. 2019, 77, 515–540. [Google Scholar] [CrossRef]
  64. Freire, W.B.; Belmont Guerrón, P.; Jiménez, E.; Román, D.; Burgos, E. Lista de Alimentos, Preparaciones y Bebidas Que Se Consumen En Ecuador Según La Clasificación NOVA 2017; Universidad San Francisco de Quito USFQ, Escuela de Salud Pública, Instituto de Investigaciones de Salud y Nutrición: Quito, Ecuador, 2017. [Google Scholar]
  65. Moubarac, J.C. Ultra-Processed Food and Drink Products in Latin America: Trends, Impact on Obesity, Policy Implications; Pan American Health Organization: Washington, DC, USA, 2015. [Google Scholar]
  66. Healthy Diet Fact Sheet No. 394; World Health Organization (WHO): Geneva, Switzerland, 2018.
  67. Cohen, J. Statistical Power Analysis for the Behavioral Sciences; Routledge: Oxfordshire, UK, 2013; ISBN 1-134-74270-3. [Google Scholar]
  68. Leonard, W.R.; Dewalt, K.M.; Uquillas, J.E.; Dewalt, B.R. Ecological Correlates of Dietary Consumption and Nutritional Status in Highland and Coastal Ecuador. Ecol. Food Nutr. 1993, 31, 67–85. [Google Scholar] [CrossRef]
  69. Orozco, F.; Cole, D.C.; Muñoz, V.; Altamirano, A.; Wanigaratne, S.; Espinosa, P.; Muñoz, F. Relationships among Production Systems, Preschool Nutritional Status, and Pesticide-Related Toxicity in Seven Ecuadorian Communities: A Multi-Case Study Approach. Food Nutr. Bull. 2007, 28, S247–S257. [Google Scholar] [CrossRef] [Green Version]
  70. Oyarzun, P.J.; Borja, R.M.; Sherwood, S.; Parra, V. Making Sense of Agrobiodiversity, Diet, and Intensification of Smallholder Family Farming in the Highland Andes of Ecuador. Ecol. Food Nutr. 2013, 52, 515–541. [Google Scholar] [CrossRef] [PubMed]
  71. Houck, K.; Sorensen, M.V.; Lu, F.; Alban, D.; Alvarez, K.; Hidobro, D.; Doljanin, C.; Ona, A.I. The Effects of Market Integration on Childhood Growth and Nutritional Status: The Dual Burden of Under-and Over-nutrition in the Northern Ecuadorian Amazon. Am. J. Hum. Biol. 2013, 25, 524–533. [Google Scholar] [CrossRef] [PubMed] [Green Version]
  72. Liebert, M.A.; Snodgrass, J.J.; Madimenos, F.C.; Cepon, T.J.; Blackwell, A.D.; Sugiyama, L.S. Implications of Market Integration for Cardiovascular and Metabolic Health among an Indigenous Amazonian Ecuadorian Population. Ann. Hum. Biol. 2013, 40, 228–242. [Google Scholar] [CrossRef] [PubMed] [Green Version]
  73. Kansanga, M.; Luginaah, I.; Bezner Kerr, R.; Lupafya, E.; Dakishoni, L. Beyond Ecological Synergies: Examining the Impact of Participatory Agroecology on Social Capital in Smallholder Farming Communities. Int. J. Sustain. Dev. World Ecol. 2020, 27, 1–14. [Google Scholar] [CrossRef]
  74. Kegel, H. The Significance of Subsistence Farming in Georgia as an Economic and Social Buffer. Subsist. Agric. Cent. East. Eur. Break Vicious Circ. 2003, 147–160. [Google Scholar]
  75. Wilkie, D.S.; Curran, B.; Tshombe, R.; Morelli, G.A. Modeling the Sustainability of Subsistence Farming and Hunting in the Ituri Forest of Zaire. Conserv. Biol. 1998, 12, 137–147. [Google Scholar] [CrossRef]
  76. Singh, R.K.; Singh, A.; Sureja, A.K. Traditional Foods of Monpa Tribe of West Kameng, Arunachal Pradesh. Indian J. Tradit. Knowl. 2007, 6, 12. [Google Scholar]
  77. Chamorro, A. Dieta y Agrobiodiversidad Durante La Modernización de Las Chakras En La Sierra Central Ecuatoriana. Master’s Thesis, Wageningen University, Wageningen, The Netherlands, 2011. [Google Scholar]
  78. Melby, C.L.; Orozco, F.; Ochoa, D.; Muquinche, M.; Padro, M.; Munoz, F.N. Nutrition and Physical Activity Transitions in the Ecuadorian Andes: Differences among Urban and Rural-dwelling Women. Am. J. Hum. Biol. 2017, 29, e22986. [Google Scholar] [CrossRef]
  79. Macas, B.; Echarry, K. Caracterización de Mercados Locales Agroecológicos y Sistemas Participativos de Garantía Que Se Construyen En El Ecuador. Quito Coord. Ecuat. Agroecol. 2009. [Google Scholar]
  80. Hawkes, C.; Ruel, M.T. From Agriculture to Nutrition: Pathways, Synergies and Outcomes; World Bank: Washington, DC, USA, 2007. [Google Scholar]
  81. Du, L. Leveraging Agriculture for Nutritional Impact through the Feed the Future Initiative: A Landscape Analysis of Activities Across 19 Focus Countries; USAID/Strengthening Partnerships, Results, and Innovations in Nutrition Globally (SPRING) Project: Arlington, VA, USA, 2014. [Google Scholar]
  82. Melby, C.L.; Orozco, F.; Averett, J.; Muñoz, F.; Romero, M.J.; Barahona, A. Agricultural Food Production Diversity and Dietary Diversity among Female Small Holder Farmers in a Region of the Ecuadorian Andes Experiencing Nutrition Transition. Nutrients 2020, 12, 2454. [Google Scholar] [CrossRef] [PubMed]
  83. Berti, P.R. Relationship between Production Diversity and Dietary Diversity Depends on How Number of Foods Is Counted. Proc. Natl. Acad. Sci. USA 2015, 112, E5656. [Google Scholar] [CrossRef] [PubMed] [Green Version]
  84. Dietary Assessment: A Resource Guide to Method Selection and Application in Low Resource Settings; Food and Agriculture Organization of the United Nations (FAO): Rome, Italy, 2018.
  85. Poslusna, K.; Ruprich, J.; de Vries, J.H.; Jakubikova, M.; van’t Veer, P. Misreporting of Energy and Micronutrient Intake Estimated by Food Records and 24 Hour Recalls, Control and Adjustment Methods in Practice. Br. J. Nutr. 2009, 101, S73–S85. [Google Scholar] [CrossRef] [PubMed] [Green Version]
  86. Gibson, R.S.; Charrondiere, U.R.; Bell, W. Measurement Errors in Dietary Assessment Using Self-Reported 24-Hour Recalls in Low-Income Countries and Strategies for Their Prevention. Adv. Nutr. 2017, 8, 980–991. [Google Scholar] [CrossRef] [Green Version]
  87. Hassler, U.; Thadewald, T. Nonsensical and Biased Correlation Due to Pooling Heterogeneous Samples. J. R. Stat. Soc. Ser. Stat. 2003, 52, 367–379. [Google Scholar] [CrossRef]
Figure 1. Proportion of farmers who consumed distinct food groups in a 24-h period from (a) conventional markets, (b) own harvest and (c) the social economy, by farmer type.
Sustainability 13 04410 g001aSustainability 13 04410 g001b
Figure 2. Sources of dietary energy among agroecological and reference farmers over a 24-h period.
Sustainability 13 04410 g002
Figure 3. (a) Macronutrient and (b) micronutrient density contributions of food acquisition sources over a 24-h period for the pooled population. Densities above 1 are relatively nutrient-rich; densities below 1 are relatively energy-rich. The pooled population is presented for clarity; trends were similar for agroecological and reference farmers.
Sustainability 13 04410 g003
Table 1. Sample description and comparison of women agroecological and reference farmers on sociodemographic variables, food expenditures, and production.
Pooled Sample (n = 90)Agroecological (n = 60)Reference (n = 30)p-Value of Difference
Mean (SD) or %Median (IQR)Mean (SD) or %Median (IQR)Mean (SD) or %Median (IQR)
Sociodemographics
Age (years)45 (13)45 (37–52)46 (13)44.5 (37.5–53)42 (13)43.5 (34–49)0.252 t
Monthly income per capita (USD)91 (90)67 (37–109)87 (81)61 (37–110)100 (105)84.5 (40–109)0.660 u
Time to market (minutes)47 (36)40 (30–60)49 (35)37.5 (30–60)43 (38)43 (20–50)0.492 u
Household size5.3 (2.6)5 (4–6)5.6 (2.7)5 (4–6.5)4.8 (2.3)4 (3–6)0.173 t
Poverty by income 0.560
No poverty42% 38% 50%
Poverty24% 27% 20%
Extreme poverty33% 35% 30%
Livelihood sources present in household
Occasional or regular agricultural daily wage labor27% 27% 27% 1.000
Agricultural sales (excluding agroecological markets)39% 37% 43% 0.541
Other livelihood sources72% 70% 77% 0.506
Education completed by interviewee (% of sample) 0.424
None or partial primary44% 39% 53%
Primary or partial secondary38% 43% 30%
Secondary or postsecondary18% 18% 17%
Monthly food expenditure per capita (USD)18 (18)11 (7–20)15 (16)10 (6–20)23 (21)16 (8–30)0.039 u
Production
Production diversity (products)39 (17)42 (27–51)45 (15)45.5 (36.5–54.5)28 (14)25 (17–41)0.000 t
Access to irrigation (% of sample with access)43% 47% 37% 0.367
Land surface in agricultural use (% of sample) 0.027
<1 hectare56% 45% 77%
1–3 hectares33% 42% 17%
3–5 hectares9% 12% 3%
>5 hectares2% 2% 3%
For categorical variables, prevalences are shown as percentages. For continuous variables, both the sample means (standard deviation) and median (interquartile range) are shown to describe variable distributions. The p-values are for the difference between agroecological farmers (farmers who participate in agroecological associations) and reference farmers (the neighbors of agroecological farmers who do not participate in agroecological associations), which were compared using the Chi-square test, student T-test (indicated by a superscript “t”) or the U-test (indicated by a superscript “u”) according to variable type and distribution. We applied the Satterthwaite approximation to determine the p-values when unequal variances were a concern.
Table 2. Mean relative contribution of conventional markets, farmers’ own harvest, and the social economy to nutrient intake, by farmer category.
Agroecological FarmersReference Farmers
Conventional MarketsOwn
Harvest
Social EconomyConventional MarketsOwn
Harvest
Social Economy
Macronutrients
Energy44%32%23%69%17%13%
Protein39%38%24%67%17%16%
Carbohydrates43%32%24%65%20%14%
Fat47%30%22%75%14%11%
Saturated Fat53%23%23%83%10%7%
Fiber30%43%26%58%27%14%
Micronutrients
Vitamin A25%44%31%66%23%11%
Vitamin C33%35%31%59%30%11%
Calcium34%35%30%65%20%14%
Iron36%41%23%60%20%18%
Zinc38%36%25%65%18%16%
Thiamin39%38%23%62%21%16%
Riboflavin38%35%27%67%18%14%
Niacin44%33%23%69%17%14%
Folate33%41%25%61%22%17%
Mean micronutrient contribution36%38%26%64%21%15%
Table shows the average share of nutrient intake, by nutrient, that farmers obtained from each food source over a 24-h period. Mean micronutrient contribution is the average of contributions to vitamin A, vitamin C, calcium, iron, zinc, thiamin, riboflavin, niacin, and folate.
Table 3. Correlates of proportion of caloric intake from conventional markets, farmers’ own harvest, and the social economy.
Pooled Sample (n = 90)Agroecological Farmers (n = 60)Reference Farmers (n = 30)
Conventional MarketsOwn
Harvest
Social EconomyConventional MarketsOwn
Harvest
Social EconomyConventional MarketsOwn
Harvest
Social Economy
Sociodemographics
        Age (years) −0.190.23
        Monthly income per capita (USD)0.19 *−0.24 ** −0.2 0.44 **−0.25 *
        Time to market (minutes)−0.16 −0.240.15
        Household size −0.180.31 **
        Education (score 0−5)−0.19 *0.28 *** 0.16
Food expenditure per capita (USD)0.24**−0.34 *** −0.38 ***0.22 *0.23
Production
        Production diversity (products)−0.25 **0.24 ** −0.17
        Access to irrigation (no = 0, yes = 1) 0.15 −0.20
        Land surface in use−0.38 ***0.44 *** −0.36 ***0.43 *** −0.230.17
Dietary indicators
        Dietary Diversity Score 0.21
        Food Variety Score−0.26 **0.25 ** −0.22 *0.24 * 0.22
        NOVA 1—unprocessed and minimally processed foods−0.18 *0.21 ** −0.180.26 ** −0.17
        NOVA 2—processed culinary ingredients0.32 ***−0.15−0.150.29 **−0.16−0.150.16
        NOVA 3—processed foods −0.160.23 *
        NOVA 4—ultra−processed foods −0.16 −0.27 0.22
Correlations are reported using Pearson’s or Spearman’s rho (r), according to variable distribution. *, **, and *** indicate significance at the 10%, 5%, and 1% levels, respectively. Proportion of caloric intake from each source is the calories obtained from the given source divided by the total calories in the diet. Caloric intake and all dietary indicators were based on a single 24-h recall period. Education completed is an ordinal variable with values from 0 (none) to 5 (post-secondary). Land surface in use is an ordinal variable where: 1 is <1 hectare (ha), 2 is 1–3 ha, 3 is 3–5 ha, and 4 is ≥5 ha. Correlations coefficients below |+/−0.15| are left blank for clarity.
Publisher’s Note: MDPI stays neutral with regard to jurisdictional claims in published maps and institutional affiliations.

