Abstract
As the most infectious disease in 2020, COVID-19 is an enormous shock to urban public health security and to urban sustainable development. Although the epidemic in China has been brought into control at present, the prevention and control of it is still the top priority of maintaining public health security. Therefore, the accurate assessment of epidemic risk is of great importance to the prevention and control even to overcoming of COVID-19. Using the fused data obtained from fusing multi-source big data such as POI (Point of Interest) data and Tencent-Yichuxing data, this study assesses and analyzes the epidemic risk and main factors that affect the distribution of COVID-19 on the basis of combining with logistic regression model and geodetector model. What’s more, the following main conclusions are obtained: the high-risk areas of the epidemic are mainly concentrated in the areas with relatively dense permanent population and floating population, which means that the permanent population and floating population are the main factors affecting the risk level of the epidemic. In other words, the reasonable control of population density is greatly conducive to reducing the risk level of the epidemic. Therefore, the control of regional population density remains the key to epidemic prevention and control, and home isolation is also the best means of prevention and control. The precise assessment and analysis of the epidemic conducts by this study is of great significance to maintain urban public health security and achieve the sustainable urban development.
1. Introduction
Corona Virus Disease (COVID-19), rampaging around the whole world throughout the year 2020, has not only adversely affected global public health security but also seriously threated human’s health [1,2]. Although the whole country is actively coordinating to control the epidemic, the COVID-19 is still spreading. Therefore, the accurate identification of the current high-risk areas of the epidemic and the assessment of the risk level of the epidemic in different areas are both important prerequisites for the formulation of epidemic prevention policies [3]. With the approach of the winter season in the Northern Hemisphere, COVID-19 is becoming more and more active, which makes the prevention of the second outbreak of COVID-19 still an important challenge for the global epidemic treatment. Therefore, the prevention and control of COVID-19 will continue to be an important issue for maintaining urban public security and achieving sustainable urban development in the future. This is also the reason why the assessment of the current epidemic risk can provide reliable support for urban safety decision-making.
It is generally believed that the relatively effective anti-infection measures are to limit massive human migration, to classify the areas with more confirmed cases as high-risk areas, to lock down the smaller regions where the epidemic risk is relatively higher and so on. Although these anti-infection measures did play active roles in the prevention and control of COVID-19, they failed to heighten the key areas [4]. Therefore, the accurate assessment of the risk of COVID-19 in the perspective of geographical space is helpful to rational prevention and control of the epidemic [5].
Many studies about clinical diagnosis [6], transmission relationship [7], drug vaccine [8], spatiotemporal pattern [9], risk assessment [10], and epidemic transmission [11] of COVID-19 have been done by scholars since the breakout of the epidemic, which has made great contributions to the prevention and control of COVID-19. With the arrival of the post-epidemic period, the risk assessment of epidemic has gradually become the focus of attention [12,13]. The risk assessment of epidemic mainly includes using the risk model of population floating to assess the epidemic risk [14], using Tencent positioning data to divide the infection risk of epidemic [15], using the big data on population mobility to predict the spread pattern of the epidemic by considering the transmission law of the epidemic [16], and revealing the epidemic law and change law with the help of big data on population mobility while using social factors [17]. Although all these studies have played a good role in the risk assessment of COVID-19, the current risk assessment results of COVID-19 mostly focus on the macro-regional scale, which fails to better reflect the risk assessment of COVID-19 on the micro-geospatial scale of cities under the influence of urban elements. [18,19].
As the abstract presentation tool of various spatial factors in geographical virtual space, Point of Interest (POI) data mainly presents the agglomeration condition of various urban factors by describing the density of each POI data point in the virtual geographic space [20,21]. With this character, POI can present the spatial differences among various urban factors preferably, with which POI is becoming more and more prevalent in relevant research about geographical space [22]. What’s more, POI data has indeed contributed to the simulating of urban spatial structure [23], as well as the analysis of urban hot spots [24,25]. As for the Tencent-Yichuxing data, it is a macro spatial population mobility index of certain time quantum generating by accessing users’ location information of the APP belongs to Tencent. With this index, the interaction information among people in regional space could be preferably presented, which makes Tencent-Yichuxing data more and more popular in exploring and studying the research about urban agglomeration, in addition to the information exchanges among urban cities [26,27].
At present, the heterogeneity of urban space results in the difficulty of Unisource data in adapting the rapid transformation of urban spatial structure [28]. Therefore, there are more and more scholars beginning to pay attention to the use of the data fused from multiple sources in relevant research about urban cities. Fusion of multi-source data mainly refers to the fusion using of traditional source data and emerging source data [29]. Traditional source data includes statistic data and remote sensing data [30], while emerging data mainly refers to the data that could be obtained from Internet, such as POI data [31], thermodynamic diagram data [32] and so on [33]. It is shown that data fusion does have an edge over other data in conducting relevant research in terms of the extraction of urban build-up areas [34], the defining of urban center [35], the identification of urban functions [36] and the regulation of urban spatial form [37]. Data fusion can not only reduce even avoid the inaccuracy generating by Unisource data in urban space research, but can also improve the accuracy of research results [38]. Therefore, fusing multi-source data has become a new on-the-rise way to resolving relevant problems about urban cities [39], and that is why the fusion of multi-source data should be abundantly applied when conducting the risk assessment of COVID-19 or exploring the influence factors of COVID-19 within urban spaces.
With the development of computer technology, many computing methods such as machine learning have been widely applied in urban related research [40]. Machine learning obtains general patterns from existing data samples, and then predicts the results based on the patterns [41]. Compared with general linear regression [42], GNN-CA model [43], cellular automata model [44], etc., logistic regression, as one of the most common models of machine learning, has a more objective algorithm, a rigorous calculation process, and a simpler and more efficient calculation between normal hypothesis and variables [45]. At present, logistic regression has achieved good results in urban land prediction [46], urban expansion simulation [47] and urban spatial change [48]. This study uses the advantages of logistic regression models in urban spatial prediction to assess the current risk level of COVID-19.
Due to the potential interdependence among the observed data of different variables distributed in the same region, the spatial factors affecting the risk level of the epidemic will have obvious spatial differentiation [49]. At present, there are few analytical methods for spatial differentiation, mainly including spatial analytical measure [49], geodetector statistics [50], MSN of stratified samples [51], Bshade of sample deviation [52], SPA model of single point sample [53] and Sandwich model of multi-unit conversion [54]. As a statistical method to detect spatial differentiation and reveal its driving force, the fundamental of geodetector is that if an independent variable has an important influence on the dependent variable, then the spatial distribution of the independent variable and the dependent variable should be similar [50]. Compared with other spatial differentiation analysis methods, geographic detectors can detect not only data, but also the interaction between different factors [55,56]. Therefore, the geodetector can not only analyze the main role of different factors, but also judge the relationship between factors, which cannot be achieved by other spatial differentiation analysis methods [57].
As the super first-tier cities, although there are no large-scale COVID-19 infections like in Wuhan; Beijing, Shanghai, Guangzhou and Shenzhen are also the regions with the greatest potential threat from COVID-19 as they are the most complex areas of population flow between cities and cities and between cities and regions in mainland China. In order to prevent and control the epidemic more efficiently with a more rational utilization of anti-epidemic resources as well as a more prominent emphases, taking Guangzhou and Wuhan as cases, this study firstly uses logistic regression model to fuse big data such as POI and Tencent-Yichuxing, and then evaluates the current epidemic risk level based on this. Then, the correlation between spatial factors affecting the epidemic risk level is analyzed by using the geo-detector model, and the accuracy is finally verified. All these provide important reference for the formulation of epidemic prevention policy.
2. Materials and Methods
2.1. Study Area
With a location that ranges from 112 degrees, 57 min east longitude to 114 degrees, 3 min east longitude; 22 degrees, 26 min, to 23 degrees, 56 minutes north latitude (Figure 1), Guangzhou is generally considered as one of the cities in which urbanization is most significant with a total number of permanent population 15.3059 million in 2019 [58]. The accuracy risk assessment of COVID-19 in Guangzhou can greatly contribute to predicting high-risk areas to giving prominence to emphases on epidemic provocation and control and to rationally formulating prevention and control strategies. In order to make the conclusions drawn by this study of more universal applicability, this study selects Wuhan, the city with the most cases of COVID-19 in China in 2019, as a case verification. Wuhan is located at longitude 132 degrees 41′ to 115 degrees 5′ and latitude 29 degrees 58′ to 31 degrees 22′ north (Figure 2). As the central city of middle China and an important industrial foundation of China, Wuhan, with a total area of 8569.15 square kilometers, has a permanent population of 11.212 million people. However, from the end of 2019 to the beginning of 2020, the number of infectors for COVID-19 in Wuhan was more than half of that in mainland China. Therefore, the case verification of Wuhan, China, can further verify the correctness of the conclusions of this study [59].
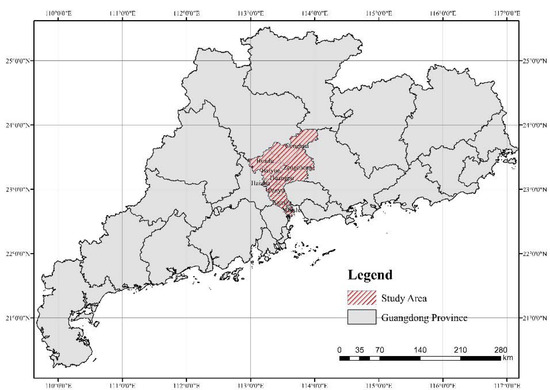
Figure 1.
Study Area: Guangzhou, China.
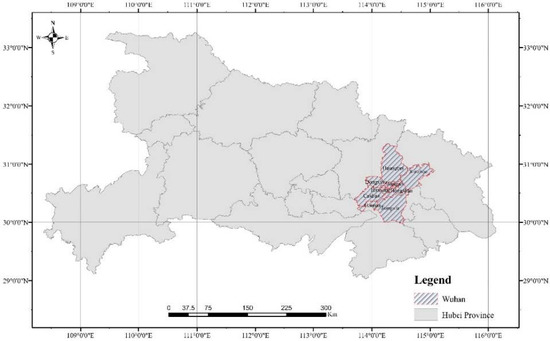
Figure 2.
Verification Area: Wuhan, China.
2.2. Study Data
This study aims to explore the influence of different urban spatial factors on the level distribution of COVID-19 risk from the perspective of urban geographic space. Although the urban interior environment (ventilation, pollution, etc.) can also affect the risk level of COVID-19, it is limited to the topic of this study, so only urban spatial elements are considered here. At the time of the outbreak of COVID-19, urban spatial factors that affect the risk distribution level of COVID-19 mainly refer to places where people interact and gather, such as: hospitals, transportation stations, hotels, restaurants, supermarkets, markets, schools, administrative centers, cultural sites, sports stadiums, etc. [60,61]. These spatial factors are important parts of urban space [23,62]. In the relevant research about urban geographical space, these factors including hospitals, transportation stations, hotels, restaurants, supermarkets and markets all play important roles in the flow of urban space. Therefore, in the relevant research about urban space at present, these factors should be taken into consideration undoubtedly [63,64]. On the one hand, the risk of outbreaks in public service places including schools and administrative centers is relatively lower [65,66], which is mainly thanks to extremely strict population limits and epidemic prevention measures in these places, for example, to carry out remote online teaching [67], online office [68,69] and some other restrictive policies [70]. On the other hand, public places such as traffic stations and supermarkets are at high risk of outbreak due to the difficulty in controlling population concentration [71]. Considering the above factors, urban spatial factors that have an influence on the distribution of COVID-19 risk level including urban population (permanent population and floating population), transportation stations, hotels, restaurants and living space (supermarkets, markets, etc.) are analyzed [47]. Among them, the urban population includes all the population in the study area; the traffic stations represent all the traffic flows during the epidemic (although urban traffic can also represent the traffic flow between regions, such traffic flow only reflects the traffic behavior of people and cannot directly reflect the degree of population agglomeration. For example, there may not be many people in the area with large traffic flow, while the population in the area with dense traffic stations will also have obvious agglomeration); living space refers to the public space that the urban population needs to enter in order to live during the epidemic.
COVID-19 data: COVID-19 data including the number of designated clinics (fever clinic) appointed by government and the number of new infections increased. Firstly, the number of designated clinics: there are in total 102 fever clinics designated by municipal government of Guangzhou; as for the number of new infections, this data only goes up to April 2020, as there were no new cases since then. There are 349 confirmed cases up to April 2020, about which, 137 cases were confirmed in January, 209 cases in February, 2 cases in March and only 1 case in April. In addition, the number of fever clinics in Wuhan is 134. As of April 2020, the total number of people infected with COVID-19 is 50,333. The spatial distribution diagram of fever clinics and confirmed cases for COVID-19 of Guangzhou is shown in Figure 3 and the spatial distribution diagram of fever clinics and confirmed cases for COVID-19 of Guangzhou is shown in Figure 4.
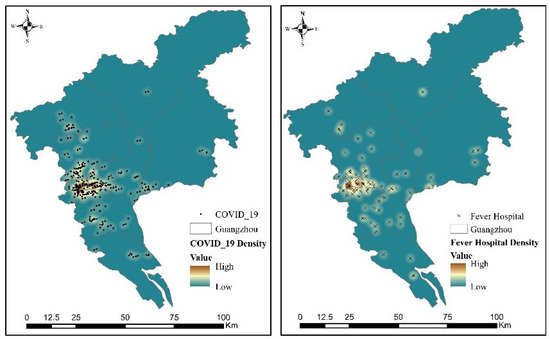
Figure 3.
Spatial distribution of Fever Clinics and Confirmed Cases of Guangzhou.
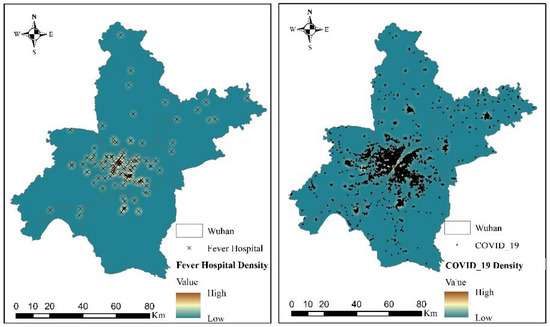
Figure 4.
Spatial distribution of Fever Clinics and Confirmed Cases of Wuhan.
Population data: Permanent population data and floating population data are included in the population data, the data of permanent population mainly obtained from Guangdong and Wuhan Statistical Yearbook of 2019. According to the statistics, the population of permanent residents in Guangzhou reached 15.3059 million by the end of 2019, while the population of permanent residents in Wuhan reached 11.212 million, and the spatial distribution diagram of permanent population density is obtained according to the permanent population data. As for the floating population data, floating population refers to the regional change of population in a certain time within a certain range, including quantity and movement track. It can be accessed from the positioning big data service windows of Tencent (1: http://heat.qq.com/index.php, accessed on 1 October 2020). Meanwhile, Tencent-Yichuxing data reflects the degree of population congestion in the current space and time. Compared with data such as thermal map, Tencent-Yichuxing data can not only reflect the number of population, but also can reflect the movement of population among regions. On the basis of calculating the average floating population data collected by positioning system of Tencent big data service window from January to April 2020, the spatial distribution map of floating population density could be obtained according to the smallest accusation window (with spatial resolution of 25 × 25 m) (Figure 5 and Figure 6).
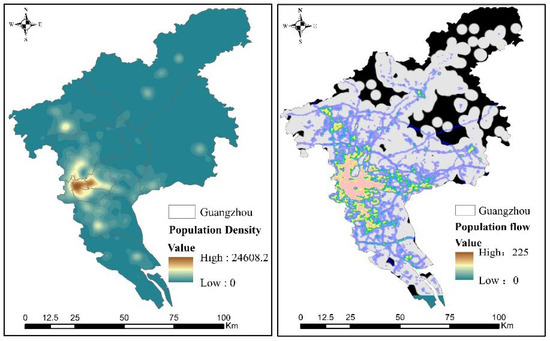
Figure 5.
Preprocessing Result of Guangzhou Population Data.
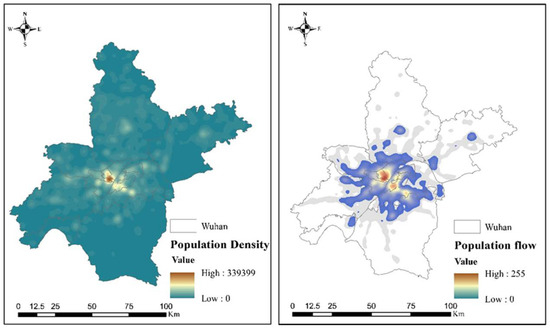
Figure 6.
Preprocessing Result of Wuhan Population Data.
POI data, a total of 220,971 and 209,812 POI data of Guangzhou and Wuhan in April 2020 was obtained respectively by using Amap (2: https://www.amap.com/, accessed on 1 October 2020), and duplicate checking and data cleaning were conducted. POI data was used in this study to explore the impact of urban spatial factors on the distribution of COVID-19 and then public spatial POI data that has an impact on the epidemic in urban was screened. The screened POI data mainly include traffic station, hotel, restaurant, living space (supermarket, bazaar, etc.), of which the number of Guangzhou is 57,882; 16,134; 15,009; and 52,606, respectively, and 50,912; 12,281; 16,048; and 49,001 in Wuhan. What’s more, in order to unify the observation unit, the floating population unit was resampled and the spatial distribution map of the density of traffic station, hotel, restaurant and living space in Guangzhou and Wuhan was generated (Figure 7 and Figure 8).
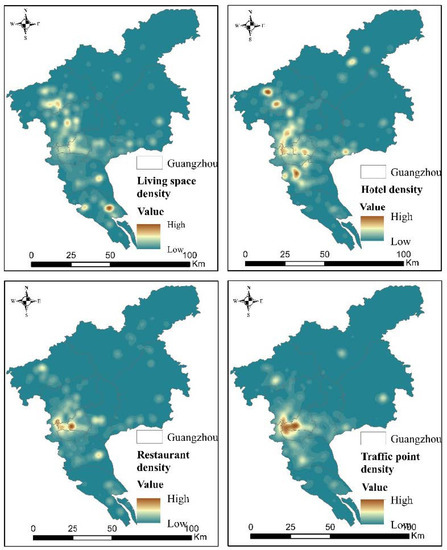
Figure 7.
Point of Interest (POI) Data of Guangzhou.
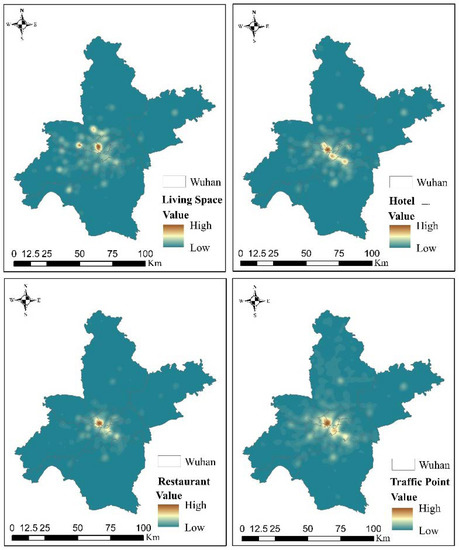
Figure 8.
POI Data of Wuhan.
2.3. Methods
It is necessary to predict the risk levels of COVID-19 and to understand the spatial variability among the factors so as to assess the risk levels of COVID-19 in the study area and to analyze the spatial relationships among urban spatial factors that influence the distribution of COVID-19 risk levels. In order to achieve these two purposes, logistic regression and geographic detector are used to predict the risk level of COVID-19 and analyze the differentiation relationship among various spatial factors.
2.3.1. Logistic Regression
Logistic regression is one of the methods that is most widely used in machine learning. The predicted results of logistic regression are probabilities bounded between 0 and 1, which is not only easier to use and interpret, but also more suitable for continuous and categorical independent variables than other methods [72]. Logistic regression refers to conducting logistic regression on the basis of using sigmoid function and the independent variable and dependent variable could be explored; in addition, the quantitative analysis of the probability of epidemic occurrence could be made [73]. On the one hand. Logistic regression model did have great advantages in terms of training identifying time comparing with other models such as Support Vector Machine (SVM) and Neural Network. On the other hand, it has its disadvantages as well, which is that the logistic regression model could be meaningful and useful only when the independent variable is significant. The relationship before carrying out explanation between the occurrence probability of COVID-19 and various factors could be represented as follows:
where, represents the occurrence probability of COVID-19, ranges [0, 1]. The closer the value of is to 1, the higher the occurrence probability; the closer the value of is to 0, the lower the occurrence probability. stands for a linear combination. Therefore, the fitting equation concerned by LR could be represented as:
where, stands for the intercept of the model and it represents the error value of the occurrence probability of COVID-19 in urban space under the condition of selected indicator factors; …… stand for the LR coefficient and , …… for the index factors.
2.3.2. Geodetector
It is believed that everything is related to everything else, but near things are more related to each other, according to Tobler’s First Law of Geography. Therefore, providing a certain independent variable has a significant impact on the dependent variable; the spatial distribution of the independent and dependent variable could be similar to each other [74]. Geodetector is a statistical method based on the theory of spatial variance analysis proposed by Wang Jinfeng and other scholars. It can not only detect the spatial variation of level impact factor, but can also verify the spatial distribution coupling of two varieties, as well as explore the casual relationship among varieties [75].
- (1)
- Factor Detector
The spatial differentiation of COVID-19 detection and the extent to which risk factors explain the spatial differentiation of COVID-19 can be measured by which can be expressed as follows:
where, …… stands for the state of COVID-19 or risk factors, while and stand for the number of units in layer and the whole region, respectively. and represent the variances in layer and whole-course risk factors, respectively. and represent the within-sum of squares and the total sum of squares, respectively. The value range of is [0, 1], and the larger the value is, the more obvious the spatial differentiation of COVID-19. If a state is generated by risk factors, the larger the value of is, the stronger the explanatory power of the risk factor for COVID-19, and vice versa.
A simple change in the value q satisfies the noncentral distribution F:
where stands for the noncentral parameter and stands for the mean value of layer . Based on Equation (5), a geographic detector can be used to detect whether is significant.
- (2)
- Interaction Detector
To identify the interactions between different risk factors of is to assess the effect under the combined action of factors and whether it enhances or weakens the explanatory power of COVID-19 or the impact of these risk factors on COVID-19 is independent of each other. By calculating and respectively, and comparing the value of and , it can be found that the relationship between the two risk factors can be divided into the following columns (Table 1).

Table 1.
Detection of Interaction.
- (3)
- Risk detector
Whether there is a significant difference between the mean value of the attributes of the two subintervals is detected, and the statistic is used for testing:
where, stands for the mean value of the attributes in subregion , which, here, represents the incidence rate of COVID-19; stands for the number of samples in subregion , and stands for the variance. The statistic approximately obeys Student’s distribution, and the calculation method of the degrees of freedom is as follows:
Providing that = there would be a significant difference between the mean value of the attributes of the two self-fetching parts.
- (4)
- Ecological detector
The statistic is compared and measured to test whether the two impact factors and have significant differences in the spatial distribution of attribute :
where, and represent the sample sizes of risk factors and , respectively; and represent the sum of the intralayer variances in the layers formed by and , respectively; and and represent the number of levels of risk factors for and , respectively. Assuming that and are equal, the spatial distribution effects of risk factors and are significantly different.
3. Results
3.1. Model Training
Based on COVID-19 data from January to April 2020 in Guangzhou and Wuhan, COVID-19 risk areas are divided and risk areas and risk-free areas are constructed. In this study, the factors are firstly diagnosed by collinearity, because the eight spatial factors used in this study may have multicollinearity, which will cause serious deviation to the operation results of logistic regression model. The product of TOL (tolerance) and VIF (variance inflation factor) is close to 1, which is a common indicator to reflect the degree of collinearity of factors. Generally speaking, when the product of VIF and VOL is greater than 10 or less than 0.1, it indicates a high degree of collinearity among factors, which does not meet the modeling conditions. The results of the multicollinearity analysis of 8 spatial factors are shown in Table 2, showing that all the factors VIF and VOL product are around 1. It is proven that all factors meet the conditions of collinearity analysis through multicollinearity diagnosis. Therefore, eight spatial factors are introduced into the model training.
Table 2.
Factor collinearity analysis.
3.2. Risk Assessment of COVID-19 of Guangzhou
It can be found from the training results of the model that the higher the risk level is, the higher the probability of COVID-19 occurrence will be. Combined with the actual geographical location, the distribution map of epidemic risk level in Guangzhou is obtained (Figure 9).
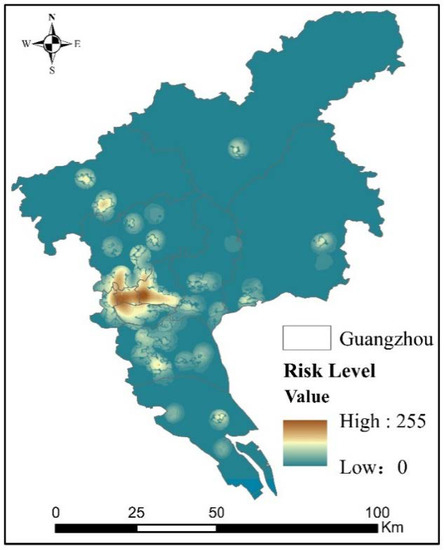
Figure 9.
Distribution Diagram of the Risk Level of COVID-19.
According to the distribution diagram of the risk level of COVID-19, the regions with high risk level are concentrated in Yuexiu District, Tianhe District, Liwan District and Haizhu District, which are the core areas of Guangzhou. By comparing Figure 4, Figure 5, Figure 6, Figure 7 and Figure 8, it can be found that the areas with higher COVID-19 risk are also those with higher transportation stations, restaurants and areas with high population mobility and resident population density. Therefore, it can be concluded that COVID-19 has a great spatial correlation with traffic stations, restaurants and population distribution while the spatial correlation with the hotel and living space is relatively smaller.
Yuexiu District, Tianhe District, Liwan District and Haizhu district all belong to the area with higher population density in Guangzhou. The population floating and interaction is further strengthened with more intensive traffic stations and restaurants in these four districts. It can also be found that new confirmed cases for COVID-19 are mainly concentrated in these four regions except for the external traffic stations after the breakout of COVID-19, which proves that the density of permanent population is one of the most important factors that influence the transmission of the epidemic. In addition, what can be further found is found is that the high-risk areas, including Haizhu District, are all urban villages with dense residential areas and relatively backward related facilities.
There is also an obvious increase of confirmed imported cases in external traffic stations such as Baiyun International Airport and Guangzhou South Railway Station, in which population mobility is the main factor that results in the higher epidemic risk level. It can be found from previous studies that the main spread modes are population aggregation and population floating on a large scale. Although COVID-19 was first reported in Wuhan, the route of transmission is cut down immediately, resulting in the efficient control of epidemic after the policies of lockdown in Wuhan and restricted population mobility implemented by Chinese government. This is an excellent example that proves restricted population floating could indeed prevent and control the epidemic.
There is no doubt that the infection risk of COVID-19 will be greatly increased if population is exposed to a dangerous environment for a long time. The anti-epidemic policy “home quarantine” was decidedly implemented after the breakout of COVID-19 in China, which not only efficiently brought the population mobility all over the country under control in a short time, but also promptly controlled the population density in public areas. Although the implementation of this policy has efficiently reduced the epidemic risk, the public areas with higher population density and larger floating population are still high-risk areas at present.
3.3. Verification of COVID-19 Risk Level in Wuhan
Although the confusion matrix and ROC curve can prove the correctness of the model and results of this study, the number of COVID-19 infectors in Guangzhou is only 349, while the total population of Guangzhou is up to 15.3059 million, which shows that the results may have a certain degree of randomness. Therefore, Wuhan, the city with the most COVID-19 patients in China, was selected as the verification area in this study. As one of the cities with the largest number of COVID-19 infections in China, many studies on the risk of COVID-19 in Wuhan have been carried out. The correctness of this study can be judged by comparing the COVID-19 risk calculated by this study with that calculated by other relevant studies.
By the end of April 2020, a total of 50,333 people had been infected with COVID-19 in Wuhan. The evaluation results can directly demonstrate the correctness of this study. By collecting urban spatial element data of Wuhan and importing this model, the risk distribution of COVID-19 in Wuhan can be obtained, as shown in Figure 10.
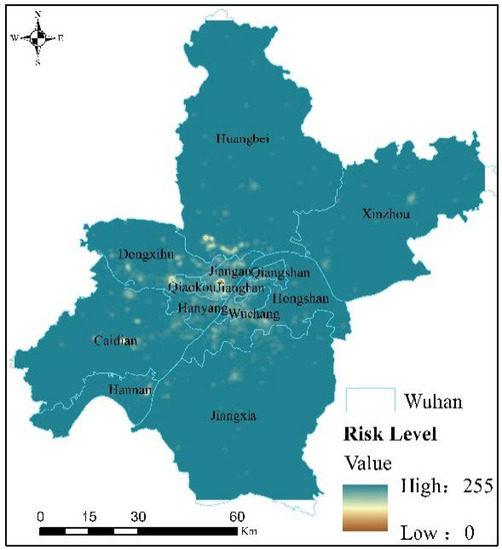
Figure 10.
Distribution of the Risk Level of COVID-19 in Wuhan.
It can be found from the distribution of the risk level of COVID-19 in Wuhan that high-risk areas for COVID-19 were mainly concentrated in Wuchang District, Jianghan District, Qiaokou District and Hongshan District, shown by Google map of Wuhan to be old urban areas with more a concentrated permanent population density. Moreover, these high-risk areas are relatively dense with floating population and other public facilities. This result is consistent with the results of Wuhan’s epidemic risk assessment through other methods and research perspectives [76,77,78], which further illustrates the correctness of the results of this study.
By comparing the research results of Guangzhou and Wuhan, it can be found that there is no significant difference in the number of permanent residents between Guangzhou and Wuhan, the number of infected cases in Wuhan is far greater than that in Guangzhou, and the risk level of COVID-19 in different regions is different. Through the analysis of the data, methods and results of this study, it can be found that the accuracy of the assessment results of the risk level distribution of the epidemic in Guangzhou and Wuhan have been further verified, indicating that although the data sample size of different new crown cases will affect the risk level value of different regions (the larger the data sample size, the higher the risk level), it does not affect the distribution of the epidemic risk level in the entire region. Therefore, large cities where the epidemic is more prevalent and with more patients infected with COVID-19 can also use the method proposed in this study to assess the risk level of COVID-19.
3.3.1. Verification of Confusion Matrix
Precision verification is of great importance to the detection of the assessment of logistic regression model on risk level of COVID-19. Besides this, it was used to verify the distribution of epidemic risk level in Guangzhou and Wuhan, as shown in Figure 9 and Figure 10. The verification result of confusion matrix is shown in Table 3, in that the precision verification of risky area and non-risk area is 0.892 and 0.996, respectively, with a Kappa value of 0.806 and 0.811, which proves that the logistic regression model is of great accuracy to the assessment of epidemic risk level.
Table 3.
The LOGISTIC regression model confuses the matrix.
3.3.2. Verification of ROC (Receiver Operating Characteristic) Curve
The verification of ROC curve is a means to detect and evaluate the prediction accuracy of logistic regression model comprehensively with the utilization of value of AUC (Area Under Curve); the closer the value is to 1, the higher the prediction accuracy of the model is. It can also be found in Figure 11 and Figure 12 that the AUC value of training sample, text sample and overall data is 0.99, 0.99 and 0.99, respectively. The values are all close to 1, which not only proves that the assessment is of great accuracy, but also proves that the logistic regression model can play an accurate role in assessing the risk distribution of COVID-19.
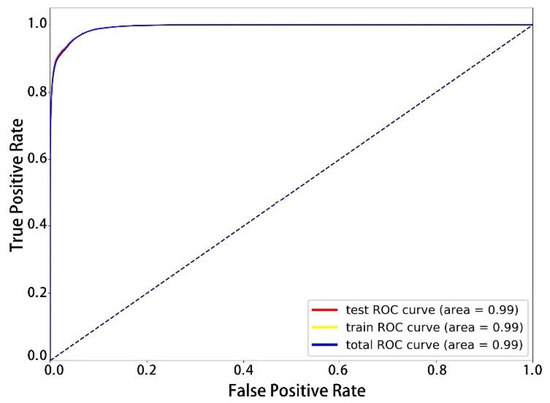
Figure 11.
ROC Curve of Guangzhou.
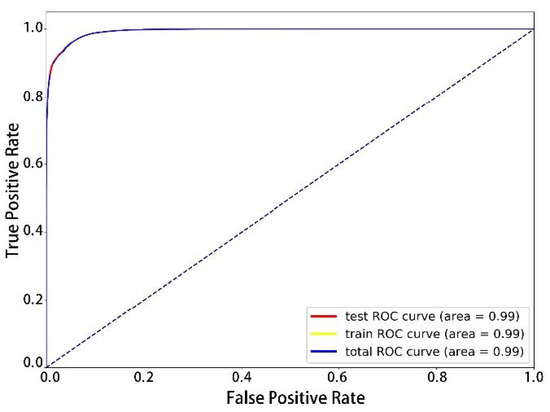
Figure 12.
ROC Curve of Wuhan.
3.4. Analysis of Influence Factor
- 1.
- Risk Factor Detector
It is shown in the factor detection results of Figure 7 that the density of permanent population is the most crucial factor that could decide the risk level of COVID-19 when it comes to the assessment of it, followed by population mobility, which is consistent with the assessment result of epidemic risk level. It is also proven that the most efficient anti-epidemic measure is to avoid population mobility and aggregation by conducting home quarantine. The effect degree of density of traffic station, living market and restaurant on the distribution of COVID-19 is similar, with a lower influence than permanent population density and population mobility. The reason is that the density of traffic stations, restaurants and living space could affect the risk of the epidemic only in terms of human beings. As long as the population density in public areas is controlled, the risk of the epidemic will be decreased. This further shows that the rational anti-epidemic measure is to reduce population floating and interaction to prevent people from being exposed to public environment in population accumulation area. During the epidemic period, people’s demands for life are the highest, followed by catering and transportation. Different demands can also reflect different risk level distribution, which is also shown in the risk factor detector table (Table 4).
Table 4.
Risk Factor Detector.
The factor that has the lowest effect degree to risk level of COVID-19 is the density of hotel and fever clinic; this phenomenon resulted from the following reasons: on the one hand, the decrease in the number of people going out during the epidemic directly causes the decrease in the number of people staying in hotels, which makes the spread of COVID-19 more difficult. Moreover, even if some hotels are selected as isolation hotels, the epidemic risk level would also be reduced due to the epidemic prevention measures. On the other hand, no matter where it appears, infectors can always be sent to a fever clinic for timely treatment.
- 2.
- Interaction Detector
The detection result, shown as Table 5, could be obtained after detecting the interaction of different factors. It can be found that the lowest risk level can be reached when interacting permanent population density with floating population density. Assuming that the value of q is 0.71, the effect degree of two factors after interaction is bigger than single influence factor. This also proves that the spread of epidemic can be efficiently controlled, the risk of epidemic can be effectively reduced on the premise of rational controlling permanent population and floating population.
Table 5.
Interaction Detector.
- 3.
- Ecological Detector
Assuming that the text value of F is 0.05. The ecological detector table of Table 6 can be obtained, of which, Y stands for a significant difference with N stands for a non-significant difference. In terms of the risk distribution of COVID-19, there is a significant difference between permanent population and other spatial factors, which proves that the density of permanent population is indeed the most important factor affecting epidemic risk, followed by floating population. Compared with population factors, other factors, including supermarkets, hotels and living markets, show no significant difference in COVID-19 risk distribution. This suggests that other public places will not directly result in the increase of epidemic risk level on the premise of rational controlling the density of regional permanent population. In other words, population is a direct contributor leading to the increase in the risk of COVID-19 in public places in urban spaces.
Table 6.
Ecological Detector.
It can be found by analyzing the factors affecting the risk level of COVID-19 by the geographic detector that population is the direct factor affecting the level of epidemic risk. Under the premise of reasonable population control, public places will not directly cause an increase in the level of epidemic risk. Therefore, it is not necessary to completely implement lockdown policies and restrict the use of public spaces in large cities. As long as population density restrictions are implemented in public spaces and places with public uses, the risk level of the epidemic can be effectively controlled without affecting the operation of the city. Compared with the strict epidemic prevention measures adopted in public areas such as schools and administrative centers, restricting population density in transportation stations, restaurants, and living spaces is undoubtedly a more convenient and effective choice. “Home quarantine” is the best epidemic prevention measure at present, because it can greatly limit the movement and interaction of the population, which is conducive to the decrease of population density in public space. The decline in population density in public space will undoubtedly directly reduce the risk of the epidemic. In addition, there is no significant difference in the results of Risk Factor Detector, Interaction Detector and Ecological Detector between Guangzhou and Wuhan, indicating that within the urban space, the influencing factors of the Risk level of the new crown epidemic are the same, which also makes the results of this study valuable for promotion.
4. Discussion
Using the fused data obtained from fusing spatial geographical big data such as POI data and Tencent-Yichuxing data, this study assesses the epidemic risk level of Guangzhou and conducts spatial difference analysis on different urban spatial factors that affecting the distribution of COVID-19 on the basis of combining with logistic regression model and geodetector model. What’s more, the following main factors that affecting epidemic level are obtained: logical regression model calculates the performance of different factors affecting the epidemic in urban space, and then simulates the final result. In fact, logistic regression model is a process of constantly seeking the optimal solution of the results. Compared with other machine learning models, the calculation process is simpler and the result expression is more direct. As for the geodetector, it can detect the heterogeneity of spatial distribution pattern between dependent variables and independent variables through the spatial difference between different variables, and then measure the degree of mutual explanation between different variables. Therefore, it can be found that compared with other statistical methods, the geodetector can better reflect the causal relationship between different variables.
Since the breakout of COVID-19, relevant research about the epidemic are mainly carried out from the perspective of population mobility [79], regardless whether in the range of region or country even of the global world. Population mobility has indeed played an important role in the risk assessment of epidemic and it has also been proven that it is one of the most crucial factors that could enormously influence the epidemic risk [7]. However, population mobility is not the only factor that results in a higher risk for COVID-19, and that is why this study objectively assesses the risk level of epidemic on the basis of comprehensively considering population, public places and other open special factors. Using the fused data obtained from fusing spatial geographical big data such as POI data and Tencent-Yichuxing data, this study also explores primary and secondary factors that affect epidemic risk and the interrelationship among these factors except for assessing the risk level, and it is also shown in the world. In addition, the verification result also shows that the risk assessment of epidemic conducted by this study is of great accuracy.
The high-risk areas for epidemic are mainly concentrated in the areas with more intensive permanent population and more frequent interaction among people [7,19], which has also been proven to be correct by previous research. However, comparing with previous research, this study not only takes various urban spatial factors into account to comprehensively discussing the influencing degree of different factors, but also analyzes the distribution of epidemic risk level comprehensively and objectively, which could be instrumental to the target prevention and control of regional epidemic.
Compared with the existing studies on the distribution of epidemic risk [15,17], the main contribution of this study is reflected in the research methods and ideas. From the perspective of research methods, this study uses geographic detectors to analyze the urban spatial factors that affect the risk of the epidemic, derives the primary and secondary factors that affect the risk of the epidemic, and analyzes the correlation between different factors. Secondly, from the geographical perspective, compared with other epidemic research, this study explores the distribution of the risk level of the epidemic in urban space, which highlights the role and influence of urban space in the spread of the epidemic. The results obtained from the study do not only contribute to the formulation of urban epidemic prevention policies, but also play a positive role in guiding the risk prevention and control of COVID-19.
In the prevention, control and management of the epidemic, no matter individuals, families or countries have made great efforts and sacrifices to defeat it. From the policy point of view, restricting population mobility undoubtedly has an active impact on the communication of population in different ways, although home quarantine restricts the communication among individuals, families and cities to a certain extent, mainly reflecting in the population restrictions. By comparing Table 4, Table 5 and Table 6, it can be found that population density (permanent population and floating population) is the main factor affecting the risk of the epidemic. Therefore, the way of reducing population density can effectively reduce the risk level of the epidemic and make outstanding contribution to the management of the epidemic, which is also demonstrated in this study. If there is no restriction among individuals, families and cities, the risk of epidemic will increase sharply. Therefore, this study also has theoretical guidance value for epidemic prevention and control.
There is no doubt that there are still many deficiencies and improvements to be made in this study. Although COVID-19 has been brought into efficient control and people’s life has gradually returned to normal, it is still necessary to conduct assessment and analysis more meticulously. To prevent the secondary breakout of COVID-19 more efficiently, especially in winter when the virus will be more active, it is essential to carry out simulation analysis of the global pandemic.
5. Conclusions
The assessment of distribution of COVID-19 risk level is of great practical significance to both the protection of public health security and the sustainable development of urban areas. Using spatial geographical big data such as POI data and Tencent-Yichuxing data, this study assessed the epidemic risk level of COVID-19 and analyzed the main factors that affect the distribution of COVID-19 in Guangzhou as well as the interrelationship among these factors on the basis of combining with logistic regression model and geodetectorgeodictator model. What’s more, the confusion matrix, ROC curve and case study were used to conduct the case verification. Finally, the following conclusions have been obtained:
- (1)
- The high-risk areas are mainly concentrated in the areas with higher density of permanent population such as Haizhu district and Yuexiu district. On the one hand, although COVID-19 has been brought under control in mainland China, regions with high population density and frequent population mobility and interaction are still at high risk of COVID-19. On the other hand, although the policy of home quarantine cuts off the transmission routes among individuals, families and cities, there is still a high probability of COVID-19 infection in densely populated areas. Therefore, the focus of epidemic prevention should be to control the regional population density rationally.
- (2)
- The most influential factor affecting the risk level of epidemic is permanent population, followed by floating population. The interaction between the permanent population and the floating population explains the distribution of the epidemic risk level to the highest degree, indicating that reasonable control of population agglomeration and interaction has a significant effect on the prevention and control of the epidemic. During the epidemic period, the demand of urban population for transportation, catering and life determines the impact of transportation stations, restaurants and living space on the epidemic risk. The density of fever clinics and hotels has a relatively lower impact on the risk of the epidemic, and timely treatment and quarantine could reduce the risk level of the epidemic.
From the perspective of geography, this study explores the different spatial factors that affect the risk level of the epidemic and the correlation between the factors, which plays a certain role in the prevention and control of the epidemic. The conduction of this study firstly can be instrumental in the accurate assessment of areas with higher epidemic risk. Secondly, it can be beneficial to the rational classification of the regional priorities in epidemic prevention. Thirdly, it can be favorable to the prevention and control of COVID-19. Last but not least, it can contribute to providing a responsible approach for maintaining urban public health security and achieving sustainable development of the city.
Author Contributions
Conceptualization, J.Z.; methodology, J.Z. and X.Y.; software, X.Y.; validation, J.Z.; formal analysis, X.Y.; investigation, J.Z. and X.Y.; data curation, X.Y.; writing—original draft, J.Z.; writing—review and editing, X.Y. All authors have read and agreed to the published version of the manuscript.
Funding
This research is supported by the 12th postgraduate research and innovation project of Yunnan University (No.: 2020Z53).
Institutional Review Board Statement
Not applicable.
Informed Consent Statement
Not applicable.
Data Availability Statement
Data Availability doi:10.5281/zenodo.4311215.
Acknowledgments
Thanks to all editors and commenters.
Conflicts of Interest
The authors declare no conflict of interest.
References
- Li, Q.; Tang, B.; Bragazzi, N.L.; Xiao, Y.; Wu, J. Modeling the impact of mass influenza vaccination and public health inter-ventions on COVID-19 epidemics with limited detection capability. Math. Biosci. 2020, 325, 108378. [Google Scholar] [CrossRef]
- De León-Martínez, L.D.; Vega, L.D.L.S.-D.L.; Palacios-Ramírez, A.; Rodriguez-Aguilar, M.; Flores-Ramírez, R. Critical review of social, environmental and health risk factors in the Mexican indigenous population and their capacity to respond to the COVID-19. Sci. Total Environ. 2020, 733, 139357. [Google Scholar] [CrossRef]
- Navinya, C.; Patidar, G.; Phuleria, H.C. Examining Effects of the COVID-19 National Lockdown on Ambient Air Quality across Urban India. Aerosol Air Qual. Res. 2020, 20, 1759–1771. [Google Scholar] [CrossRef]
- Rooij, R.; Aalbers, K.; Hausleitner, B.; Newton, C.; Rocco, R. Education for the resilient city–teaching and learning urban de-sign and planning in COVID-19 times. Proc. Inst. Civ. Eng. Urban Des. Plan. 2020, 173, 119–124. [Google Scholar]
- Chen, Y.; Wang, Y.; Wang, H.; Hu, Z.; Hua, L. Controlling urban traffic-one of the useful methods to ensure safety in Wuhan based on COVID-19 outbreak. Saf. Sci. 2020, 131, 104938. [Google Scholar] [CrossRef]
- Babac, M.B.; Mornar, V. Resetting the Initial Conditions for Calculating Epidemic Spread: COVID-19 Outbreak in Italy. IEEE Access 2020, 8, 148021–148030. [Google Scholar] [CrossRef]
- Kalbusch, A.; Henning, E.; Brikalski, M.P.; de Luca, F.V.; Knorath, A.C. Impact of coronavirus (COVID-19) spread-prevention actions on urban water consumption. Resour. Conserv. Recycl. 2020, 163, 105098. [Google Scholar] [CrossRef]
- Ab Ghani, N.S.; Emrizal, R.; Makmur, H.; Firdaus-Raih, M. Side chain similarity comparisons for integrated drug repositioning and potential toxicity assessments in epidemic response scenarios: The case for COVID-19. Comput. Struct. Biotechnol. J. 2020, 18, 2931–2944. [Google Scholar] [CrossRef]
- Xie, J.; Zhu, Y. Association between ambient temperature and COVID-19 infection in 122 cities from China. Sci. Total Environ. 2020, 724, 138201. [Google Scholar] [CrossRef]
- You, Y.; Pan, S. Urban Vegetation Slows Down the Spread of Coronavirus Disease (COVID-19) in the United States. Geophys. Res. Lett. 2020, 47, e2020GL089286. [Google Scholar] [CrossRef]
- Shao, S.; Zhou, D.; He, R.; Li, J.; Zou, S.; Mallery, K.; Kumar, S.; Yang, S.; Hong, J. Risk assessment of airborne transmission o fCOVID-19 by asymptomatic individuals under dif-ferent practical settings. J. Aerosol Sci. 2021, 151, 105661. [Google Scholar] [CrossRef]
- Ranjan, A.K.; Patra, A.K.; Gorai, A.K. Effect of lockdown due to SARS COVID-19 on aerosol optical depth (AOD) over urban and mining regions in India. Sci. Total Environ. 2020, 745, 141024. [Google Scholar] [CrossRef]
- Chirisa, I.; Mutambisi, T.; Chivenge, M.; Mabaso, E.; Matamanda, A.R.; Ncube, R. The urban penalty ofCOVID-19 lockdowns across the globe: Manifestations and lessons for Anglophone sub-Saharan Africa. GeoJournal 2020, 6, 1–14. [Google Scholar]
- Li, Y.; Wei, D.; Chen, J.; Cao, S.; Zhou, H.; Zhu, Y.; Wu, J.; Lan, L.; Sun, W.; Qian, T.; et al. Efficient and Effective Training of COVID-19 Classification Networks With Self-Supervised Du-al-Track Learning to Rank. IEEE J. Biomed. Health Inform. 2020, 24, 2787–2797. [Google Scholar] [CrossRef]
- Zhao, Z.; Li, X.; Liu, F.; Zhu, G.; Ma, C.; Wang, L. Prediction of the COVID-19 spread in African countries and implications for prevention and controls: A case study in South Africa, Egypt, Algeria, Nigeria, Senegal and Kenya. Sci. Total Environ. 2020, 729, 138959. [Google Scholar] [CrossRef] [PubMed]
- Xia, J.; Zhou, Y.; Li, Z.; Li, F.; Yue, Y.; Cheng, T.; Li, Q. COVID-19 risk assessment driven by urban spatiotemporal big data: A case study of Guang-dong-Hong Kong-Macao Greater Bay Area. Acta Geod. Cartogr. Sin. 2020, 49, 671–680. [Google Scholar]
- Martorell-Marugán, J.; Villatoro-García, J.A.; García-Moreno, A.; López-Domínguez, R.; Requena, F.; Merelo, J.J.; Lacasaña, M.; Luna, J.D.; Díaz-Mochón, J.J.; Lorente, J.A.; et al. DatAC: A visual analytics platform to explore climate and air quality indicators associated with the COVID-19 pandemic in Spain. Sci. Total Environ. 2020, 750, 141424. [Google Scholar] [CrossRef]
- Tran, B.X.; Nguyen, H.T.; Hai, Q.P.; Le, H.T.; Ho, C.M. Capacity of local authority and community on epidemic response in Vietnam: Im-plication for COVID-19 preparedness. Saf. Sci. 2020, 130, 104867. [Google Scholar] [CrossRef]
- Yang, Z.J.; He, X.; Sui, X.; Zhang, J. Analysis of the Evolution of Urban Center Space Based on POI: A Case Study of Main Area in Kunming. Urban Dev. Stud. 2019, 26, 31–35. [Google Scholar]
- Yang, Z.J.; He, X.; Zhang, K.; Zhang, J. Analysis of the correlation between takeaway and urban space from the perspective of POI: A case study of main area in Kunming. Urban Dev. Stud. 2020, 27, 13–17. [Google Scholar]
- Zhang, J.; He, X.; Yuan, X.D. Research on the relationship between Urban economic development level and urban spatial structure—A case study of two Chinese cities. PLoS ONE 2020, 15, e0235858. [Google Scholar]
- Zhang, J.; Sui, X.; He, X. Research on the Simulation Application of Data Mining in Urban Spatial Structure. J. Adv. Transp. 2020, 2020. [Google Scholar] [CrossRef]
- Liu, J.; Deng, Y.; Wang, Y.; Huang, H.; Du, Q.; Ren, F. Urban Nighttime Leisure Space Mapping with Nighttime Light Images and POI Data. Remote Sens. 2020, 12, 541. [Google Scholar] [CrossRef]
- Lai, J.; Pan, J. China′s City Network Structural Characteristics Based on Population Flow during Spring Festival Travel Rush: Empirical Analysis of “Tencent Migration” Big Data. J. Urban Plan. Dev. 2020, 146, 04020018. [Google Scholar] [CrossRef]
- Xia, N.; Cheng, L.; Li, M.C. Mapping urban areas using a combination of remote sensing and geolocation data. Remote Sens. 2019, 11, 1470. [Google Scholar] [CrossRef]
- Lou, G.; Chen, Q.; He, K.; Zhou, Y.; Shi, K. Using Nighttime Light Data and POI Big Data to Detect the Urban Centers of Hangzhou. Remote Sens. 2019, 11, 1821. [Google Scholar] [CrossRef]
- Zhang, X.; Du, S.; Wang, Q. Hierarchical semantic cognition for urban functional zones with VHR satellite images and POI data. ISPRS J. Photogramm. Remote Sens. 2017, 132, 170–184. [Google Scholar] [CrossRef]
- Santos, F.; Almeida, A.; Martins, C.; Gonçalves, R.; Martins, J. Using POI functionality and accessibility levels for delivering personalized tourism recommendations. Comput. Environ. Urban Syst. 2019, 77, 101173. [Google Scholar] [CrossRef]
- Li, J.; Long, Y.; Dang, A. Live-Work-Play Centers of Chinese cities: Identification and temporal evolution with emerging data. Comput. Environ. Urban Syst. 2018, 71, 58–66. [Google Scholar] [CrossRef]
- Zhou, Y.F.; Yang, J.W.; Zhou, J.P.; Zhou, P.L.; Liu, H.T. Evaluating Vitality of Metro Station Service Area with Heat Map: A Case Study on Shenzhen Subway. Beijing Da Xue Xue Bao 2020, 56, 875–883. [Google Scholar]
- Wei, S.; Wang, L.; Fu, X.; Jia, T. Using Open Big Data to Build and Analyze Urban Bus Network Models within and across Ad-ministrations. Complexity 2020, 2020, 5402620. [Google Scholar] [CrossRef]
- Sun, L.; Tang, L.; Shao, G.; Qiu, Q.; Lan, T.; Shao, J. A Machine Learning-Based Classification System for Urban Built-Up Areas Using Multiple Classifiers and Data Sources. Remote Sens. 2020, 12, 91. [Google Scholar] [CrossRef]
- Yin, H.; Wang, W.; Wang, H.; Chen, L. Spatial-aware hierarchical collaborative deep learning for POI recommendation. IEEE Trans. Knowl. Data Eng. 2017, 29, 2537–2551. [Google Scholar] [CrossRef]
- Zhang, J.; Yuan, X.D.; Lin, H. The Extraction of Urban Built-up Areas by Integrating Night-time Light and POI Data—A Case Study of Kunming, China. IEEE Access. 2021, 22417–22429. [Google Scholar] [CrossRef]
- Fu, Y.; Liu, G.; Ge, Y.; Wang, P.; Zhu, H.; Li, C.; Xiong, H. Representing urban forms: A collective learning model with heterogeneous human mobility data. IEEE Trans. Knowl. Data Eng. 2018, 31, 535–548. [Google Scholar] [CrossRef]
- He, X.; Zhou, C.; Zhang, J.; Yuan, X.D. Using Wavelet Transforms to Fuse Nighttime Light Data and POI Big Data to Extract Urban Built-Up Areas. Remote Sens. 2020, 12, 3887. [Google Scholar] [CrossRef]
- Zuo, J.; Meng, L.; Li, C.; Zhang, H.; Zeng, Y.; Dong, J. Construction of community life circle database based on high-resolution remote sensing technology and multi-source data fusion. Eur. J. Remote Sens. 2020, 222–237. [Google Scholar] [CrossRef]
- Zhou, J.; Liu, T.; Zou, L. Design of machine learning model for urban planning and management improvement. Int. J. Perform. Eng. 2020, 16, 958. [Google Scholar]
- Ye, Y.; Richards, D.; Lu, Y.; Song, X.; Zhuang, Y.; Zeng, W.; Zhong, T. Measuring daily accessed street greenery: A human-scale approach for informing better urban planning practices. Landsc. Urban Plan. 2019, 191, 103434. [Google Scholar] [CrossRef]
- Kim, S.; Park, D.; Heo, T.Y.; Kim, H.; Hong, D. Estimating vehicle miles traveled (VMT) in urban areas using regression kriging. J. Adv. Transp. 2016, 50, 769–785. [Google Scholar] [CrossRef]
- Li, H.; Liu, Y.; He, Q.; Peng, X.; Yin, C. Simulating urban cooperative expansion in a single-core metropolitan region based on improved CA model integrated information flow: Case study of Wuhan urban agglomeration in China. J. Urban Plan. Dev. 2018, 144, 05018002. [Google Scholar] [CrossRef]
- Siddiqui, A.; Siddiqui, A.; Maithani, S.; Jha, A.K.; Kumar, P.; Srivastav, S.K. Urban growth dynamics of an Indian metropolitan using CA Markov and Logistic Regression. Egypt. J. Remote Sens. Space Sci. 2018, 21, 229–236. [Google Scholar] [CrossRef]
- Fang, A.; Chen, W.; Dong, J. CA simulation and verification of cultivated land planning based on land suitability. Trans. Chin. Soc. Agric. Eng. 2017, 33, 219–225. [Google Scholar]
- Zhou, L.; Dang, X.; Sun, Q.; Wang, S. Multi-scenario simulation of urban land change in Shanghai by random forest and CA-Markov model. Sustain. Cities Soc. 2020, 55, 102045. [Google Scholar] [CrossRef]
- Ghosh, S.; Das Chatterjee, N.; Dinda, S. Urban ecological security assessment and forecasting using integrated DEMATEL-ANP and CA-Markov models: A case study on Kolkata Metropolitan Area, India. Sustain. Cities Soc. 2021, 68, 102773. [Google Scholar] [CrossRef]
- Radwan, T.M.; Blackburn, G.A.; Whyatt, J.D.; Atkinson, P.M. Dramatic loss of agricultural land due to urban expansion threatens food security in the Nile Delta, Egypt. Remote Sens. 2019, 11, 332. [Google Scholar] [CrossRef]
- Bai, L.; Jiang, L.; Yang, D.-Y.; Liu, Y.-B. Quantifying the spatial heterogeneity influences of natural and socioeconomic factors and their interactions on air pollution using the geographical detector method: A case study of the Yangtze River Economic Belt, China. J. Clean. Prod. 2019, 232, 692–704. [Google Scholar] [CrossRef]
- Hu, M.G.; Wang, J.F. A meteorological network optimization package using MSN theory. Environ. Model. Softw. 2011, 26, 546–548. [Google Scholar] [CrossRef]
- Xu, C.D.; Wang, J.F.; Hu, M.G.; Li, Q.X. Interpolation of missing temperature data at meteorological stations using P-BSHADE. J. Clim. 2013, 26, 7452–7463. [Google Scholar] [CrossRef]
- Wang, J.F.; Hu, M.G.; Xu, C.D.; Christakos, G.; Zhao, Y. Estimation of citywide air pollution in Beijing. PLoS ONE 2013, 8, e53400. [Google Scholar] [CrossRef]
- Wang, J.F.; Haining, R.; Liu, T.J.; Li, L.F.; Jiang, C.S. Sandwich estimation for multi-unit reporting on a stratified heterogeneous surface. Environ. Plan. A 2013, 45, 2515–2534. [Google Scholar] [CrossRef]
- Luo, L.; Mei, K.; Qu, L.; Zhang, C.; Chen, H.; Wang, S.; Di, D.; Huang, H.; Wang, Z.; Xia, F. Assessment of the Geographical Detector Method for investigating heavy metal source appor-tionment in an urban watershed of Eastern China. Sci. Total Environ. 2019, 653, 714–722. [Google Scholar] [CrossRef]
- Abidin, S.Z.; Jamaluddin, M.N.F.; Abiden, M.Z. Introducing an intelligent computerized tool to detect and predict urban growth pattern. WSEAS Trans. Comput. 2010, 9, 604–613. [Google Scholar]
- Ye, Y.; Bryan, B.A.; Connor, J.D.; Chen, L.; Zhong, Q.; He, M. Changes in land-use and ecosystem services in the Guangzhou-Foshan Metropolitan Ar-ea, China from 1990 to 2010: Implications for sustainability under rapid urbanization. Ecol. Indic. 2018, 93, 930–941. [Google Scholar] [CrossRef]
- Wu, X.; Hou, L.; Wen, Y.; Liu, W.; Wu, Z. Research on the relationship between causal factors and consequences of incidents occurred in tank farm using ordinal logistic regression. J. Loss Prev. Process Ind. 2019, 61, 287–297. [Google Scholar] [CrossRef]
- Xu, X.K.; Wen, C.; Zhuang, G.Y.; Sun, H.C.; Liu, B.; Wang, X.W. The geographical destination distribution and effect of outflow population of Wuhan when the outbreak of the 2019-nCoV Pneumonia. J. Univ. Electron. Sci. Technol. 2020, 49, 1–6. [Google Scholar]
- Radulescu, C.V.; Ladaru, G.R.; Burlacu, S.; Constantin, F.; Petre, I.L. Impact of the COVID-19 Pandemic on the Romanian Labor Market. Sustainability 2020, 13, 271. [Google Scholar] [CrossRef]
- Kim, H. Lesson Learned from the Power of Open Data: Resolving the Mask Shortage Problem Caused by COVID-19 in South Korea. Sustainability 2020, 13, 278. [Google Scholar] [CrossRef]
- Li, Y. Towards concentration and decentralization: The evolution of urban spatial structure of Chinese cities, 2001–2016. Comput. Environ. Urban Syst. 2020, 80, 101425. [Google Scholar] [CrossRef]
- He, J.; Li, C.; Yu, Y.; Liu, Y.; Huang, J. Measuring urban spatial interaction in Wuhan Urban Agglomeration, Central China: A spatially explicit approach. Sustain. Cities Soc. 2017, 32, 569–583. [Google Scholar] [CrossRef]
- Li, X. Recognition of Urban Polycentric Structure Based on Spatial Aggregation Characteristics of POI Elements: A Case of Zhengzhou City. Beijing Da Xue Xue Bao 2020, 56, 692–702. [Google Scholar]
- Zhou, T.; Huang, S.; Cheng, J.; Xiao, Y. The Distance Teaching Practice of Combined Mode of Massive Open Online Course Mi-cro-Video for Interns in Emergency Department During the COVID-19 Epidemic Period. Telemed. e-Health 2020, 26, 584–588. [Google Scholar] [CrossRef]
- Nuraeni, L.; Purwasih, R.; Mutakim, J. IKIP Siliwangi Student′s Perceptions of Online Teaching and Learning Process During COVID-19 Pandemic? J. Phys. Conf. Ser. 2020, 1657, 012084. [Google Scholar] [CrossRef]
- Fengwei, A.; Nan, W. Integration of urban-rural planning and human geography for online education under the impact of COVID-19. J. Intell. Fuzzy Syst. (Prepr.) 2020, 39, 8847–8855. [Google Scholar] [CrossRef]
- McGinlay, J.; Gkoumas, V.; Holtvoeth, J.; Fuertes, R.F.A.; Jones, N. The impact of COVID-19 on the management of european protected areas and policy implications. Forests 2020, 11, 1214. [Google Scholar] [CrossRef]
- Silva, A.L.P.; Prata, J.C.; Walker, T.R.; Campos, D.; Duarte, A.C.; Soares, A.M.V.M.; Barcelò, D.; Rocha-Santos, T. Rethinking and optimising plastic waste management under COVID-19 pandemic: Policy solutions based on redesign and reduction of single-use plastics and personal protective equipment. Sci. Total Environ. 2020, 742, 140565. [Google Scholar] [CrossRef] [PubMed]
- Lu, S. School+ family community learning model of PE course under COVID-19 epidemic situation. Int. J. Emerg. Technol. Learn. (IJET) 2020, 15, 218–233. [Google Scholar] [CrossRef]
- Chen, Z.; Hao, X.; Zhang, X.; Chen, F. Have traffic restrictions improved air quality? A shock from COVID-19. J. Clean. Prod. 2021, 279, 123622. [Google Scholar] [CrossRef]
- Lei, B.; Liu, X.; Cao, Z.; Hao, Y.; Zhang, Y.; Chen, X. Modeling and forecasting of COVID-19 spread in urban rail transit system. J. Traffic Transp. Eng. 2020, 3, 139–149. [Google Scholar] [CrossRef]
- Tien, B.D.; Khosravi, K.; Shahabi, H.; Daggupati, P.; Lee, S. Flood spatial modeling in northern Iran using remote sensing and gis: A compari-son between evidential belief functions and its ensemble with a multivariate logistic regression model. Remote Sens. 2019, 11, 1589. [Google Scholar] [CrossRef]
- Wang, S.; Yu, D.; Ma, X.; Xing, X. Analyzing urban traffic demand distribution and the correlation between traffic flow and the built environment based on detector data and POIs. Eur. Transp. Res. Rev. 2018, 10, 50. [Google Scholar] [CrossRef]
- Huang, G.; Pan, Q.; Zhao, S.; Gao, Y.; Gao, X. Prediction of COVID-19 Outbreak in China and Optimal Return Date for University Stu-dents Based on Propagation Dynamics. J. Shanghai Jiaotong Univ. (Sci.) 2020, 25, 140–146. [Google Scholar] [CrossRef] [PubMed]
- Yang, B.; Li, W.; Wang, J.; Tian, Z.; Cheng, X.; Zhang, Y.; Qiu, R.; Hou, S.; Guo, H. Estimation of the potential spread risk of COVID-19: Occurrence assessment along the Yangtze, Han, and Fu River basins in Hubei, China. Sci. Total. Environ. 2020, 746, 141353. [Google Scholar] [CrossRef] [PubMed]
- Zhang, X.; Ji, Z.; Yue, Y.; Liu, H.; Wang, J. Infection risk assessment of COVID-19 through aerosol transmission: A case study of South China Sea-food Market. Environ. Sci. Technol. 2020. [Google Scholar] [CrossRef] [PubMed]
- Collins, A.; Florin, M.-V.; Renn, O. COVID-19 risk governance: Drivers, responses and lessons to be learned. J. Risk Res. 2020, 23, 1073–1082. [Google Scholar] [CrossRef]
- Sangiorgio, V.; Parisi, F. A multicriteria approach for risk assessment of COVID-19 in urban district lockdown. Saf. Sci. 2020, 130, 104862. [Google Scholar] [CrossRef]
- Venkatesh, V. Impacts of COVID-19: A research agenda to support people in their Figureht. Int. J. Inf. Manag. 2020, 55, 102197. [Google Scholar] [CrossRef]
- Ren, H.; Zhao, L.; Zhang, A.; Song, L.; Cui, C. Early forecasting of the potential risk zones of COVID-19 in China’s megacities. Sci. Total Environ. 2020, 729, 138995. [Google Scholar] [CrossRef]
- Asteris, P.G.; Douvika, M.G.; Karamani, C.A.; Skentou, A.; Chlichlia, K.; Cavaleri, L.; Daras, T.; Armaghani, D.J.; Zaoutis, T.E. A novel heuristic algorithm for the modeling and risk assessment of the COVID-19 pandemic phenomenon. Comput. Model. Eng. Sci. 2020, 125, 815–828. [Google Scholar] [CrossRef]


Publisher’s Note: MDPI stays neutral with regard to jurisdictional claims in published maps and institutional affiliations. |
© 2021 by the authors. Licensee MDPI, Basel, Switzerland. This article is an open access article distributed under the terms and conditions of the Creative Commons Attribution (CC BY) license (https://creativecommons.org/licenses/by/4.0/).