
Tourism and Air Quality during COVID-19 Pandemic: Lessons for the Future

 ,
, 

 ,
,  ,
,  ,
,  ,
,  ,
,  and
and 
Abstract
1. Introduction
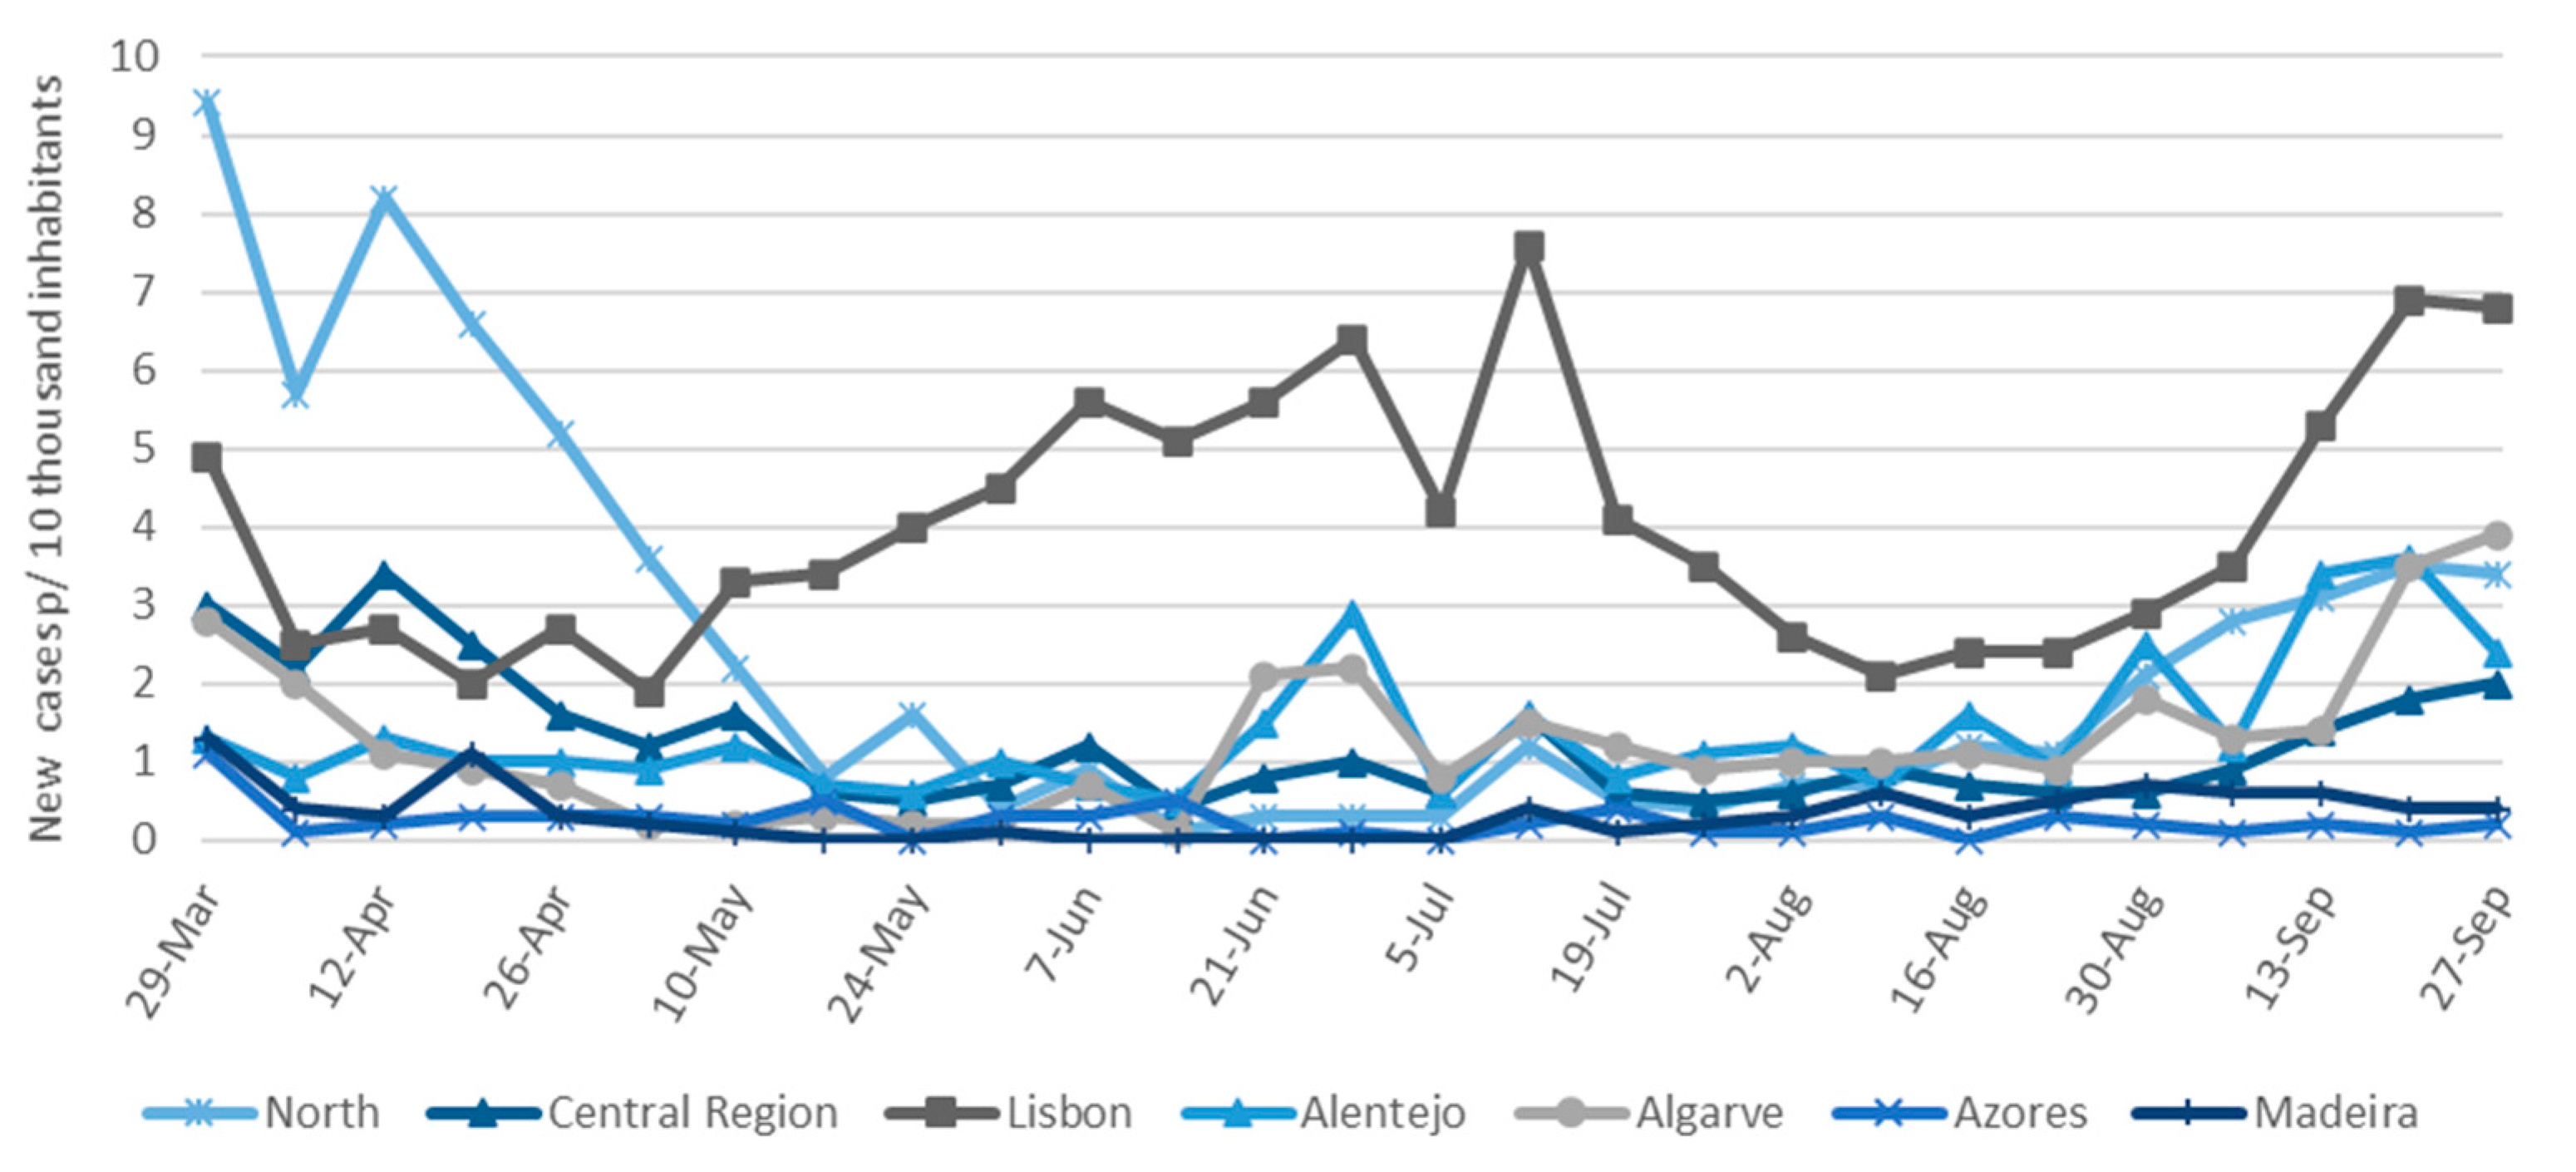
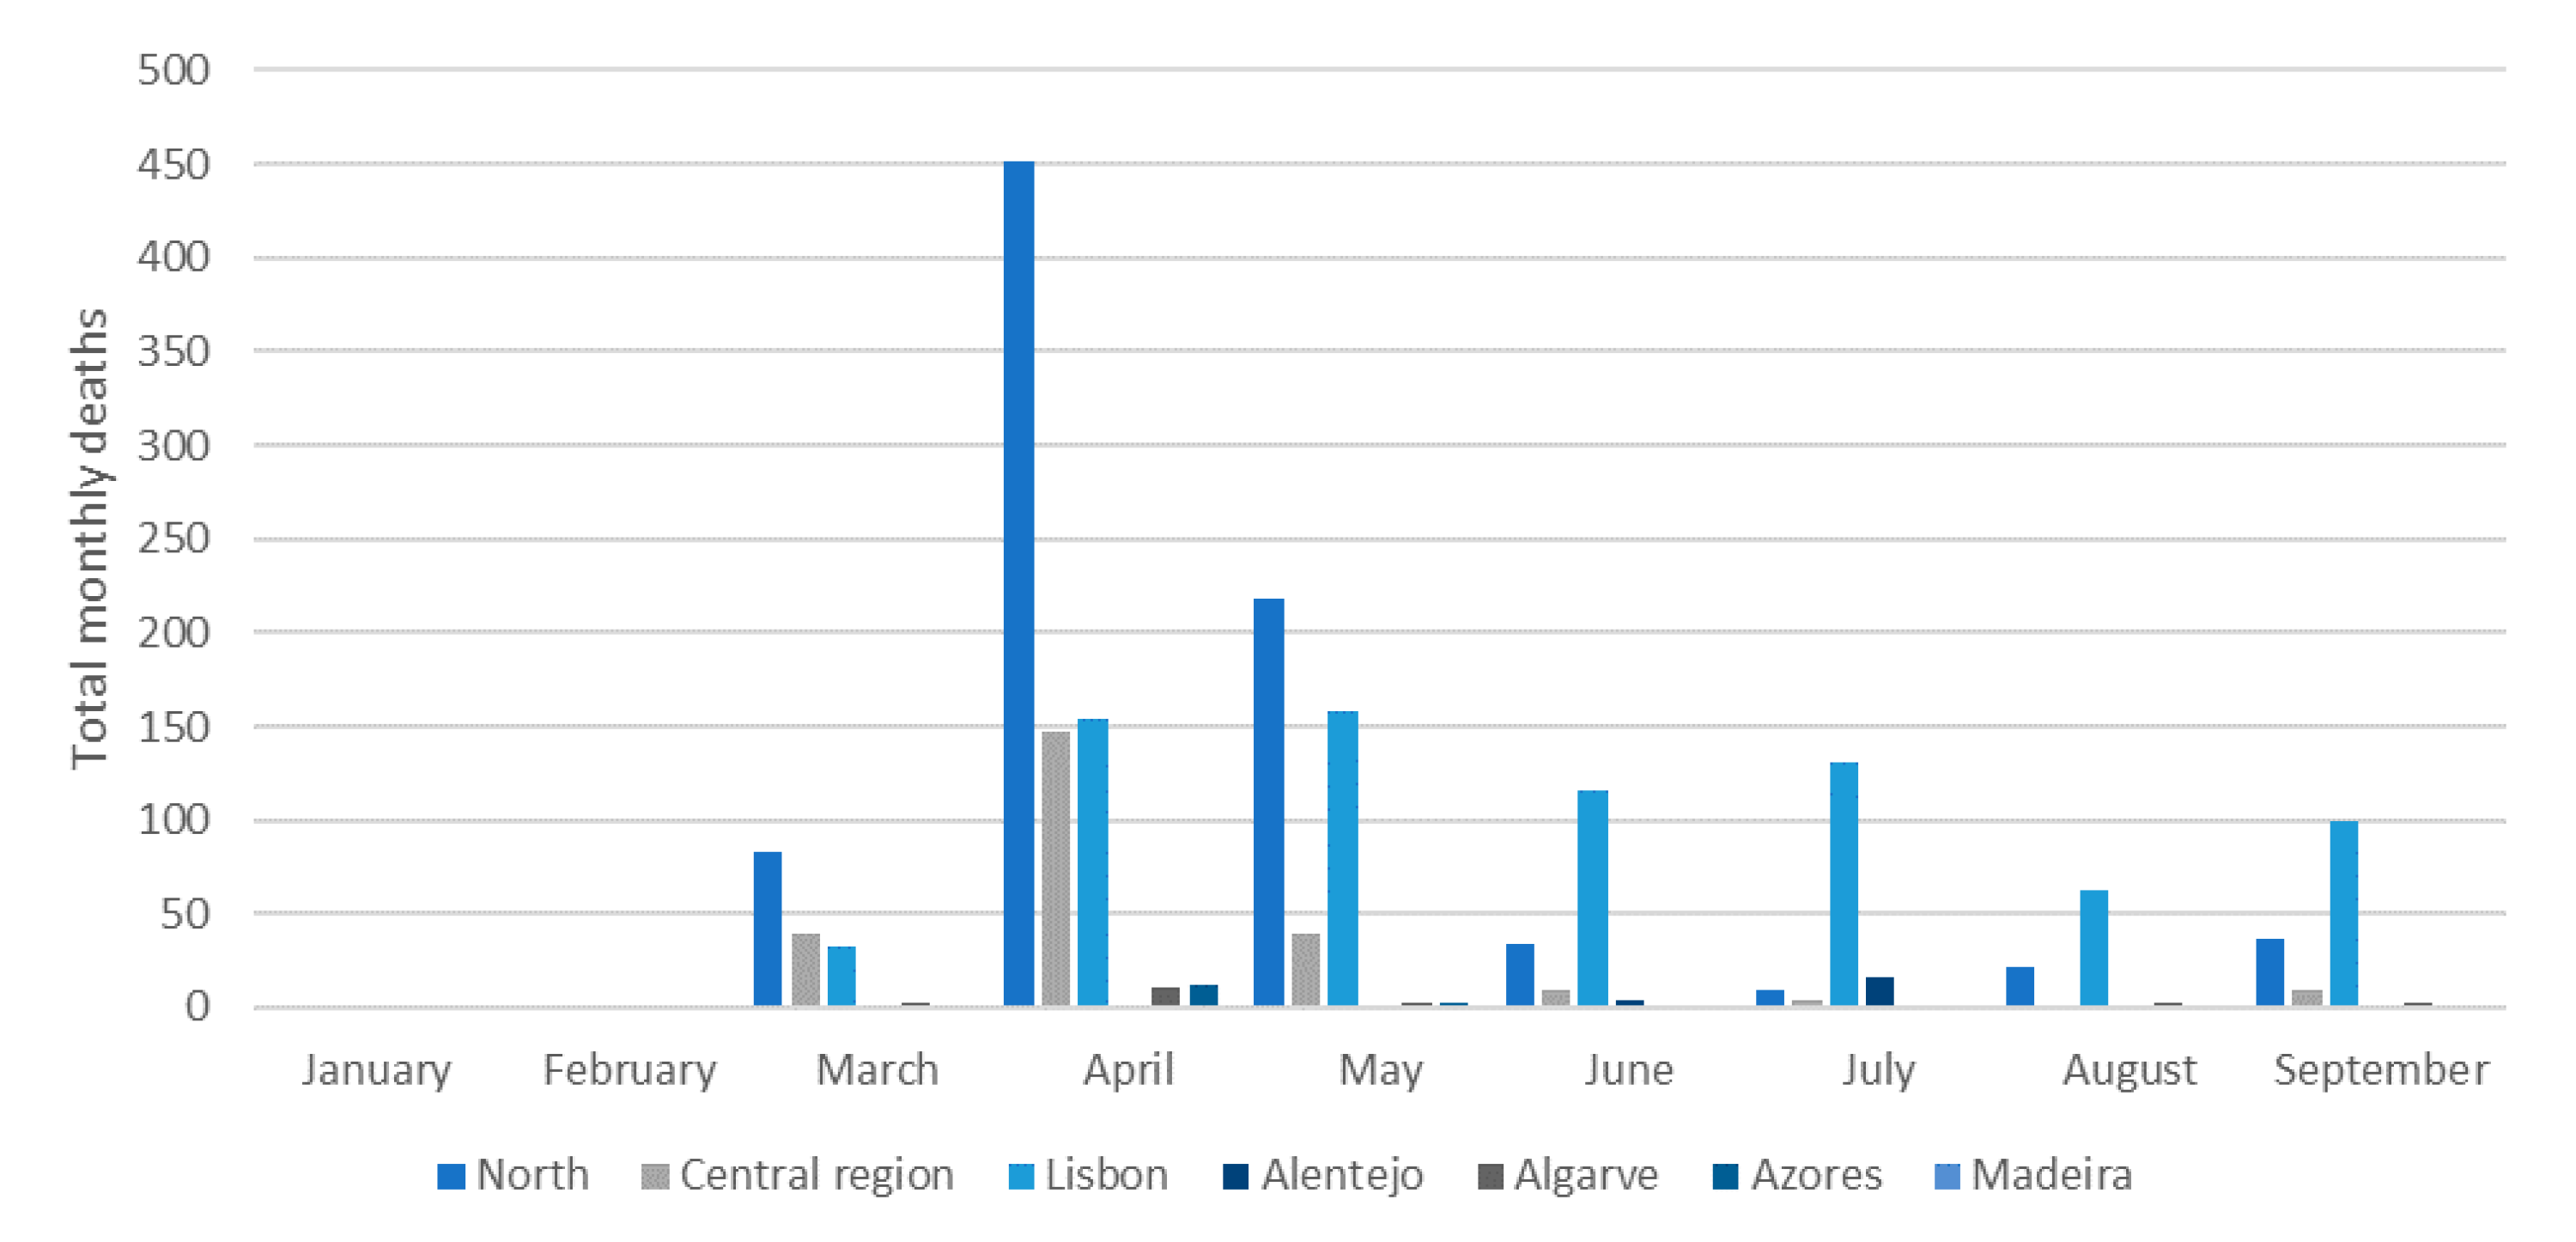
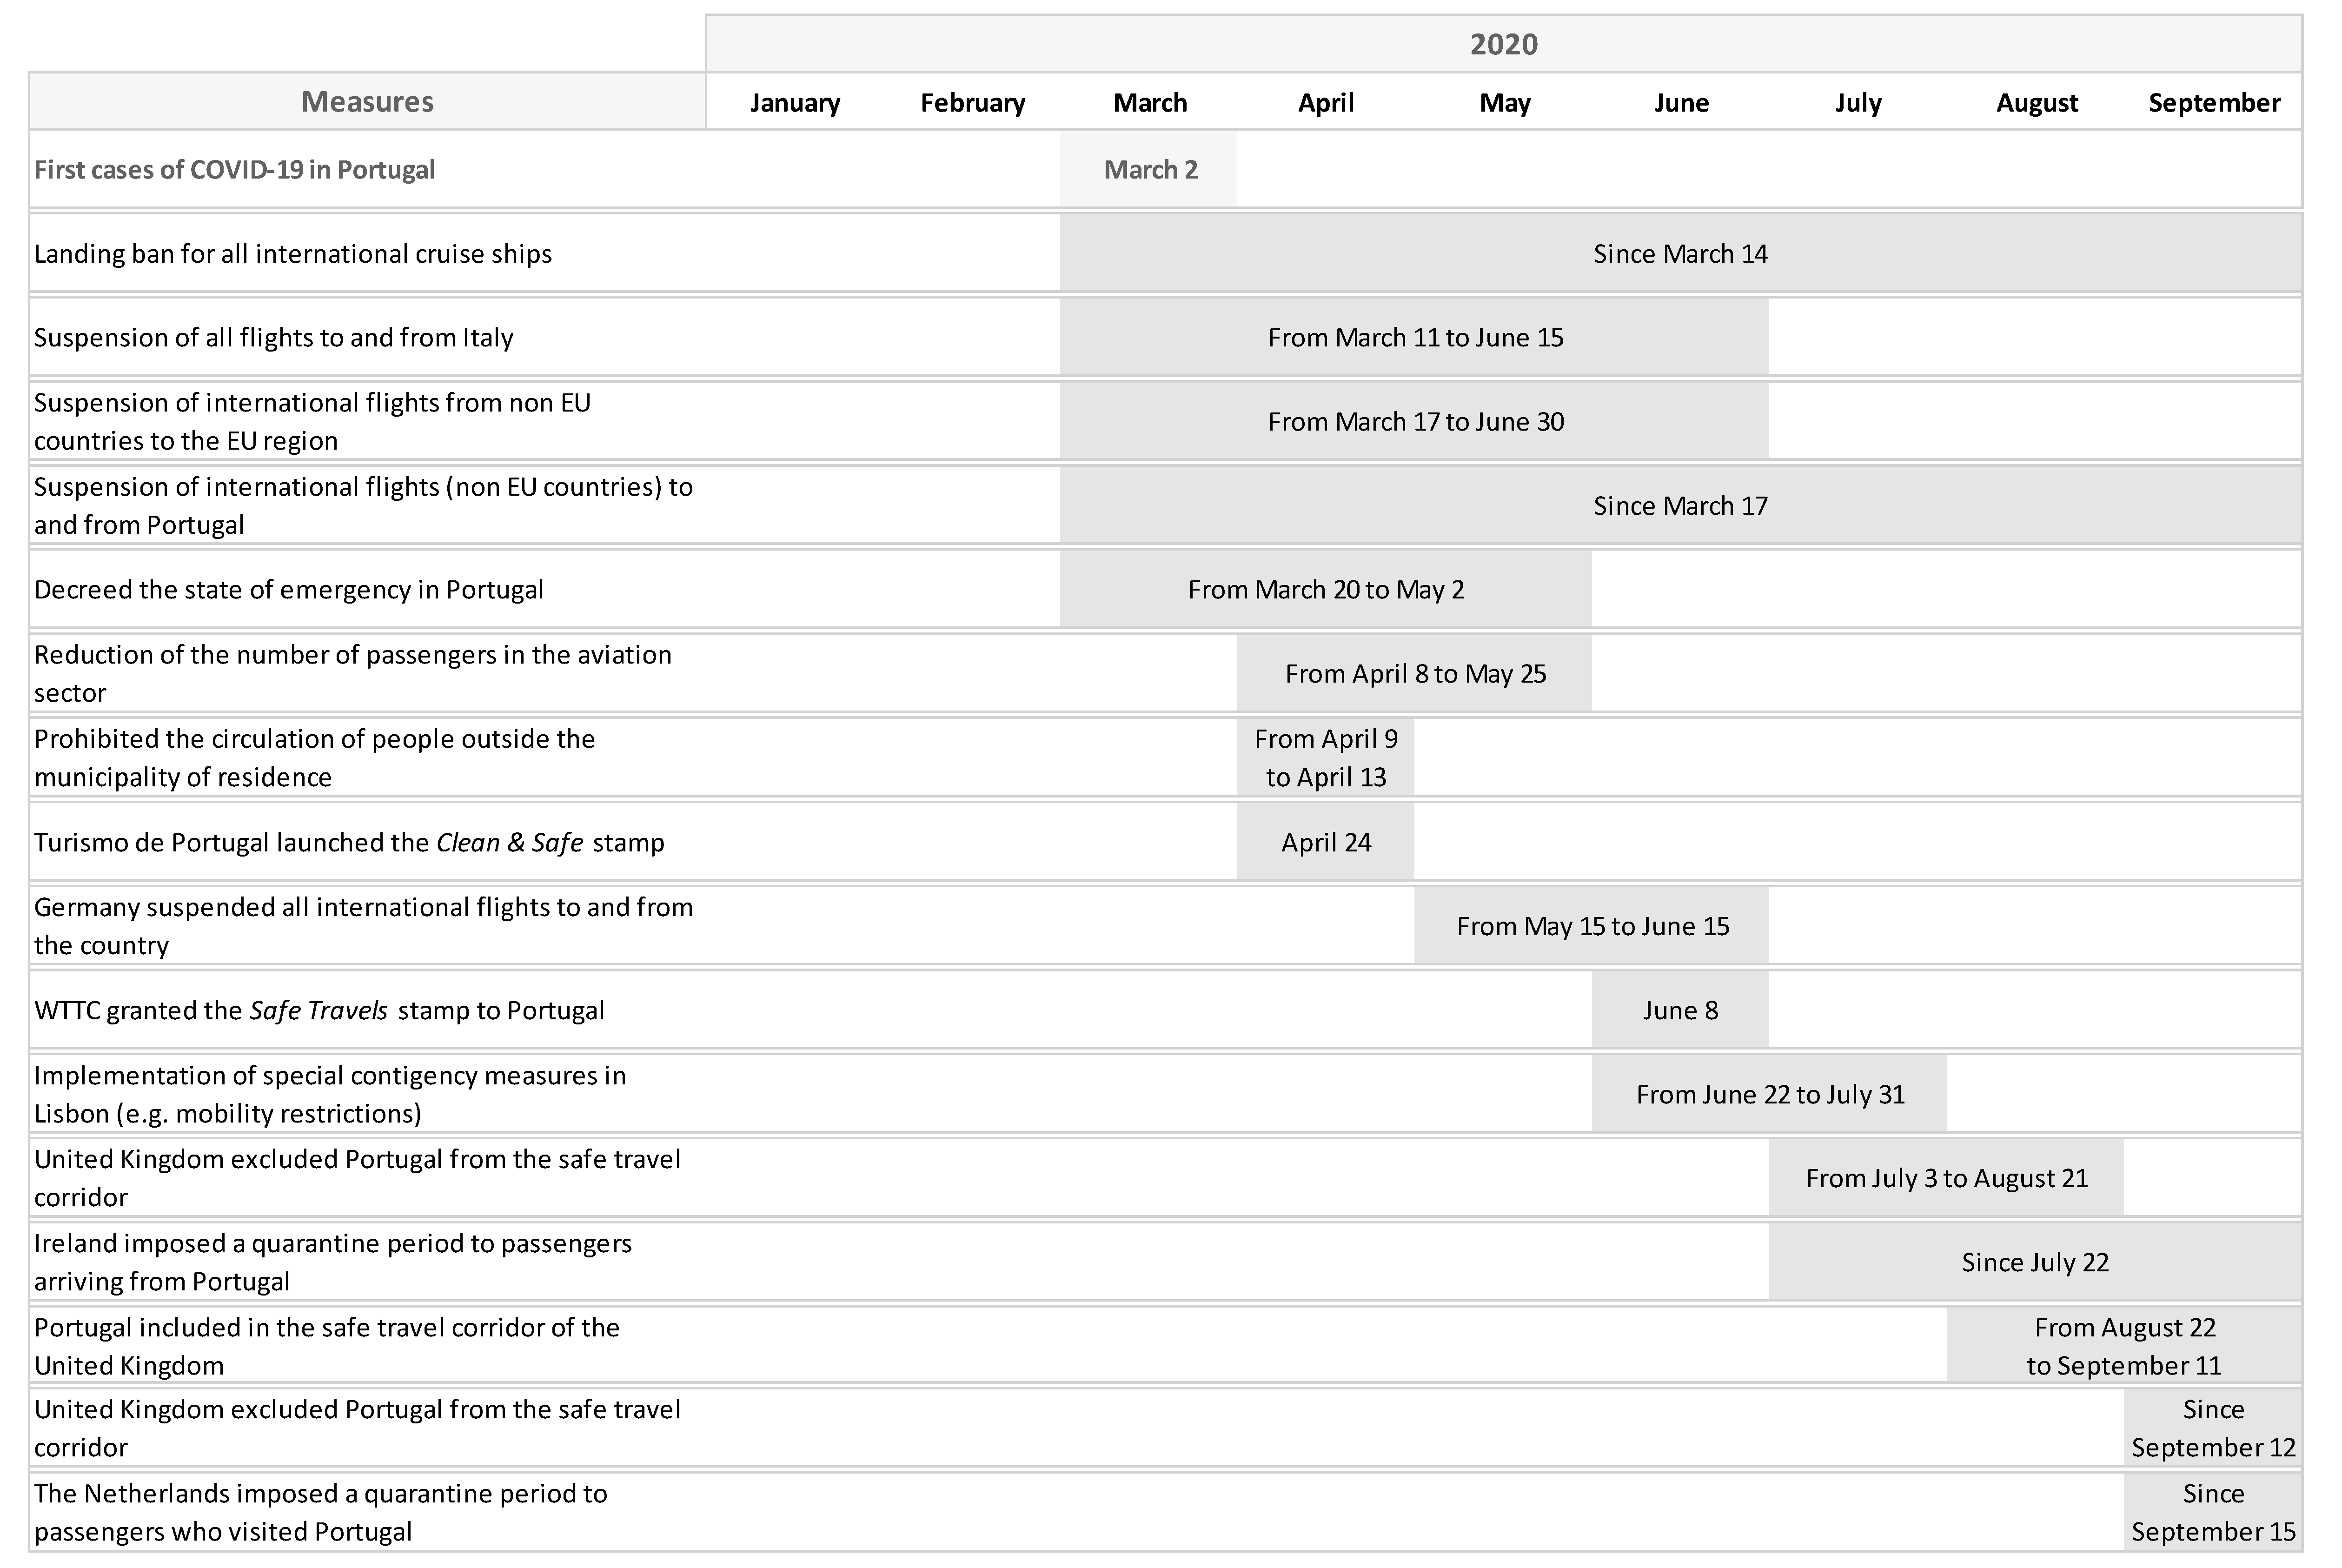
2. The Evolution of COVID Pandemic in Portugal
3. Impact of COVID-19 on Tourism Activity
3.1. Analysis per Region
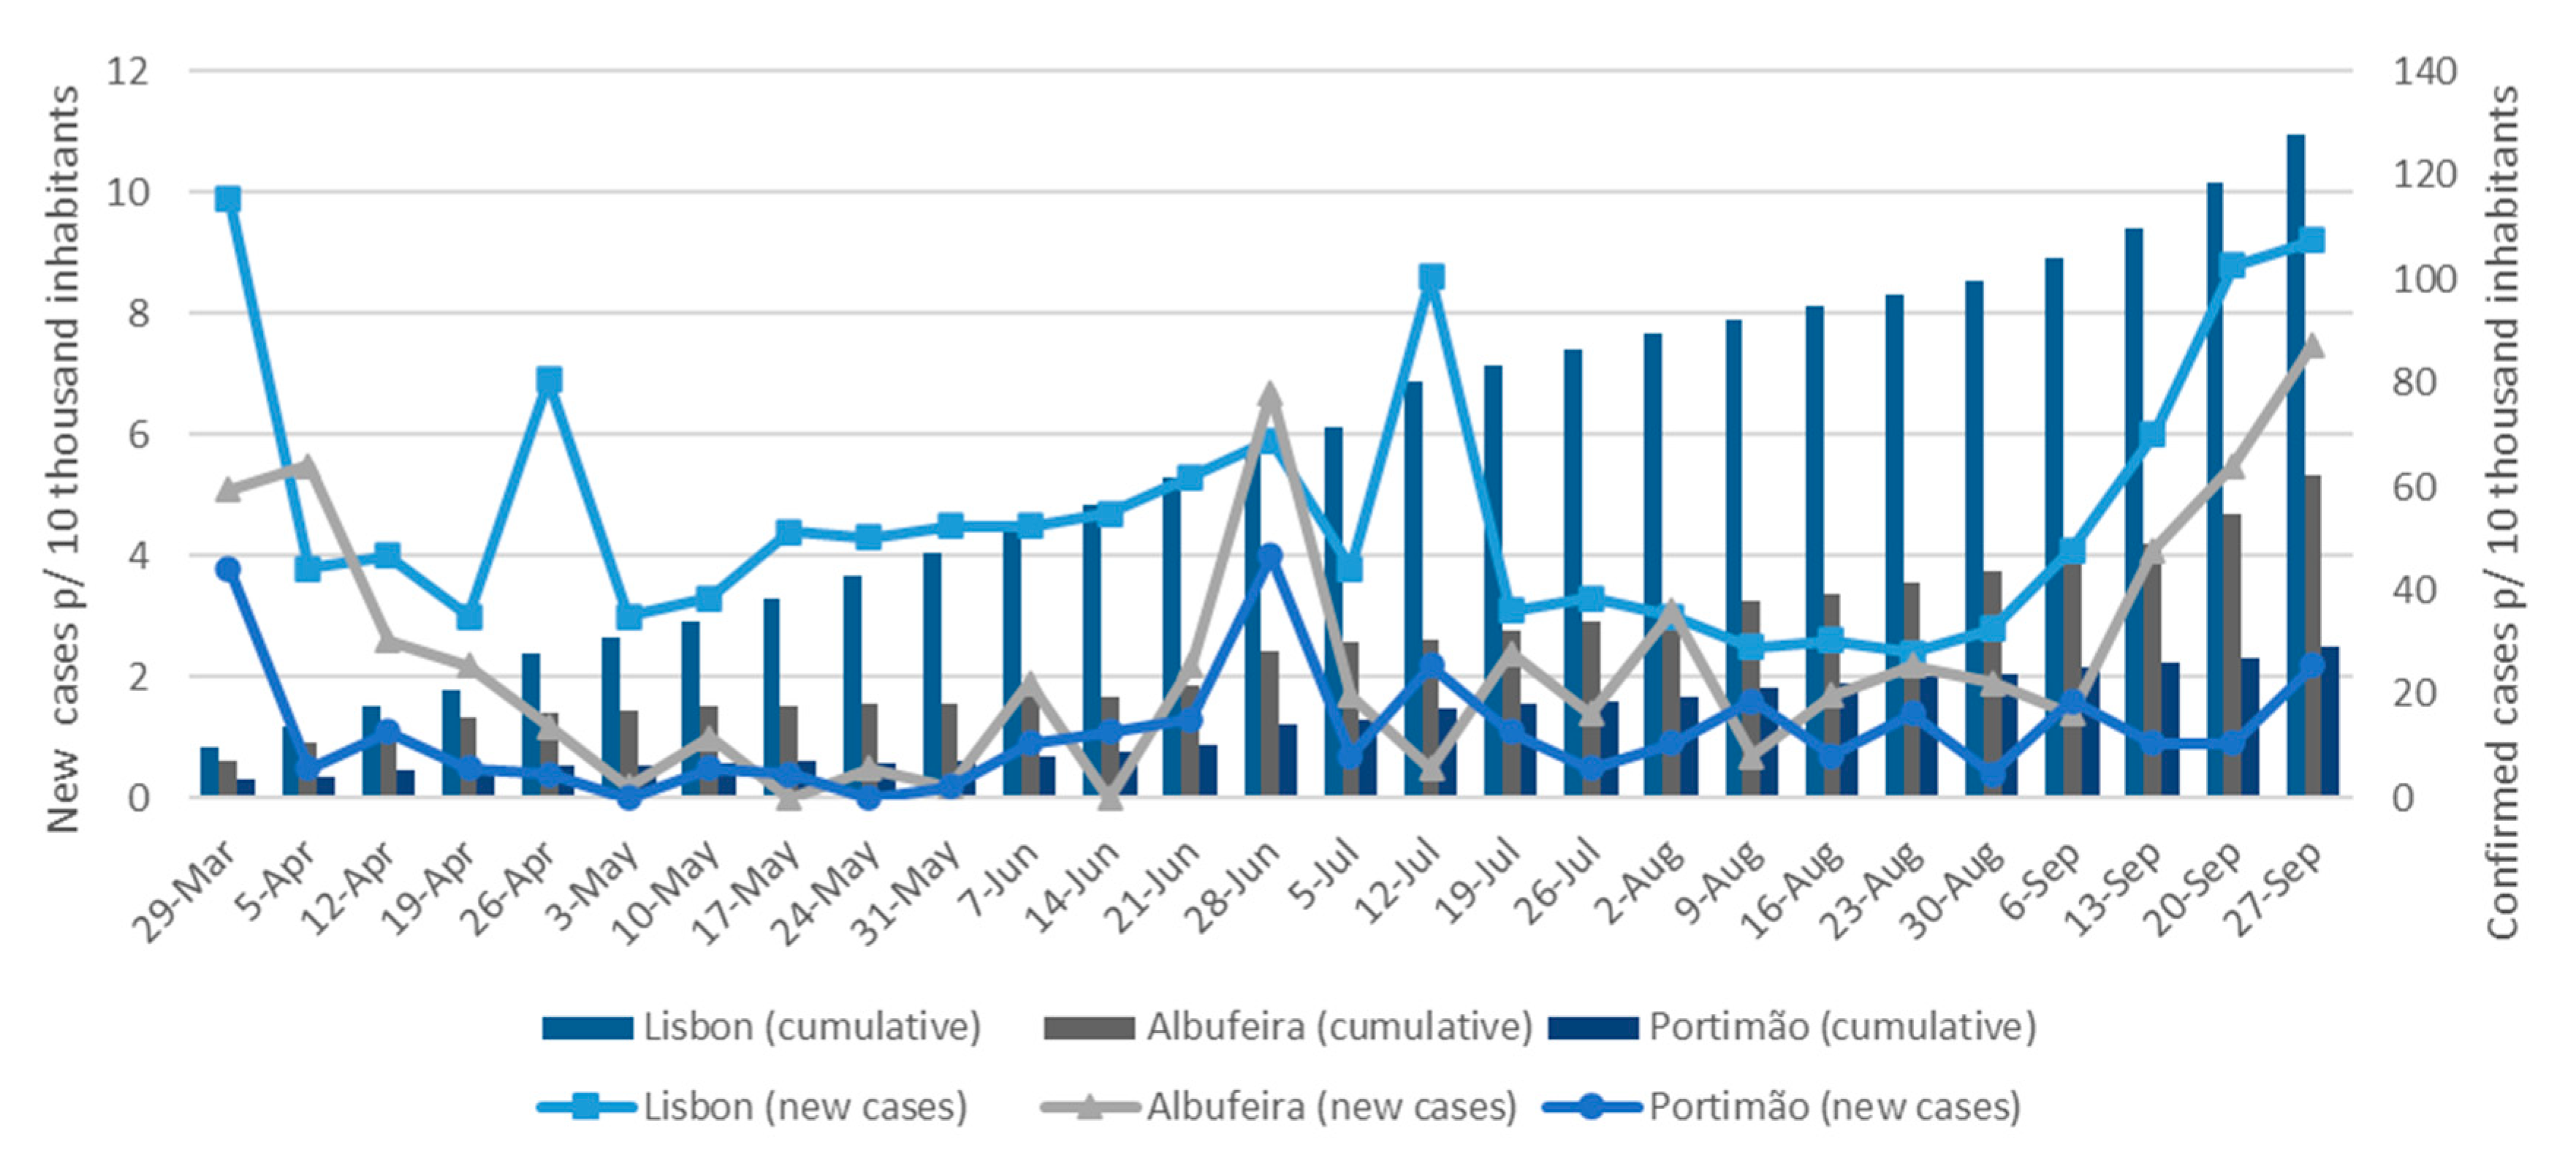
3.2. Analysis per Municipality
4. Impact of COVID-19 on Air Quality
4.1. Air Quality Improvement from the COVID-19 Lockdown
4.2. Air Quality Impacts on Human Health and Cost–Benefit Analysis
- HI(p) represents the number of unfavorable implications (cases of the disease, deaths) over all health indicators (i = 1, …, n) avoided, or not, due to pollutant exposure;
- P(p,i) is the population at risk associated with the RR;
- I(i) corresponds to the baseline incidence/prevalence rate of a specific health indicator i (expressed as the number of new cases per 100,000 individuals per year).
5. Lessons Learned and Future Reflection
5.1. New Concepts of Tourism Connected to the Environment
- slow tourism, with longer stays at destinations with less and frequent traveling;
- tourism focused on small-scale and local resources, and on environmentally conscious behaviors;
- more individual tourism, looking for some isolation to experience nature and the environment;
- in case of urban tourism, more sustainable options should be prioritized, with less impact on the environment (namely with sustainable mobility options, environmentally friendly accommodation and a higher ecological footprint).
5.2. Tourism 4.0
5.3. Growth of Domestic Market
5.4. Mitigation of the Over-Tourism Problem
5.5. Using Air Quality as a New Attractiveness Criterion of Tourism Destinations
6. Conclusions
Author Contributions
Funding
Institutional Review Board Statement
Informed Consent Statement
Data Availability Statement
Acknowledgments
Conflicts of Interest
References
- OECD. OECD Economic Outlook; OECD Publishing: Paris, France, 2020; Volume 2020. [Google Scholar]
- Everingham, P.; Chassagne, N. Post COVID-19 ecological and social reset: Moving away from capitalist growth models towards tourism as Buen Vivir. Tour. Geogr. 2020, 22, 555–566. [Google Scholar] [CrossRef]
- Niewiadomski, P. COVID-19: From temporary de-globalisation to a re-discovery of tourism? Tour. Geogr. 2020, 22, 651–656. [Google Scholar] [CrossRef]
- Abu Bakar, N.; Rosbi, S. Effect of Coronavirus disease (COVID-19) to tourism industry. Int. J. Adv. Eng. Res. Sci. 2020, 7, 189–193. [Google Scholar] [CrossRef]
- Brouder, P. Reset redux: Possible evolutionary pathways towards the transformation of tourism in a COVID-19 world. Tour. Geogr. 2020, 22, 484–490. [Google Scholar] [CrossRef]
- Crossley, É. Ecological grief generates desire for environmental healing in tourism after COVID-19. Tour. Geogr. 2020, 22, 536–546. [Google Scholar] [CrossRef]
- Deb, S.K.; Nafi, S.M. Impact of COVID-19 Pandemic on Tourism: Perceptions from Bangladesh. SSRN Electron. J. 2020. [Google Scholar] [CrossRef]
- Farzanegan, M.R.; Gholipour, H.F.; Feizi, M.; Nunkoo, R.; Andargoli, A.E. International Tourism and Outbreak of Coronavirus (COVID-19): A Cross-Country Analysis. J. Travel Res. 2021, 60, 687–692. [Google Scholar] [CrossRef]
- Folinas, S.; Metaxas, T. Tourism: The great patient of coronavirus COVID-2019. Int. J. Adv. Res. 2020, 08, 365–375. [Google Scholar] [CrossRef]
- Fernandes, N. Economic Effects of Coronavirus Outbreak (COVID-19) on the World Economy. SSRN Electron. J. 2020. [Google Scholar] [CrossRef]
- Gössling, S.; Scott, D.; Hall, C.M. Pandemics, tourism and global change: A rapid assessment of COVID-19. J. Sustain. Tour. 2020, 29, 1–20. [Google Scholar] [CrossRef]
- Uğur, N.G.; Akbıyık, A. Impacts of COVID-19 on global tourism industry: A cross-regional comparison. Tour. Manag. Perspect. 2020, 36, 100744. [Google Scholar] [CrossRef]
- Foo, L.-P.; Chin, M.-Y.; Tan, K.-L.; Phuah, K.-T. The impact of COVID-19 on tourism industry in Malaysia. Curr. Issues Tour. 2020, 2020, 1–5. [Google Scholar] [CrossRef]
- Karim, W.; Haque, A.; Anis, Z.; Ulfy, M.A. The Movement Control Order (MCO) for COVID-19 Crisis and its Impact on Tourism and Hospitality Sector in Malaysia. Int. Tour. Hosp. J. 2020, 3, 1–7. [Google Scholar] [CrossRef][Green Version]
- Mariolis, T.; Rodousakis, N.; Soklis, G. The COVID-19 multiplier effects of tourism on the Greek economy. Tour. Econ. 2020. [Google Scholar] [CrossRef]
- Abiad, A.; Arao, R.M.; Dagli, S.; Ferrarini, B.; Noy, I.; Osewe, P.; Pagaduan, J.; Park, D.; Platitas, R. The Economic Impact of the COVID-19 Outbreak on Developing Asia. ADB Briefs 2020. [Google Scholar] [CrossRef]
- Iacus, S.M.; Natale, F.; Satamaria, C.; Spyratos, S.; Vespe, M. Estimating and Projecting Air Passenger Traffic during the COVID-19 Coronavirus Outbreak and its Socio-Economic Impact. Saf. Sci. 2020, 129, 104791. [Google Scholar] [CrossRef]
- Sharma, A.; Nicolau, J.L. An open market valuation of the effects of COVID-19 on the travel and tourism industry. Ann. Tour. Res. 2020, 83, 102990. [Google Scholar] [CrossRef]
- Yu, M.; Li, Z.; Yu, Z.; He, J.; Zhou, J. Communication related health crisis on social media: A case of COVID-19 outbreak. Curr. Issues Tour. 2020, 1–7. [Google Scholar] [CrossRef]
- International Civil Aviation Organization (ICAO). Effects of Novel Coronavirus (COVID-19) on Civil Aviation: Economic Impact Analysis; Air Transport Bureau: Monteréal, QC, Canada, 2021. [Google Scholar]
- UNWTO. Tourism suffers its deepest crisis in 2020 with a drop of 74% in international arrivals. World Tour. Barom. 2021, 19, 1–13. [Google Scholar]
- Binggeli, U.; Constantin, M.; Pollack, E. COVID-19 Tourism Spend Recovery in Numbers. McKinsey & Company, 20 October 2020. Available online: https://www.mckinsey.com/industries/travel-logistics-and-infrastructure/our-insights/covid-19-tourism-spend-recovery-in-numbers?cid=eml-web (accessed on 9 November 2020).
- Ropkins, K.; Tate, J.E. Early observations on the impact of the COVID-19 lockdown on air quality trends across the UK. Sci. Total Environ. 2021, 754, 142374. [Google Scholar] [CrossRef] [PubMed]
- De Vito, L.; Barnes, J.; Longhurst, J.; Williams, B.; Hayes, E. The legacy of COVID-19: Lessons and challenges for city-scale air quality management in the UK. Cities Health 2020, 1–4. [Google Scholar] [CrossRef]
- Rossi, R.; Ceccato, R.; Gastaldi, M. Effect of Road Traffic on Air Pollution. Experimental Evidence from COVID-19 Lockdown. Sustainability 2020, 12, 8984. [Google Scholar] [CrossRef]
- Zambrano-Monserrate, M.A.; Ruano, M.A.; Sanchez-Alcalde, L. Indirect effects of COVID-19 on the environment. Sci. Total Environ. 2020, 728, 138813. [Google Scholar] [CrossRef]
- Baldasano, J.M. COVID-19 lockdown effects on air quality by NO2 in the cities of Barcelona and Madrid (Spain). Sci. Total Environ. 2020, 741, 140353. [Google Scholar] [CrossRef] [PubMed]
- Collivignarelli, M.C.; Abbà, A.; Bertanza, G.; Pedrazzani, R.; Ricciardi, P.; Miino, M.C. Lockdown for CoViD-2019 in Milan: What are the effects on air quality? Sci. Total Environ. 2020, 732, 139280. [Google Scholar] [CrossRef] [PubMed]
- Gama, C.; Relvas, H.; Lopes, M.; Monteiro, A. The impact of COVID-19 on air quality levels in Portugal: A way to assess traffic contribution. Environ. Res. 2021, 193, 110515. [Google Scholar] [CrossRef]
- Nakada, L.Y.K.; Urban, R.C. COVID-19 pandemic: Impacts on the air quality during the partial lockdown in São Paulo state, Brazil. Sci. Total Environ. 2020, 730, 139087. [Google Scholar] [CrossRef] [PubMed]
- Giani, P.; Castruccio, S.; Anav, A.; Howard, D.; Hu, W.; Crippa, P. Short-term and long-term health impacts of air pollution reductions from COVID-19 lockdowns in China and Europe: A modelling study. Lancet Planet. Health 2020, 4, e474–e482. [Google Scholar] [CrossRef]
- Chen, K.; Wang, M.; Huang, C.; Kinney, P.L.; Anastas, P.T. Air pollution reduction and mortality benefit during the COVID-19 outbreak in China. Lancet Planet. Health 2020, 4, e210–e212. [Google Scholar] [CrossRef]
- Sicard, P.; De Marco, A.; Agathokleous, E.; Feng, Z.; Xu, X.; Paoletti, E.; Rodriguez, J.J.D.; Calatayud, V. Amplified ozone pollution in cities during the COVID-19 lockdown. Sci. Total Environ. 2020, 735, 139542. [Google Scholar] [CrossRef]
- Siciliano, B.; Dantas, G.; da Silva, C.M.; Arbilla, G. Increased ozone levels during the COVID-19 lockdown: Analysis for the city of Rio de Janeiro, Brazil. Sci. Total Environ. 2020, 737, 139765. [Google Scholar] [CrossRef] [PubMed]
- López-Sánchez, Y.; Pulido-Fernández, J.I. Factors influencing the willingness to pay for sustainable tourism: A case of mass tourism destinations. Int. J. Sustain. Dev. World Ecol. 2016, 24, 262–275. [Google Scholar] [CrossRef]
- Cucculelli, M.; Goffi, G. Does sustainability enhance tourism destination competitiveness? Evidence from Italian Des-tinations of Excellence. J. Clean. Prod. 2016, 111, 370–382. [Google Scholar] [CrossRef]
- Hassan, S.S. Determinants of Market Competitiveness in an Environmentally Sustainable Tourism Industry. J. Travel Res. 2000, 38, 239–245. [Google Scholar] [CrossRef]
- Mohaidin, Z.; Wei, K.T.; Murshid, M.A. Factors influencing the tourists’ intention to select sustainable tourism desti-nation: A case study of Penang, Malaysia. Int. J. Tour. Cities 2017, 3, 442–465. [Google Scholar] [CrossRef]
- Dodds, R.; Graci, S.R.; Holmes, M. Does the tourist care? A comparison of tourists in Koh Phi Phi, Thailand and Gili Trawangan, Indonesia. J. Sustain. Tour. 2010, 18, 207–222. [Google Scholar] [CrossRef]
- Peng, J.; Xiao, H.; Wang, J.; Zhang, J. Impact of severe smog on travel demand of residents in tourist generating places: A case study of Beijing. Curr. Issues Tour. 2020, 23, 1–18. [Google Scholar] [CrossRef]
- Becken, S.; Jin, X.; Zhang, C.; Gao, J. Urban air pollution in China: Destination image and risk perceptions. J. Sustain. Tour. 2016, 25, 130–147. [Google Scholar] [CrossRef]
- COVID-19: Context and Impact. Available online: https://ine-pt.maps.arcgis.com/apps/opsdashboard/index.html#/7af78fbbbdd9456397317f822dac503d (accessed on 10 October 2020).
- Statistics Portugal. Guests Stays and Other Data on Hotel Activity Survey; Instituto Nacional de Estatística (INE): Lisbon, Portugal, 2020.
- UNWTO Tourism Data Dashboard. Available online: https://www.unwto.org/unwto-tourism-dashboard (accessed on 10 December 2020).
- World Winners. Available online: https://www.worldtravelawards.com/winners/2019/world (accessed on 2 December 2020).
- World Travel & Tourism Control. Portugal—2020 Annual Research: Key Highlights; World Travel & Tourism Council (WTTC): London, UK, 2020. [Google Scholar]
- Seguro, P. Consumo Turístico Representa 14,6% do Pib em 2018; Travel BI by Turismo de Portugal: Lisbon, Portugal, 2019. [Google Scholar]
- Hassan, S.B.; Soliman, M. COVID-19 and repeat visitation: Assessing the role of destination social responsibility, destination reputation, holidaymakers’ trust and fear arousal. J. Destin. Mark. Manag. 2021, 19, 100495. [Google Scholar] [CrossRef]
- Portugal Clean & Safe. 2020. Available online: https://portugalcleanandsafe.com/pt-pt/stamp (accessed on 22 November 2020).
- Turismo de Portugal. Portugal É o Primeiro País Europeu Distinguido com o Selo “Safe Travels” do World Travel & Tourism Council. 2020. Available online: http://www.turismodeportugal.pt/pt/Noticias/Paginas/portugal-primeiro-pais-europeu-distinguido-com-selo-safe-travels-do-wttc.aspx (accessed on 22 November 2020).
- Ministério das Infraestruturas e Habitação. Despacho n.º 3186-D/2020 de 10 de Março. Diário da República nº 49/2020—II Série; Ministério das Infraestruturas e Habitação: Lisboa, Portugal, 2020. [Google Scholar]
- Ministério das Infraestruturas e Habitação. Despacho n.º 4328-A/2020. De 8 de Abril de 2020. Diário da República—II Série; Ministério das Infraestruturas e Habitação: Lisboa, Portugal, 2020. [Google Scholar]
- Presidência do Conselho de Ministros. Decreto n.º 2-A/2020 de 17 de Abril de 2020. Diário da República n.º 57/2020—II Série; Presidência do Conselho de Ministros: Lisboa, Portugal, 2020.
- COVID-19 Travel Regulations Map. Available online: https://www.iatatravelcentre.com/world.php (accessed on 12 November 2020).
- Coronavirus (COVID-19): Travel Corridors. Available online: https://www.gov.uk/guidance/coronavirus-covid-19-travel-corridors#history (accessed on 12 November 2020).
- COVID-19: Temporary Restriction on Non-Essential Travel to the EU. Available online: https://eur-lex.europa.eu/legal-content/EN/TXT/?uri=CELEX%3A52020DC0115 (accessed on 2 November 2020).
- Covid-19 Government Response Tracker. Available online: https://www.bsg.ox.ac.uk/research/research-projects/covid-19-government-response-tracker (accessed on 19 March 2021).
- Vaishar, A.; Šťastná, M. Impact of the COVID-19 pandemic on rural tourism in Czechia Preliminary considerations. Curr. Issues Tour. 2020, 1–5. [Google Scholar] [CrossRef]
- Gama, C.; Monteiro, A.; Pio, C.; Miranda, A.I.; Baldasano, J.M.; Tchepel, O. Temporal patterns and trends of particulate matter over Portugal: A long-term analysis of background concentrations. Air Qual. Atmos. Health 2018, 11, 397–407. [Google Scholar] [CrossRef]
- Monteiro, A.; Miranda, A.; Borrego, C.; Vautard, R. Air quality assessment for Portugal. Sci. Total Environ. 2007, 373, 22–31. [Google Scholar] [CrossRef]
- World Health Organization Europe. AirQ+: Software Tool for Health Risk Assessment of Air Pollution. Available online: http://www.euro.who.int/en/health-topics/environment-and-health/air-quality/activities/airq-software-tool-for-health-risk-assessment-of-air-pollution (accessed on 15 September 2020).
- Holland, M.; Hunt, A.; Hurley, F.; Navrud, S.; Watkiss, P. Methodology for the Cost-Benefit analysis for CAFE: Volume 1: Overview of Methodology. AEA Technol. Environ. 2005, 1, 1–112. [Google Scholar]
- Health Risks of Air Pollution in EUROPE—HRAPIE Project. Recommendations for Concentration–Response Functions for Cost–Benefit Analysis of Particulate Matter, Ozone and Nitrogen Dioxide. Available online: https://www.euro.who.int/__data/assets/pdf_file/0006/238956/Health_risks_air_pollution_HRAPIE_project.pdf (accessed on 19 February 2021).
- Costa, S.; Ferreira, J.; Silveira, C.; Costa, C.; Lopes, D.; Relvas, H.; Borrego, C.; Roebeling, P.; Miranda, A.I.; Teixeira, J.P. Integrating Health on Air Quality Assessment—Review Report on Health Risks of Two Major European Outdoor Air Pollutants: PM and NO2. J. Toxicol. Environ. Health Part B 2014, 17, 307–340. [Google Scholar] [CrossRef]
- World Health Organization Europe. Review of Evidence on Health Aspects of Air Pollution—REVIHAAP Project: Final Technical Report. 2013. Available online: https://www.euro.who.int/__data/assets/pdf_file/0004/193108/REVIHAAP-Final-technical-report-final-version.pdf (accessed on 19 February 2021).
- Roy, R.; Braathen, N.A. The Rising Cost of Ambient Air Pollution Thus Far in the 21st Century. OECD Environ. Work. Pap. 2017. [Google Scholar] [CrossRef]
- Roman, M.; Niedziółka, A.; Krasnodębski, A. Respondents’ Involvement in Tourist Activities at the Time of the COVID-19 Pandemic. Sustainability 2020, 12, 9610. [Google Scholar] [CrossRef]
- Kitamura, Y.; Karkour, S.; Ichisugi, Y.; Itsubo, N. Evaluation of the Economic, Environmental, and Social Impacts of the COVID-19 Pandemic on the Japanese Tourism Industry. Sustainability 2020, 12, 10302. [Google Scholar] [CrossRef]
- Brent Crude. Available online: https://www.bloomberg.com (accessed on 30 September 2020).
- Rogerson, C.M.; Rogerson, J.M. COVID-19 and tourism spaces of vulnerability in South Africa. Afr. J. Hosp. Tour. Leis. 2020, 9, 382–401. [Google Scholar]
- Paunović, I.; Jovanović, V. Implementation of Sustainable Tourism in the German Alps: A Case Study. Sustainability 2017, 9, 226. [Google Scholar] [CrossRef]
- Ivanov, S.H.; Webster, C.; Stoilova, E.; Slobodskoy, D. Biosecurity, crisis management, automation technologies and economic performance of travel, tourism and hospitality companies—A conceptual framework. Tour. Econ. 2020. [Google Scholar] [CrossRef]
- OECD. OECD Tourism Trends and Policies 2020; OECD Publishing: Paris, France, 2020. [Google Scholar] [CrossRef]
- Buhalis, D. Technology in tourism-from information communication technologies to eTourism and smart tourism towards ambient intelligence tourism: A perspective article. Tour. Rev. 2019, 75, 267–272. [Google Scholar] [CrossRef]
- Mohanty, P.; Hassan, A.; Ekis, E. Augmented reality for relaunching tourism post-COVID-19: Socially distant, virtually connected. Worldw. Hosp. Tour. Themes 2020, 12, 753–760. [Google Scholar] [CrossRef]
- Sigala, M. New technologies in tourism: From multi-disciplinary to anti-disciplinary advances and trajectories. Tour. Manag. Perspect. 2018, 25, 151–155. [Google Scholar] [CrossRef]
- Koh, E. The end of over-tourism? Opportunities in a post-Covid-19 world. Int. J. Tour. Cities 2020, 6, 1015–1023. [Google Scholar] [CrossRef]
- Poon, A. The ‘new tourism’ revolution. Tour. Manag. 1994, 15, 91–92. [Google Scholar] [CrossRef]
- Sarzynski, A. Bigger Is Not Always Better: A Comparative Analysis of Cities and their Air Pollution Impact. Urban Stud. 2012, 49, 3121–3138. [Google Scholar] [CrossRef]
- Zhang, A.; Zhong, L.; Xu, Y.; Wang, H.; Dang, L. Tourists’ Perception of Haze Pollution and the Potential Impacts on Travel: Reshaping the Features of Tourism Seasonality in Beijing, China. Sustainability 2015, 7, 2397–2414. [Google Scholar] [CrossRef]
- Nikolić, T.M.; Pantić, S.; Paunović, I.; Filipović, S. Sustainable Travel Decision-Making of Europeans: Insights from a Household Survey. Sustainability 2021, 13, 1960. [Google Scholar] [CrossRef]
- World Economic Forum. The Travel & Tourism Competitiveness Report 2015: Growth Through Shocks; World Economic Forum (WEF): Geneva, Switzerland, 2015. [Google Scholar]
- Paunović, I.; Dressler, M.; Nikolić, T.M.; Pantić, S.P. Developing a Competitive and Sustainable Destination of the Future: Clusters and Predictors of Successful National-Level Destination Governance across Destination Life-Cycle. Sustainability 2020, 12, 4066. [Google Scholar] [CrossRef]
- Ioannides, D.; Gyimóthy, S. The COVID-19 crisis as an opportunity for escaping the unsustainable global tourism path. Tour. Geogr. 2020, 22, 624–632. [Google Scholar] [CrossRef]


| Jan | Feb | Mar | Apr | May | Jun | Jul | Aug | Sep | ||
|---|---|---|---|---|---|---|---|---|---|---|
| Total Overnights | 2019 | 3,019,760 | 3,344,806 | 4,598,754 | 5,946,820 | 6,496,709 | 7,152,704 | 8,181,624 | 9,561,062 | 7,624,574 |
| 2020 | 3,253,096 | 3,838,559 | 1,900,128 | 155,012 | 276,508 | 1,041,233 | 2,648,164 | 5,092,842 | 3,551,658 | |
| % Δ | 7.7 | 14.8 | −43.2 | −97.4 | −95.7 | −85.4 | −67.6 | −46.7 | −53.4 | |
| Domestic | 2019 | 962,386 | 1,033,024 | 1,353,421 | 1,678,240 | 1,621,879 | 2,144,269 | 2,502,090 | 3,412,179 | 2,220,480 |
| 2020 | 1,075,595 | 1,307,452 | 566,483 | 108,280 | 217,309 | 876,997 | 1,771,091 | 3,384,308 | 2,032,350 | |
| % Δ | 11.8 | 26.6 | −45.2 | −93.5 | −86.6 | −59.1 | −29.2 | −0.8 | −8.5 | |
| International | 2019 | 2,057,374 | 2,311,782 | 3,245,333 | 4,268,580 | 4,874,830 | 5,008,435 | 5,679,534 | 6,148,883 | 5,404,094 |
| 2020 | 2,177,501 | 2,531,107 | 1,333,645 | 46,732 | 59,199 | 164,236 | 877,073 | 1,708,534 | 1,519,308 | |
| % Δ | 5.8 | 9.5 | −42.3 | −98.9 | −98.8 | −96.7 | −84.6 | −72.2 | −71.9 |
| Jan | Feb | Ma | Apr | May | Jun | Jul | Aug | Sep | ||
|---|---|---|---|---|---|---|---|---|---|---|
| Portugal | 2019 | 164,943 | 172,733 | 248,243 | 334,929 | 408,100 | 465,982 | 534,629 | 638,292 | 501,535 |
| 2020 | 175,315 | 195,299 | 99,649 | 5083 | 10,152 | 53,422 | 161,200 | 326,463 | 204,791 | |
| % Δ | 6.3 | 13.1 | −42.3 | −98.5 | −97.5 | −88.5 | −69.8 | −48.9 | −59.2 | |
| North | 2019 | 27,270 | 28,311 | 38,200 | 50,906 | 63,013 | 67,675 | 70,105 | 82,392 | 58,288 |
| 2020 | 31,265 | 32,433 | 13,644 | 1108 | 2678 | 10,872 | 25,503 | 46,303 | 30,978 | |
| % Δ | 14.6 | 14.6 | −64.3 | −97.8 | −95.8 | −83.9 | −63.6 | −43.8 | −46.9 | |
| Central Region | 2019 | 15,627 | 16,041 | 21,375 | 27,422 | 31,937 | 33,328 | 38,685 | 54,621 | 39,349 |
| 2020 | 17,271 | 20,077 | 8024 | 683,1 | 1702 | 7749 | 19,152 | 39,507 | 22,855 | |
| % Δ | 10.5 | 25.2 | −62.5 | −97.5 | −94.7 | −76.7 | −50.5 | −27.7 | −41.9 | |
| Lisbon | 2019 | 65,497 | 65,837 | 96,951 | 116,906 | 144,973 | 145,869 | 133,939 | 138,527 | 147,509 |
| 2020 | 68,431 | 70,349 | 33,464 | 2070 | 3083 | 7361 | 18,177 | 38,800 | 29,343 | |
| % Δ | 4.5 | 6.9 | −65.5 | −98.2 | −97.9 | −95.0 | −86.4 | −72.0 | −80.1 | |
| Alentejo | 2019 | 6282 | 6458 | 8679 | 13,046 | 15,005 | 18,102 | 22,752 | 31,941 | 21,038 |
| 2020 | 7351 | 8683 | 3622 | 586.1 | 1576 | 8595 | 18,123 | 29,420 | 16,479 | |
| % Δ | 17.0 | 34.4 | −58.3 | −95.5 | −89.5 | −52.5 | −20.3 | −7.9 | −21.7 | |
| Algarve | 2019 | 22,218 | 27,760 | 45,415 | 84,815 | 103,192 | 147,560 | 208,937 | 265,061 | 164,951 |
| 2020 | 22,473 | 32,682 | 22,076 | 537.3 | 1008 | 17,411 | 72,331 | 154,633 | 87,843 | |
| % Δ | 1.1 | 17.7 | −51.4 | −99.4 | −99.0 | −88.2 | −65.4 | −41.7 | −46.7 | |
| Azores | 2019 | 3206 | 3725 | 5610 | 8886 | 11,446 | 14,381 | 18,064 | 19,113 | 14,439 |
| 2020 | 3595 | 4325 | 2586 | 7.5 | 25.3 | 579.7 | 2603 | 5771 | 4386 | |
| % Δ | 12.2 | 16.1 | −53.9 | −99.9 | −99.8 | −96.0 | −85.6 | −69.8 | −69.6 | |
| Madeira | 2019 | 24,843 | 24,600 | 32,014 | 32,949 | 38,534 | 39,068 | 42,147 | 46,635 | 40,428 |
| 2020 | 24,929 | 26,750 | 16,233 | 91.0 | 80.5 | 528.2 | 5312 | 12,960 | 12,907 | |
| % Δ | 0.3 | 8.7 | −49.3 | −99.7 | −99.8 | −98.7 | −87.4 | −72.2 | −68.1 |
| Total Deaths by COVID-19 | Total Revenues in Tourist Accommodation Establishments | ||||||||
| Portugal and NUTs II | Spearman’s Correlation | Portugal | North | Central region | Lisbon | Alentejo | Algarve | Azores | |
| Portugal | Coefficient | −0.845 ** | |||||||
| Sig. (2-tailed) | 0.004 | ||||||||
| North | Coefficient | −0.795 * | |||||||
| Sig. (2-tailed) | 0.010 | ||||||||
| Central Region | Coefficient | −0.700 * | |||||||
| Sig. (2-tailed) | 0.036 | ||||||||
| Lisbon | Coefficient | −0.946 ** | |||||||
| Sig. (2-tailed) | 0.000 | ||||||||
| Alentejo | Coefficient | 0.470 | |||||||
| Sig. (2-tailed) | 0.202 | ||||||||
| Algarve | Coefficient | −0.256 | |||||||
| Sig. (2-tailed) | 0.507 | ||||||||
| Azores | Coefficient | −0.730 * | |||||||
| Sig. (2-tailed) | 0.025 | ||||||||
| January | February | March | April | May | June | July | August | September | ||
|---|---|---|---|---|---|---|---|---|---|---|
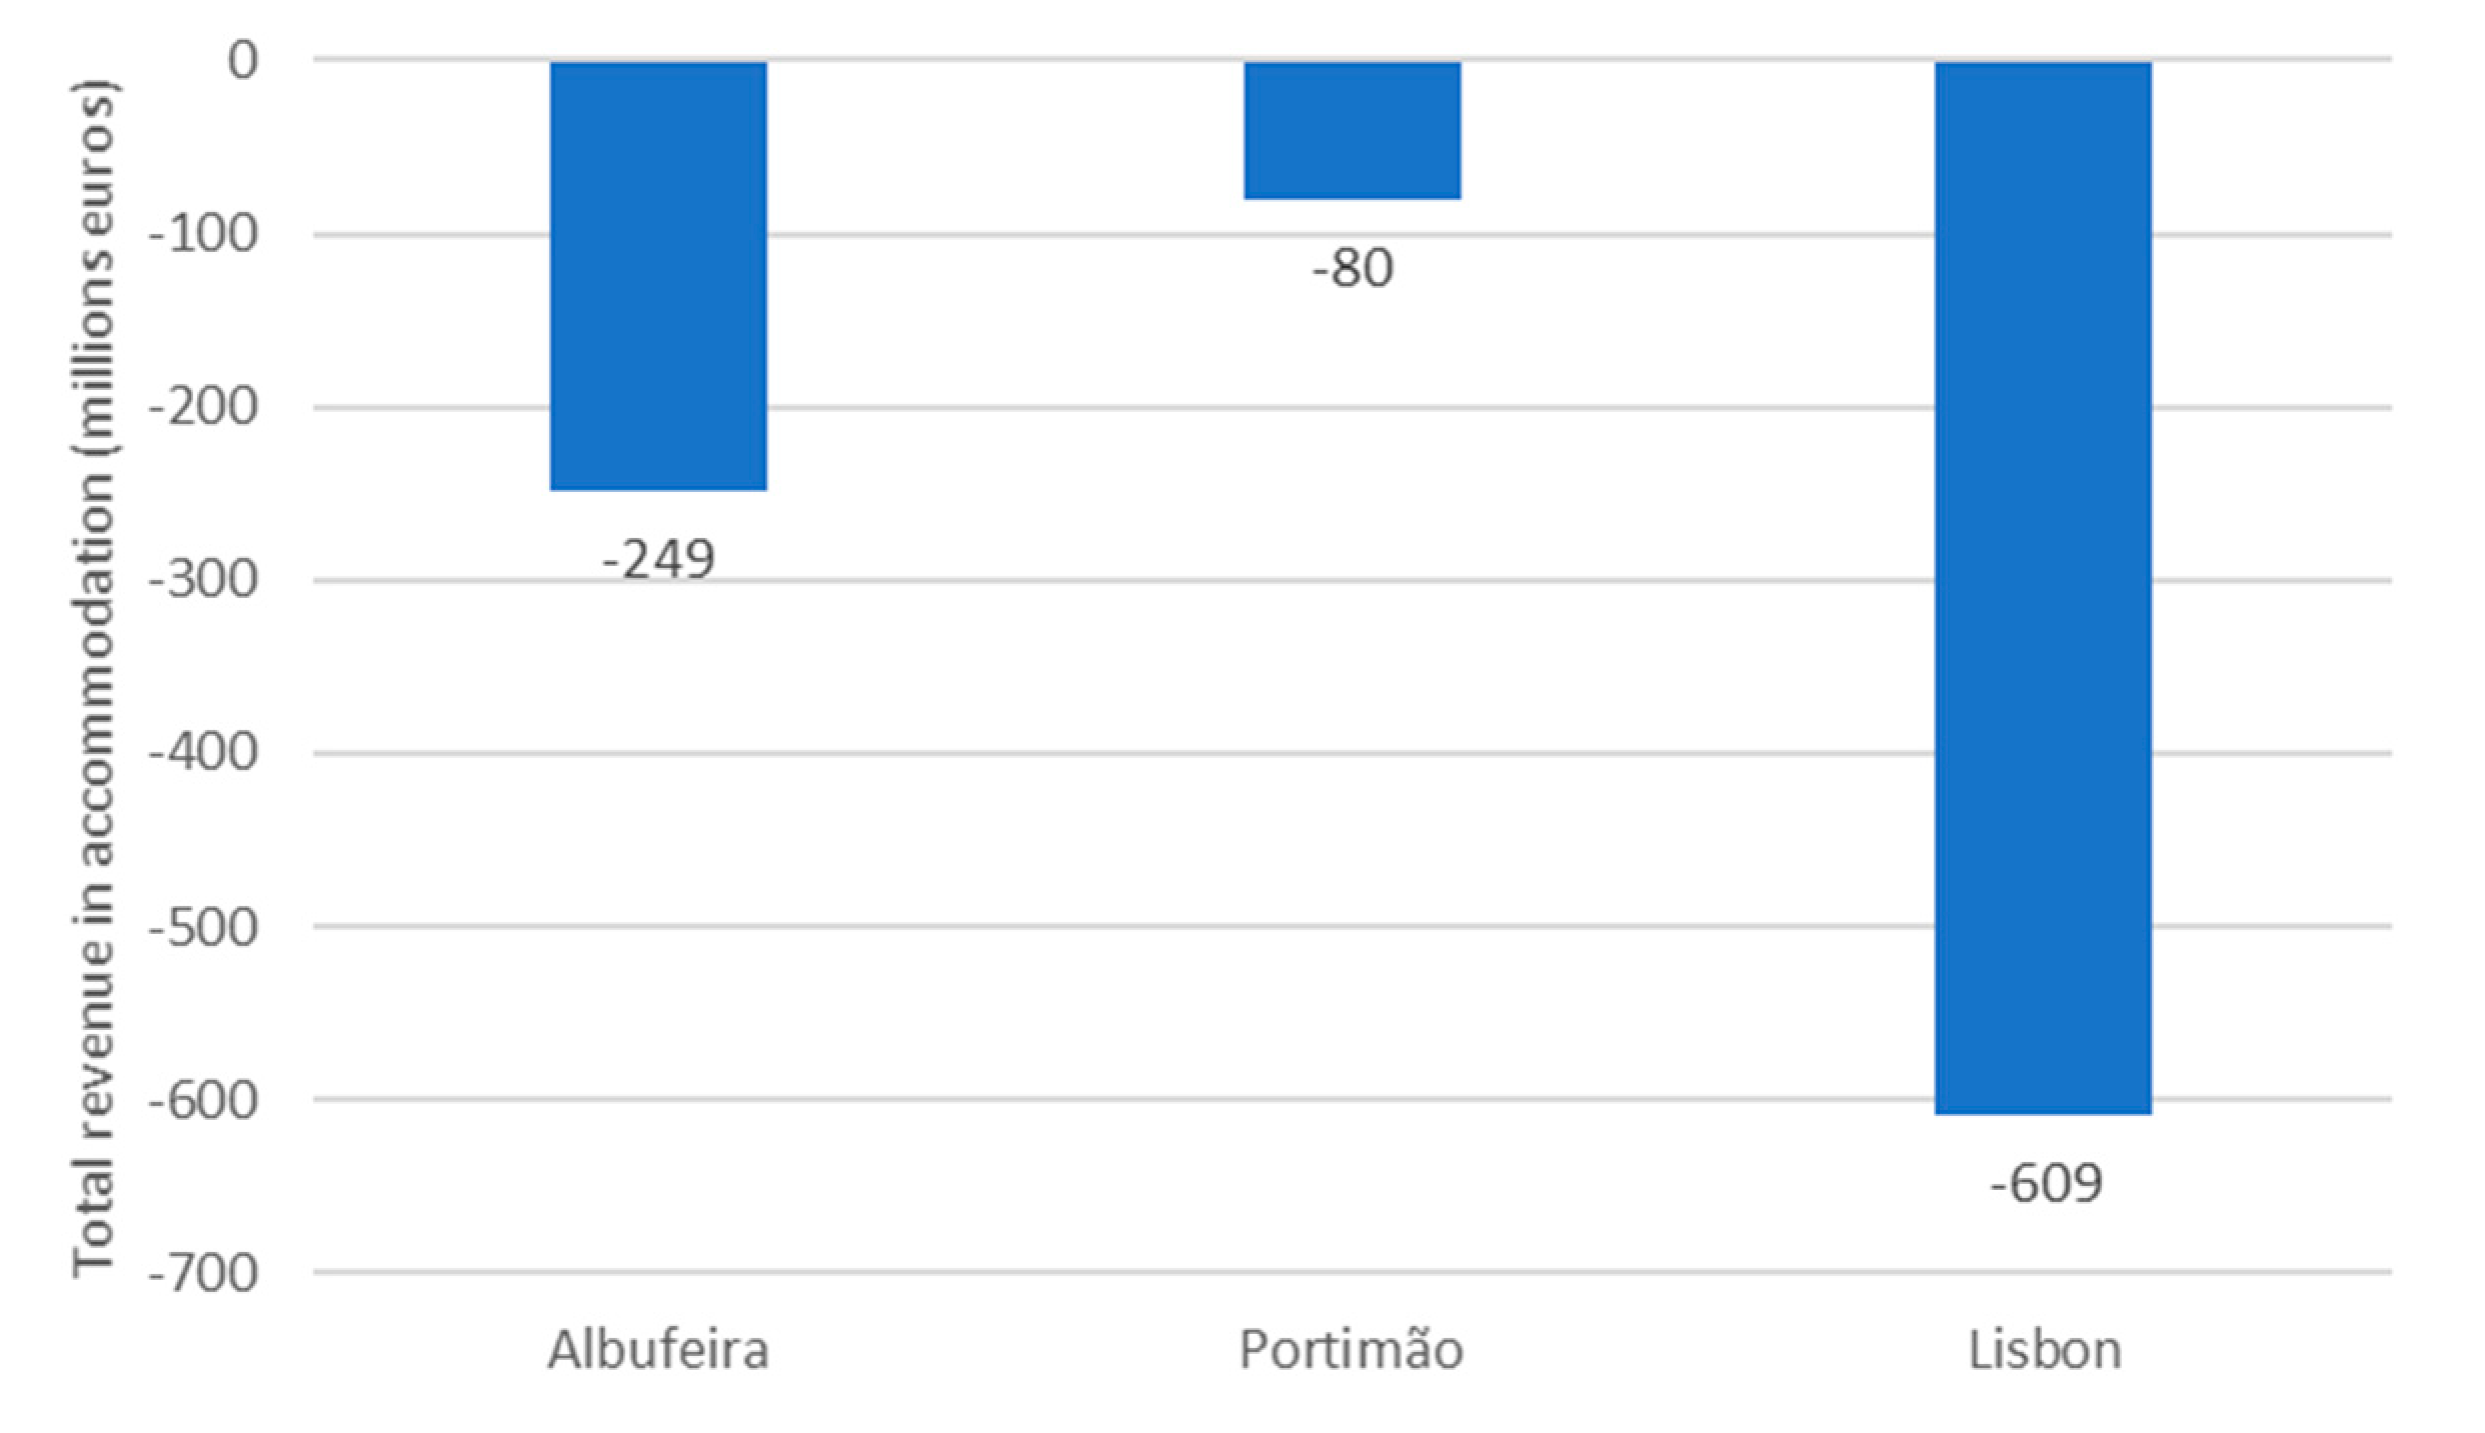
| Albufeira | 2019 | 5644 | 8274 | 15,835 | 31,559 | 37,648 | 53,717 | 76,316 | 94,602 | 58,856 |
| 2020 | 5856 | 9821 | 7582 | 134.3 | 197.5 | 5124 | 23,735 | 51,054 | 30,394 | |
| % Δ | 3.7 | 18.7 | −52.1 | −99.6 | −99.5 | −90.5 | −68.9 | −46.0 | −48.4 | |
| Portimão | 2019 | 1766 | 2557 | 3990 | 8069 | 10,363 | 17,653 | 25,713 | 34,399 | 20,765 |
| 2020 | 1842 | 3029 | 1616 | 112.3 | 163.6 | 1977 | 8454 | 17,669 | 10,380 | |
| % Δ | 4.3 | 18.5 | −59.5 | −98.6 | −98.4 | −88.8 | −67.1 | −48.6 | −50.0 | |
| Lisbon | 2019 | 51,790 | 51,395 | 77,100 | 90,758 | 111,404 | 109,992 | 95,381 | 94,287 | 109,820 |
| 2020 | 54,271 | 54,147 | 26,134 | 1100 | 1621 | 3116 | 8055 | 17,660 | 16,699 | |
| % Δ | 4.8 | 5.4 | −66.1 | −98.8 | −98.5 | −97.2 | −91.6 | −81.3 | −84.8 |
| Air Quality Monitoring Station | Municipality | Classification | Pollutants with More Than 75% Data |
|---|---|---|---|
| Avenida da Liberdade | Lisbon | Urban traffic | NO2, PM10 |
| Beato | Lisbon | Urban background | NO2 |
| Entrecampos | Lisbon | Urban traffic | NO2, PM10, PM2.5 |
| Olivais | Lisbon | Urban background | NO2, PM10, PM2.5 |
| Restelo | Lisbon | Urban background | NO2 |
| Santa Cruz de Benfica | Lisbon | Urban traffic | NO2, PM10 |
| David Neto | Portimão (Algarve) | Urban traffic | NO2, PM10, PM2.5 |
| Malpique | Albufeira (Algarve) | Urban background | PM10 |
| Joaquim Magalhães | Faro (Algarve) | Urban background | NO2, PM2.5 |
Publisher’s Note: MDPI stays neutral with regard to jurisdictional claims in published maps and institutional affiliations. |
© 2021 by the authors. Licensee MDPI, Basel, Switzerland. This article is an open access article distributed under the terms and conditions of the Creative Commons Attribution (CC BY) license (https://creativecommons.org/licenses/by/4.0/).
Share and Cite
Monteiro, A.; Eusébio, C.; Carneiro, M.J.; Madaleno, M.; Robaina, M.; Rodrigues, V.; Gama, C.; Relvas, H.; Russo, M.; Oliveira, K.; et al. Tourism and Air Quality during COVID-19 Pandemic: Lessons for the Future. Sustainability 2021, 13, 3906. https://doi.org/10.3390/su13073906
Monteiro A, Eusébio C, Carneiro MJ, Madaleno M, Robaina M, Rodrigues V, Gama C, Relvas H, Russo M, Oliveira K, et al. Tourism and Air Quality during COVID-19 Pandemic: Lessons for the Future. Sustainability. 2021; 13(7):3906. https://doi.org/10.3390/su13073906
Chicago/Turabian StyleMonteiro, Alexandra, Celeste Eusébio, Maria João Carneiro, Mara Madaleno, Margarita Robaina, Vitor Rodrigues, Carla Gama, Hélder Relvas, Michael Russo, Kevin Oliveira, and et al. 2021. "Tourism and Air Quality during COVID-19 Pandemic: Lessons for the Future" Sustainability 13, no. 7: 3906. https://doi.org/10.3390/su13073906
APA StyleMonteiro, A., Eusébio, C., Carneiro, M. J., Madaleno, M., Robaina, M., Rodrigues, V., Gama, C., Relvas, H., Russo, M., Oliveira, K., Lopes, M., & Borrego, C. (2021). Tourism and Air Quality during COVID-19 Pandemic: Lessons for the Future. Sustainability, 13(7), 3906. https://doi.org/10.3390/su13073906