Abstract
This paper identifies the best energy management strategy of hybrid photovoltaic–diesel battery-based water desalination systems in isolated regions using technical, economic and techno–economic criteria. The employed procedures include Criteria Importance Through Intercriteria Correlation (CRITIC) and Technique for Order Preference by Similarity to Ideal Solution (TOPSIS) as tools for the solution. Twelve alternatives, containing three–four energy management strategies; four energy management strategies, load following (LF), cycle charging (CC), combined LF–CC, and predictive strategy; and three different sizes of brackish water reverse osmosis (BWRO) water desalination units, BWRO-150, BWRO-250, and BWRO-500, are investigated with capacity of 150, 250, and 500 m3/day, respectively. Eight attributes comprising different technical and economic metrics are considered during the evaluation procedure. HOMER Pro® software is utilized to perform the simulation and optimization. The main findings confirmed that the best energy management strategies are predictive strategies and the reverse osmosis (RO) unit’s optimal size is RO-250. For such an option, the annual operating cost and initial costs are $4590 and $78,435, respectively, whereas the cost of energy is $0.156/kWh. The excess energy and unmet loads are 27,532 kWh and 20.3 kWh, respectively. The breakeven grid extension distance and the amount of CO2 are 6.02 km and 14,289 kg per year, respectively. Compared with CC–RO-150, the amount of CO2 has been sharply decreased by 61.2%.
1. Introduction
The exponential growth in fossil fuels resulted in plenty of health and environmental problems [1,2]. A massive work has been done to raise the efficiency of the current processes [3] and use new devices that are environmentally friendly and have high efficiency. Due to the sustainability of renewable energies and their low environmental impacts [4,5], they are considered the best candidates to replace fossil fuel, shortly. Currently, securing freshwater resources is one of the main challenges facing human beings [6]. Although more than two-thirds of the earth’s surface is water, less than 1% of this water is suitable for industrial and domestic usage [7]. Water desalination is considered the best method for securing freshwater. Water desalination can be classified into two main categories, i.e., thermal desalination and membrane-based desalination. Reverse osmosis is one of the membrane-based desalination methods that demonstrated promising results in the water productivity at lower specific energy consumption, compared to the other desalination methods. Therefore, it is widely used on the commercial state [8,9], although, of the promising features of the reverse osmosis, it is challenged by fouling and scaling that resulted in decreasing the water productivity and increasing the energy consumption. Moreover, the discharge of the brine is one of the main byproducts that has severe environmental impacts, and significant efforts are being done to find a suitable solution for it [10,11]. Several parameters affect the overall performance of the reverse osmosis process [12]. The optimization of the different reverse osmosis (RO) parameters are very critical in deciding the overall performance, in terms of water productivity and specific energy consumption; therefore, several studies have been carried out to optimize the performance of the RO units [13,14,15,16,17].
However, water desalination, “even using RO”, is an extensive energy consumption technology with severe environmental impacts [18]. Securing the desalination energy from renewable energy will not only reduce the cost but also save the environment. However, several challenges face the widespread of renewable energy sources (RESs), such as variable atmospheric conditions, intermittency, new technology, cost, etc. The most promising renewable energy source (RES) is solar energy, used effectively in water desalination with low or no environmental impacts [19]. However, solar energy, mostly when used for direct electrical power production using solar photovoltaics, is subject to partial shading, high initial cost, dust accumulation, and low panel efficiency [20]. Therefore, to tap maximum power from Solar Photovoltaic Systems (SPV), maximum power point tracking (MPPT) controllers are practical and efficient solutions for uncertain weather conditions [21,22]. The policy of electricity generation is a strategic one that helps in community development. These policies are analyzed to guarantee reliable and affordable generation to the community. Achieving this aim has a high probability in case of combining the energy policy with the social, technical, economic, and environmental needs of the community [23].
Multicriteria Decision-Making (MCDM) is helpful in sorting out accessible data, reevaluating choices, and investigating their discernments and requirements [24]. Choices and inclinations are communicated as conditions, information sources, and coefficients, which can be watched and imitated. MCDM techniques have just been generally and effectively applied to illuminate the enormous scope of socio-specialized choice issues, identified with vitality strategy, arranging them to allow for deciding the best sustainable power source or feasible vitality framework plan [25]. Aside from that, likewise, a few audits on MCDM are accessible in their entirety in economic and sustainable power source advancements and frameworks [26]. Nonetheless, because of the wandering objectives and degrees and the heterogeneity of approaches these do neither permit the inference of any decision about the reasonableness of various energy storage systems (ESSs) for giving framework administrations nor provide rules about how to lead the MCDM for assessing ESSs in a powerful and far-reaching way [27,28].
The main strategies of selecting the best RESs are divided into main criteria, subcriteria, and subnetwork [29,30]. The main criteria include environmental, economy, technology, security, global effect, and human well-being. At the same time, the subcriteria is divided into benefits, costs, opportunities, and risks. The subnetwork is divided into solar, wind, geothermal, biomass, hydro, and nuclear energies. The decision process framework can be divided into four main steps: step 1: data collection and analysis process; step 2: content validity; step 3: calculation procedure; and step 4: selecting the optimal RES based on using optimal MCDM methods [31].
There are several MCDM methods, such as Weighted Product Method (WPM) [32,33], Weighted Sum Method (WSM) [26,34,35], Elimination and Choice Translating Reality (ELECTRE) [36,37,38], Analytical Hierarchy Process (AHP) [39], Vlse Kriterijumska Optimizacija I Kompromisno Resenje (VIKOR) [40,41,42], Technique for Order Preference by Similarity to Ideal Solutions (TOPSIS) [43,44,45,46], Preference Ranking Organization Method (PROMETHE) [47,48,49], and Multi-Attribute Utility Theory (MAUT) [50,51,52]. Each method has its advantages, disadvantages, and application as being summarized in the literature [53,54,55].
Among the different MCDM methods, TOPSIS is an effective method that shows a real solution for several issues [56]. TOPSIS helps decision-makers (DMs) to understand, complete examination and correlations quickly, and rank the other options. According to the needs, the determination of a reasonable alternative(s) will be made. Notwithstanding, numerous dynamic issues inside associations will be a synergistic exertion. Thus, this examination will stretch out TOPSIS to oblige the choice condition to fit honest work. A comprehensive and effective strategy for decision-making will then be obtained. The main idea of TOPSIS is relatively direct. It starts with the concept of a dislodged ideal point from which the tradeoff arrangement has the briefest separation [57,58]. Hwang and Yoon [56] further suggest that the positioning of choices will be founded on the shortest good ways from the positive ideal solution (PIS) and so-far negative ideal solution (NIS) or base. TOPSIS thinks about the separations between the two PIS and NIS, and an inclination request is positioned by their relative closeness and a mix of these two separation measures. As per Kim et al. [59], four TOPSIS preferences are tended to: (i) a sound rationale that speaks to the reason of human decision; (ii) a scalar worth that represents both the best and most noticeably awful options at the same time; (iii) a basic calculation measure that can be handily modified into a spreadsheet; and (iv) the presentation proportions of all choices, based on characteristics, can be pictured on a polyhedron, in any event for any two measurements. These focal points make TOPSIS a significant MCDM strategy as contrasted to other related procedures, for example, hierarchical analytical process (AHP) and ELECTRE [56]. Truth be told, TOPSIS is a utility-based strategy that analyzes every option legitimately, relying upon the information in the assessment frameworks and loads [60]. Moreover, as per the recreation correlation from Zanakis et al. [61], TOPSIS has the least position inversions among the classification’s techniques. Hence, TOPSIS is picked as the principal group of advancement. The high adaptability of this idea can oblige further expansion to settle on better decisions in different circumstances. This is the inspiration of our examination.
It is not phenomenal for specific gatherings to continually settle on complex selections inside relatives. Notwithstanding, for using any MCDM approach, e.g., TOPSIS, it is generally approved that the selected data is provided ahead of time by grouping the assignment. Hence, Shih et al. [62] propose to upgrade TOPSIS as a critical thinking apparatus. However, this remuneration needs a cooperative choice emotionally supportive network to satisfy its destinations. To rearrange the dynamic exercises, we will recommend an incorporated gathering TOPSIS strategy for considering the genuine issues to settle on successful choices.
This paper’s main objective is to identify the best energy management strategy of hybrid photovoltaic–diesel battery-based water desalination systems in isolated regions considering technical, economic, and techno–economic criteria. The selection procedure combines CRITIC and TOPSIS as a solution method. Twelve alternatives, containing three–four energy management strategies; four energy management strategies, load following (LF), cycle charging (CC), combined LF–CC, and predictive strategy; and three different sizes of brackish water reverse osmosis (BWRO) water desalination units, BWRO-150, BWRO-250, and BWRO-500, are investigated with capacity of 150, 250, and 500 m3/day, respectively. Different attributes comprising economic and technical metrics are used during the evaluation procedure.
2. Information about the Analyzed Location and Load Demand
A water desalination plant in Wadi-Addwaser (Saudi Arabia) is selected as a case study. It is situated at 20.4493° N, 44.8501° E, as displayed in Figure 1. The location of Wadi-Addwaser City has a high average solar irradiance level. The mean solar radiation and clearance index for one year are shown in Figure 2. The average horizontal solar radiation per day is 6.16 kWh/m2. The maximum value of irradiance per day is 7.64 kWh/m2, occurred in June, while the minimum one is 4.31 kWh/m2 in December. The electrical energy required is 210 kWh/day, and the maximum power needed is 10.5 kW for BWRO-150 unit. The electrical and technical specifications of different sizes of BWRO units are presented in Table 1. It is worth mentioning that the variation of the different operating conditions mentioned in Table 1 would affect the overall performance of the RO. For instance, the temperature of the feed water would affect the performance of the RO process, where the increase in the feed temperature will result in increasing the water permeability, increasing salt permeability, and decreasing the energy consumption [63]; additionally, the water recover rates in the RO units depend on the inorganic contents and its varied from 60 to 85% [64,65]. However, as long as the RO unit is operated within the condition mentioned in Table 1, “that is very close of the commercial conditions,” the mentioned energy demand would be accepted.

Figure 1.
The location of the considered case study.
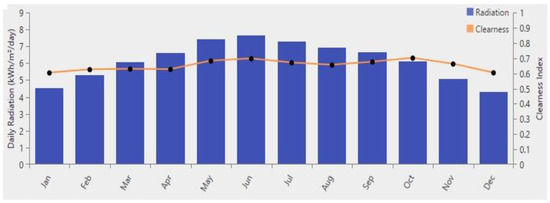
Figure 2.
Average solar radiation and clearance index during one year of the studied location.

Table 1.
The electrical and technical specification of different sizes of brackish water reverse osmosis (BWRO) units *.
The proposed hybrid system’s techno–economic parameters are listed in Table 2 [66,67]. These parameters are employed to determine the proposed system’s optimal sizes using HOMER Pro® software [68,69].
Table 2.
Specification of different elements of the hybrid system.
3. Methods and Analysis
3.1. HOMER Software
In this work, HOMER software is applied to identify the best size for different alternatives. The photovoltaic/diesel generator/batter (PV/DG/B) optimal size is determined such that the cost of energy (COE) and total net present cost (NPC) are minimized. The formula of the NPC can be written as follows [66,67]:
Cann,tot is the total cost per year, i is the real interest rate per year, N is the project’s lifetime, and CRF is the capital recovery factor. The formula of CRF can be written as follows:
The total cost Cann,tot comprises capital cost, operational and maintenance (O&M) cost, and replacement cost. The value salvage can be computed as follows:
Crep is the replacement cost, Rrem is the remaining life; Rcomp is the project’s life span. The COE can be determined as follows:
3.2. TOPSIS Method
To incorporate the numerous inclinations of more than one DM, which will consider the detachment measures by taking the mathematical mean or number juggling mean of the people for TOPSIS. The standardization strategies and separation measures are also mulled over. Contrasted with the original TOPSIS technique, the proposed model offers an overall perspective on TOPSIS with a bunch of inclination collections. The nitty-gritty system, with a couple of choices inside each progression, is shown in the accompanying [43,44,45,46].
Stage 1. Create the decision matrix for every DM as following:
where denotes the alternative performance rating; denotes the element of Dk.
Stage 2. Create the normalized decision matrix (Rk, k = 1, …, K) for every DM as following.
where and for i = 1, …, m; j = 1, …, n; and k = 1, …, K.
For normalization, Equation (6) for benefit criterion j will be as follows:
Equation (7) for cost criterion j will be as follows:
Moreover, the standardized value of is considered as the value of the corresponding element divided by the operation of its column elements, i.e., vector standardized; then:
where i = 1, …, m; j = 1, …, n; and k = 1, …, K.
Note that while utilizing Equation (10) for standardization, a distinction will be made as one of the cost criteria for further manipulation.
Stage 3. Evaluate the ideal solution (Vk+) and negative ideal solution (Vk−) for each DM, k = 1, …, K based on the following formula:
where j is the benefit criteria component; j’ is the cost criteria component; i = 1, …, m; j = 1, …, n; and k = 1, …, K.
Stage 4. Determine the weight vector (W) to the attribute set for the group.
Each DM will provoke weights for attributes as, where j = 1, …, n, and , and for each DM, k = 1, …, K. Each element of the weight vector (W) represents the operation of the attributes’ weights per DM elements.
Stage 5. Estimate the distance between the best solution () and a negative one () for the group as following:
Stage 5a. Calculate the measures from PIS and NIS and for DM k. In this phase, Minkowski’s Lp metric is applied to estimate the distance between PIS and NIS, as following:
where and integer, is the attribute weight for j and DM k, and and k = 1, ...., k. If p = 2, the metric is a Euclidean distance. Equations (13) and (14) will be:
Stage 5b. Estimate the PIS and NIS for the group. Additionally, the measure of the group separation for every option will be joint via an operation for all DMs, as following.
Several selections are presented in operation, like geometric mean, arithmetic mean, or their modifications. Therefore, the above equation will be:
where i = 1, …, m and k = 1, …, K.
Stage 6. Calculate the group relative closeness () to the ideal solution, as following:
where
Stage 7. Ranking.
The final step is ranking the alternatives based on the descending order of .
3.3. CRITIC-Technique
CRITIC-technique for weight estimation is as follows [70]:
Stage 1: Estimate “best” (B) and “worst” (T) solution ([1xn]-vector) for all attributes.
Stage 2: Estimate relative deviation matrix V [mxn].
Stage 3: Estimate standard deviation (StD) ([1xn]-vector) for colls of V.
StD = std(V)
Stage 4: Estimate correlation matrix (Cr) ([nxn]-matrix) for colls of V.
Cr = corr(V)
Stage 5: Estimate vector (c) and calculate the weight of criteria wk.
4. Results and Discussion
4.1. Results of HOMER
This section introduces the details of the feasibility and techno–economic evaluation for the PV/DG/B system to power the BWRO desalination plant. To identify the most cost-effective and best size of this system, three different sizes of BWRO plants, BWRO-150, BWRO-250, and BWRO-500; and four energy management control strategies, LF, CC, combined, and predictive, were considered in the current research work. Eight main criteria, the COE, operating cost, renewable fraction (RF), initial cost (IC), excess energy, unmet load, environmental impact (size of CO2), and breakeven grid extension distance (BED), are used to determine the best alternatives for the case study. Using Homer software, the values of the eight parameters for all options are shown in Table 3.
Table 3.
The output eight parameters for all alternatives.
Considering the above table, the following remarks can be outlined: The annual operating cost varies from $3010/kWh to $10,139/kWh. The minimum operating cost can be achieved using BWRO-500 unit and the predictive control strategy. The renewable fraction valued varies from 46.1% to 96.8%. The maximum RF values are also achieved using the BWRO-500 unit and the predictive control strategy. The minimum initial cost of $50,223 is assigned to the BWRO-150 unit and the combined control strategy. Simultaneously, the energy cost values are changed from $0.156/kWh to $0.203/kWh. The minimum and maximum COE are achieved by the BWRO-250 unit and the predictive control strategy and BWRO-500 unit and the combined control strategy, respectively. The minimum excess energy and unmet load are 14,654 kWh and 0.1 kWh, respectively, for BWRO-150 unit with the load following (LF) strategy and BWRO-150 unit with the cycle charging (CC) control strategy. Compared to the grid extension, the break-even distance values are varied from 6.02 km to 9.63 km. The minimum BED is achieved by BWRO-250 unit with the predictive control strategy.
Regarding the annual amount of CO2 emissions, the values are changed from 2076 kg to 36,873 kg, respectively, for BWRO-500 unit with the predictive strategy and BWRO-150 unit with CC strategy. Based on this discussion, it can be concluded that it is very difficult to identify the optimal alternative, directly. To solve this dilemma, multicriteria decision-making must be applied to identify the most suitable size of the hybrid system for the case study. The results of MCDM analysis will present in the next section.
The optimal size and related costs of various elements of hybrid system with varying the rating of BWRO unit and control strategy are presented in Table 4, Table 5 and Table 6. The photovoltaic (PV) array size varies from 27.5 kW to 65.7 kW, respectively, for BWRO-150 unit with combined approach and BWRO-500 unit with LF strategy. The required number of batteries storage is varied from 13 units to 98 units. The minimum number of batteries storage (BS) is achieved by BWRO-150 unit with combined strategy, whereas the largest number is assigned to BWRO-500 unit with predictive strategy.
Table 4.
Optimal size and related costs of various elements of hybrid system using BWRO-150 plant.
Table 5.
The optimal size and the corresponding costs of various elements of the hybrid system using BWRO-250 plant.
Table 6.
Optimal size and related costs of various elements of a hybrid system using BWRO-500 plant.
For BWRO-150 plant, the minimum total NPC of $175,362.91 is achieved using a combined strategy. In this case, the fuel cost is $89,291.91 (50.92%), which represents the largest part of the total NPC flowed by the initial cost of 50,223.20$ (28.65%). The full replacement cost is $20,522.11, which represents around 11.7% of the total NPC. The replacement cost of diesel generator (DG) is $15,448.59, which represents 75.3% of the total replacement cost.
For BWRO-250 plant, the minimum total NPC of $137,772.51 is achieved using a predictive control strategy. For this case, the capital cost of $78,434.54 (56.93%) represents the largest part of the total NPC flowed by the fuel cost of $35,353.29 (25.66%). The PV array cost is $53,505.76, which represents around 68.17% of the total system capital cost.
For BWRO-500 plant, the minimum total NPC of $171,373.32 is achieved using a predictive control strategy. In this case, the capital cost of $132,465.88 (77.3%) represents the largest part of the total NPC flowed by the replacement cost of $27,540.96 (16.07%). The replacement cost of batteries is $23,210.01, which represents 84.3% of the total replacement cost. The replacement cost is high, as that the batteries need to be changed many times during the project lifetime.
Table 7 shows the details of the annual produced energy, annually consumed energy, annual excess energy, annual unmet load, annual capacity shortage, and the renewable fraction under different sizes of the BWRO-plant and various control strategies. Increasing the size of the BWRO-plant increases the renewable fraction. This is because increasing the size of the BWRO-plant decreases the required number of operating hours. However, this also increases the size of the PV array and, accordingly, the generated PV energy. The maximum annual generated PV energy of 127,037 kWh is achieved by BWRO-500 unit with the LF control strategy, whereas the yearly minimum generated PV energy of 52,336 kWh is achieved by BWRO-150 unit with the combined control strategy. On the contrary, increasing the size of the BWRO-plant decreases the dependency on the diesel generation system. The minimum annual generated DG energy of 2255 kWh is achieved by BWRO-500 unit with a predictive control strategy, whereas the maximum annual generated DG energy of 41,740 kWh is achieved by BWRO-150 unit with the CC control strategy.
Table 7.
The details of the produced and consumed energy.
From the environmental impact, using BRWO-150 plant increases the annual production of produced CO2. The maximum amount of CO2 is 36,873 kg, which is produced using BWRO-150 unit with the CC control strategy. This result is compatible with most dependency on the DG under this condition. On the contrary, the amount of CO2 can be significantly reduced, thanks to increasing the size of BWRO-plant. The lowest annual amount of CO2 is 2076 kg. It is achieved by BWRO-500 plant with a predictive control strategy. Moreover, the other pollutants are reduced, compared to BWRO-150 plant. Table 8 shows the detailed amount of different pollutant emissions by different sizes of BWRO-plant and various control strategies.
Table 8.
Pollutants emission for various considered alternatives of the hybrid system.
4.2. Results of MCDM
As discussed in Section 4.1, it is challenging to determine the optimal alternative directly, because no option has the best parameters. To solve this problem, multicriteria decision-making must be applied to identify the hybrid system’s most suitable size for the case study. Based on Table 3, the normalized technical criteria values for the case study are presented in Table 9.
Table 9.
The case study normalized the decision matrix for the technical criteria.
The CRITIC method is employed to determine the importance of technical criteria. The results confirmed that the most and least important technical criteria were C3 (initial cost) and C7 (BED), respectively, as presented in Table 10. The weighted normalized decision matrix for the technical criteria presented in Table 11 was constructed using Table 9 and Table 10.
Table 10.
Technical Criteria Importance Through Intercriteria Correlation (CRITIC) results.
Table 11.
The case study technical criteria weighted normalized decision matrix.
Regarding to Table 11, the technical criteria for ideal and nonideal solutions for the alternatives are determined and presented in Table 12. These results were used to evaluate the alternatives for ideal and nonideal distances for the case study, as illustrated in Table 13.
Table 12.
Technical criteria ideal and nonideal solutions.
Table 13.
Economic criteria ideal and nonideal distances.
As illustrated in Table 13, the final rank for all alternatives has been determined. Alternative A8, which represents BWRO-250 plant with a predictive control strategy, is the best option for the case study, followed by A6 (BWRO-250 plant with CC strategy) and A11 (BWRO-500 plant with combined strategy), whereas the worst option is alternative A7, which represents BWRO-250 plant with a combined control strategy. The optimal components’ sizes corresponding to the best alternative are 44.6 kW PV array, 10 kW DG, 24 units of batteries storge, and a 17.8 kW converter. Under this situation, the technical, economic, and environmental parameters are the annual operating cost ($4590), a renewable fraction (77.5%), initial cost ($78,435), the cost of energy ($0.156/kWh), the excess energy (27,532 kWh), unmet load (6.84 kWh), BED (6.02 km), and the annual amount of CO2 (14,289 kg). The total present cost is $137,772.5. The capital cost of $78,434.54 (56.93%) represents the largest part of the total NPC flowed by the fuel cost of $35,353.29 (25.66%). The cost of PV array cost is $53,505.76, which represents around 68.17% of the total system capital cost. The total annual produced energy is 99,602 kWh. A total of 84.5 % (84,179 kWh) of the produced energy is generated by the PV array, whereas the remainder amount (15.5%) is generated by DG.
5. Conclusions
Determination of the best energy management strategy and the optimal size of the water desalination unit was the main objective of this research work. Three–four energy management strategies; four energy management strategies, load following (LF), cycle charging (CC), combined LF–CC, and predictive strategy; and three different sizes of BWRO desalination units, BWRO-150, BWRO-250, and BWRO-500 were considered. Various parameters, such as operating cost, renewable fraction, initial cost, the cost of energy, excess energy, unmet load, breakeven grid extension distance, and the amount of CO2, were considered during the identification process. Based on HOMER software, by combining Criteria Importance Through Intercriteria Correlation (CRITIC) and Technique for Order Preference by Similarity to Ideal Solution (TOPSIS), the best alternative for the case study has been determined. The main finding can be outlined as follows:
- Increasing the size of the BWRO-plant increases the renewable fraction and decreases the dependency on the diesel generation system.
- Using the BRWO-150 plant increases the annual production of CO2. The maximum amount of CO2 is 36,873 kg, which was produced using BWRO-150 unit with the CC control strategy.
- The lowest annual amount of CO2 is 2076 kg. It is achieved by BWRO-500 plant with a predictive control strategy.
- BWRO-250 plant with the predictive control strategy is the best option for the case study, followed by A6 (BWRO-250 plant with CC strategy) and A11 (BWRO-500 plant with combined strategy).
- The worst alternative is the BWRO-250 plant with the combined control strategy.
- The optimal components’ sizes corresponding to the best alternative are 44.6 kW PV array, 10 kW DG, 24 units of batteries storge, and 17.8 kW converter. Under this situation, the technical, economic, and environmental parameters are annual operating cost ($4590), the renewable fraction (77.5%), initial cost ($78,435), the cost of energy ($0.156/kWh), the excess energy (27,532 kWh), unmet load (6.84 kWh), BED (6.02 km) and the annual amount of CO2 (14,289 kg).
Author Contributions
Conceptualization, H.R., B.A., M.A.A., A.F., M.A. and H.A.Z.; Data curation, H.R. and B.A.; Formal analysis, H.R., A.F. and M.A.; Funding acquisition, B.A.; Investigation, H.R., M.A. and B.A.; Methodology, H.R., B.A., A.F., M.A.A. and H.A.Z.; Writing—original draft, H.R., M.A., M.A.A. and H.A.Z.; Writing—review & editing, H.R., B.A., A.F., M.A., A.G.O., M.A.A. and H.A.Z. All authors have read and agreed to the published version of the manuscript.
Funding
This research was funded by TAIF UNIVERSITY RESEARCHERS SUPPORTING PROJECT, grant number TURSP-2020/278 and the APC was funded by Basem Alamri.
Institutional Review Board Statement
Not applicable.
Informed Consent Statement
Not applicable.
Data Availability Statement
No new data were created or analyzed in this study.
Acknowledgments
The authors would like to acknowledge the financial support received from Taif University Researchers Supporting Project Number (TURSP-2020/278), Taif University, Taif, Saudi Arabia.
Conflicts of Interest
The authors declare no conflict of interest.
References
- Wilberforce, T.; Olabi, A.; Sayed, E.T.; Elsaid, K.; Abdelkareem, M.A. Progress in carbon capture technologies. Sci. Total. Environ. 2021, 761, 143203. [Google Scholar] [CrossRef] [PubMed]
- Hosseini-Ardali, S.M.; Hazrati-Kalbibaki, M.; Fattahi, M.; Lezsovits, F. Multi-objective optimization of post combustion CO2 capture using methyldiethanolamine (MDEA) and piperazine (PZ) bi-solvent. Energy 2020, 211, 119035. [Google Scholar] [CrossRef]
- Olabi, A.G.; Elsaid, K.; Rabaia, M.K.H.; Askalany, A.A.; Abdelkareem, M.A. Waste heat-driven desalination systems: Perspective. Energy 2020, 209, 118373. [Google Scholar] [CrossRef]
- Dincer, H.; Yuksel, S. Balanced scorecard-based analysis of investment decisions for the renewable energy alternatives: A comparative analysis based on the hybrid fuzzy decision-making approach. Energy 2019, 175, 1259–1270. [Google Scholar] [CrossRef]
- Sayed, E.T.; Wilberforce, T.; Elsaid, K.; Rabaia, M.K.H.; Abdelkareem, M.A.; Chae, K.-J.; Olabi, A.G. A critical review on environmental impacts of renewable energy systems and mitigation strategies: Wind, hydro, biomass and geothermal. Sci. Total Environ. 2021, 766, 144505. [Google Scholar] [CrossRef]
- Chitgar, N.; Moghimi, M. Design and evaluation of a novel multi-generation system based on SOFC-GT for electricity, fresh water and hydrogen production. Energy 2020, 197, 117162. [Google Scholar] [CrossRef]
- Abdelkareem, M.A.; Assad, M.; Sayed, E.T.; Soudan, B. Recent progress in the use of renewable energy sources to power water desalination plants. Desalination 2018, 435, 97–113. [Google Scholar] [CrossRef]
- Nassrullah, H.; Anis, S.F.; Hashaikeh, R.; Hilal, N. Energy for desalination: A state-of-the-art review. Desalination 2020, 491, 114569. [Google Scholar] [CrossRef]
- Qasim, M.; Badrelzaman, M.; Darwish, N.N.; Darwish, N.A.; Hilal, N. Reverse osmosis desalination: A state-of-the-art review. Desalination 2019, 459, 59–104. [Google Scholar] [CrossRef]
- Ruiz-García, A.; Nuez, I. Long-term intermittent operation of a full-scale BWRO desalination plant. Desalination 2020, 489, 114526. [Google Scholar] [CrossRef]
- Zhao, S.; Liao, Z.; Fane, A.; Li, J.; Tang, C.; Zheng, C.; Lin, J.; Kong, L. Engineering antifouling reverse osmosis membranes: A review. Desalination 2021, 499, 114857. [Google Scholar] [CrossRef]
- Park, K.; Kim, J.; Yang, D.R.; Hong, S. Towards a low-energy seawater reverse osmosis desalination plant: A review and theoretical analysis for future directions. J. Membr. Sci. 2020, 595, 117607. [Google Scholar] [CrossRef]
- Ahmed, F.E.; Hashaikeh, R.; Diabat, A.; Hilal, N. Mathematical and optimization modelling in desalination: State-of-the-art and future direction. Desalination 2019, 469, 114092. [Google Scholar] [CrossRef]
- Ruiz-García, A.; de la Nuez-Pestana, I. A computational tool for designing BWRO systems with spiral wound modules. Desalination 2018, 426, 69–77. [Google Scholar] [CrossRef]
- Mujtaba, I.; Al-Obaidi, M.; Kara-Zaïtri, C. Applications of Reverse Osmosis for the Removal of Organic Compounds from Wastewater: A state-of-the-art from Process Modelling to Simulation. In Materials Research Foundations 32; MRF: Chennai, India, 2018. [Google Scholar]
- Ruiz-García, A.; Nuez, I.; Carrascosa-Chisvert, M.D.; Santana, J.J. Simulations of BWRO systems under different feedwater characteristics. Analysis of operation windows and optimal operating points. Desalination 2020, 491, 114582. [Google Scholar] [CrossRef]
- Cao, K.; Siddhamshetty, P.; Ahn, Y.; Mukherjee, R.; Kwon, J.S.-I. Economic model-based controller design framework for hydraulic fracturing to optimize shale gas production and water usage. Ind. Eng. Chem. Res. 2019, 58, 12097–12115. [Google Scholar] [CrossRef]
- Elsaid, K.; Sayed, E.T.; Abdelkareem, M.A.; Mahmoud, M.S.; Ramadan, M.; Olabi, A.G. Environmental impact of emerging desalination technologies: A preliminary evaluation. J. Environ. Chem. Eng. 2020, 8, 104099. [Google Scholar] [CrossRef]
- Rabaia, M.K.H.; Abdelkareem, M.A.; Sayed, E.T.; Elsaid, K.; Chae, K.-J.; Wilberforce, T.; Olabi, A.G. Environmental impacts of solar energy systems: A review. Sci. Total Environ. 2021, 754, 141989. [Google Scholar] [CrossRef]
- Fathy, A.; Elaziz, M.A.; Sayed, E.T.; Olabi, A.G.; Rezk, H. Optimal parameter identification of triple-junction photovoltaic panel based on enhanced moth search algorithm. Energy 2019, 188, 116025. [Google Scholar] [CrossRef]
- Rezk, H.; Al-Dhaifallah, M.; Hassan, Y.B.; Ziedan, H.A. Optimization and Energy Management of Hybrid Photovoltaic-Diesel-Battery System to Pump and Desalinate Water at Isolated Regions. IEEE Access 2020, 8, 102512–102529. [Google Scholar] [CrossRef]
- Rezk, H.; Alsaman, A.S.; Al-Dhaifallah, M.; Askalany, A.A.; Abdelkareem, M.A.; Nassef, A.M. Identifying optimal operating conditions of solar-driven silica gel based adsorption desalination cooling system via modern optimization. Sol. Energy 2019, 181, 475–489. [Google Scholar] [CrossRef]
- Rezk, H.; Alghassab, M.; Ziedan, H.A. An optimal sizing of stand-alone hybrid PV-fuel cell-battery to desalinate seawater at saudi NEOM city. Processes 2020, 8, 382. [Google Scholar] [CrossRef]
- Zimmer-Gembeck, M.J.; Helfand, M. Ten years of longitudinal research on US adolescent sexual behavior: Developmental correlates of sexual intercourse, and the importance of age, gender and ethnic background. Dev. Rev. 2008, 28, 153–224. [Google Scholar] [CrossRef]
- Wang, J.-J.; Jing, Y.-Y.; Zhang, C.-F.; Zhao, J.-H. Review on multi-criteria decision analysis aid in sustainable energy decision-making. Renew. Sustain. Energy Rev. 2009, 13, 2263–2278. [Google Scholar] [CrossRef]
- Wimmler, C.; Hejazi, G.; Fernandes, E.; Moreira, C.; Connors, S. Multi-criteria decision support methods for renewable energy systems on islands. J. Clean Energy Technol. 2015, 3, 185–195. [Google Scholar] [CrossRef]
- Demirtas, O. Evaluating the best renewable energy technology for sustainable energy planning. Int. J. Energy Econ. Policy 2013, 3, 23. [Google Scholar]
- Alizadeh, R.; Soltanisehat, L.; Lund, P.D.; Zamanisabzi, H. Improving renewable energy policy planning and decision-making through a hybrid MCDM method. Energy Policy 2020, 137, 111174. [Google Scholar] [CrossRef]
- Alizadeh, R.; Majidpour, M.; Maknoon, R.; Kaleibari, S.S. Clean development mechanism in Iran: Does it need a revival? Int. J. Glob. Warm. 2016, 10, 196–215. [Google Scholar] [CrossRef]
- Alizadeh, R.; Maknoon, R.; Majidpour, M.; Salimi, J. Energy policy in Iran and international commitments for GHG emission reduction. J. Environ. Sci. Technol. 2015, 17, 183–198. [Google Scholar]
- Ali, T.; Nahian, A.J.; Ma, H. A hybrid multi-criteria decision-making approach to solve renewable energy technology selection problem for Rohingya refugees in Bangladesh. J. Clean. Prod. 2020, 273, 122967. [Google Scholar] [CrossRef]
- Wang, M.; Liu, S.; Wang, S.; Lai, K.K. A weighted product method for bidding strategies in multi-attribute auctions. J. Syst. Sci. Complex. 2010, 23, 194–208. [Google Scholar] [CrossRef]
- Mann, S.; Evangelos, T. An examination of the effectiveness of multi-dimensional decision-making methods. Int. J. Decis. Support Syst. 1989, 5, 303–312. [Google Scholar]
- Misra, S.K.; Ray, A. Comparative Study on Different Multi-Criteria Decision Making Tools in Software project selection scenario. Int. J. Adv. Res. Comput. Sci. 2012, 3, 172–178. [Google Scholar]
- Marler, R.T.; Arora, J.S. Survey of multi-objective optimization methods for engineering. Struct. Multidiscip. Optim. 2004, 26, 369–395. [Google Scholar] [CrossRef]
- Govindan, K.; Jepsen, M.B. ELECTRE: A comprehensive literature review on methodologies and applications. Eur. J. Oper. Res. 2016, 250, 1–29. [Google Scholar] [CrossRef]
- Figueira, J.R.; Greco, S.; Roy, B.; Słowiński, R. ELECTRE methods: Main features and recent developments. In Handbook of Multicriteria Analysis; Springer: Berlin/Heidelberg, Germany, 2010; pp. 51–89. [Google Scholar]
- Leyva-Lopez, J.C.; Fernandez-Gonzalez, E. A new method for group decision support based on ELECTRE III methodology. Eur. J. Oper. Res. 2003, 148, 14–27. [Google Scholar] [CrossRef]
- Ishizaka, A.; Labib, A. Analytic hierarchy process and expert choice: Benefits and limitations. OR Insight 2009, 22, 201–220. [Google Scholar] [CrossRef]
- Liu, H.-C.; Mao, L.-X.; Zhang, Z.-Y.; Li, P. Induced aggregation operators in the VIKOR method and its application in material selection. Appl. Math. Model. 2013, 37, 6325–6338. [Google Scholar] [CrossRef]
- Liao, H.; Xu, Z.; Zeng, X.-J. Hesitant fuzzy linguistic VIKOR method and its application in qualitative multiple criteria decision making. IEEE Trans. Fuzzy Syst. 2014, 23, 1343–1355. [Google Scholar] [CrossRef]
- Gul, M.; Celik, E.; Aydin, N.; Gumus, A.T.; Guneri, A.F. A state of the art literature review of VIKOR and its fuzzy extensions on applications. Appl. Soft Comput. 2016, 46, 60–89. [Google Scholar] [CrossRef]
- Babatunde, M.; Ighravwe, D. A CRITIC-TOPSIS framework for hybrid renewable energy systems evaluation under techno-economic requirements. J. Proj. Manag. 2019, 4, 109–126. [Google Scholar] [CrossRef]
- Shih, H.-S.; Shyur, H.-J.; Lee, E.S. An extension of TOPSIS for group decision making. Math. Comput. Model. 2007, 45, 801–813. [Google Scholar] [CrossRef]
- Sun, C. A performance evaluation model by integrating fuzzy AHP and fuzzy TOPSIS methods. Expert Syst. Appl. 2010, 37, 7745–7754. [Google Scholar] [CrossRef]
- Awasthi, A.; Chauhan, S.S.; Omrani, H. Application of fuzzy TOPSIS in evaluating sustainable transportation systems. Expert Syst. Appl. 2011, 38, 12270–12280. [Google Scholar] [CrossRef]
- Brans, J.; Mareschal, B.; Vince, P. A preference ran ing organization method: The PROMETHEE method for MCDM. Manag. Sci. 1985, 31, 647–656. [Google Scholar] [CrossRef]
- Abedi, M.; Torabi, S.A.; Norouzi, G.-H.; Hamzeh, M.; Elyasi, G.-R. PROMETHEE II: A knowledge-driven method for copper exploration. Comput. Geosci. 2012, 46, 255–263. [Google Scholar] [CrossRef]
- Amaral, T.M.; Costa, A. Operations Research for Health Care Improving decision-making and management of hospital resources: An application of the PROMETHEE II method in an Emergency Department. Oper. Res. Health Care 2014, 3, 1–6. [Google Scholar]
- Wang, J.; Zionts, S. Negotiating wisely: Considerations based on MCDM/MAUT. Eur. J. Oper. Res. 2008, 188, 191–205. [Google Scholar] [CrossRef]
- Loken, E.; Botterud, A.; Holen, A.T. Decision analysis and uncertainties in planning local energy systems. In Proceedings of the 2006 International Conference on Probabilistic Methods Applied to Power Systems, Stockholm, Sweden, 11–15 June 2006; pp. 1–8. [Google Scholar]
- Wang, Z.; Zhang, S.; Kuang, J. A dynamic MAUT decision model for R&D project selection. In Proceedings of the 2010 International Conference on Computing, Control and Industrial Engineering, Wuhan, China, 5–6 June 2010; pp. 423–427. [Google Scholar]
- Kumar, A.; Sah, B.; Singh, A.R.; Deng, Y.; He, X.; Kumar, P.; Bansal, R.C. A review of multi criteria decision making (MCDM) towards sustainable renewable energy development. Renew. Sustain. Energy Rev. 2017, 69, 596–609. [Google Scholar] [CrossRef]
- Zavadskas, E.K.; Turskis, Z.; Kildienė, S. State of art surveys of overviews on MCDM/MADM methods. Technol. Econ. Dev. Econ. 2014, 20, 165–179. [Google Scholar] [CrossRef]
- Kabir, G.; Sadiq, R.; Tesfamariam, S. A review of multi-criteria decision-making methods for infrastructure management. Struct. Infrastruct. Eng. 2014, 10, 1176–1210. [Google Scholar] [CrossRef]
- Hwang, C.; Yoon, K. Multi-objective decision making–methods and application. In A State-of-the-Art Study; Springer: New York, NY, USA, 1981. [Google Scholar]
- Belenson, S.M.; Kapur, K.C. An algorithm for solving multicriterion linear programming problems with examples. J. Oper. Res. Soc. 1973, 24, 65–77. [Google Scholar] [CrossRef]
- Zelany, M. A concept of compromise solutions and the method of the displaced ideal. Comput. Oper. Res. 1974, 1, 479–496. [Google Scholar] [CrossRef]
- Kim, G.; Park, C.S.; Yoon, K.P. Identifying investment opportunities for advanced manufacturing systems with comparative-integrated performance measurement. Int. J. Prod. Econ. 1997, 50, 23–33. [Google Scholar] [CrossRef]
- Cheng, S.; Chan, C.W.; Huang, G.H. Using multiple criteria decision analysis for supporting decisions of solid waste management. J. Environ. Sci. Healthpart A 2002, 37, 975–990. [Google Scholar] [CrossRef] [PubMed]
- Zanakis, S.H.; Solomon, A.; Wishart, N.; Dublish, S. Multi-attribute decision making: A simulation comparison of select methods. Eur. J. Oper. Res. 1998, 107, 507–529. [Google Scholar] [CrossRef]
- Shih, H.-S.; Wang, C.-H.; Lee, E. A multiattribute GDSS for aiding problem-solving. Math. Comput. Model. 2004, 39, 1397–1412. [Google Scholar] [CrossRef]
- Jin, X.; Jawor, A.; Kim, S.; Hoek, E.M. Effects of feed water temperature on separation performance and organic fouling of brackish water RO membranes. Desalination 2009, 239, 346–359. [Google Scholar] [CrossRef]
- Karabelas, A.; Mitrouli, S.; Kostoglou, M. Scaling in reverse osmosis desalination plants: A perspective focusing on development of comprehensive simulation tools. Desalination 2020, 474, 114193. [Google Scholar] [CrossRef]
- Ruiz-García, A.; Feo-García, J. Estimation of maximum water recovery in RO desalination for different feedwater inorganic compositions. Desalination Water Treat. 2017, 70, 34–45. [Google Scholar] [CrossRef]
- Abdalla, O.; Rezk, H.; Ahmed, E.M. Wind driven optimization algorithm based global MPPT for PV system under non-uniform solar irradiance. Sol. Energy 2019, 180, 429–444. [Google Scholar] [CrossRef]
- Alamri, H.R.; Rezk, H.; Abd-Elbary, H.; Ziedan, H.A.; Elnozahy, A. Experimental Investigation to Improve the Energy Efficiency of Solar PV Panels Using Hydrophobic SiO2 Nanomaterial. Coatings 2020, 10, 503. [Google Scholar] [CrossRef]
- Rezk, H.; Aly, M.; Al-Dhaifallah, M.; Shoyama, M. Design and hardware implementation of new adaptive fuzzy logic-based MPPT control method for photovoltaic applications. IEEE Access 2019, 7, 106427–106438. [Google Scholar] [CrossRef]
- Rezk, H.; Mazen, A.-O.; Gomaa, M.R.; Tolba, M.A.; Fathy, A.; Abdelkareem, M.A.; Olabi, A.; Abou Hashema, M. A novel statistical performance evaluation of most modern optimization-based global MPPT techniques for partially shaded PV system. Renew. Sustain. Energy Rev. 2019, 115, 109372. [Google Scholar] [CrossRef]
- Govindan, K.; Khodaverdi, R.; Jafarian, A. A fuzzy multi criteria approach for measuring sustainability performance of a supplier based on triple bottom line approach. J. Clean. Prod. 2013, 47, 345–354. [Google Scholar] [CrossRef]


Publisher’s Note: MDPI stays neutral with regard to jurisdictional claims in published maps and institutional affiliations. |
© 2021 by the authors. Licensee MDPI, Basel, Switzerland. This article is an open access article distributed under the terms and conditions of the Creative Commons Attribution (CC BY) license (https://creativecommons.org/licenses/by/4.0/).