TOPOI RESOURCES: Quantification and Assessment of Global Warming Potential and Land-Uptake of Residential Buildings in Settlement Types along the Urban–Rural Gradient—Opportunities for Sustainable Development
Abstract
:1. Introduction
2. The Urban–Rural Settlement System of Lower Saxony
3. Materials
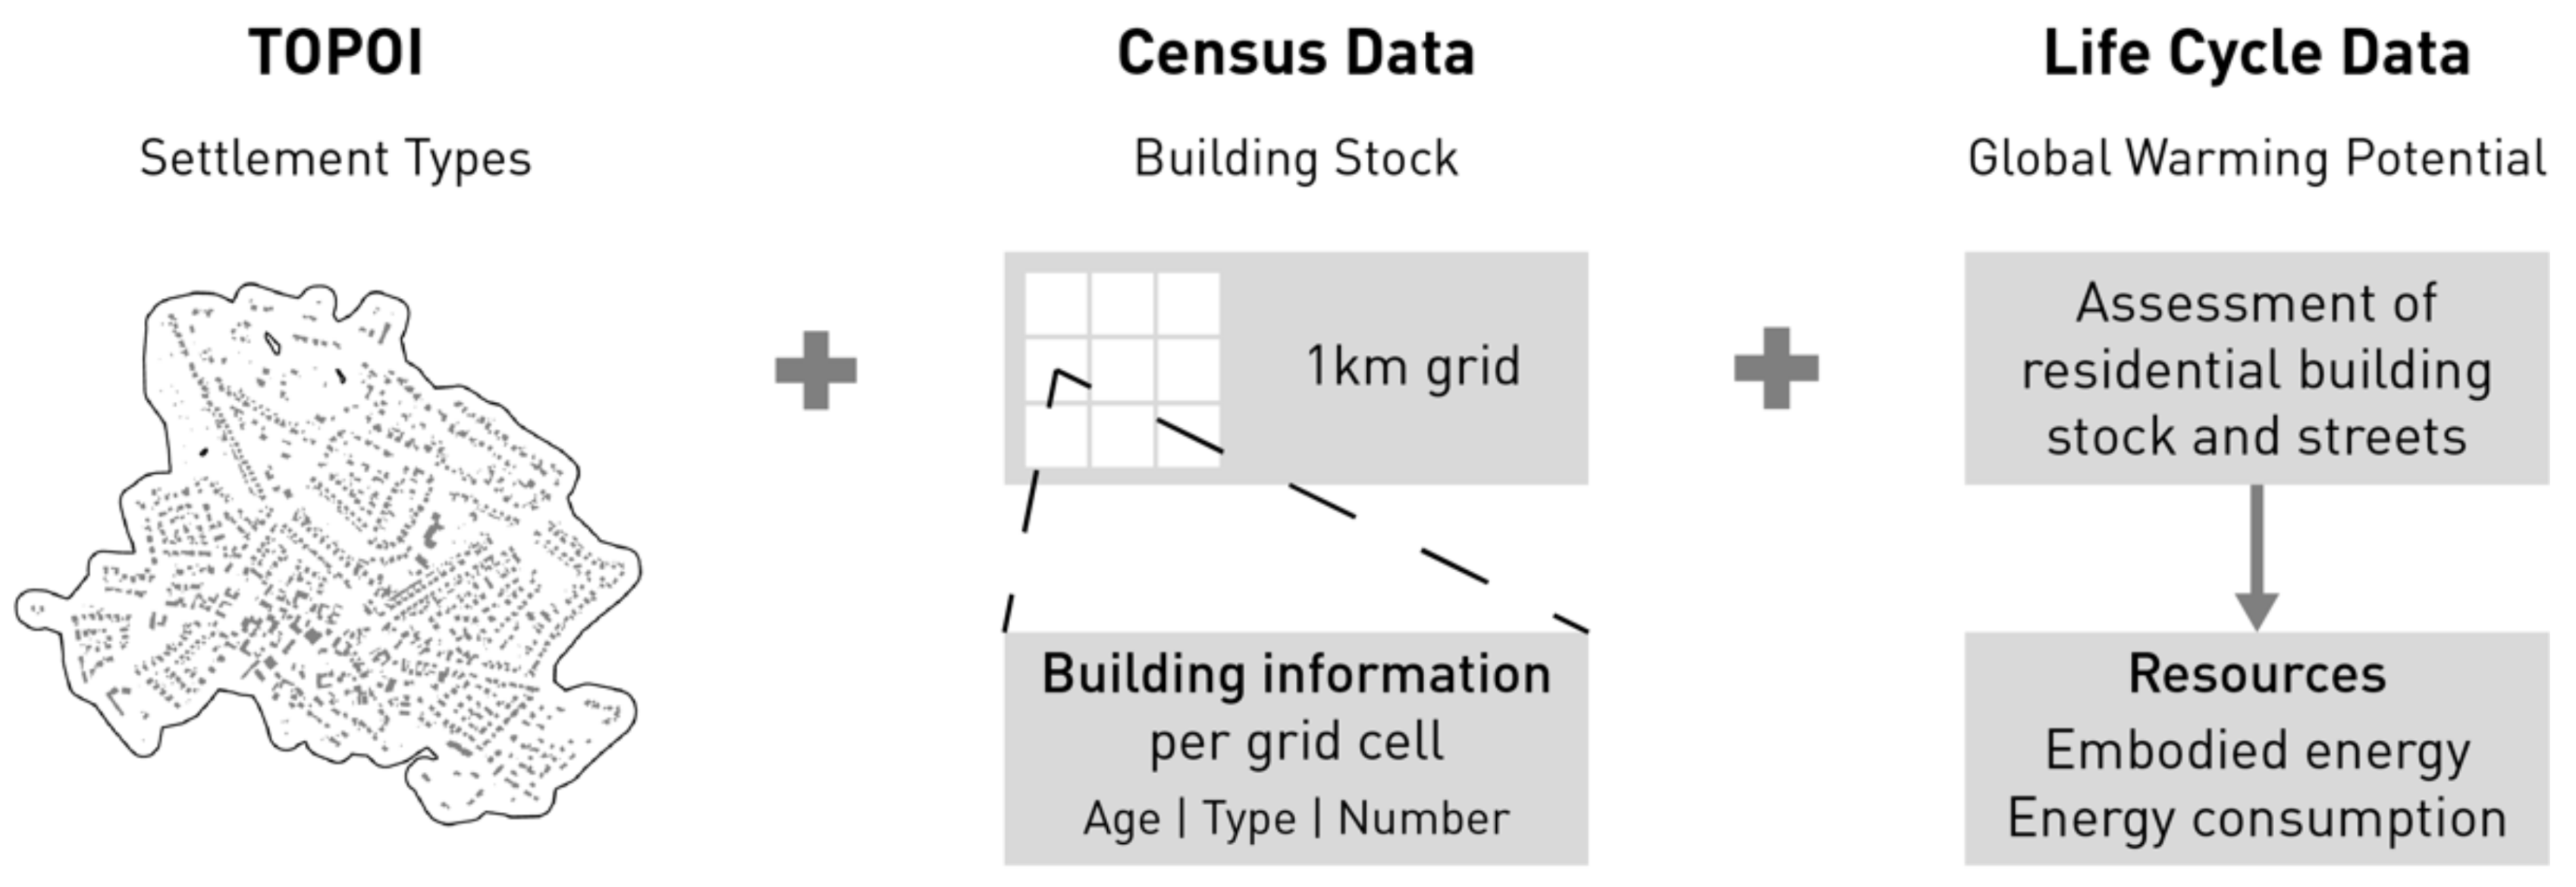
3.1. Life Cycle Assessment Data—Residential Building Stock
3.2. Life Cycle Assessment Data–Streets
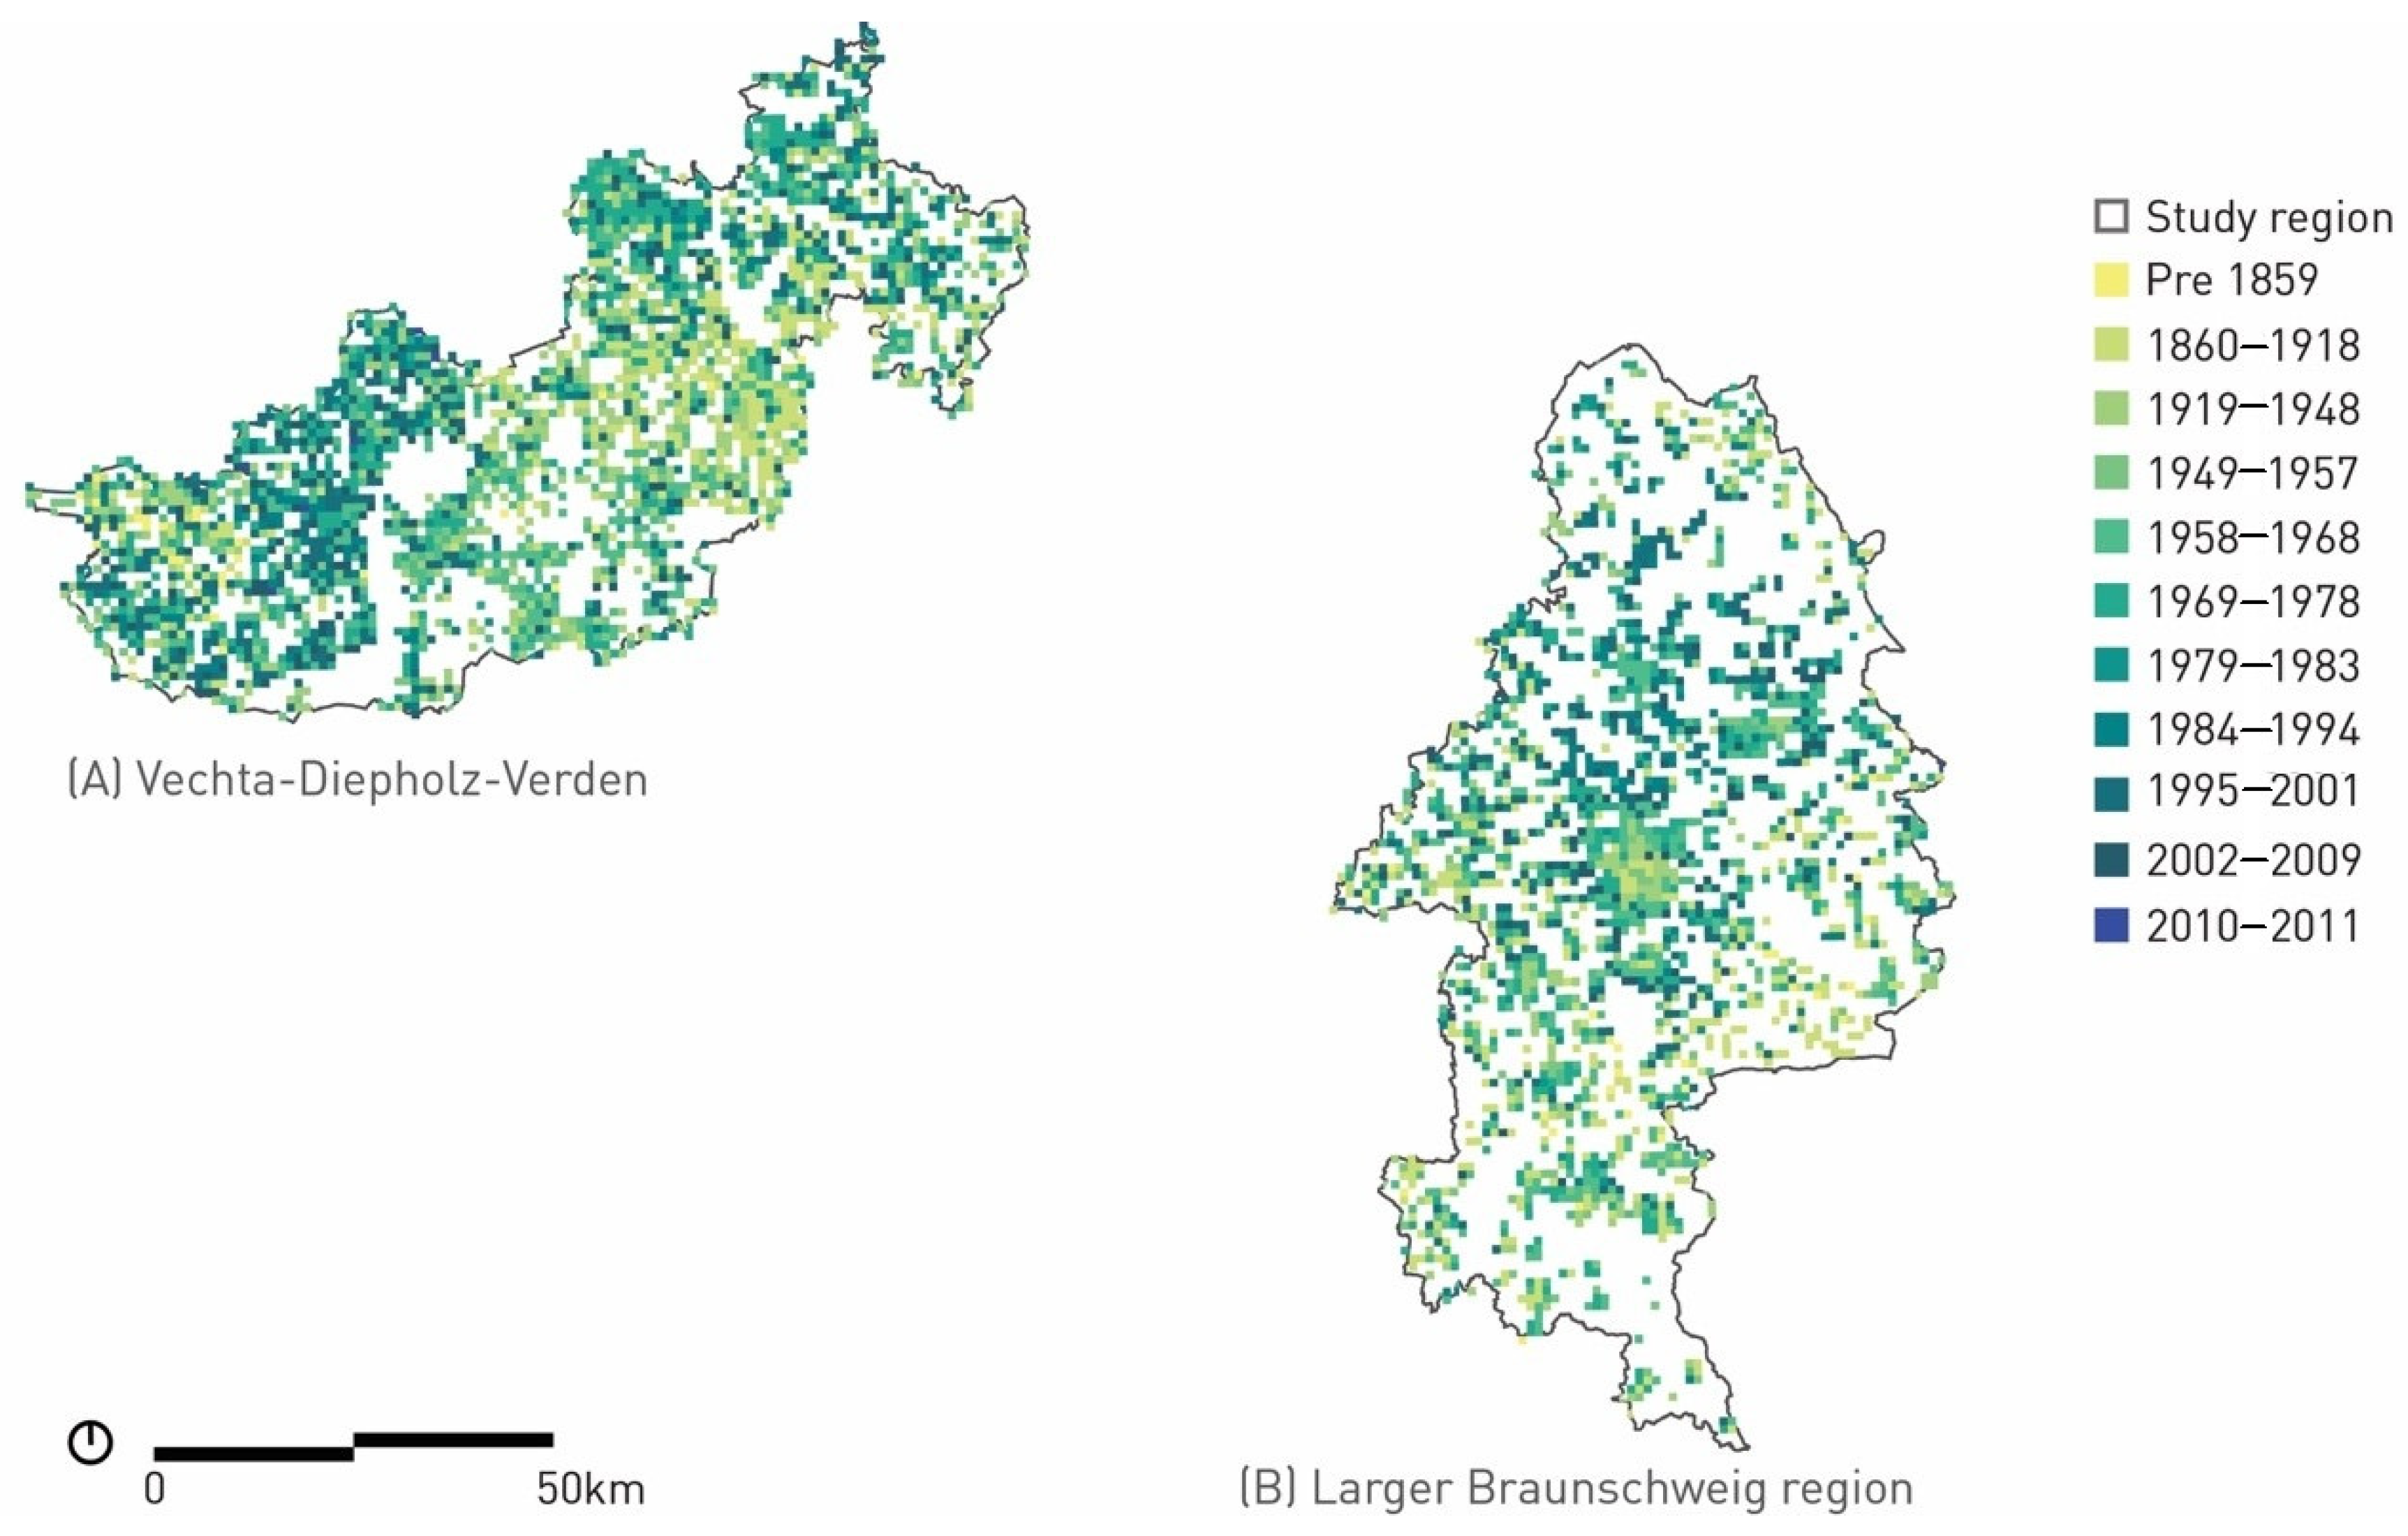
3.3. German Census 2011
3.4. Settlement Types
4. Method
4.1. Temporal–Spatial Dynamics of Growth
4.2. Calculation of Global Warming Potential (GWP)
4.3. Superposition of the Generated Key Data with the TOPOI Settlement Units
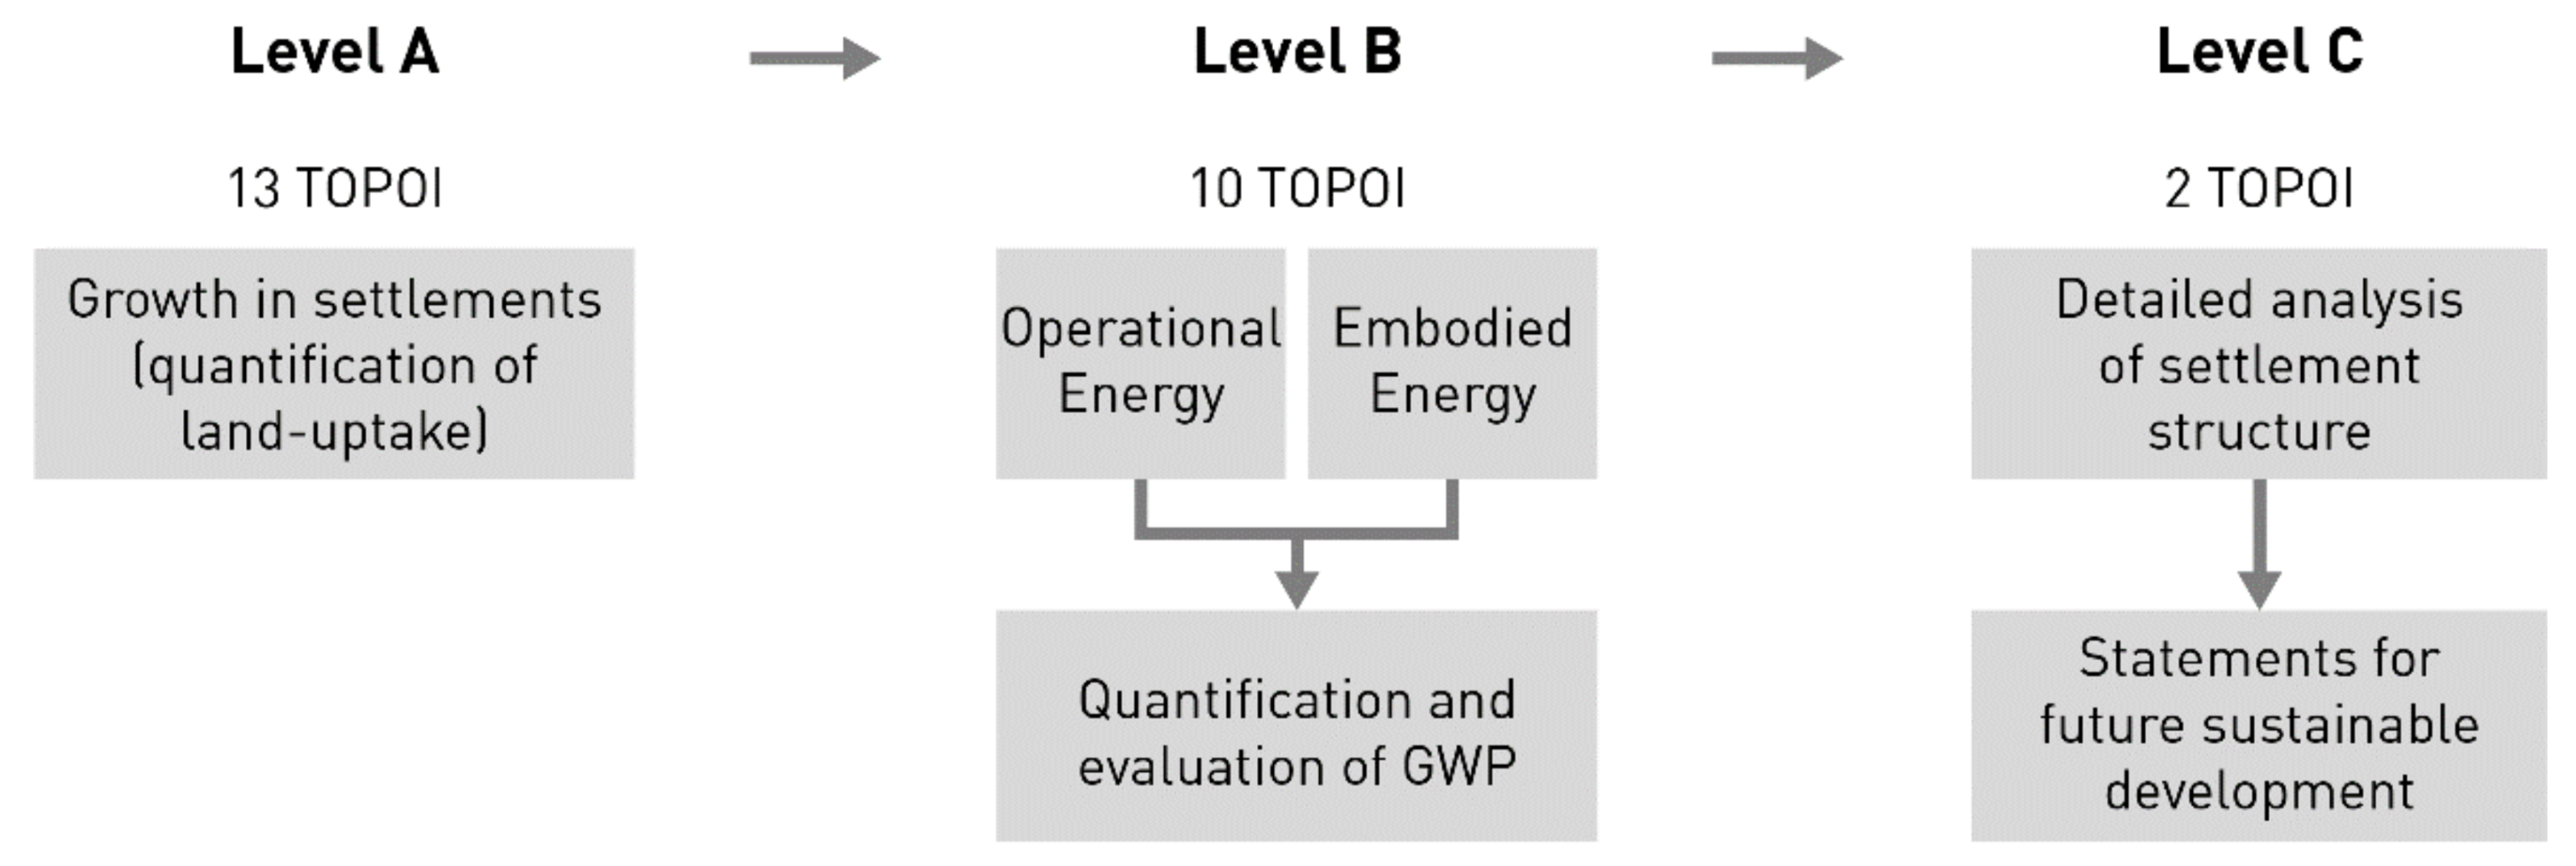
4.4. Evaluation Framework
5. Results
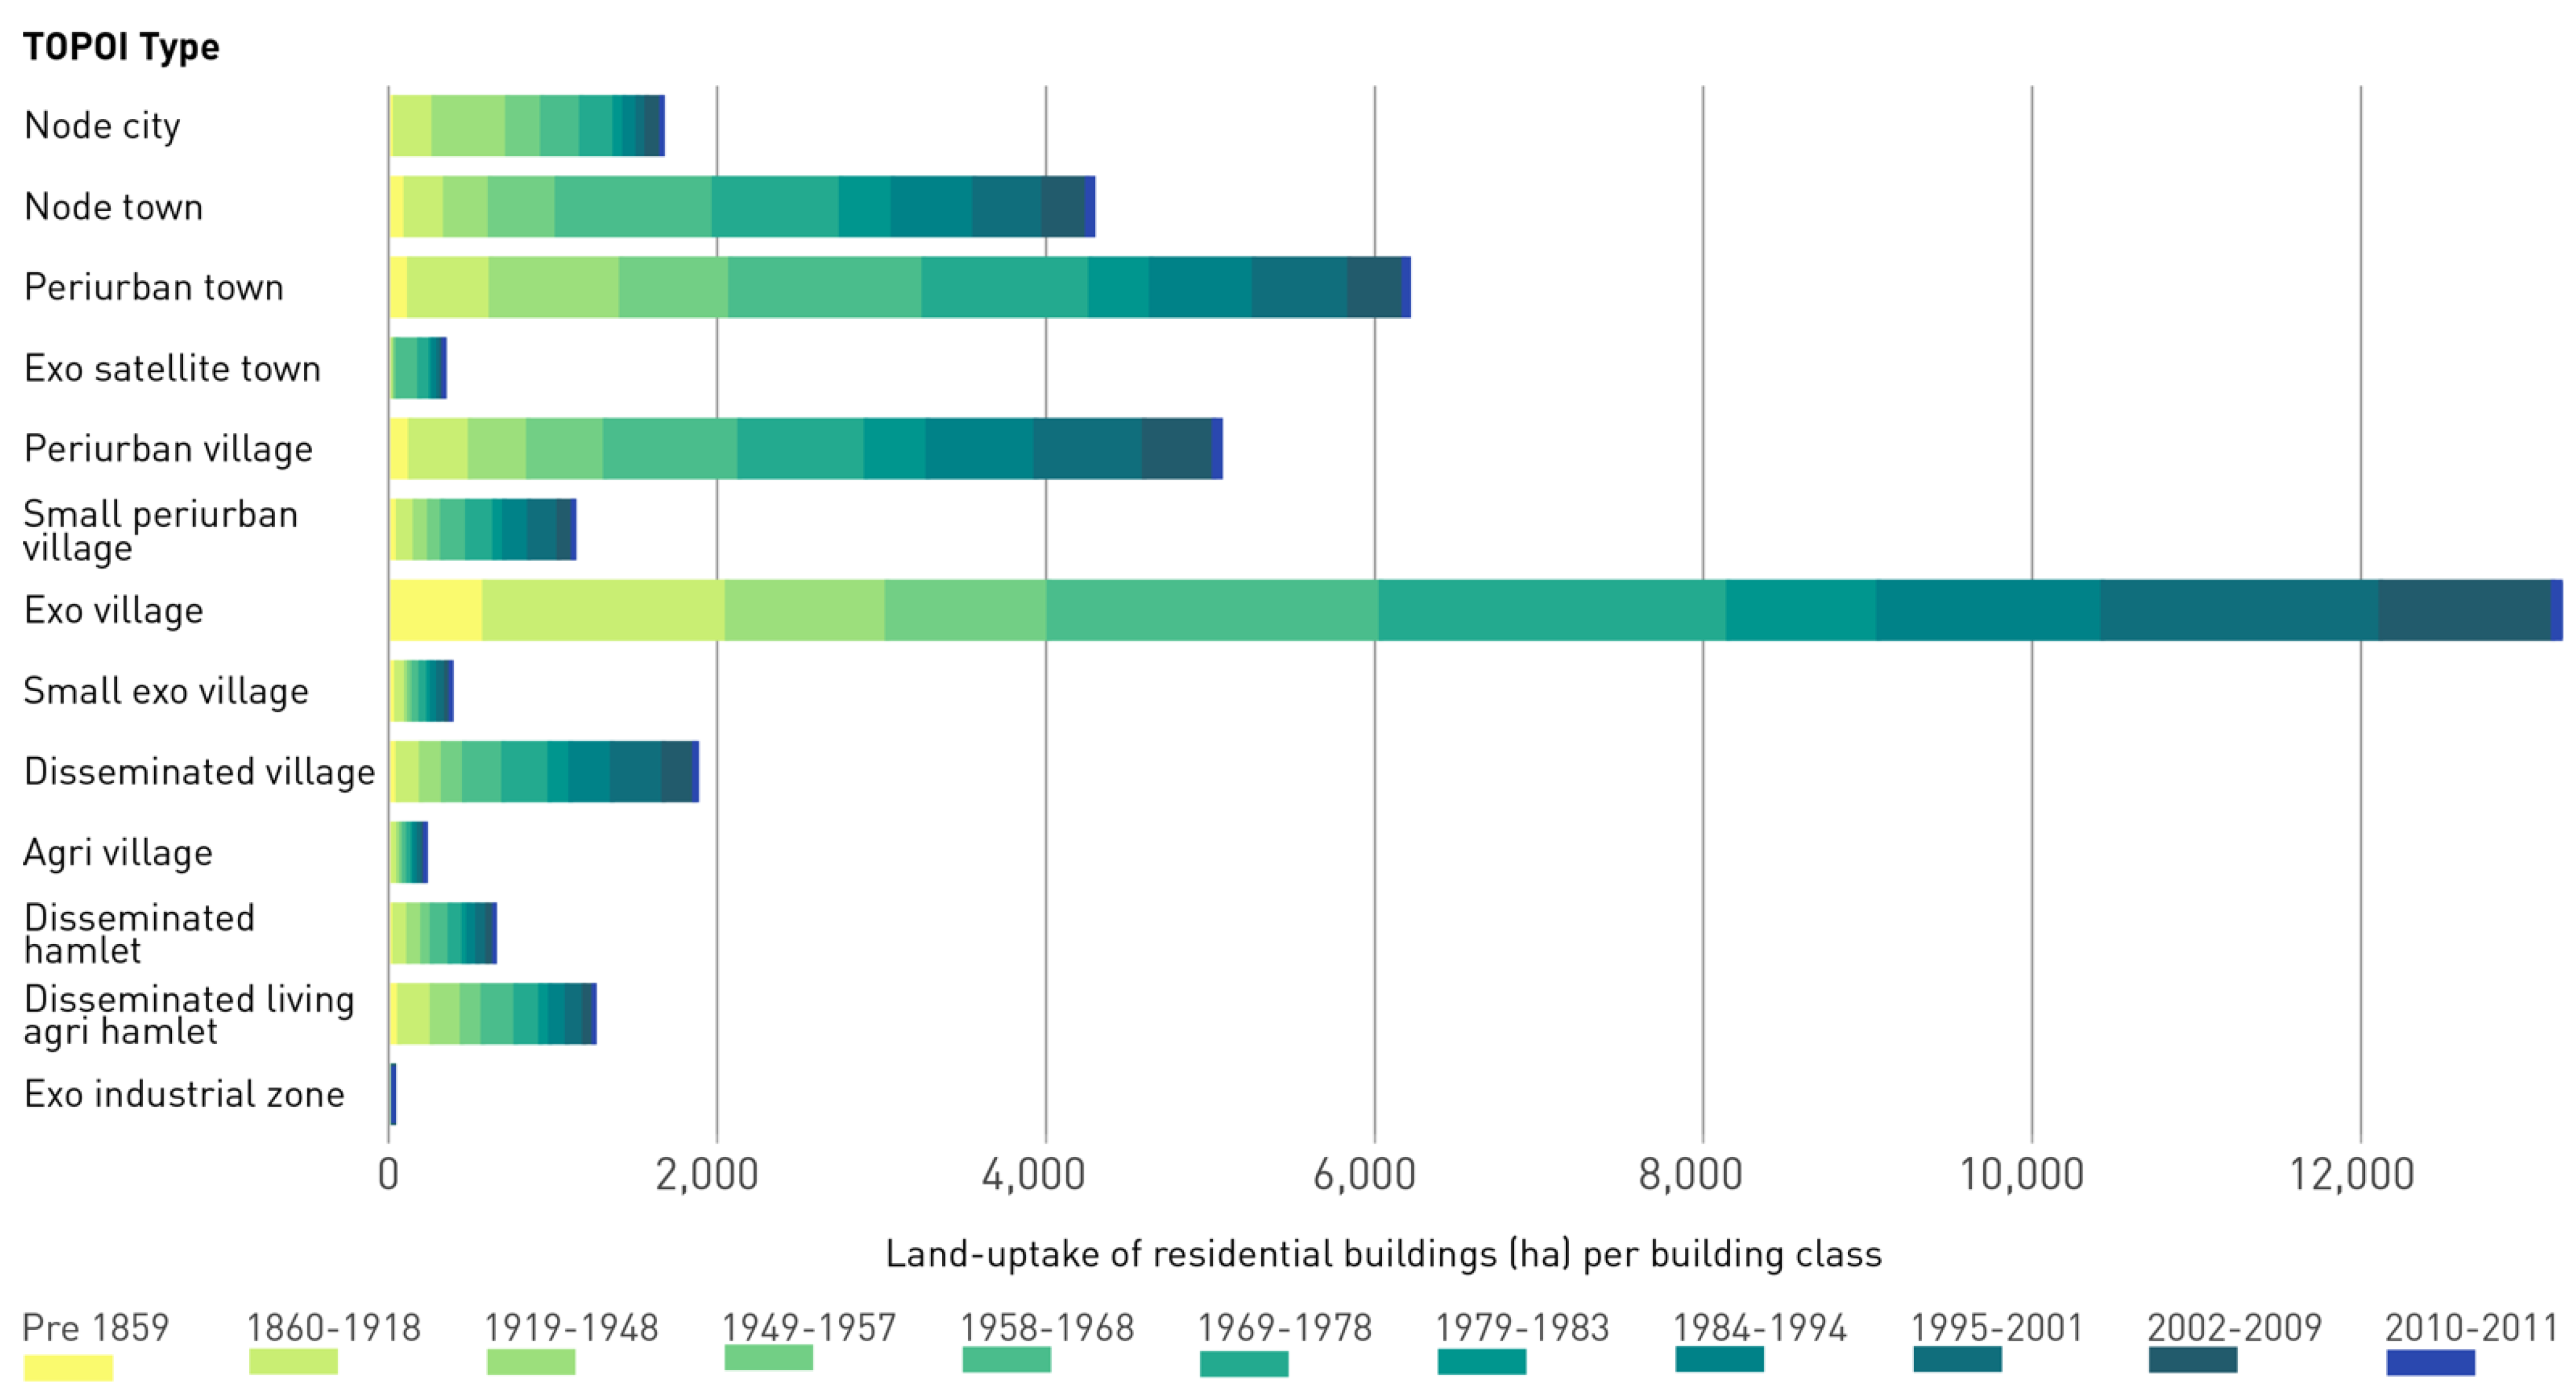
5.1. Results—Level A
5.2. Results—Level B
5.3. Results—Level C
6. Discussion
Author Contributions
Funding
Institutional Review Board Statement
Informed Consent Statement
Data Availability Statement
Acknowledgments
Conflicts of Interest
Appendix A
| FORM | Min. | Max. |
|---|---|---|
| Area (A) The is the area of a settlement unit in ha. | 0.84 ha | 3662.06 ha |
| Compactness (C) The compactness of a settlement unit is calculated: C = 2 √πA⁄P*100(%); C = compactness, A = area, P = perimeter [66]. | 14% | 99% |
| Building Density (BD) BD is the number of buildings in each settlement unit divided by the area A (ha). | 0.82 buildings/ha | 32.36 buildings/ha |
| Open Space Ratio (OSR) OSR describes the amount of space that is not occupied by built structures within a certain area. OSR is calculated by applying the formula: OSR = A–BA; A = area, BA = Built up area. | 45.74% | 99.74% |
| FUNCTION | ||
| Functional Richness (FR) FR describes the presence of different functions in a settlement unit ranging from 1 to 8 available functions here (residential area; retail and services; public facilities; industrial and commercial area; agricultural facilities; supply facilities; disposal facilities; parks, sport and recreation facilities) | 0 | 8 |
| Population Density (PD) PD is the number of inhabitants per hectare. The data source gives the absolute number of inhabitants per 1 ha cell (yz). The sum of the total population per cell within one settlement unit is divided by the area (A). | 0.00 inhabitants/ha | 83.32 inhabitants /ha |
| Retail and Services Ratio (RSR) RSR is the percentage of the area A with retail and services per unit. | 0.00% | 92.85% |
| Agricultural Facilities Ratio (AFR) AFR is the percentage of the area A with agricultural facilities within each unit. | 0.00% | 89.88% |
| SPATIAL LINKAGES | ||
| Settlement Density (SD) The density of settlement units assesses the number of units within a 3 km radius, using the Euclidean distance between centroids. | 1 | 71 |
| Public Transport Connectivity (PTC) PTC is the number of settlement units directly linked to each other by public transport. It can be calculated as PTC = ΣL (L1 + L2 + Ln) where L is the number of unique settlement units reached by each public transit line that goes through a TOPOI. | 0 | 76 |
| Proximity to Regional Train Station (PRTS) The proximity to (operating) regional train stations calculates the shortest distance along the street network between a regional train station and the centroid of each settlement unit in km [37,67,68,69]. | 0.00269 km | 28.11 km |
| TOPOI | Unit Count | Indicators | ||||||||||
|---|---|---|---|---|---|---|---|---|---|---|---|---|
| Form | Function | Linkages | ||||||||||
| Area (ha) | Compactness (%) | Building Density (buildings/ha) | Open Space Ratio (%) | Functional Richness | Population Density (inhabitans/ha) | Retail and Services Ratio (%) | Agricultural Facilities Ratio (%) | Settlement Density | Public Transport Connectivity | Proximity to Regional Train Station (m) | ||
| Node city | 1 | 3662 | 14% | 13.9 | 80% | 8 | 43.5 | 8.9% | 0.3% | 4 | 68 | 2669 |
| Node town | 7 | 1153 | 22% | 15.5 | 81.8% | 8 | 22.5 | 5.8% | 1.6% | 18 | 31 | 1649 |
| Periurban town | 24 | 526 | 29% | 14.4 | 82.8% | 8 | 21.4 | 5.8% | 1.0% | 23 | 23 | 1407 |
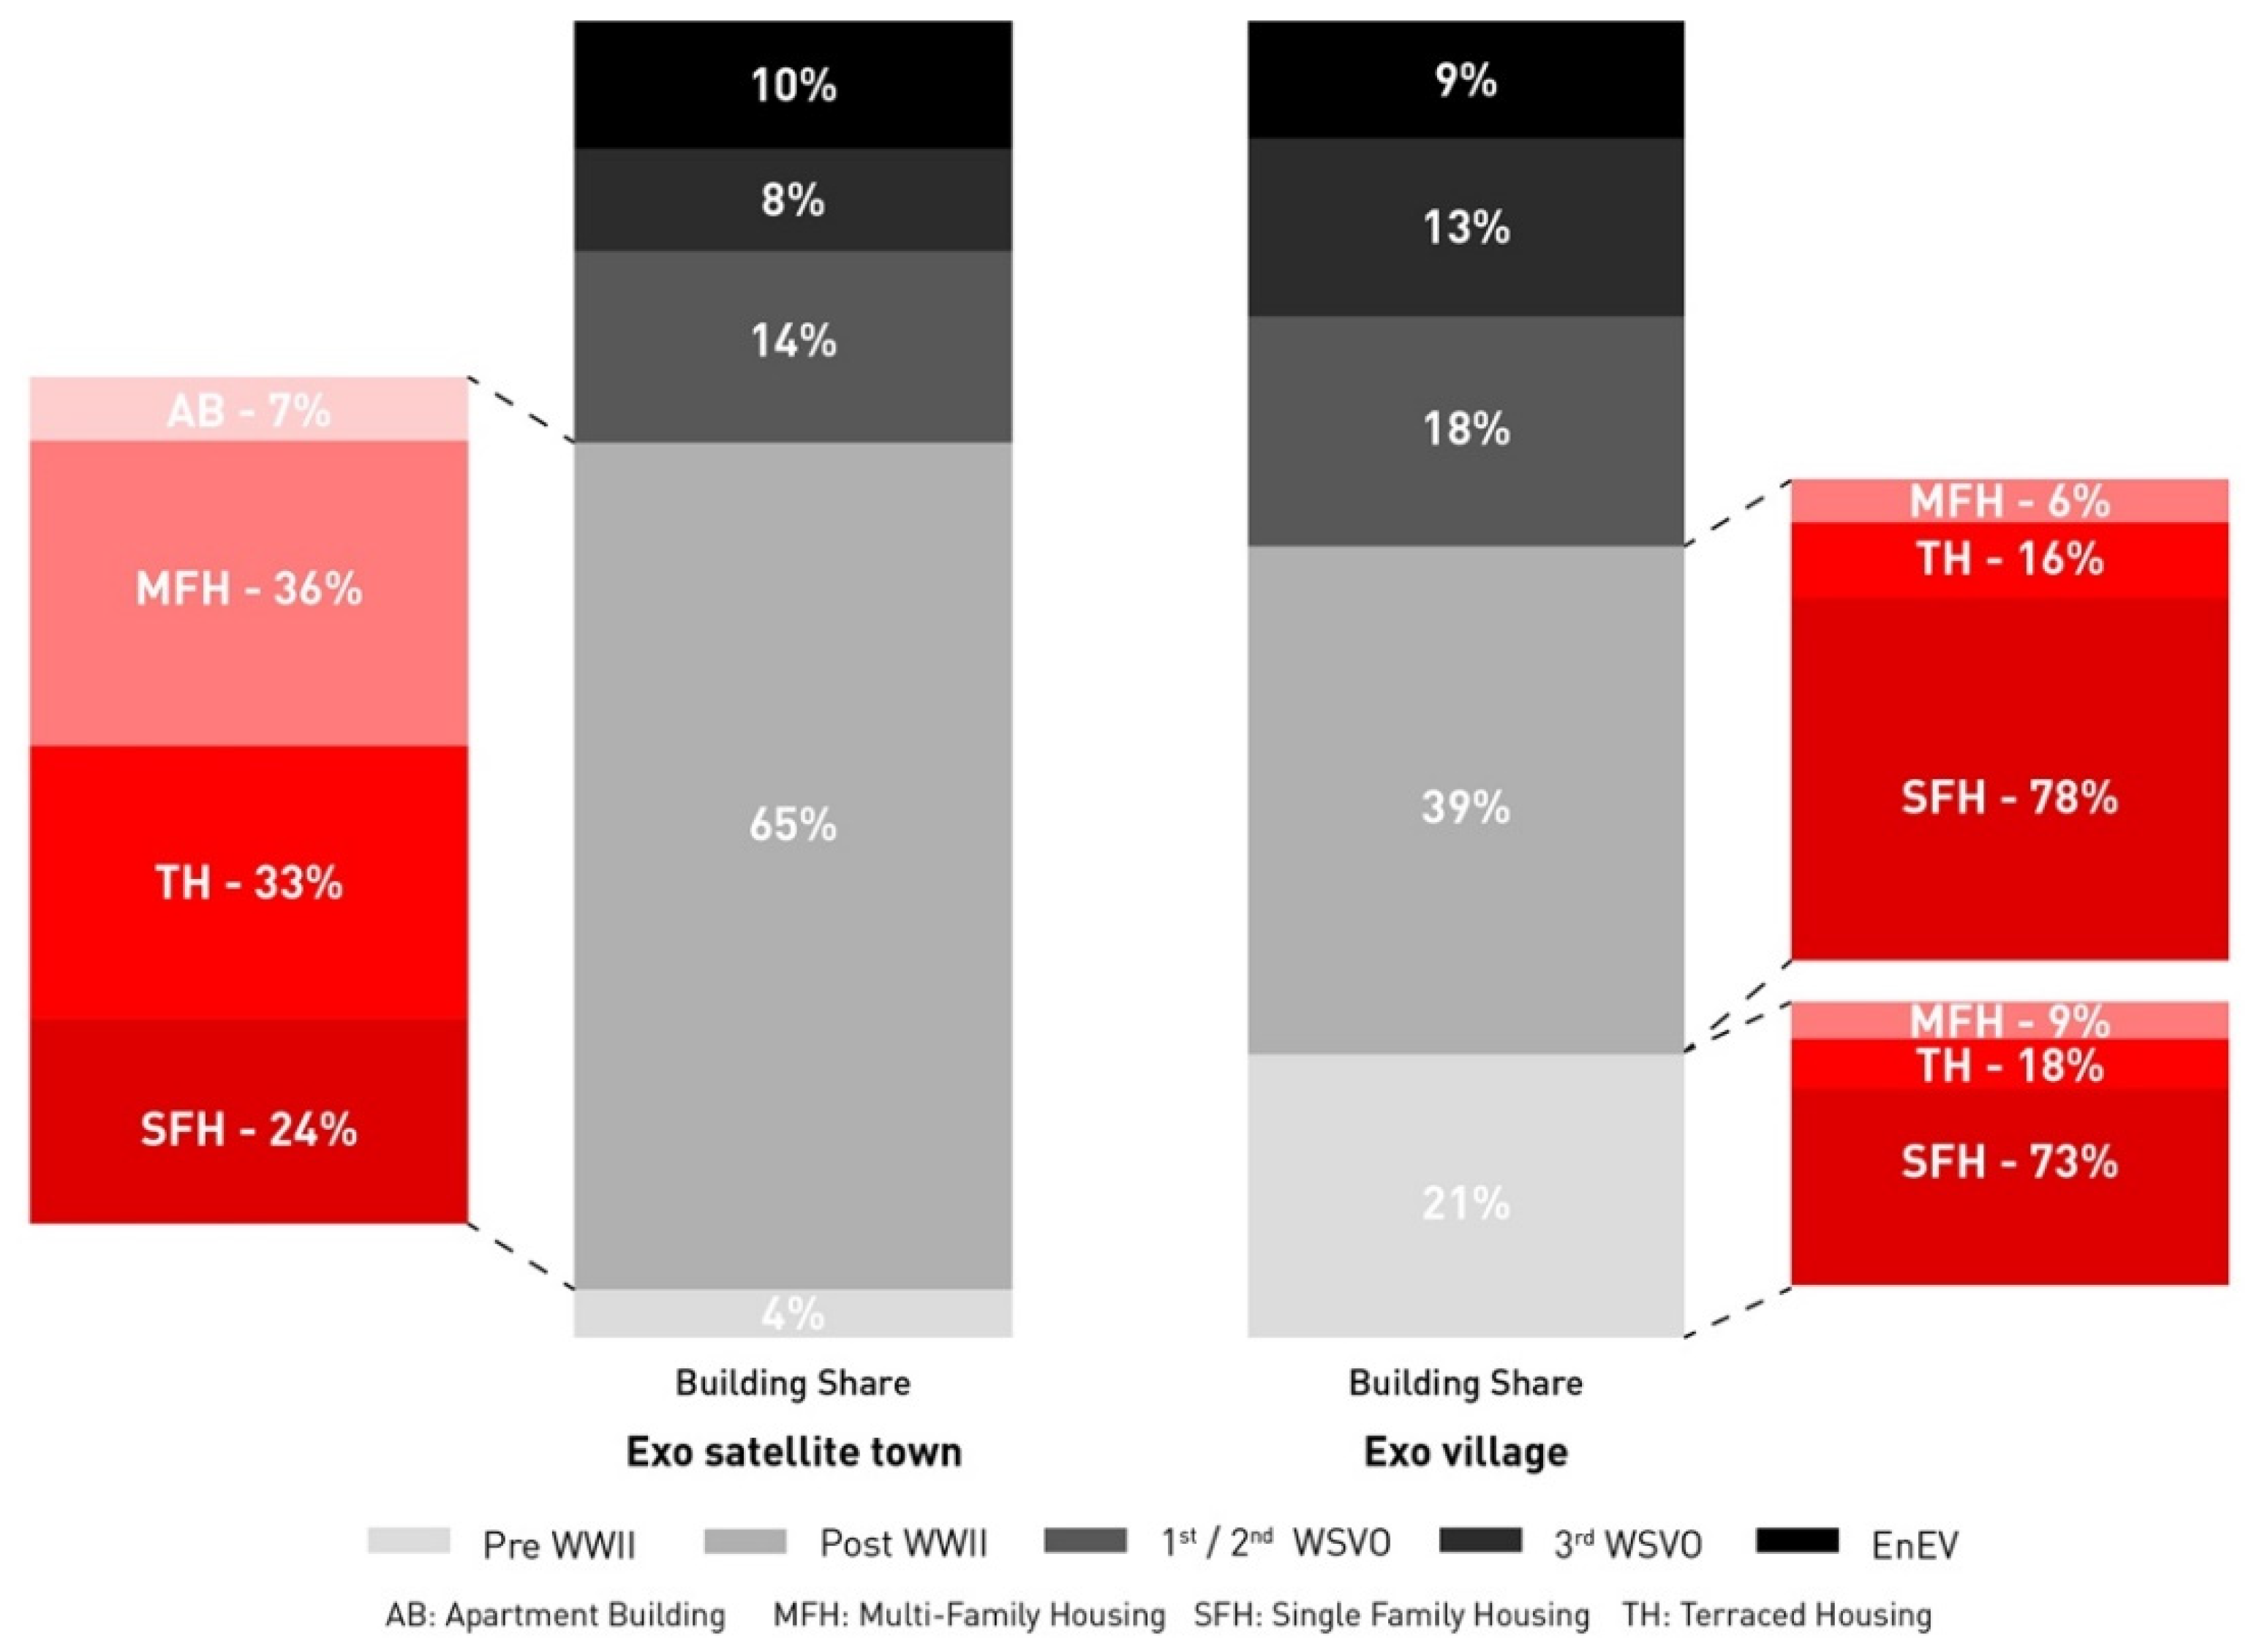
| Exo satellite town | 9 | 81 | 61% | 10.9 | 82.9% | 7 | 48.2 | 2.3% | 0.1% | 13 | 3 | 3920 |
| Periurban village | 42 | 224 | 38% | 15.2 | 84.5% | 8 | 19.7 | 4.8% | 2.3% | 13 | 21 | 1665 |
| Small periurban village | 37 | 53 | 60% | 15.1 | 86.6% | 7 | 17.2 | 1.7% | 5.0% | 13 | 18 | 3654 |
| Exo village | 524 | 42 | 63% | 13.1 | 86.8% | 7 | 14.0 | 1.4% | 7.3% | 10 | 5 | 6559 |
| Small exo village | 73 | 14 | 76% | 11.3 | 88.6% | 4 | 11.0 | 0.0% | 13.4% | 11 | 6 | 6172 |
| Disseminated village | 160 | 27 | 53% | 8 | 90.2% | 6 | 7.2 | 2.1% | 8.6% | 44 | 10 | 8851 |
| Agri village | 35 | 20 | 58% | 7.7 | 89.6% | 5 | 5.2 | 1.4% | 14.2% | 12 | 23 | 8440 |
| Disseminated hamlet | 1071 | 4 | 81% | 4.5 | 91.4% | 3 | 2.3 | 0.0% | 0.0% | 34 | 0 | 7017 |
| Disseminated living agri hamlet | 4283 | 3 | 89% | 4.7 | 92.6% | 2 | 2.3 | 0.0% | 23.9% | 38 | 0 | 8098 |
| Exo industrial zone | 35 | 18 | 69% | 1.9 | 68.6% | 3 | 0.0 | 0.0% | 0.0% | 15 | 0 | 3779 |
| TOPOI Description | Exemplary TOPOI Map |
|---|---|
| Node city (n = 1) In the two study regions, only one node city was identified (Braunschweig). Due to its physical form, comprising large un-built areas, such as parks, this TOPOS is large but the least compact agglomeration. The node city TOPOS has the highest count of public transport connections: no other TOPOI are so well connected to other settlement units, even though its dimension increases the distance to the closest regional train station and decreases the amount of settlement units in its surroundings (3 km radius). The retail ratio is highest in comparison to other TOPOI. In the two study regions, the node city shows a high diversity of functions and large number of buildings, and the population density (43 inhabitants/ha) is the second highest of all TOPOI. | 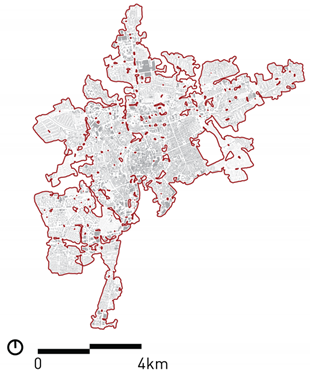 |
| Node town (n = 7) Node towns are the second least compact TOPOI. They feature a high diversity of functions. Their public transport connectivity and population density are around half of that of a node city. The settlement density in a 3 km radius is much higher than in node cities. The distance to a regional train station, measured from the centroid, is less than 2 km, which means that these settlement units are strategically well located with respect to public transport. In comparison to a node city, these settlement units have a lower retail ratio. |  |
| Periurban town (n = 24) Periurban towns are well connected to node cities and node towns. Since they are relatively small, they feature relatively short distances to regional train stations, which are comfortably reachable on foot or by bike from within the given settlement unit. Periurban towns are comparatively smaller than node towns but have not significantly different characteristics with respect to functional richness and retail ratio. They are slightly smaller in other indicators, such as population density, building density and slightly bigger in terms of open space ratio. Additionally, in comparison to node towns, periurban towns have fewer connections to other settlement units via public transport. | 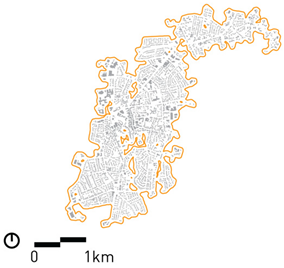 |
| Exo satellite towns (n = 9) Exo satellite towns have the highest population density (median of 48 inhabitants/ha) They have a very low connectivity by public transport and their distance to a regional train station is with more than 4 km relatively high. Due to their proximity and transport connectivity to periurban towns, they can be considered as their suburban developments, predominantly characterized by housing. However, exo satellite towns still have a high functional diversity. | 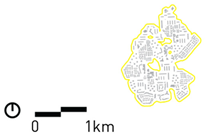 |
| Periurban village (n = 42) The periurban villages have a relatively high ratio of retail and a high functional richness. The accessibility to a regional train station is—in comparison to the (larger) size of other settlement units—a very high (median 1.7 km). This means, from within a periurban village, regional train stations are comfortably reachable on foot and by bike. In general, the connectivity by public transport is almost as high as that of periurban towns. Amongst all other village types, the periurban villages are the least compact. | 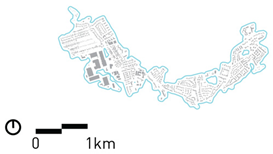 |
| Small periurban village (n = 37) Small periurban villages have on average a medium number of connections by public transport and also diversified functions. These settlement units have the highest average building density. The presence of retail and agricultural buildings in particular in small percentages contributes to their village status. | 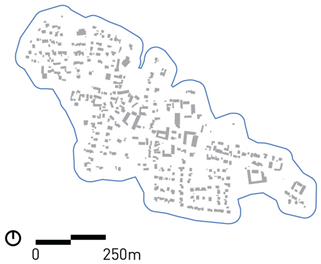 |
| Exo village (n = 524) An exo village is generally located more than 6 km from a regional train station. They have a high number of functions, including a small percentage of agricultural buildings, while the retail ratio is very low. The settlement units around exo villages are few and the connectivity to other settlement units is low. Exo villages are mostly found in the larger Braunschweig region. In the region Vechta-Diepholz-Verden, they appear close to periurban towns. | 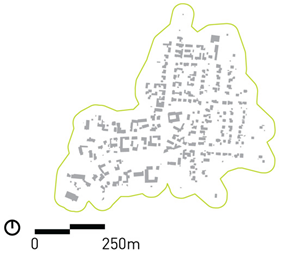 |
| Small exo village (count 73) Small exo villages are very isolated with a large distance to a station and limited access to public transport. They are in average 14 ha big, have no retail function, and a generally low functional richness. The share of agricultural buildings is comparatively high with 13% on average. | 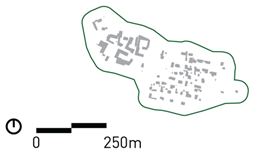 |
| Disseminated village (n = 160) Most of the disseminated villages are part of a dense fine-meshed network (median: 44 units within 3 km) of villages and characterized by a large remoteness. The connectivity is low and the distance to the railway station is the highest compared to all other TOPOI with almost 9 km. The comparatively high proportion of farm buildings of almost 9% of the surface area indicates its agricultural character. | 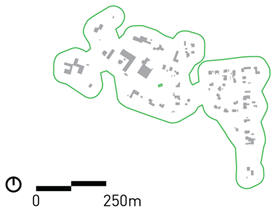 |
| Agri village (n = 35) Agri villages are characterized by a comparatively high proportion (14.2% of the total area) of agricultural facilities. They are located rather far from other settlement units and railway stations but have good connections to the bus-based public transport network. | 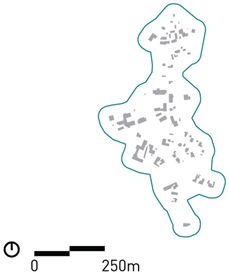 |
| Disseminated hamlet (n = 1071) This TOPOS consists of a large group of units. Access is only possible via individual mobility. They have a low number of functions and no retail. However, disseminated hamlets have a big number of other settlements around. | 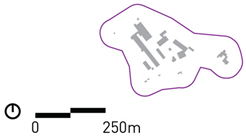 |
| Disseminated living agri hamlet (n = 4283) Disseminated living agri hamlets form the biggest TOPOI group and are mostly found in the region of Vechta-Diepholz-Verden. They feature mainly two functions: agriculture and living, and they are finely dispersed within a dense network of hamlets (median: 38 units within 3 km). There are no public transport options available. | 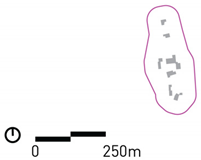 |
| Building Age Class | ||||||||||||
|---|---|---|---|---|---|---|---|---|---|---|---|---|
| 1860–1918 | 1919–1948 | 1949–1957 | 1958–1968 | 1969–1978 | 1979–1983 | 1984–1994 | 1995–2001 | 2002–2009 | 2010–2011 | |||
| TOPOI | Count | Land-Uptake Residential Buildings 1 (ha) | ||||||||||
| Node City | 1 | TOTAL | 236.8 | 448.5 | 212.9 | 236.5 | 205.1 | 59.1 | 79.9 | 54.7 | 90.8 | 5.4 |
| Node Town | 7 | TOTAL | 241.0 | 272.4 | 408.6 | 955.8 | 774.4 | 317.3 | 497.3 | 420.4 | 266.3 | 37.2 |
| 1st Quartile | 15.3 | 25.9 | 39.2 | 83.7 | 87.2 | 40.1 | 51.0 | 45.9 | 37.5 | 2.4 | ||
| Median | 33.8 | 37.2 | 45.7 | 120.6 | 109.2 | 43.8 | 68.9 | 63.3 | 42.9 | 4.3 | ||
| 3rd Quartile | 43.1 | 46.8 | 86.2 | 173.4 | 139.0 | 52.3 | 76.6 | 76.0 | 45.1 | 8.7 | ||
| Periurban Town | 24 | TOTAL | 495.4 | 795.6 | 665.9 | 1.178.2 | 1.013.9 | 371.5 | 627.9 | 580.3 | 332.1 | 29.2 |
| 1st Quartile | 5.5 | 12.9 | 15.2 | 33.8 | 29.2 | 11.1 | 20.4 | 48.3 | 8.5 | 0.3 | ||
| Median | 13.3 | 25.3 | 22.5 | 47.1 | 39.2 | 15.7 | 24.6 | 23.3 | 13.5 | 0.8 | ||
| 3rd Quartile | 25.0 | 45.7 | 34.2 | 62.5 | 55.6 | 18.7 | 33.7 | 34.1 | 18.3 | 2.0 | ||
| Periurban Village | 42 | TOTAL | 362.6 | 355.5 | 468.9 | 818.3 | 770.5 | 376.0 | 658.7 | 660.1 | 425.8 | 38.8 |
| 1st Quartile | 4.4 | 4.1 | 5.5 | 12.3 | 12.9 | 5.4 | 9.9 | 1.1 | 5.6 | 0.1 | ||
| Median | 1.0 | 7.5 | 9.0 | 15.8 | 16.5 | 8.5 | 13.3 | 15.5 | 9.1 | 0.5 | ||
| 3rd Quartile | 10.2 | 11.4 | 12.7 | 25.1 | 23.5 | 11.4 | 20.5 | 19.6 | 12.5 | 1.1 | ||
| Exo Satellite Town | 9 | TOTAL | 8.0 | 8.0 | 14.4 | 132.7 | 69.7 | 16.8 | 31.7 | 21.8 | 9.2 | 1.9 |
| 1st Quartile | 0.1 | 0.0 | 0.5 | 0.5 | 0.6 | 0.2 | 0.2 | 0.0 | 0.0 | 0.0 | ||
| Median | 0.2 | 0.0 | 1.3 | 3.8 | 4.2 | 0.4 | 0.8 | 0.7 | 0.2 | 0.0 | ||
| 3rd Quartile | 0.3 | 0.4 | 2.5 | 23.8 | 16.1 | 1.3 | 2.9 | 1.2 | 0.7 | 0.1 | ||
| Small Periurban Village | 37 | TOTAL | 104.6 | 85.5 | 80.0 | 152.6 | 164.1 | 61.3 | 151.4 | 180.1 | 88.5 | 5.1 |
| 1st Quartile | 0.1 | 0.8 | 0.9 | 1.7 | 1.5 | 0.6 | 1.6 | 2.0 | 0.7 | 0.0 | ||
| Median | 2.3 | 1.5 | 1.6 | 3.2 | 3.8 | 1.4 | 3.2 | 4.2 | 1.8 | 0.0 | ||
| 3rd Quartile | 3.4 | 2.5 | 3.4 | 6.5 | 5.0 | 2.2 | 5.4 | 7.3 | 4.0 | 0.3 | ||
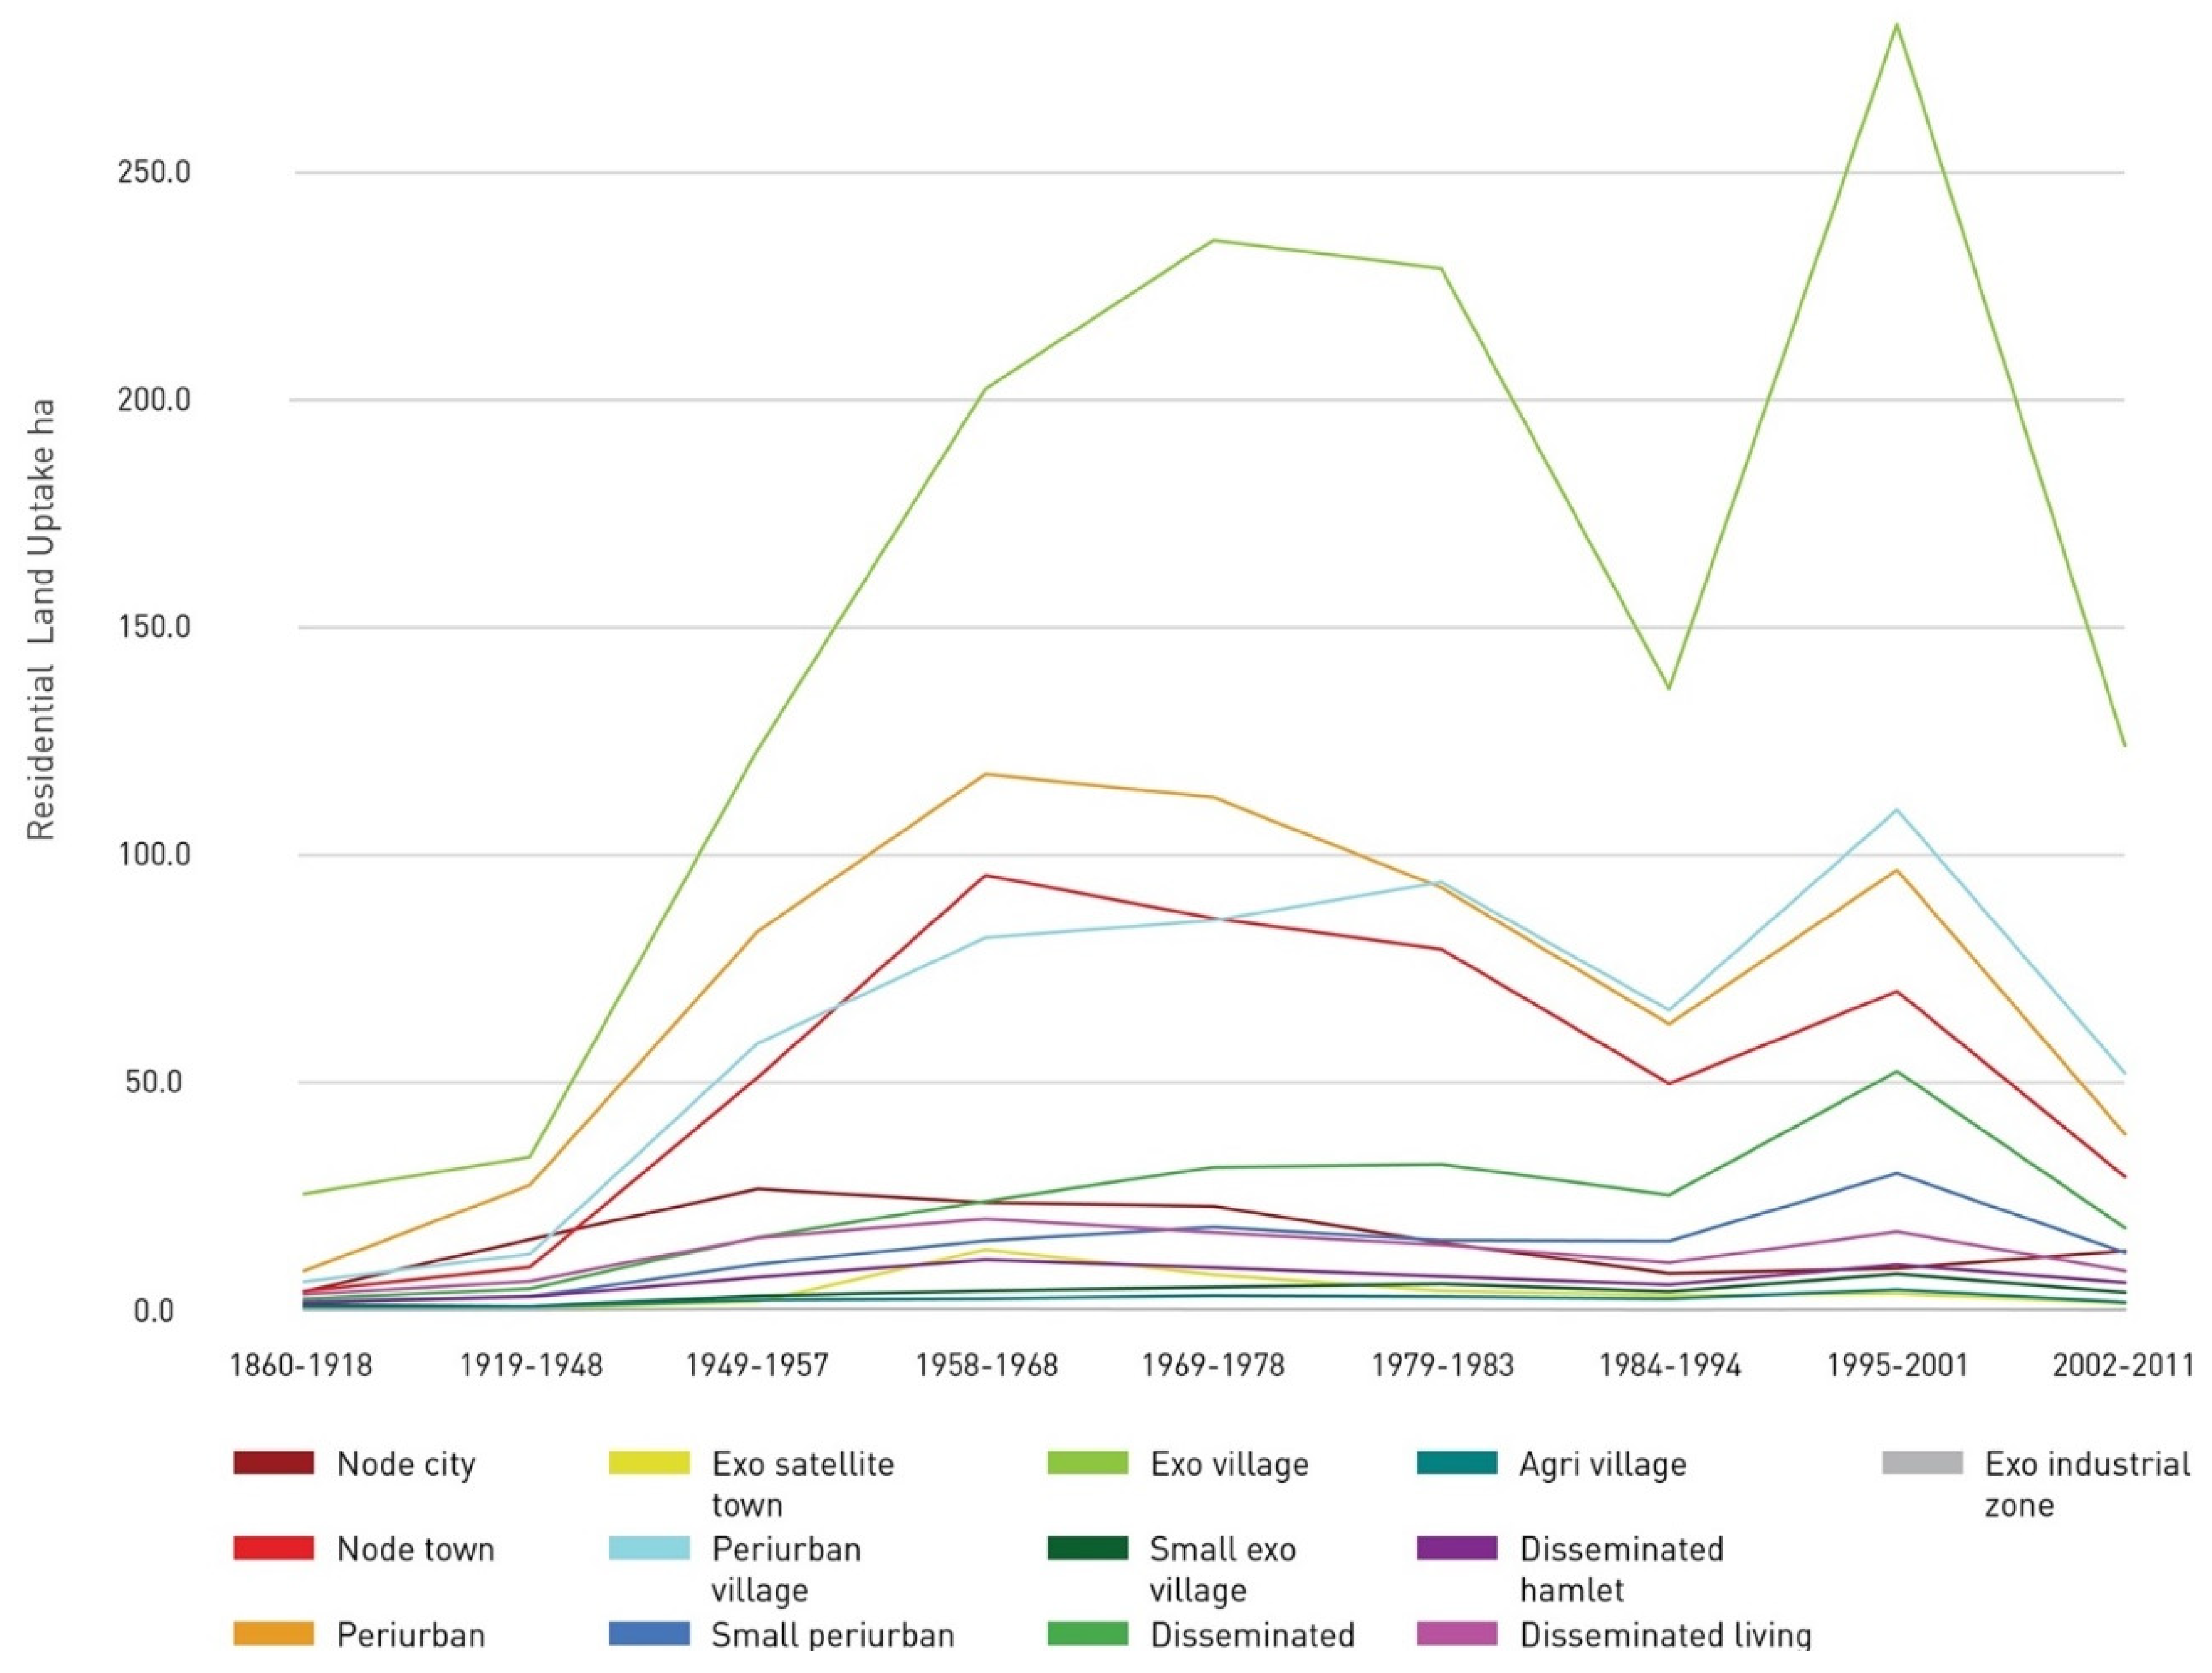
| Exo Village | 524 | TOTAL | 1479.7 | 974.2 | 984.8 | 2024.7 | 2117.0 | 915.5 | 1366.1 | 1695.8 | 1049.0 | 60.4 |
| 1st Quartile | 0.8 | 0.5 | 0.5 | 1.1 | 1.0 | 0.4 | 0.5 | 0.7 | 0.3 | 0.0 | ||
| Median | 2.1 | 1.0 | 1.1 | 2.5 | 2.4 | 1.0 | 1.5 | 1.8 | 1.0 | 0.0 | ||
| 3rd Quartile | 3.8 | 2.0 | 2.4 | 5.0 | 5.0 | 2.2 | 0.3 | 4.4 | 2.4 | 0.0 | ||
| Small Exo Village | 73 | TOTAL | 60.3 | 20.5 | 24.5 | 42.7 | 45.6 | 23.1 | 40.7 | 47.4 | 27.4 | 1.6 |
| 1st Quartile | 0.3 | 0.0 | 0.0 | 0.2 | 0.1 | 0.0 | 0.2 | 0.2 | 0.0 | 0.0 | ||
| Median | 0.6 | 0.3 | 0.3 | 0.4 | 0.4 | 0.2 | 0.4 | 0.4 | 0.3 | 0.0 | ||
| 3rd Quartile | 1.2 | 0.4 | 0.5 | 0.9 | 0.7 | 0.4 | 0.7 | 0.7 | 0.4 | 0.0 | ||
| Disseminated Village | 160 | TOTAL | 142.9 | 134.8 | 127.4 | 239.1 | 281.9 | 127.9 | 252.2 | 314.6 | 187.3 | 13.6 |
| 1st Quartile | 0.3 | 0.3 | 0.1 | 0.3 | 0.2 | 0.0 | 0.1 | 0.2 | 0.0 | 0.0 | ||
| Median | 0.5 | 0.5 | 0.4 | 0.7 | 0.8 | 0.3 | 0.6 | 0.7 | 0.5 | 0.0 | ||
| 3rd Quartile | 1.2 | 1.1 | 0.9 | 2.1 | 2.0 | 0.9 | 1.8 | 2.4 | 1.5 | 0.0 | ||
| Agri Village | 35 | TOTAL | 31.4 | 20.4 | 16.9 | 24.4 | 28.2 | 11.6 | 24.1 | 27.0 | 11.4 | 0.8 |
| 1st Quartile | 0.3 | 0.1 | 0.0 | 0.2 | 0.2 | 0.0 | 0.1 | 0.0 | 0.0 | 0.0 | ||
| Median | 0.6 | 0.5 | 0.3 | 0.3 | 0.3 | 0.2 | 0.3 | 0.3 | 0.0 | 0.0 | ||
| 3rd Quartile | 1.2 | 0.9 | 0.5 | 0.8 | 0.7 | 0.5 | 0.7 | 0.7 | 0.3 | 0.0 | ||
| Disseminated Hamlet | 1.071 | TOTAL | 87.5 | 83.9 | 57.4 | 109.8 | 83.7 | 29.7 | 55.9 | 59.5 | 42.4 | 1.8 |
| 1st Quartile | 0.0 | 0.0 | 0.0 | 0.0 | 0.0 | 0.0 | 0.0 | 0.0 | 0.0 | 0.0 | ||
| Median | 0.0 | 0.0 | 0.0 | 0.0 | 0.0 | 0.0 | 0.0 | 0.0 | 0.0 | 0.0 | ||
| 3rd Quartile | 0.2 | 0.2 | 0.1 | 0.2 | 0.1 | 0.0 | 0.1 | 0.1 | 0.0 | 0.0 | ||
| Disseminated Living Agri Hamlet | 4.283 | TOTAL | 198.5 | 182.8 | 126.6 | 200.4 | 153.0 | 57.4 | 104.0 | 103.0 | 59.8 | 2.4 |
| 1st Quartile | 0.0 | 0.0 | 0.0 | 0.0 | 0.0 | 0.0 | 0.0 | 0.0 | 0.0 | 0.0 | ||
| Median | 0.0 | 0.0 | 0.0 | 0.0 | 0.0 | 0.0 | 0.0 | 0.0 | 0.0 | 0.0 | ||
| 3rd Quartile | 0.1 | 0.1 | 0.1 | 0.1 | 0.1 | 0.0 | 0.0 | 0.0 | 0.0 | 0.0 | ||
| Exo Industrial Zone | 35 | TOTAL | 0.9 | 0.9 | 1.2 | 1.5 | 0.8 | 0.3 | 0.0 | 0.6 | 0.1 | 0.0 |
| 1st Quartile | 0.0 | 0.0 | 0.0 | 0.0 | 0.0 | 0.0 | 0.0 | 0.0 | 0.0 | 0.0 | ||
| Median | 0.0 | 0.0 | 0.0 | 0.0 | 0.0 | 0.0 | 0.0 | 0.0 | 0.0 | 0.0 | ||
| 3rd Quartile | 0.0 | 0.1 | 0.1 | 0.1 | 0.1 | 0.0 | 0.1 | 0.1 | 0.0 | 0.0 | ||
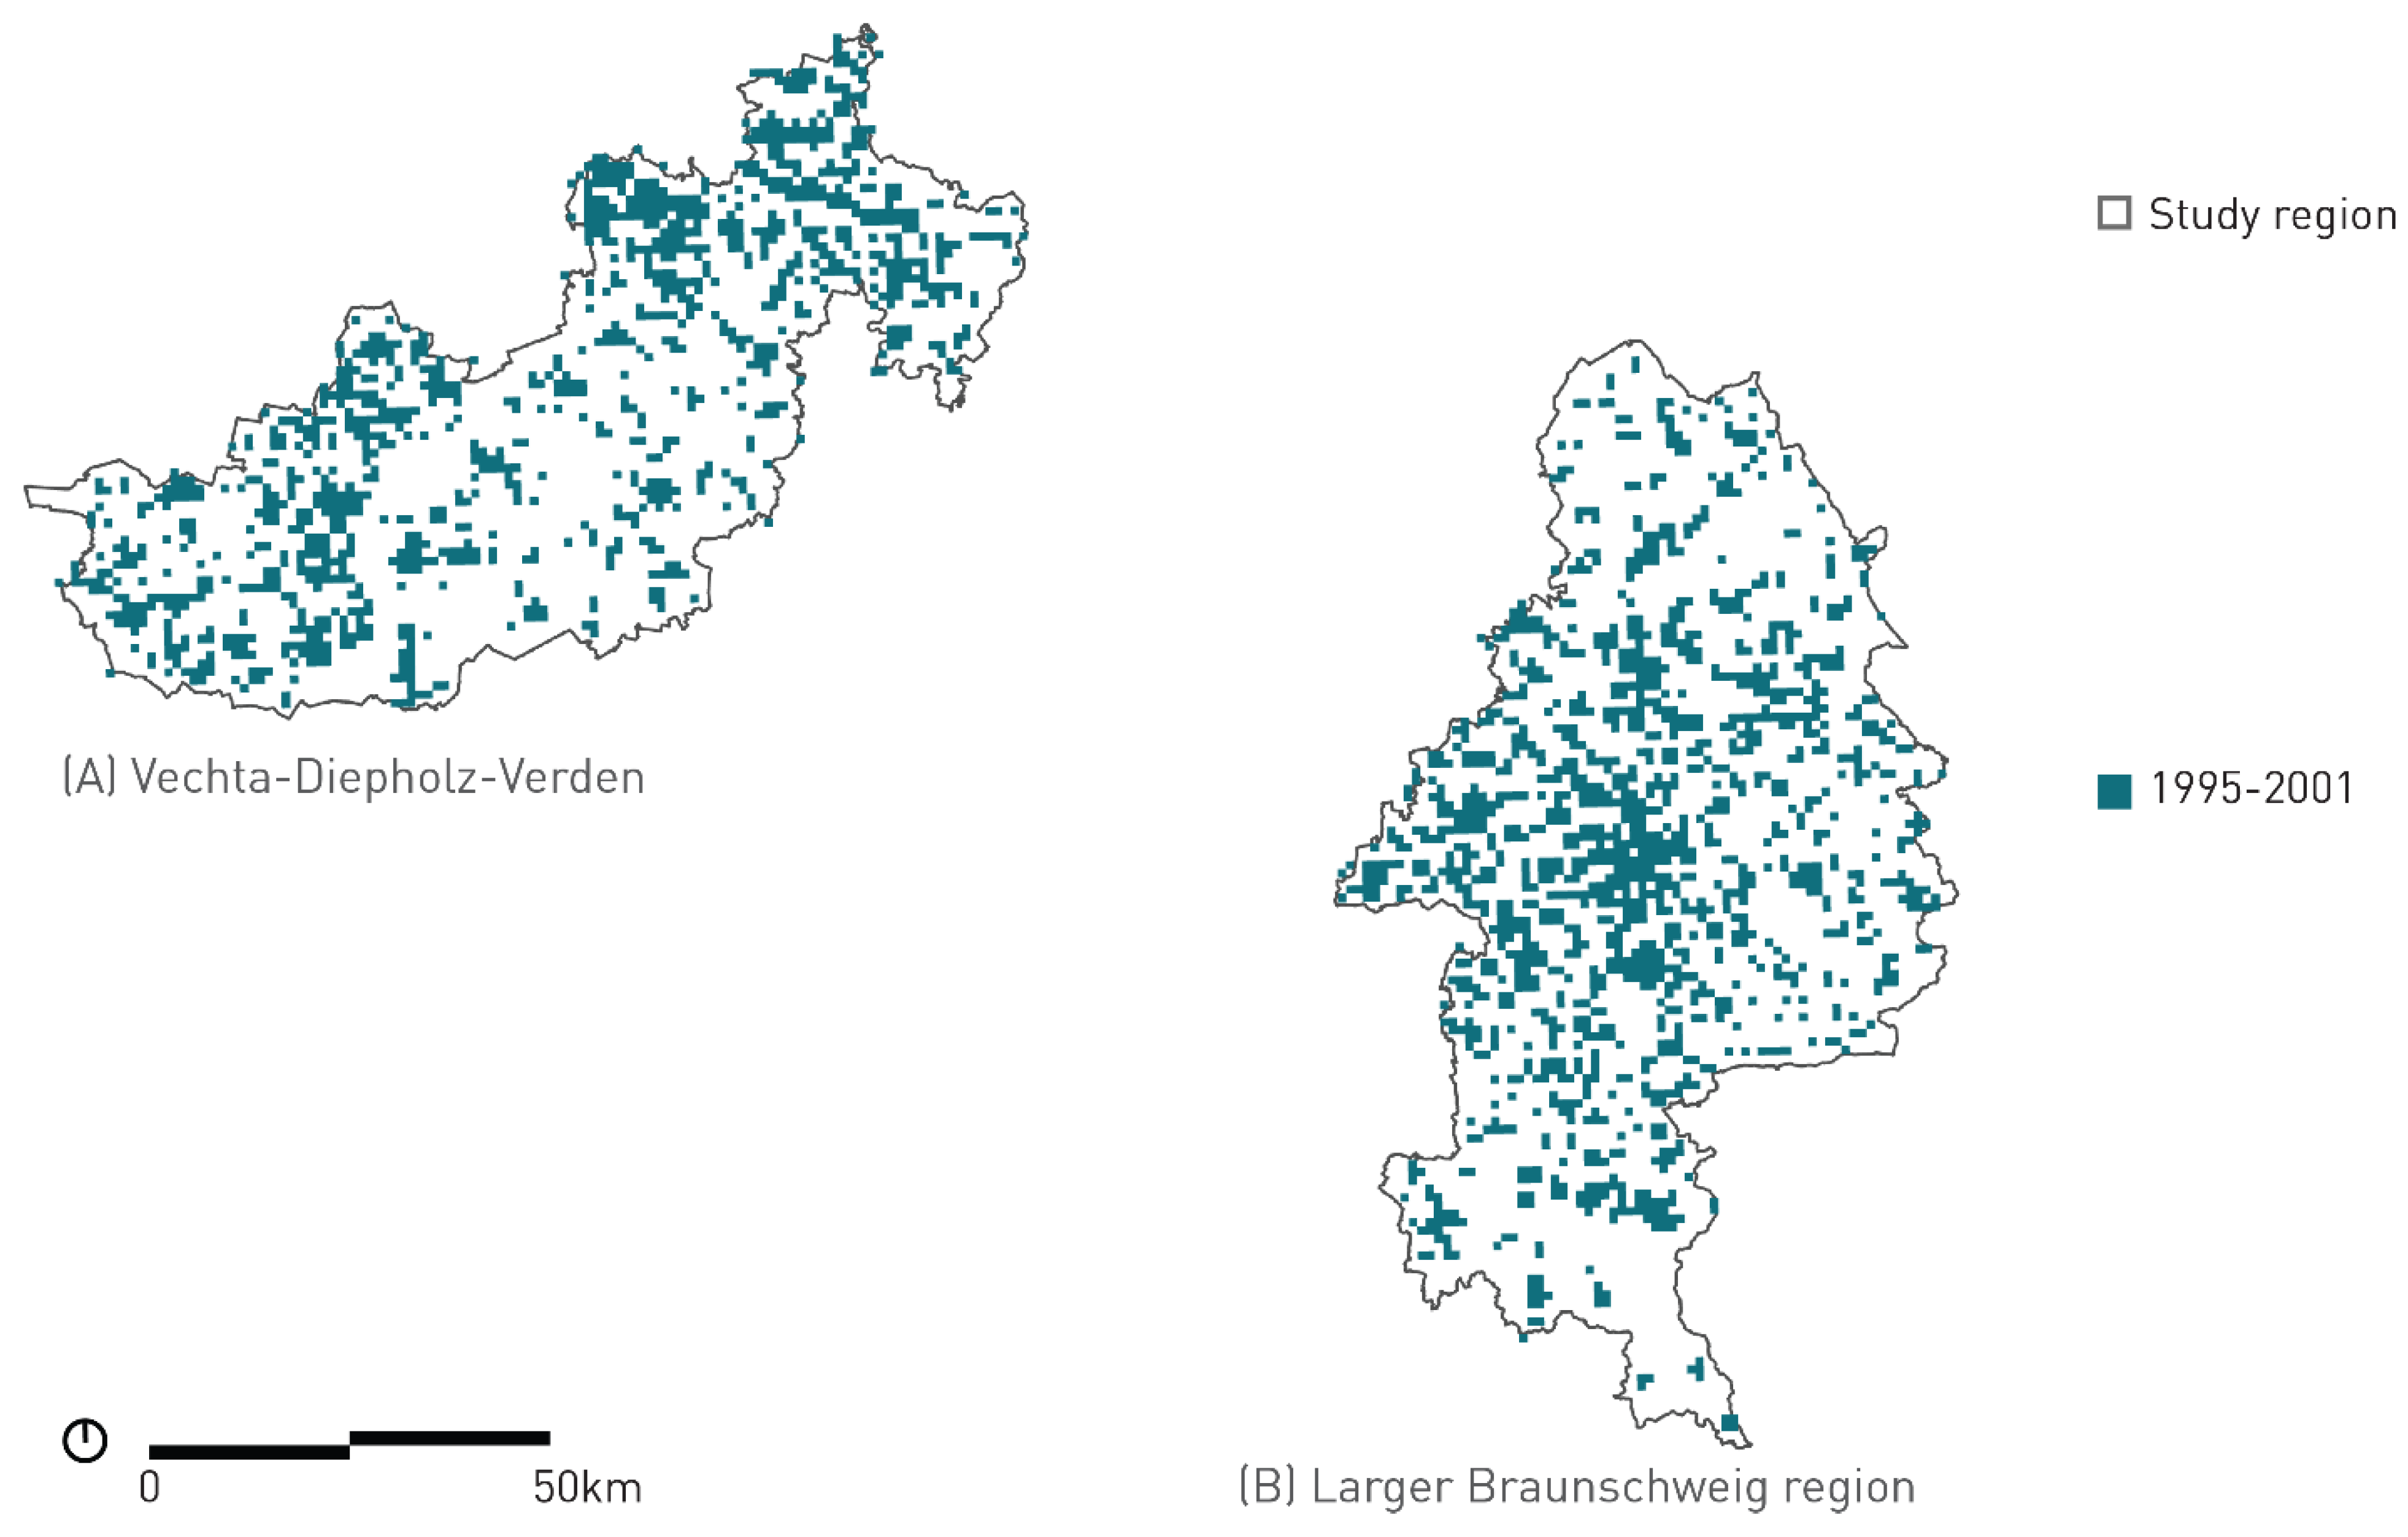
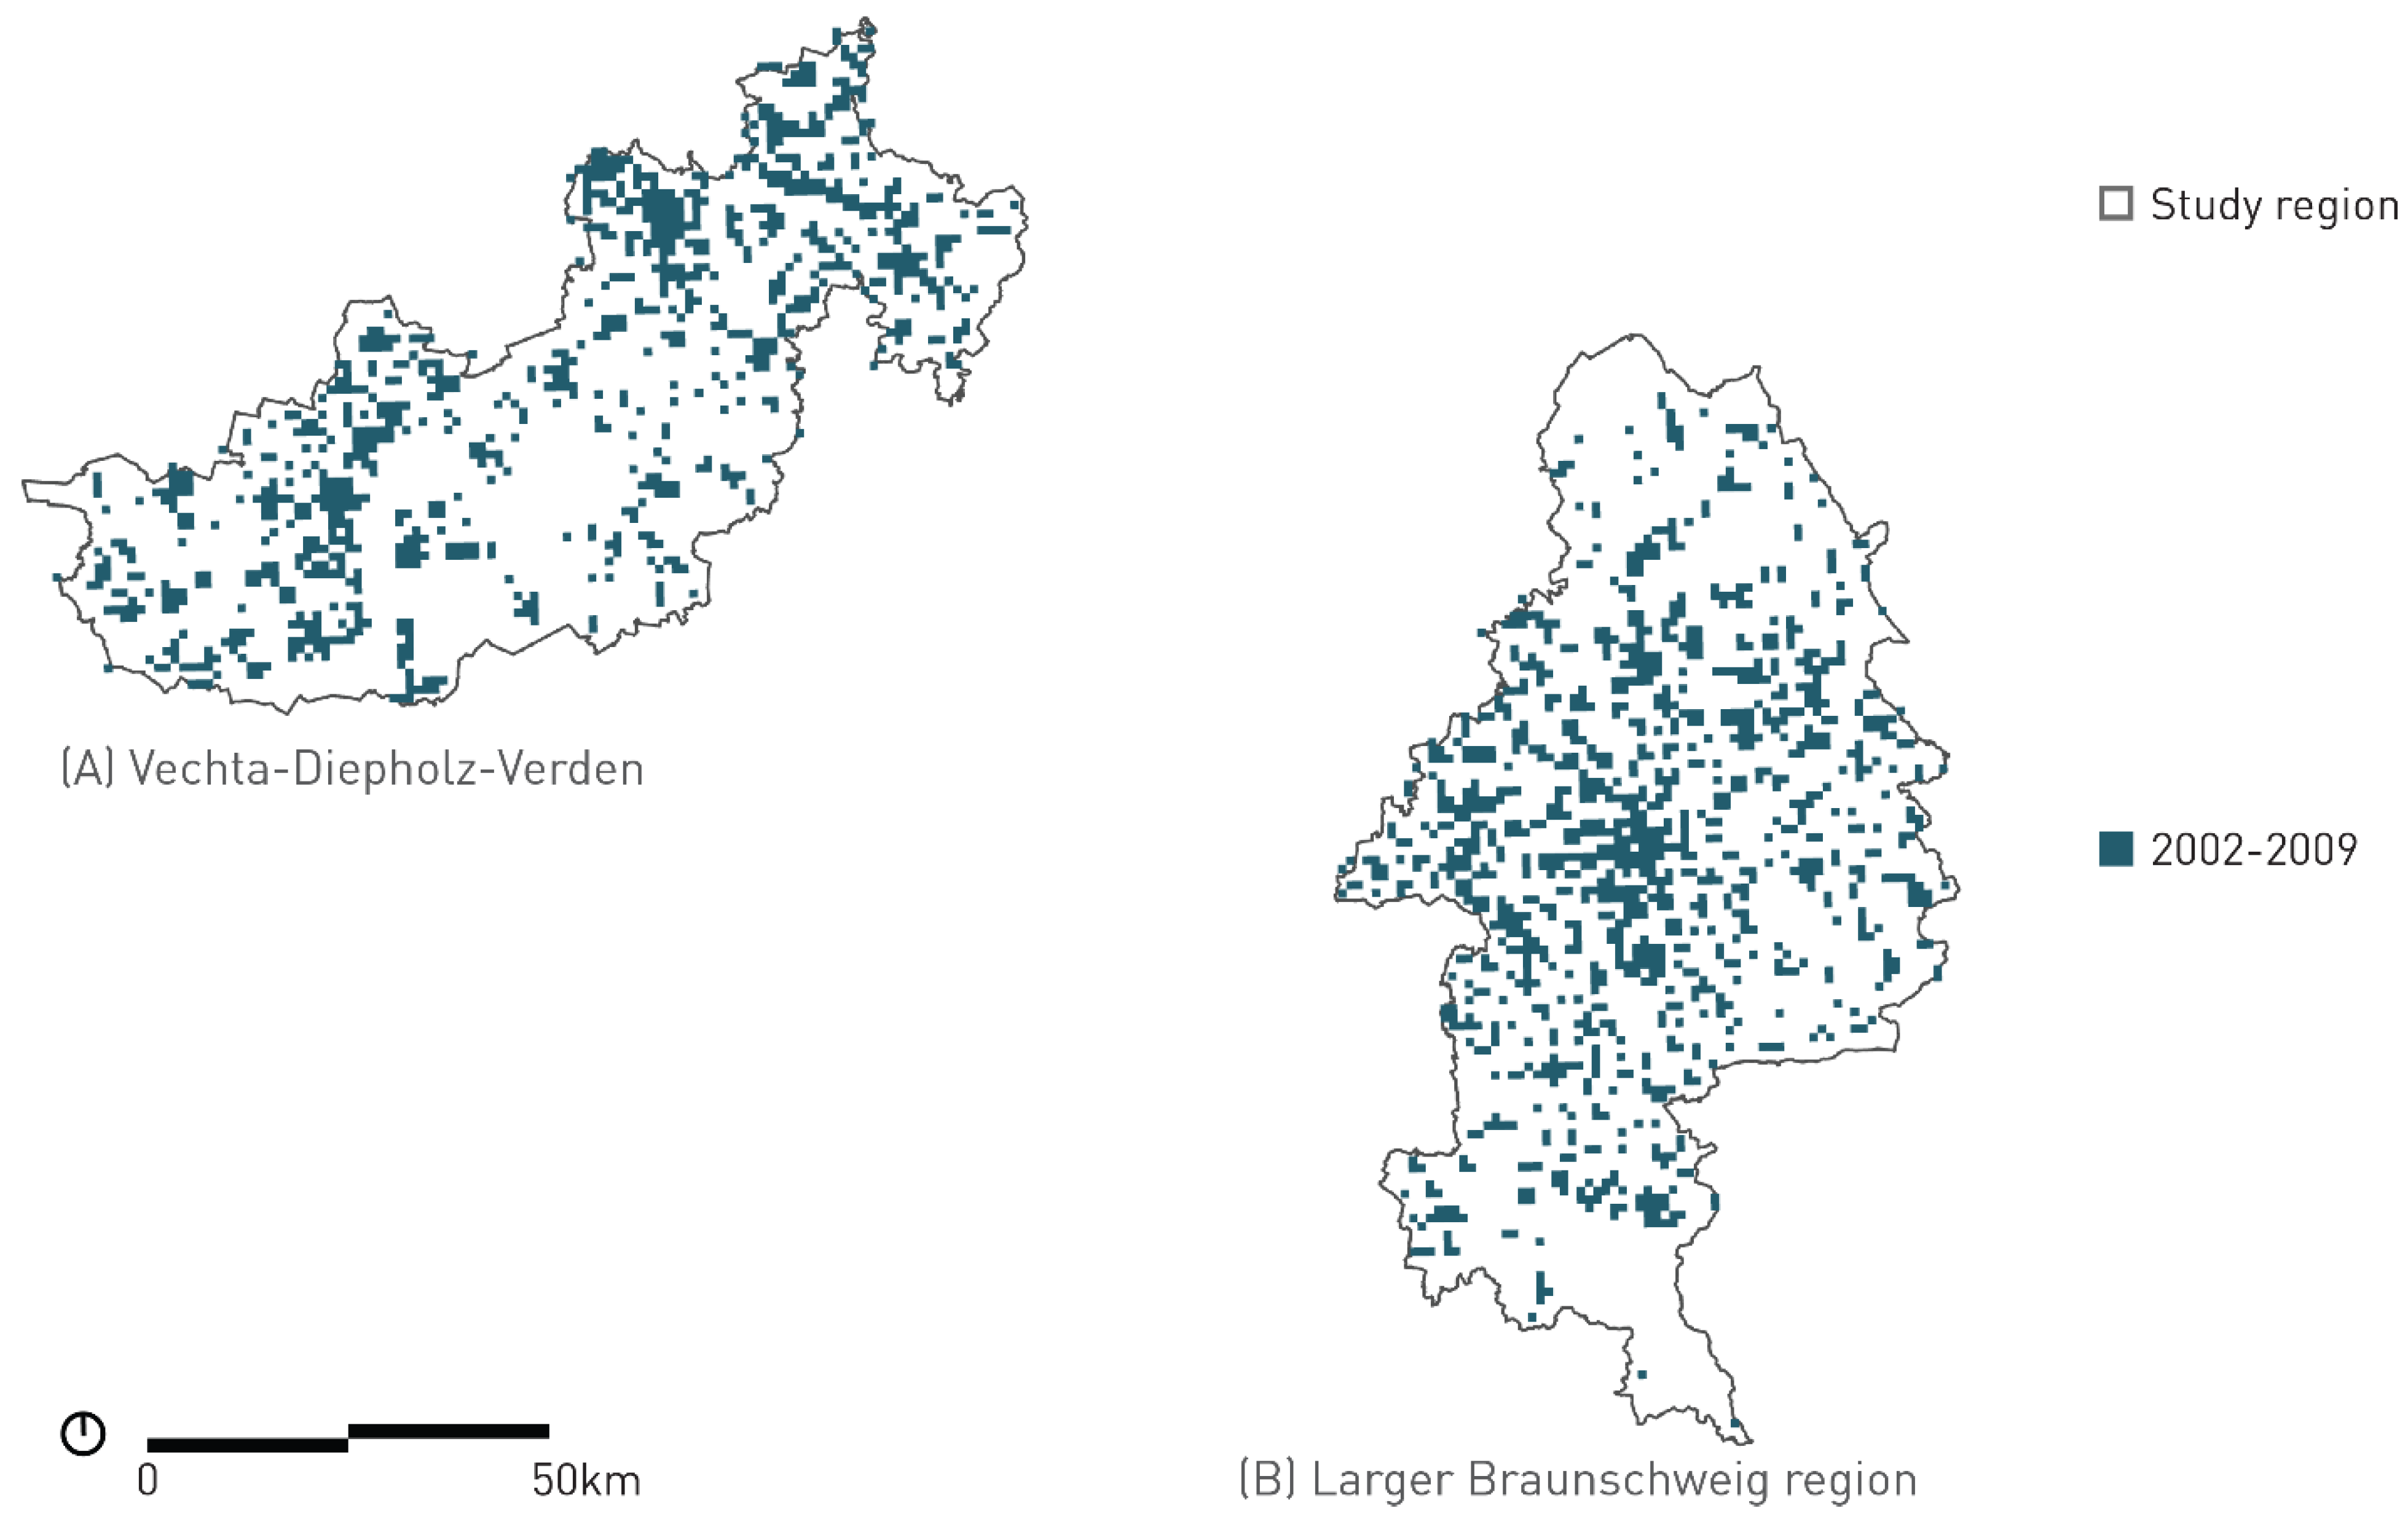
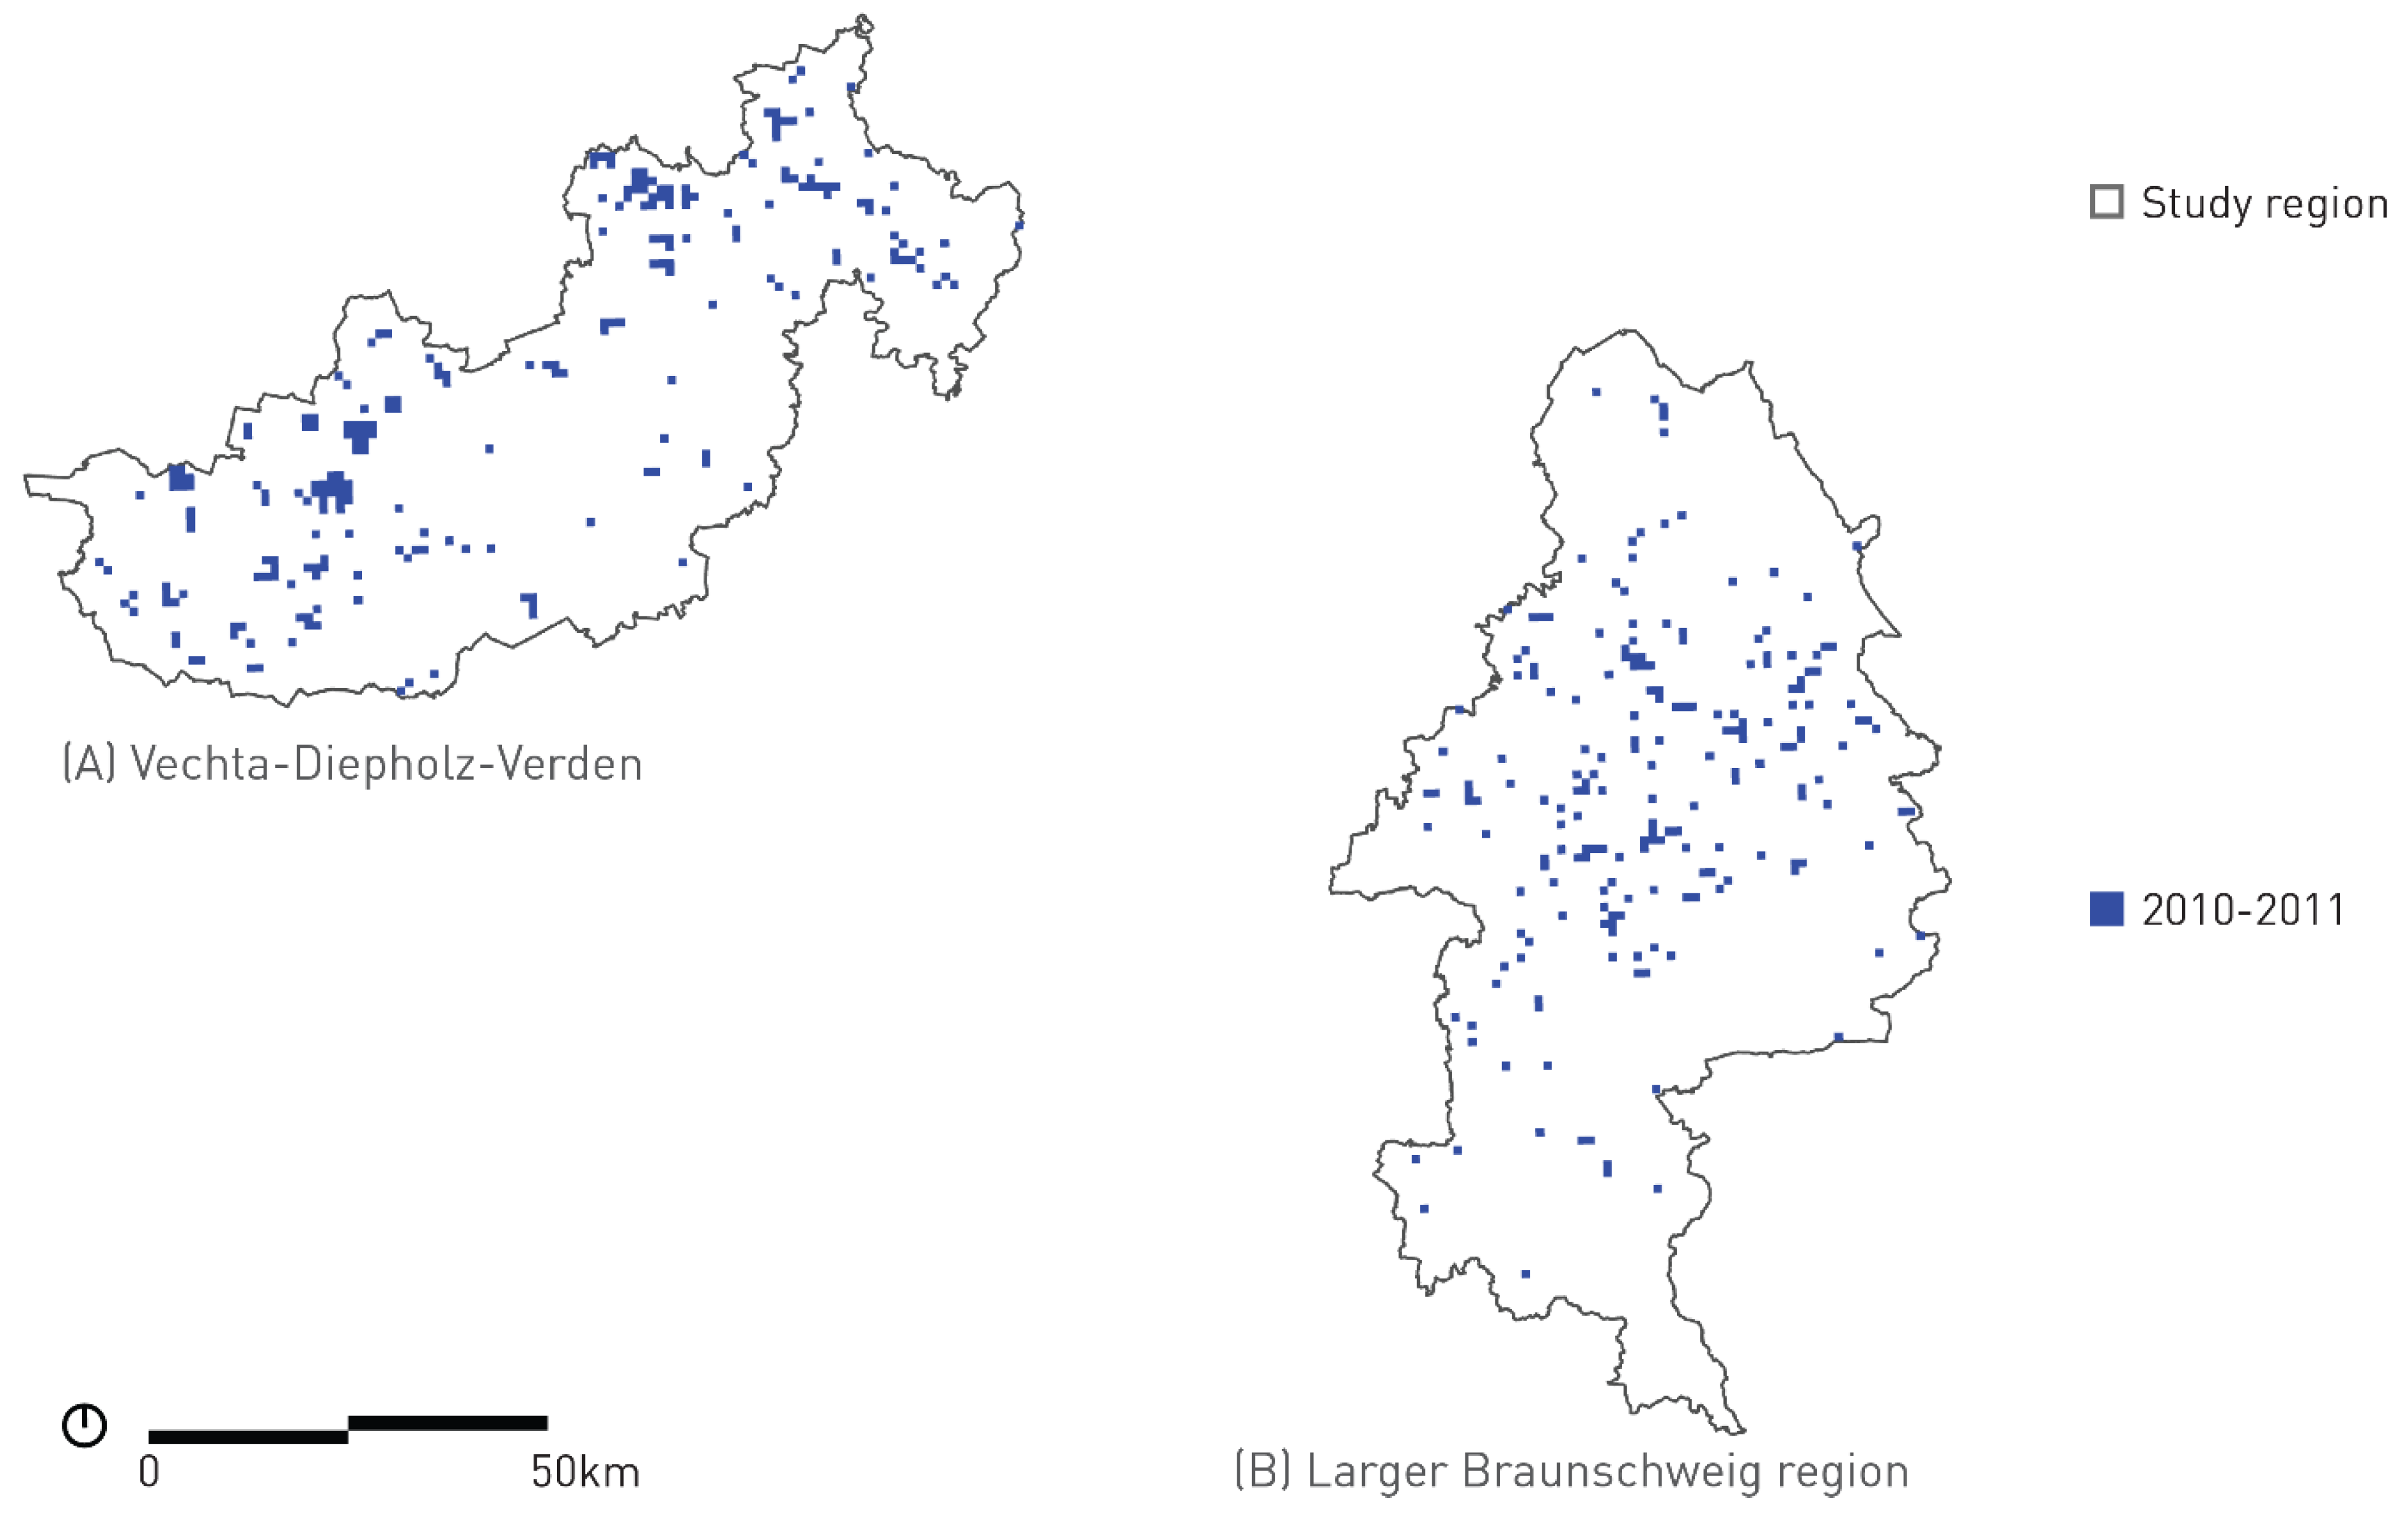
References
- Baccini, P.; Oswald, F. Netzstadt—Transdisziplinäre Methoden zum Umbau urbaner Systeme; vdf Hochschulverlag an der ETH Zürich: Zürich, Switzerland, 1998. [Google Scholar]
- Carlow, V.M.; Mumm, O.; Neumann, D.; Schneider, A.-K.; Schröder, B.; Sedrez, M.; Zeringue, R. TOPOI—A method for analysing settlement structures and their linkages in an urban rural fabric. Environ. Plan. B Urban Anal. City Sci. 2021. under review. [Google Scholar]
- Carlow, V.M.; Institute for Sustainable Urbanism ISU (Eds.) Ruralism—The Future of Villages and Small Towns in an Urbanizing World; Jovis: Berlin, Germany, 2016. [Google Scholar]
- Diener, R.; Herzog, J.; Meili, M.; Meuron, P.D.; Schmid, C. Die Schweiz, ein Städtebauliches Portrait; Birkhäuser: Basel, Switzerland, 2005. [Google Scholar] [CrossRef]
- Koolhaas, R. Koolhaas in the country. Icon 2014. Available online: www.iconeye.com/architecture/features/rem-koolhaas-in-the-country (accessed on 15 January 2021).
- Sieverts, T. Zwischenstadt: Zwischen Ort und Welt, Raum und Zeit, Stadt und Land; Vieweg: Braunschweig, Germany, 1997; p. 173. [Google Scholar]
- McGrath, B.; Pickett, S.T.A. The Metacity: A Conceptual Framework for Integrating Ecology and Urban Design. Challenges 2011, 2, 55–72. [Google Scholar] [CrossRef]
- Ascher, F. Metapolis: Ou L’avenir des Villes; Odile Jacob: Paris, France, 1995. [Google Scholar]
- Healey, P. Urban-Rural Relationships, Spatial Strategies and Territorial Development. Built Environ. 2002, 28, 331–339. [Google Scholar]
- MSGG, Niedersächsisches Ministerium für Soziales Gesundheit und Gleichstellung. Handlungsorientierte Sozialberichterstattung Niedersachsen—Statistikteil; Niedersächsisches Ministerium für Soziales Gesundheit und Gleichstellung: Hanover, Germany, 2013; Available online: www.sozialberichterstattung-niedersachsen.de (accessed on 6 April 2021).
- Akkoyunlu, S. The Potential of Rural–Urban Linkages for Sustainable Development and Trade. Int. J. Sustain. Dev. World Policy 2015, 4, 20–40. [Google Scholar] [CrossRef]
- Andersson, K.; Eklund, E.; Lehtola, M.M.; Salmi, P. Beyond the Rural-Urban Divide: Cross-Continental Perspectives on the Differentiated Countryside and Its Regulation; Emerald Jai: Bingley, UK, 2009. [Google Scholar]
- Tacoli, C. The Earthscan Reader in Urban-Rural Linkages; Earthscan: London, UK, 2006. [Google Scholar]
- EEA, European Environment Agency. Land Take in Europe. Available online: https://www.eea.europa.eu/data-and-maps/indicators/land-take-3/assessment (accessed on 15 January 2021).
- EEA, European Environment Agency. Land Take and Net Land Take. Available online: https://www.eea.europa.eu/data-and-maps/dashboards/land-take-statistics#tab-based-on-data (accessed on 15 January 2021).
- UBA, Federal Environment Agency. Siedlungs- und Verkehrsfläche. Available online: https://www.umweltbundesamt.de/daten/flaeche-boden-land-oekosysteme/flaeche/siedlungs-verkehrsflaeche#anhaltender-flachenverbrauch-fur-siedlungs-und-verkehrszwecke- (accessed on 15 January 2021).
- UBA, Federal Environment Agency. Indikator: Siedlungs- und Verkehrsfläche. Available online: https://www.umweltbundesamt.de/indikator-siedlungs-verkehrsflaeche#wie-wird-der-indikator-berechnet (accessed on 15 January 2021).
- IOER, Leibniz Institute of Ecological Urban and Regional Development. Monitor der Siedlungs- und Freiraumentwicklung (IÖR-Monitor). Available online: https://www.ioer-monitor.de (accessed on 15 January 2021).
- Hoymann, J.; Dosch, F.; Beckmann, G. Status quo und Projektion 2030—Trends der Siedlungsflaächenentwicklung; BBSR, Federal Institute for Research on Building, Urban Affairs and Spatial Development in the Federal Office for Building and Regional Planning (BBR), Eds.; BBSR: Bonn, Germany, 2012. [Google Scholar]
- Herczeg, M.R.; McKinnon, D.; Milios, L.; Bakas, I.; Klaassens, E.; Svatikova, K.; Widerberg, O. Resource Efficiency in the Building Sector; ECORYS: Rotterdam, The Netherlands, 2014. [Google Scholar]
- Landesamt für Statistik Niedersachsen LSN. LSN Online—Regionaldatenbank für Niedersachsen. Available online: https://www1.nls.niedersachsen.de/statistik/default.asp (accessed on 15 January 2021).
- DENA, German Energy Agency. dena-GEBÄUDEREPORT KOMPAKT 2019—Statistiken und Analysen zur Energieeffizienz im Gebäudebestand; DENA: Berlin, Germany, 2019. [Google Scholar]
- BMU, Federal Ministry for the Environment, Nature Conservation and Nuclear Safety. Klimaschutzbericht 2019; German Bundestag: Berlin, Germany, 2020; pp. 69–81. [Google Scholar]
- The Federal Government Germany. Deutsche Nachhaltigkeitsstrategie Weiterentwicklung 2021—Dialogfassung; Press and Information Agency of the Federal Government Germany: Berlin, Germany, 2020. [Google Scholar]
- Braune, A.; Ruiz Durán, C. Life Cycle Assessments—A Guide on Using the LCA; Technical Report, German Sustainable Building Council; DGNB: Stuttgart, Germany, 2018. [Google Scholar]
- BKG, Federal Agency for Cartography and Geodesy. Regionalstatistische Raumtypologie (RegioStaR). Available online: https://www.bmvi.de/SharedDocs/DE/Artikel/G/regionalstatistische-raumtypologie.html (accessed on 15 February 2020).
- Christaller, W. Die zentralen Orte in Süddeutschland: Eine ökonomisch-geographische Untersuchung über die Gesetzmäßigkeit der Verbreitung und Entwicklung der Siedlungen mit städtischen Funktionen; Gustav Fischer: Jena, Germany, 1933. [Google Scholar]
- BBSR, Federal Institute for Research on Building, Urban Affairs and Spatial Developement. Laufende Stadtbeobachtung—Raumabgrenzungen. Available online: Bbsr.bund.de/BBSR/DE/Raumbeobachtung/Raumabgrenzungen/deutschland/gemeinden/StadtGemeindetyp/StadtGemeindetyp_node.html (accessed on 21 March 2017).
- BBSR, Federal Institute for Research on Building, Urban Affairs and Spatial Developement. Raumordnungsbericht 2017; BBSR: Bonn, Germany, 2018. [Google Scholar]
- LSN, Landesamt für Statistik Niedersachsen. Bevölkerung am 31.12.2018 in Niedersachsen nach Einwohnergrößenklassen; Landesamt für Statistik Niedersachsen LSN: Hanover, Germany, 2019. [Google Scholar]
- Carlow, V.M.; Mumm, O.; Neumann, D.; Schmidt, N.; Siefer, T. TOPOI MOBILITY: Accessibility and settlement types in the urban rural gradient of Lower Saxony—Opportunities for sustainable mobility. Urbanplan. Transp. Res. 2021. accepted for publication. [Google Scholar]
- Destatis, Federal Statistical Office Germany. Zensus 2011; Destatis: Wiesbaden, Germany, 2015. [Google Scholar]
- Suarez-Rubio, M.; Krenn, R. Quantitative analysis of urbanization gradients: A comparative case study of two European cities. J. Urban Ecol. 2018, 4, juy027. [Google Scholar] [CrossRef]
- ESRI. ArcGIS Pro 2.5.1; ESRI: Redlands, CA, USA, 2020. [Google Scholar]
- LGLN. Amtliches Liegenschaftskataster-Informationssystem (ALKIS). In Landesamt für Geoinformation und Landesvermessung Niedersachsen; LGLN: Hannover, Germany, 2016. [Google Scholar]
- LGLN. Digitales Landschaftsmodell (Basis-DLM). In Landesamt für Geoinformation und Landesvermessung Niedersachsen Hannover; LGLN: Hannover, Germany, 2016. [Google Scholar]
- BKG. Digitales Landschaftsmodell (DLM 250); Bundesamt für Kartographie und Geodäsie: Frankfurt am Main, Germany, 2012. [Google Scholar]
- Planet Dump [Data File from 27/11/2019]; OSM, OpenStreetMap Contributors (Ed.) GEOFABRIK: Karlsruhe, Germany, 2019. [Google Scholar]
- Loga, T.; Stein, B.; Diefenbach, N.; Born, R. Deutsche Wohngebäudetypologie: Beispielhafte Maßnahmen zur Verbesserung der Energieeffizienz von typischen Wohngebäuden, 2nd ed.; Institut Wohnen und Umwelt, Ed.; IWU: Darmstadt, Germany, 2015. [Google Scholar]
- Mühlbach, A.-K.; Strohbach, M.W.; Wilken, T. A Spatially Explicit Life Cycle Assessment Tool for Residential Buildings in Lower Saxony: Development and Sample Application. In Progress in Life Cycle Assessment 2018; Teuteberg, F., Hempel, M., Schebek, L., Eds.; Springer International Publishing: Cham, Switzerland, 2019; pp. 103–113. [Google Scholar] [CrossRef]
- BBSR, Federal Institute for Research on Building, Urban Affairs and Spatial Development in the Federal Office for Building and Regional Planning (BBR). ÖKOBAUDAT—Sustainable Construction Information Portal. Available online: https://www.oekobaudat.de (accessed on 16 February 2021).
- Rössig, S. BBSR, Federal Institute for Research on Buildings, Urban Affairs and Spatial Development. eLCA. Available online: https://www.bauteileditor.de/ (accessed on 15 January 2021).
- Cischinsky, H.; Diefenbach, N. Datenerhebung Wohngebäudebestand 2016: Datenerhebung zu den energetischen Merkmalen und Modernisierungsraten im deutschen und hessischen Wohngebäudebestand; IWU: Darmstadt, Germany, 2018. [Google Scholar]
- Bürger, V.; Hesse, T.; Palzer, A.; Köhler, B.; Herkel, S.; Engelmann, P.; Quack, D. Klimaneutraler Gebäudebestand 2050: Energieeffizienzpotenziale und die Auswirkungen des Klimawandels auf den Gebäudebestand; Umweltbundesamt: Freiburg, Germany, 2017; pp. 40–56. [Google Scholar]
- Hoier, A.; Erhorn, H. Energetische Gebäudesanierung in Deutschland. Studie Teil I: Entwicklung und energetische Bewertung alternativer Sanierungsfahrpläne; Instituts für Wärme und Öltechnik e.V., Ed.; IBP Fraunhofer-Institut für Bauphysik: Stuttgart, Germany, 2013; pp. 30–31. [Google Scholar]
- OpenStreetMap Wiki Contributors. OpenStreetMap—Map Features “Highway”. Available online: https://wiki.openstreetmap.org/wiki/Map_features#Highway (accessed on 16 February 2021).
- FGSV, Road and Transportation Research Association. Richtlinien für die Anlage von Autobahnen: RAA, 2008 ed.; FGSV: Cologne, Germany, 2008; p. 119. [Google Scholar]
- FGSV, Road and Transportation Research Association. Richtlinien für die Anlage von Landstraßen: RAL, 2012 ed.; FGSV: Cologne, Germany, 2012; p. 136. [Google Scholar]
- FGSV, Road and Transportation Research Association. Richtlinien für die Anlage von Stadtstraßen: RASt 06; 2006, Revised Reprint 2012 ed.; FGSV: Cologne, Germany, 2012; p. 136. [Google Scholar]
- FGSV, Road and Transportation Research Association. Richtlinien für die Standardisierung des Oberbaus von Verkehrsflächen: RStO 12, 2012 ed.; FGSV: Cologne, Germany, 2012; p. 52. [Google Scholar]
- LSN, Landesamt für Statistik Niedersachsen. Building Stock per Building Type and Construction Year Class (Based on 2011 Census); Landesamt für Statistik Niedersachsen LSN: Hanover, Germany, 2019. [Google Scholar]
- BKG, Federal Agency for Cartography and Geodesy. Geographische Gitter für Deutschland in UTM-Projektion (GeoGitter National); Federal Agency for Cartography and Geodesy: Frankfurt, Germany, 2019. [Google Scholar]
- Carlow, V.M.; Mumm, O.; Neumann, D.; Sedrez, M.; Zeringue, R. TOPOI—Urban Rural Settlement Types—Version 1.0; Institute for Sustainable Urbanism: Braunschweig, Germany, 2020. [Google Scholar] [CrossRef]
- AdV, Working Committee of the Surveying Authorities of the Laender of the Federal Republic of Germany. AdV-Nutzungsartenkatalog; AdV: Munich, Germany, 2011. [Google Scholar]
- Destatis, Federal Statistical Office German. “Bodenfläche nach Art der tatsächlichen Nutzung—Gebäude- und Freifläche Wohnen” in Niedersachsen im Jahre 2015. Destatis: Wiesbaden, Germany, 2016. Available online: https://www.statistischebibliothek.de/mir/receive/DEHeft_mods_00062202 (accessed on 6 April 2021).
- IINAS, International Institute for Sustainability Analysis and Strategy. Globales Emissions-Modell Integrierter Systeme (GEMIS); 4.95; IINAS: Darmstadt, Germany, 2017. [Google Scholar]
- BMWi, Federal Ministry for Economic Affairs and Energy Germany. Deutsche Klimaschutzpolitik. Available online: https://www.bmwi.de/Redaktion/DE/Artikel/Industrie/klimaschutz-deutsche-klimaschutzpolitik.html (accessed on 1 June 2020).
- Statista. CO2-Ausstoß je Einwohner in Deutschland Bis 2019 | Statista. Available online: https://de.statista.com/statistik/daten/studie/153528/umfrage/co2-ausstoss-je-einwohner-in-deutschland-seit-1990/ (accessed on 1 June 2020).
- UBA, Federal Environment Agency. Germany in 2050—A Greenhouse Gas-Neutral Country; UBA: Dessau-Rosßlau, Germany, 2014. [Google Scholar]
- German Thermal Insulation Ordinance 1977 (“Verordnung über energiesparenden Wärmeschutz bei Gebäuden (Wärmeschutzverordnung—WärmeschutzV)“). Germany, 1977. Available online: https://www.bbsr-energieeinsparung.de/EnEVPortal/EN/Archive/ThermalInsulation/1977/1977_node.html (accessed on 1 April 2021).
- German Thermal Insulation Ordinance 1984 (“Verordnung über energiesparenden Wärmeschutz bei Gebäuden (Wärmeschutzverordnung—WärmeschutzV)“). Germany, 1984. Available online: https://www.bbsr-energieeinsparung.de/EnEVPortal/EN/Archive/ThermalInsulation/1982_84/1982_84_node.html (accessed on 1 April 2021).
- German Energy Saving Ordinance 2009 (“Energieeinsparverordnung (EnEV)“) Germany, 2009. Available online: https://www.bbsr-energieeinsparung.de/EnEVPortal/EN/Archive/EnEV/EnEV2009/2009_node.html (accessed on 1 April 2021).
- German Thermal Insulation Ordinance 1995 (“Verordnung über energiesparenden Wärmeschutz bei Gebäuden (Wärmeschutzverordnung—WärmeschutzV)“) Germany, 1995. Available online: https://www.bbsr-energieeinsparung.de/EnEVPortal/EN/Archive/ThermalInsulation/1995/1995_node.html (accessed on 1 April 2021).
- Heating Appliance Ordinance 1978 (“Verordnung über energiesparende Anforderungen an heizungstechnische Anlagen und Brauchwasseranlagen (Heizungsanlagen-Verordnung—HeizAnlV)“). Germany, 1978. Available online: https://www.bbsr-energieeinsparung.de/EnEVPortal/EN/Archive/HeatingAppliances/HeatingA1978/1978_node.html (accessed on 1 April 2021).
- German Energy Saving Ordinance 2002 (“Energieeinsparverordnung (EnEV)“) Germany, 2002. Available online: https://www.bbsr-energieeinsparung.de/EnEVPortal/EN/Archive/EnEV/EnEV2002/2002_node.html (accessed on 1 April 2021).
- Bogaert, J.; Rousseau, R.; Van Hecke, P.; Impens, I. Alternative area-perimeter ratios for measurement of 2D shape compactness of habitats. Appl. Math. Comput. 2000, 111, 71–85. [Google Scholar] [CrossRef]
- DB, Deutsche Bahn AG. Streckennetz; Deutsche Bahn AG: Berlin, Germany, 2013. [Google Scholar]
- DB, Deutsche Bahn AG. Stationsdaten; Deutsche Bahn AG: Berlin, Germany, 2016. [Google Scholar]
- ESRI. ArcToolbox (Network Analyst Toolsets); ESRI: Redlands, CA, USA, 2018. [Google Scholar]
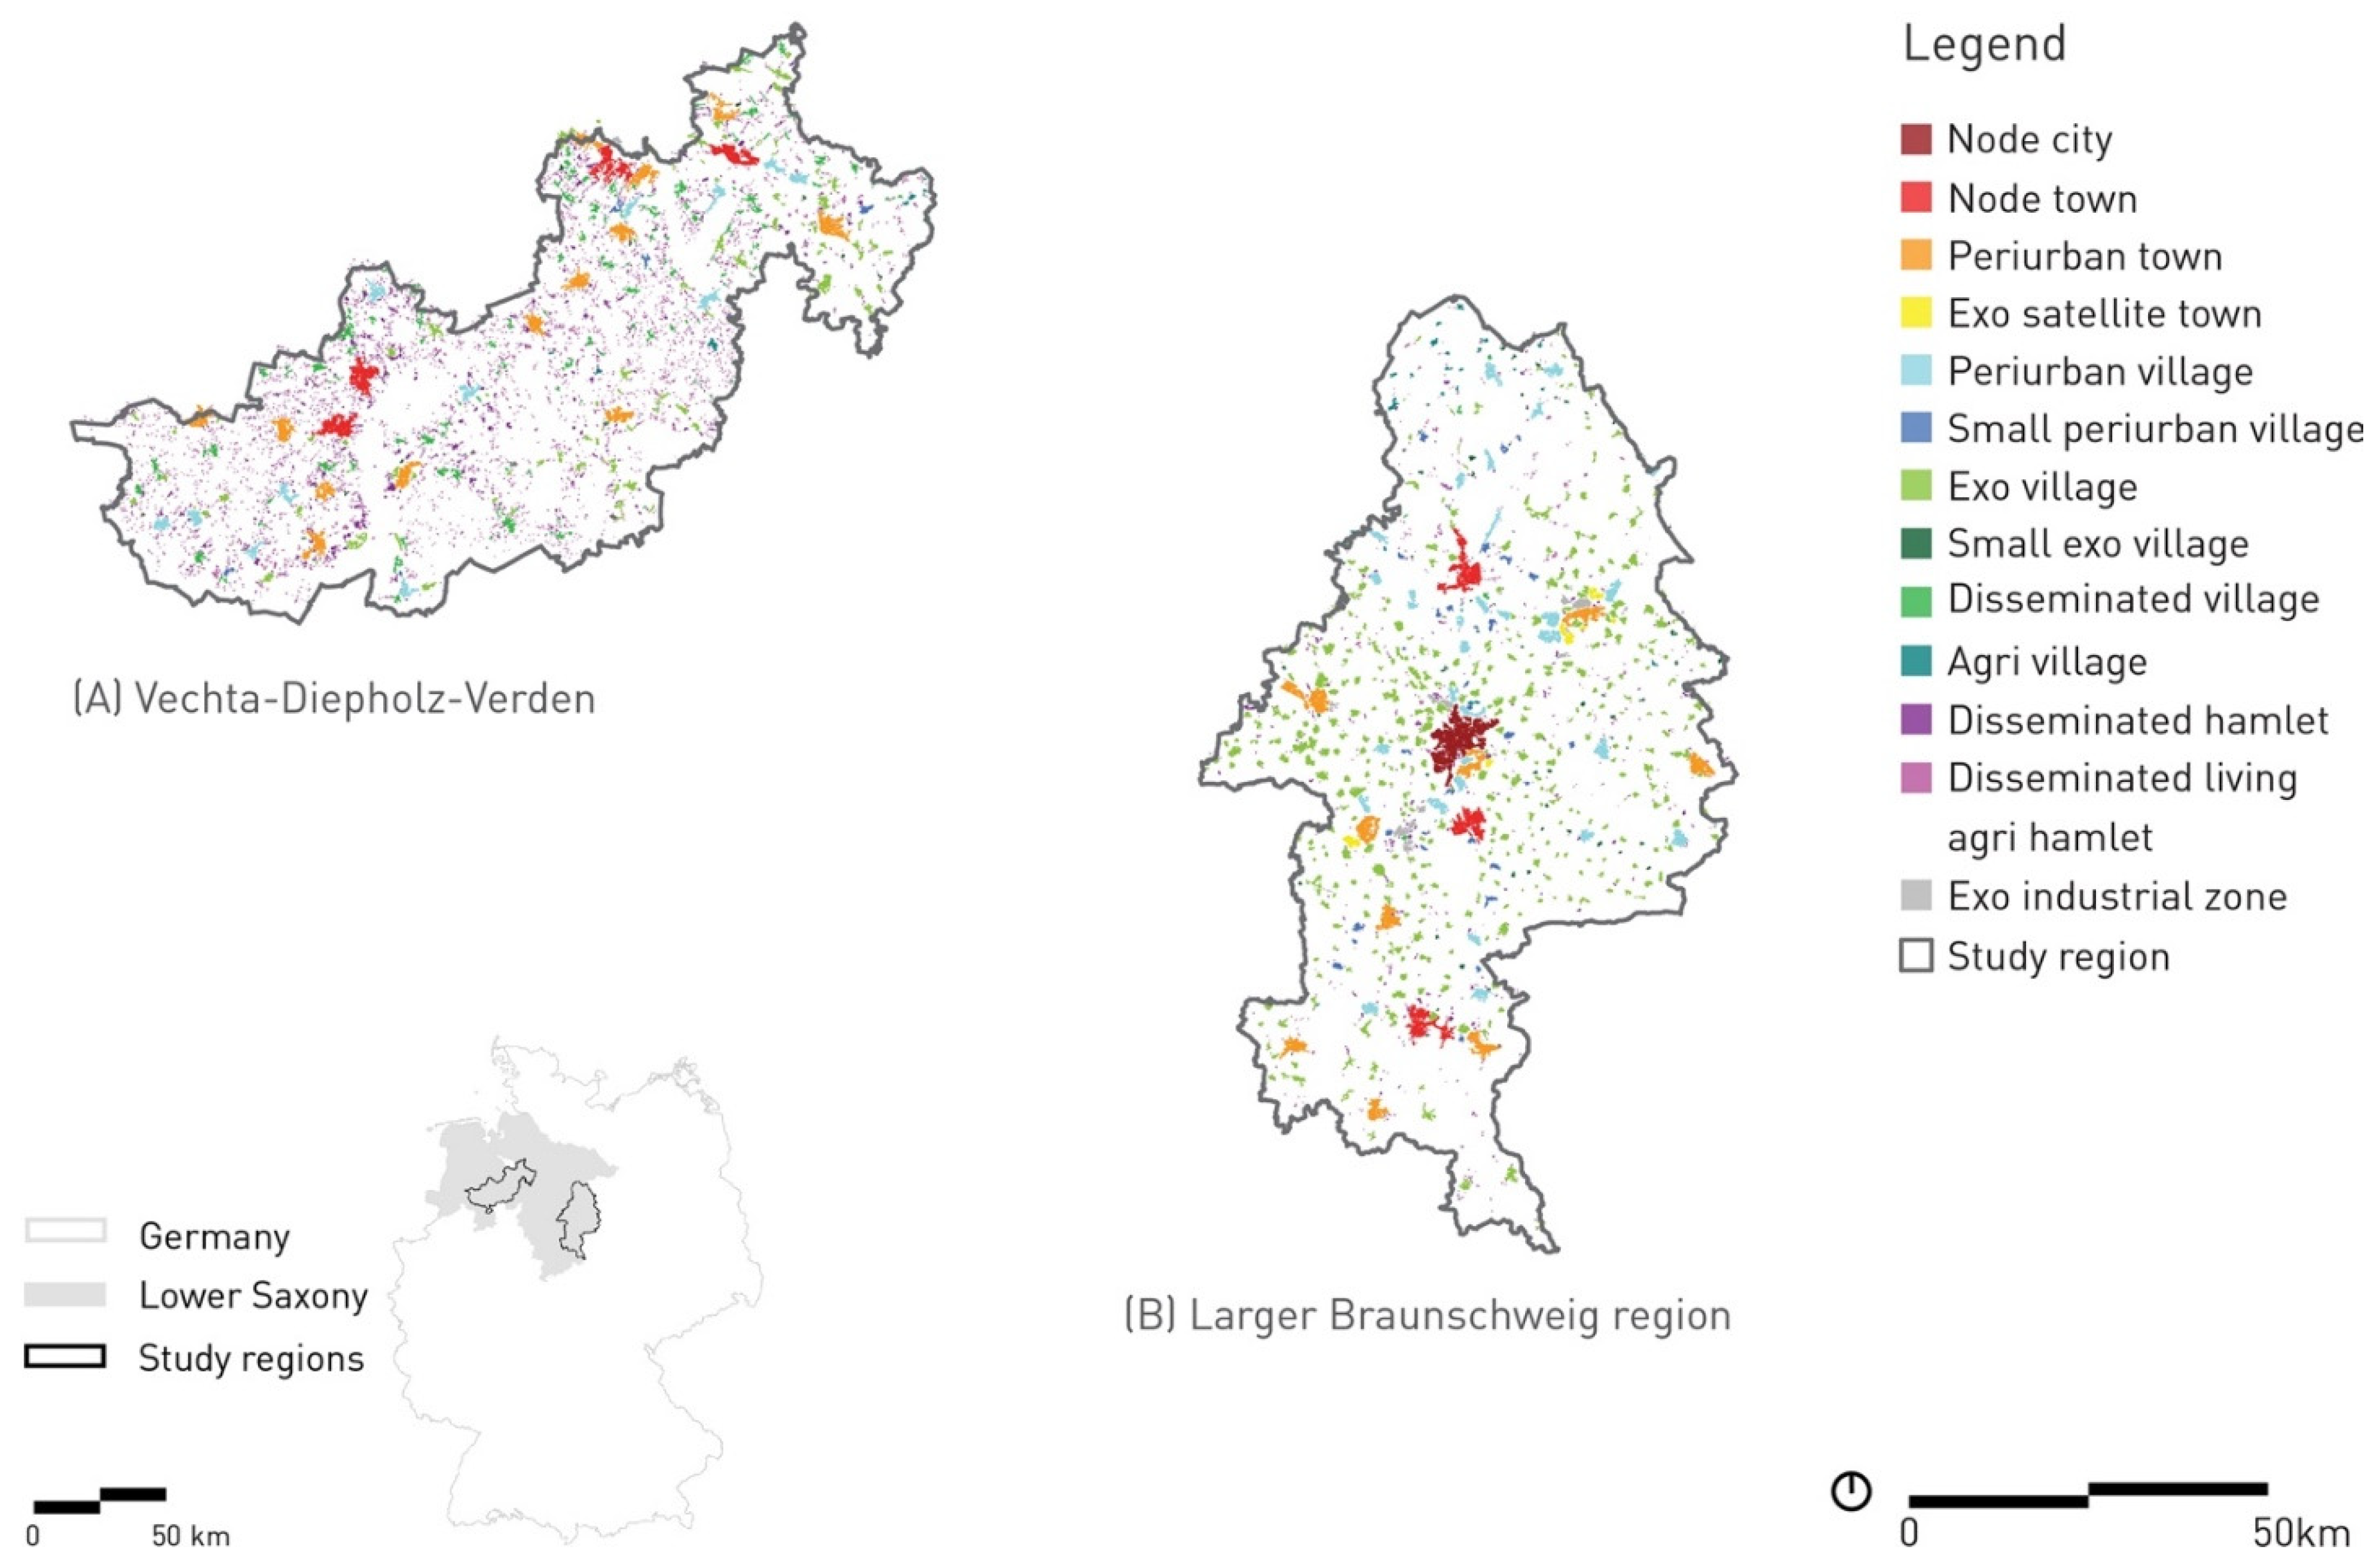
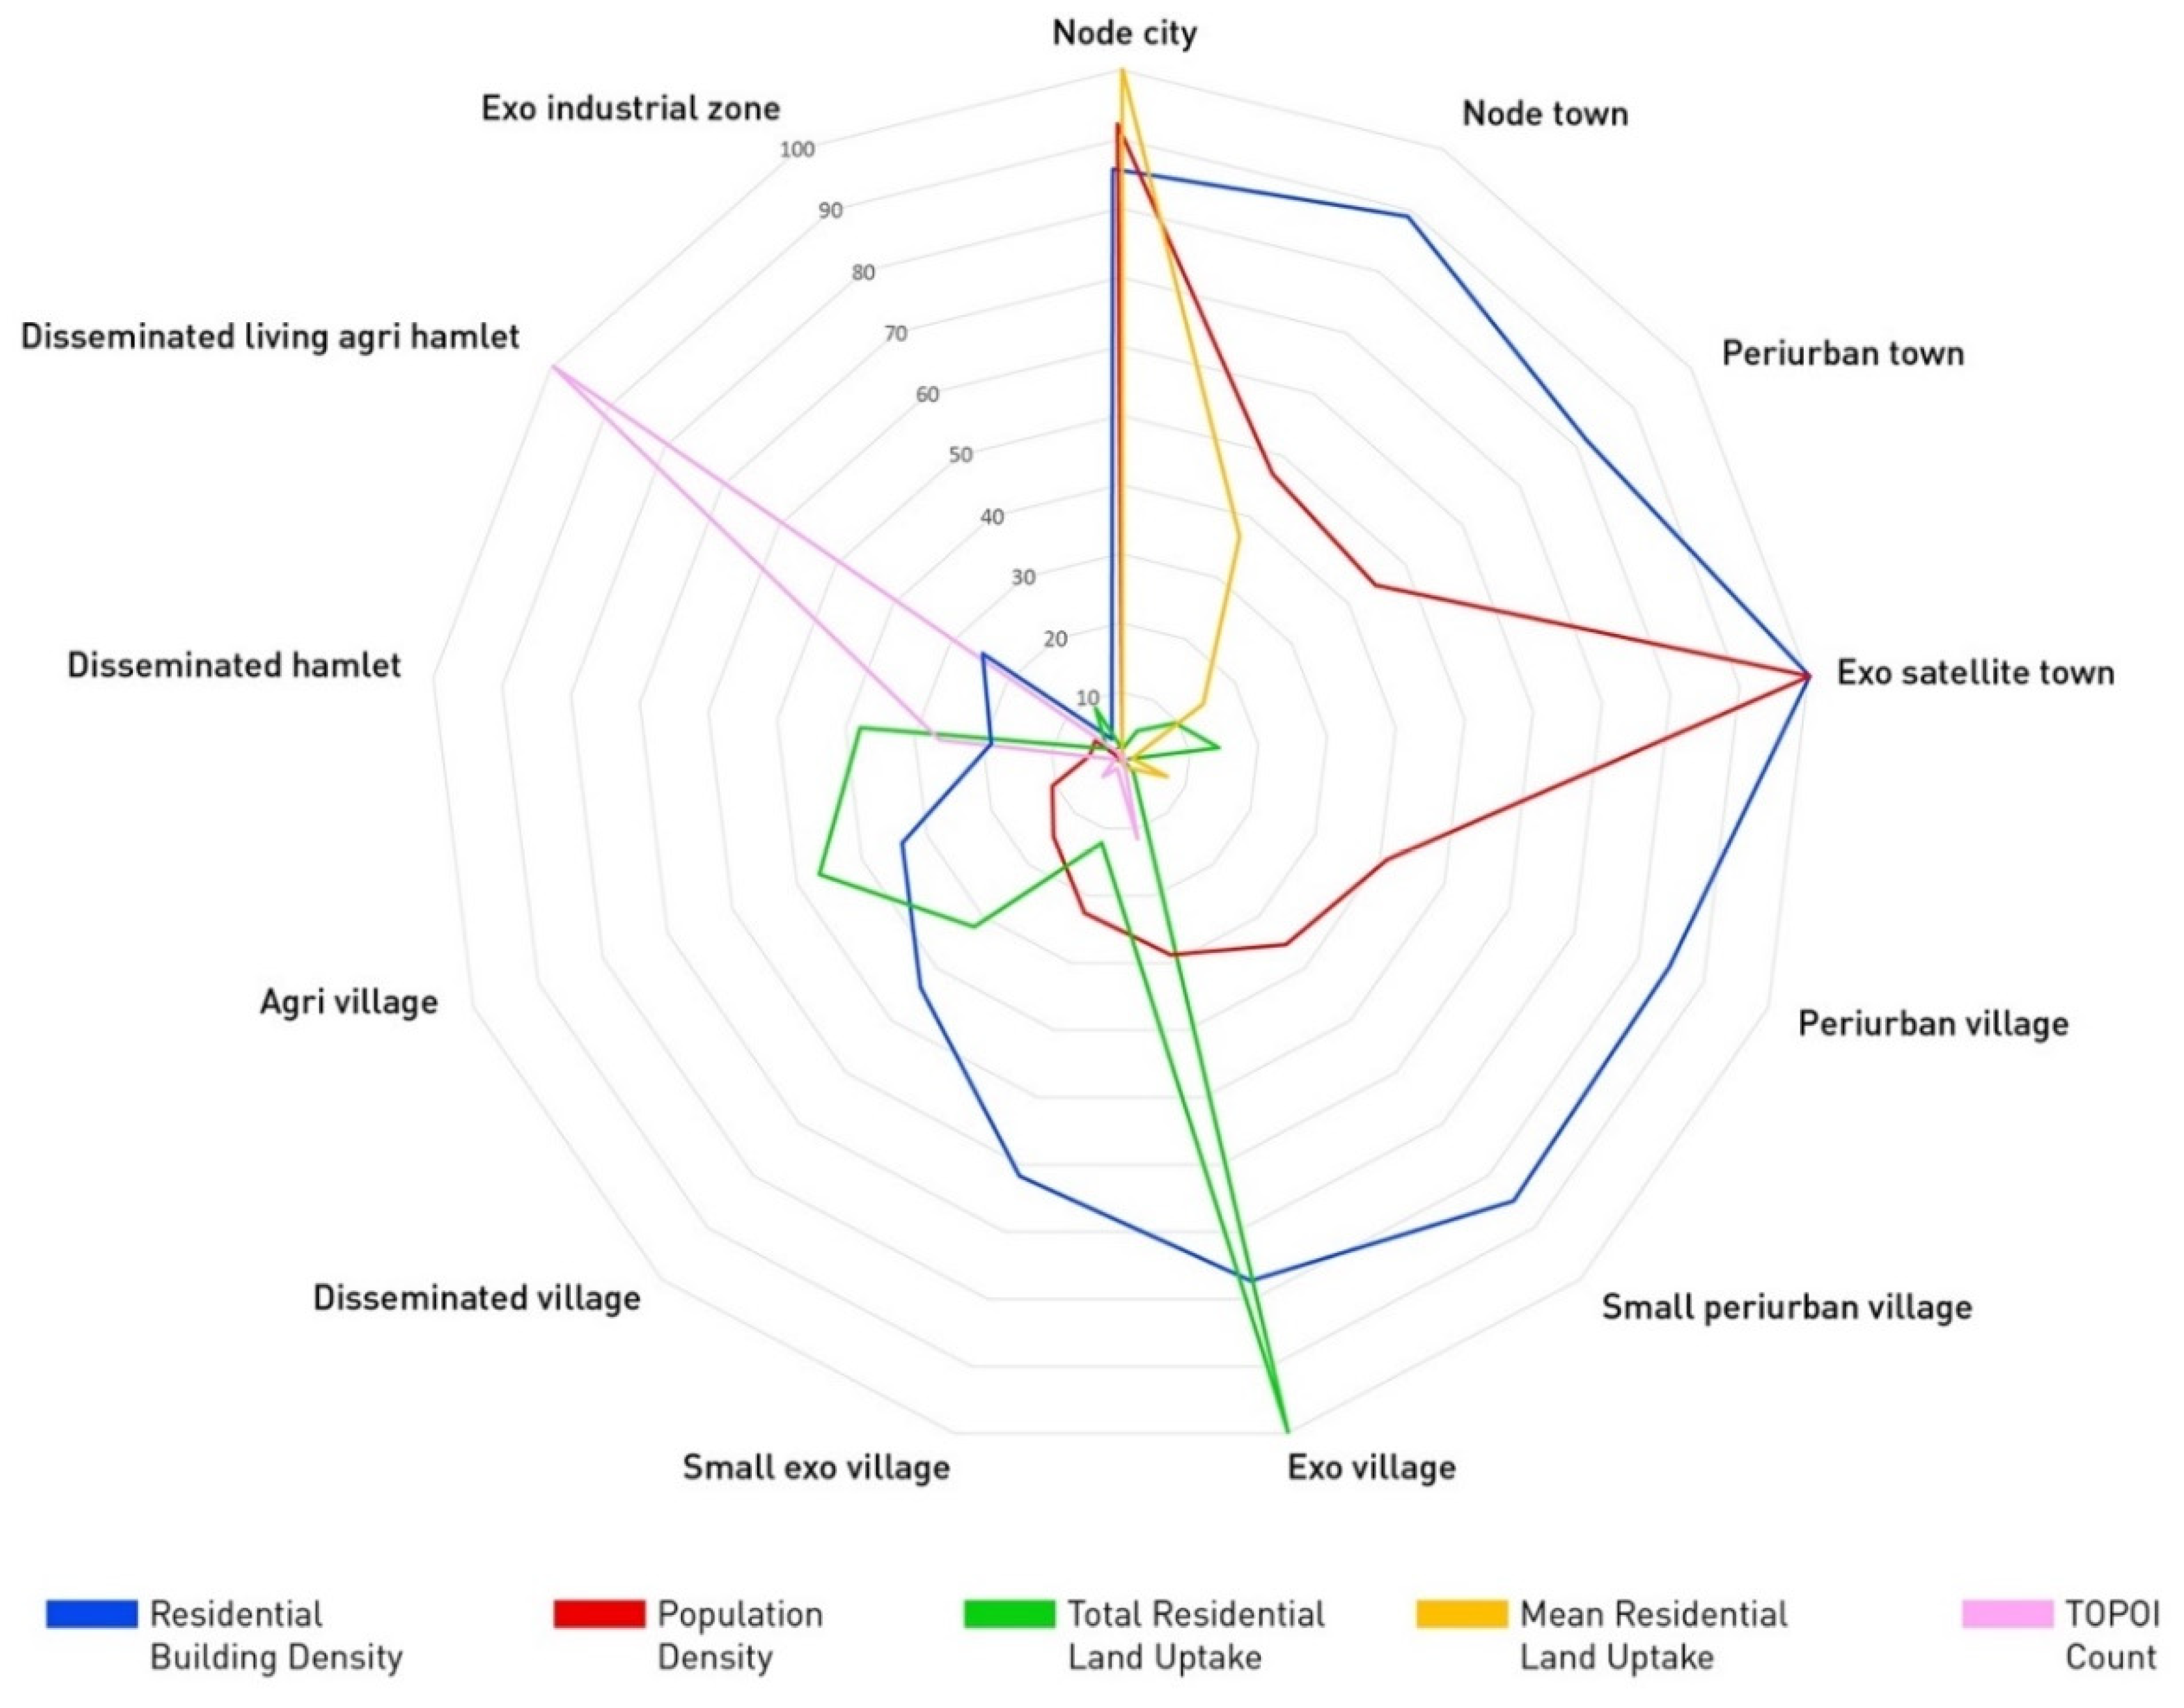
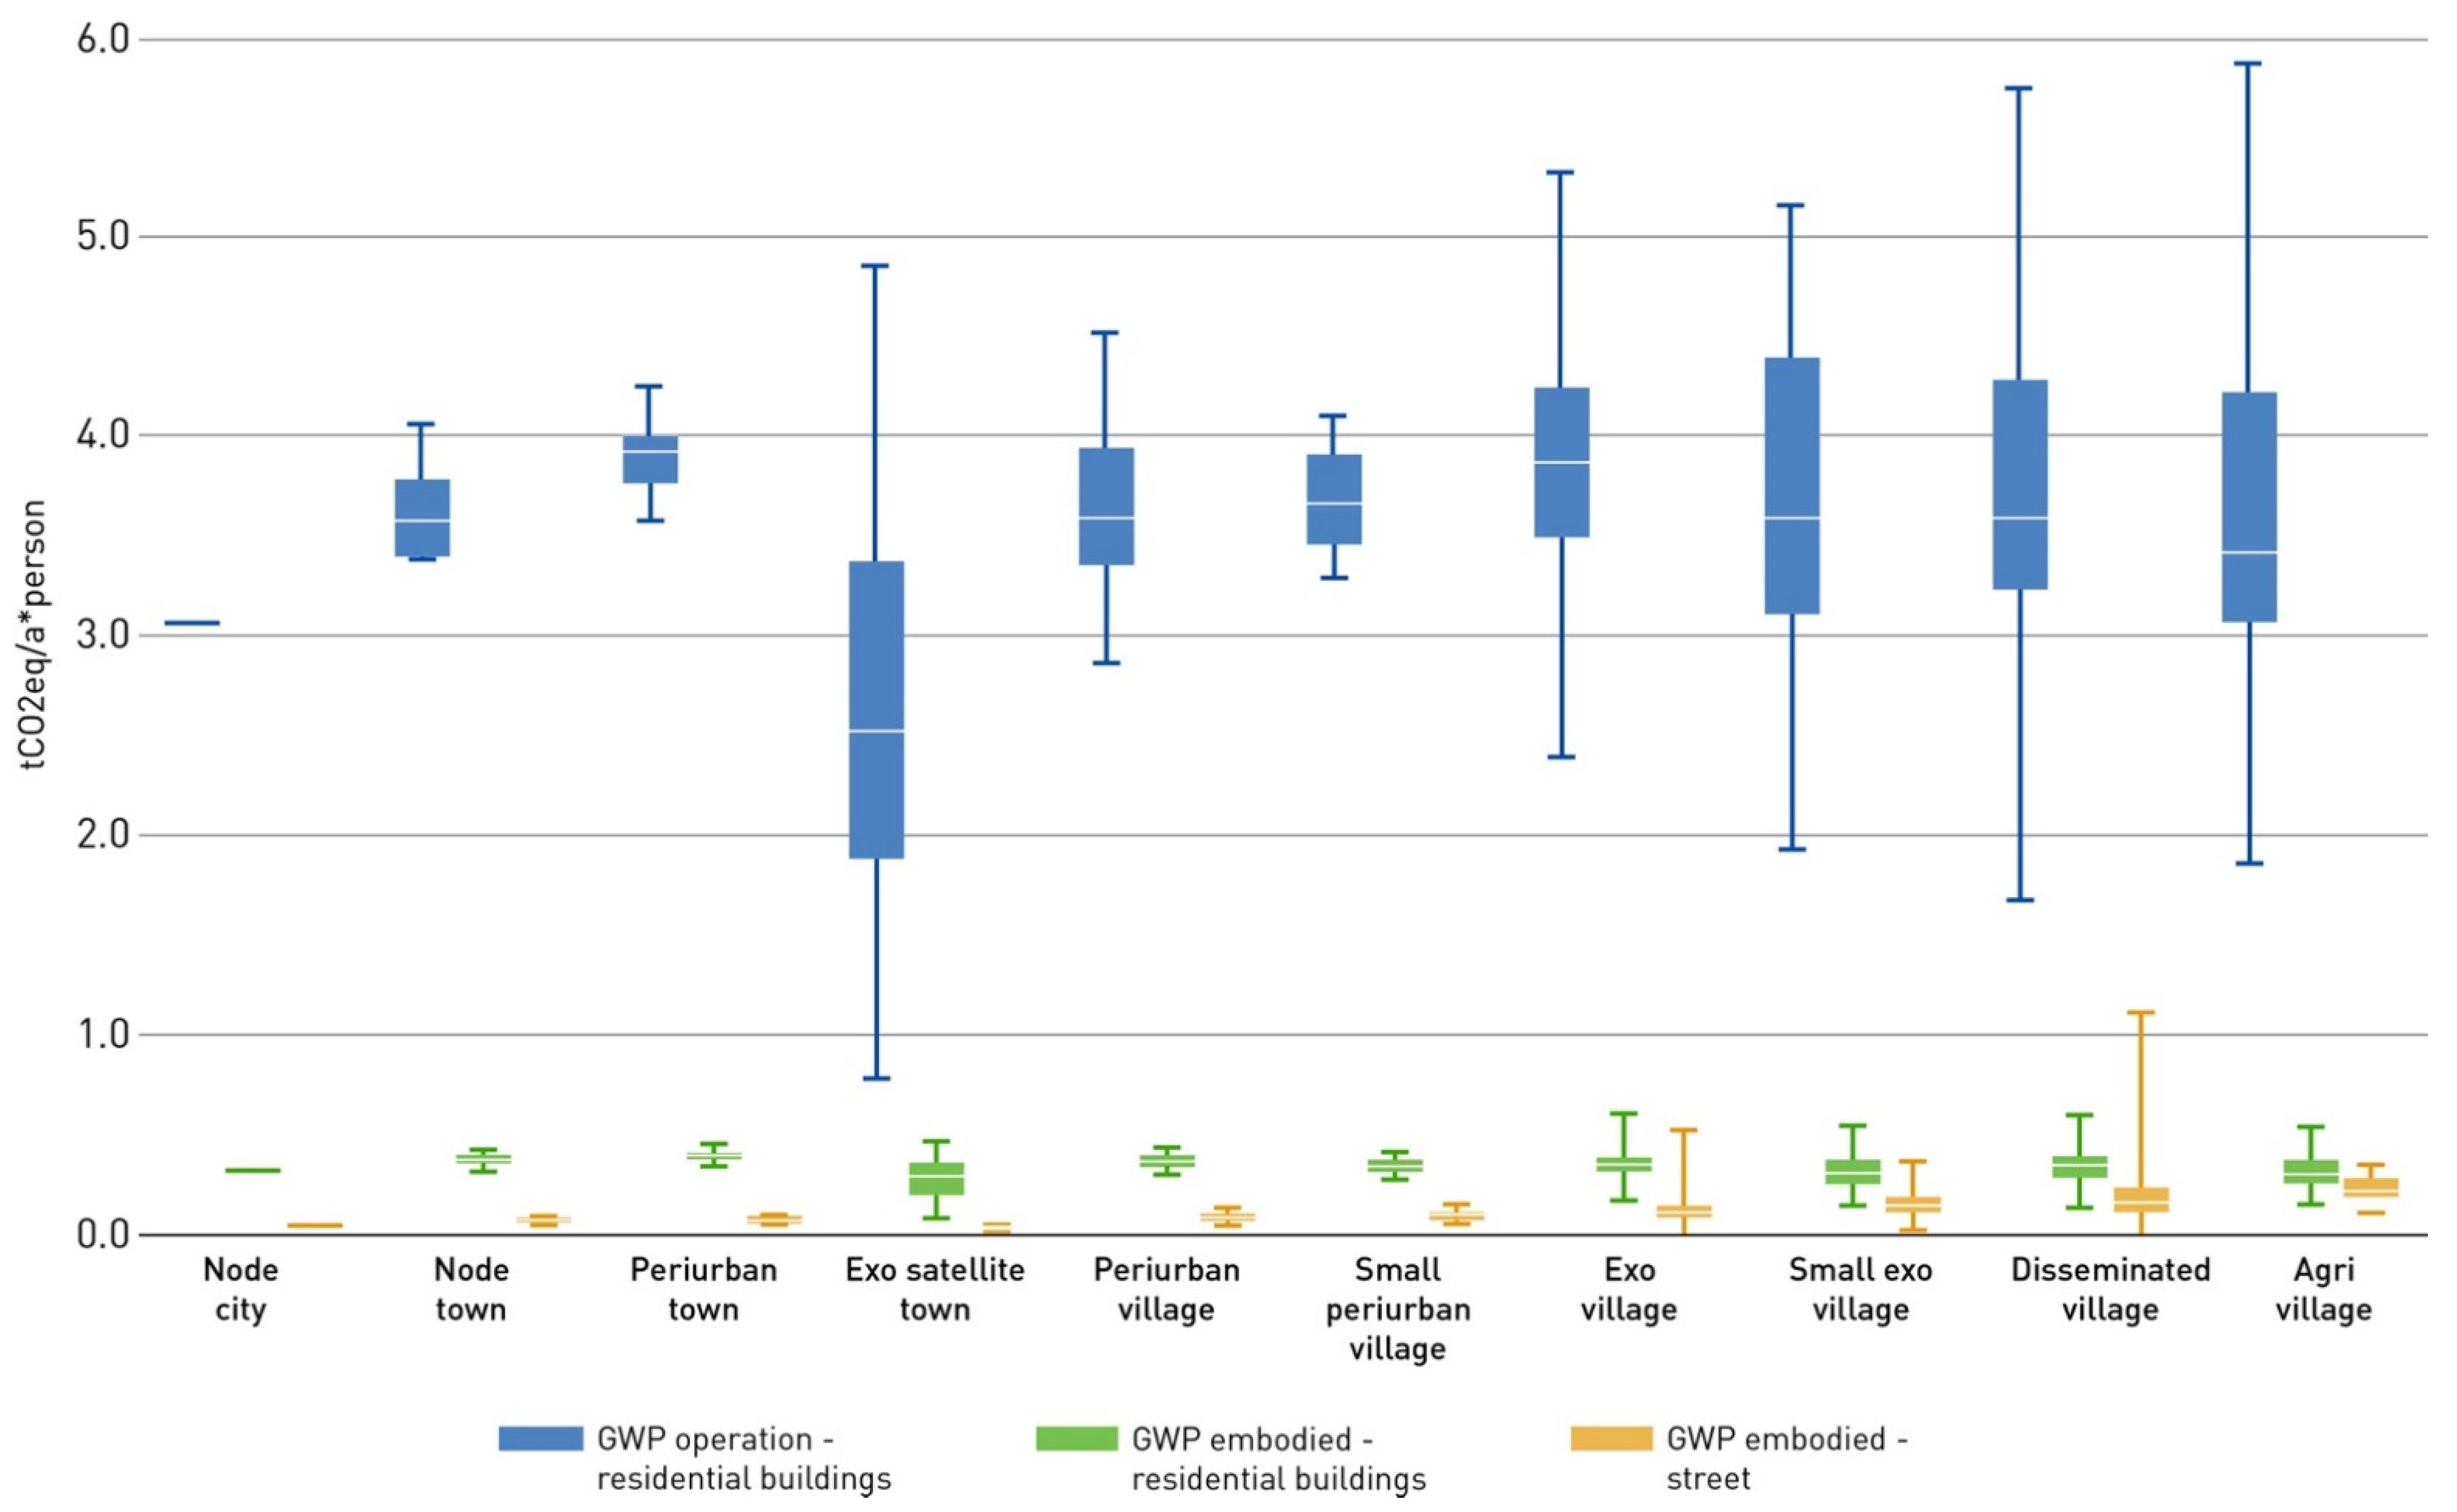
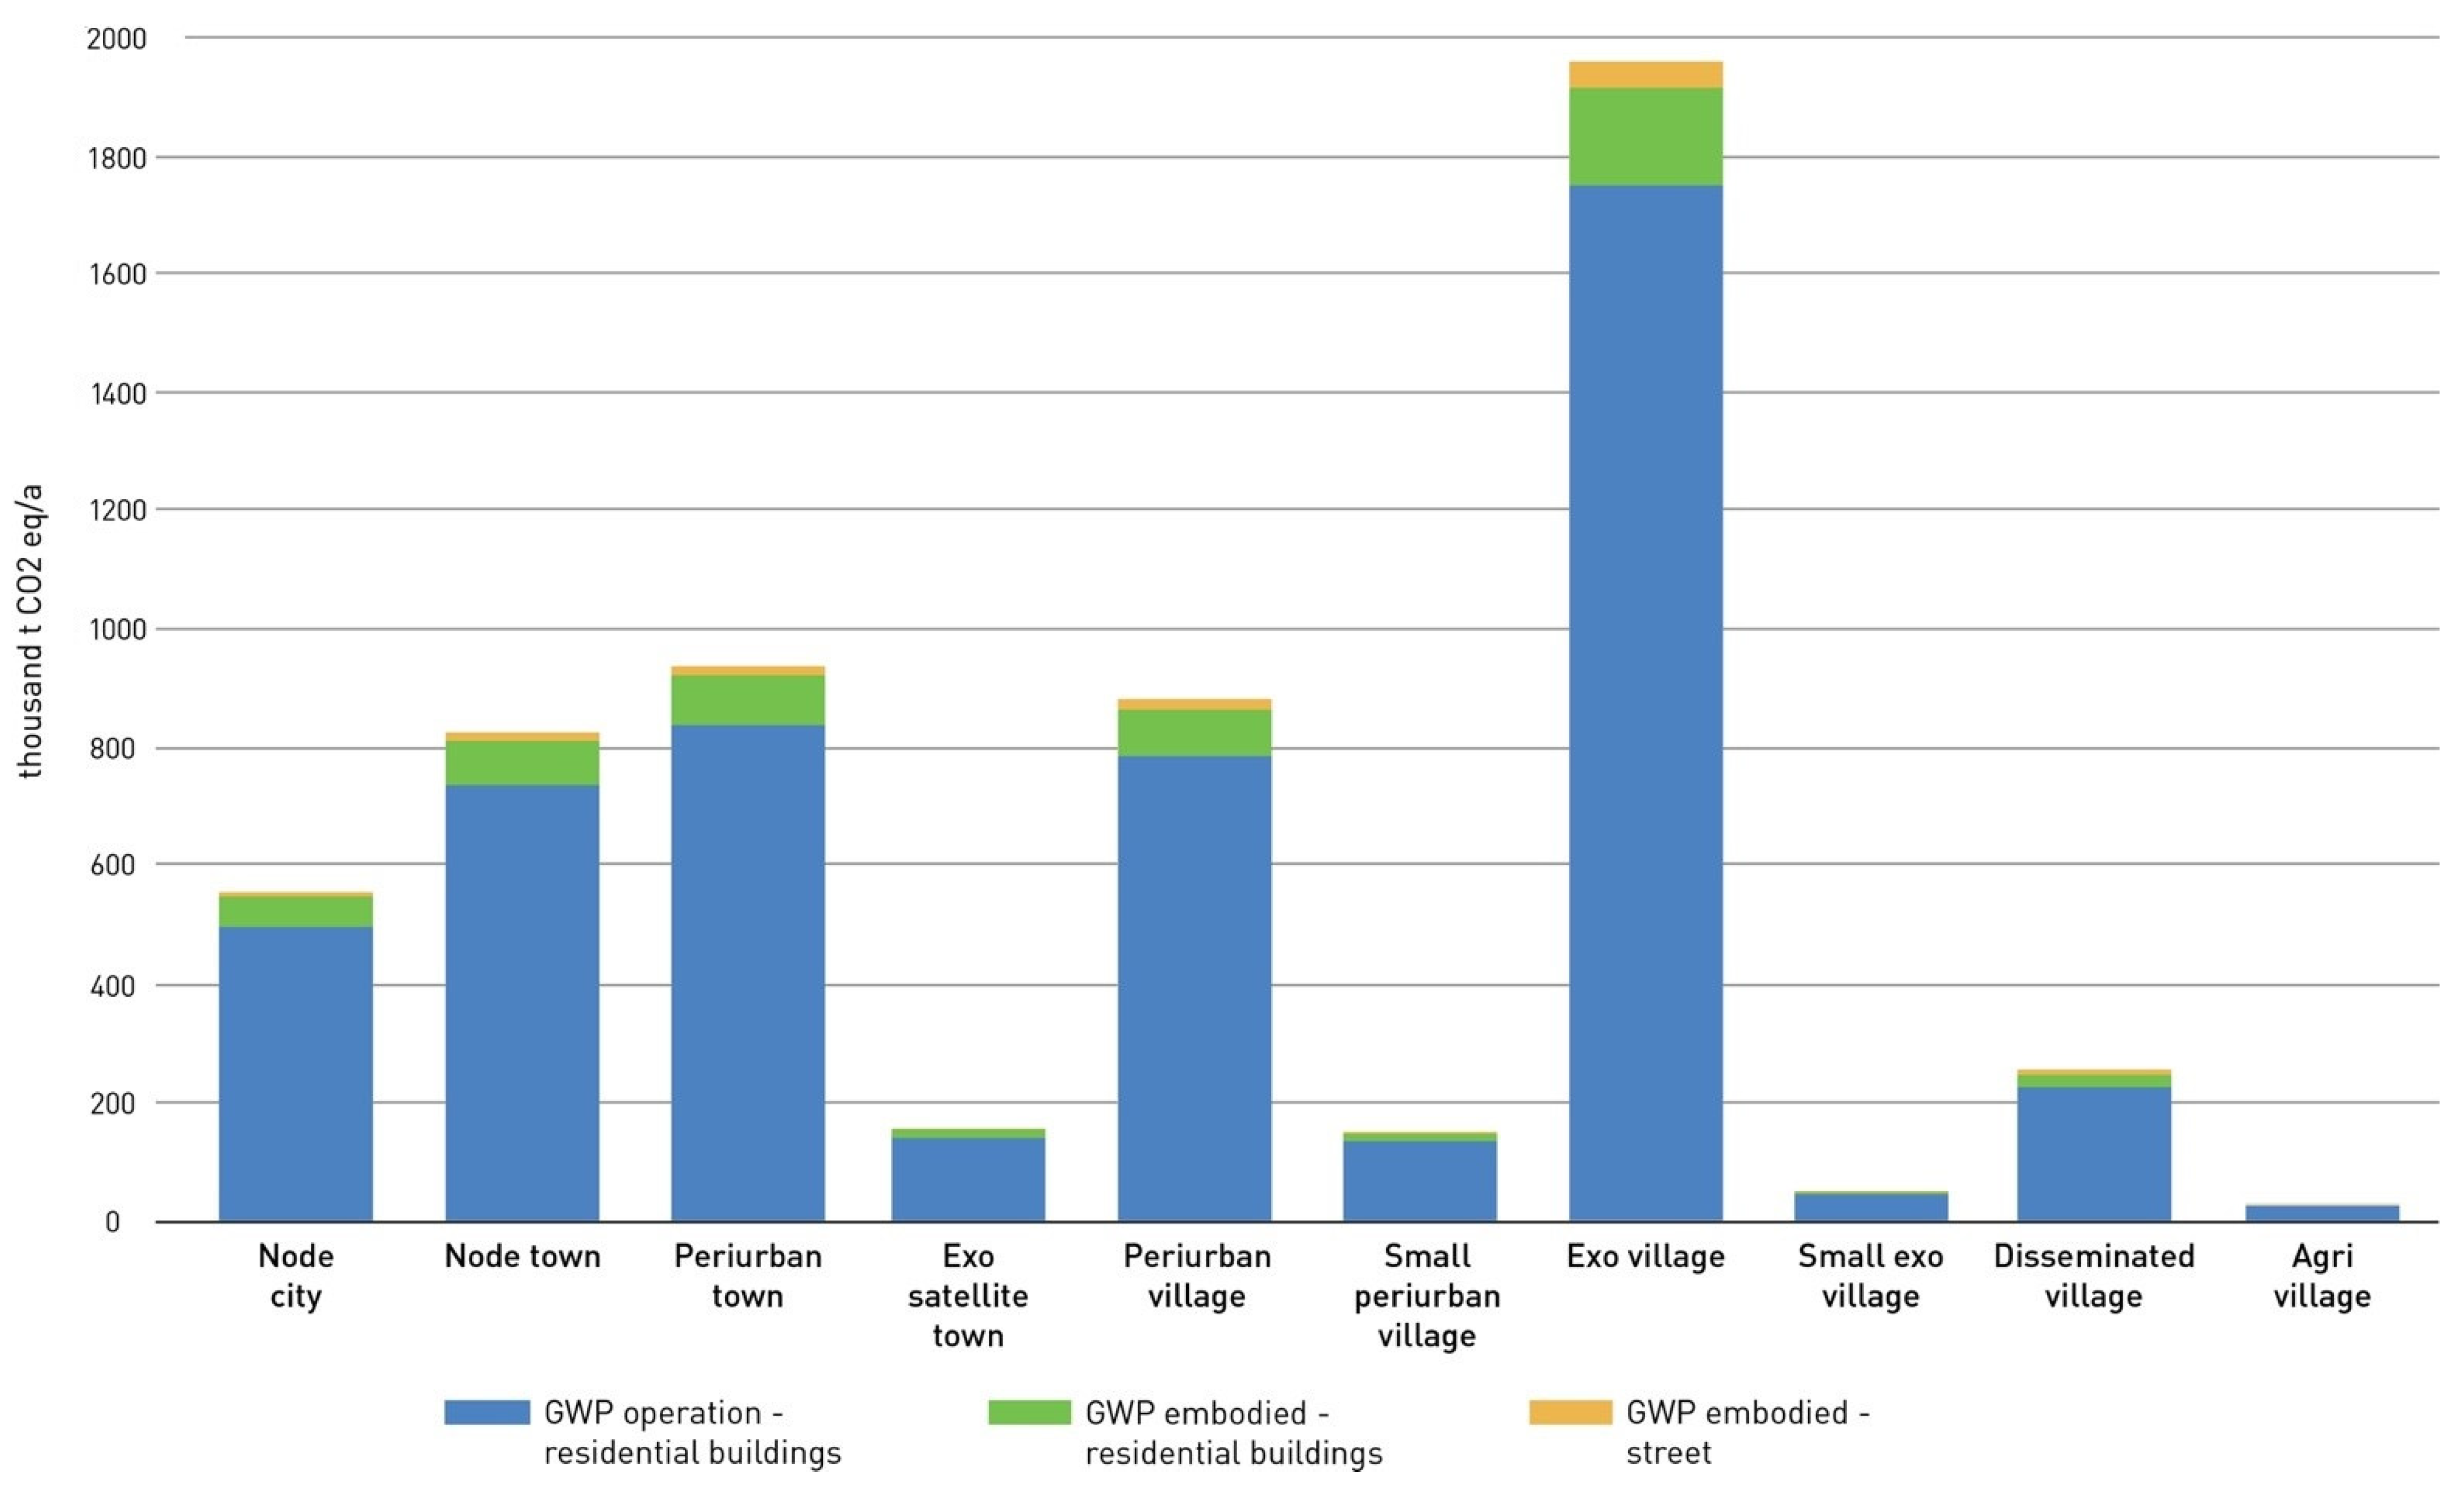
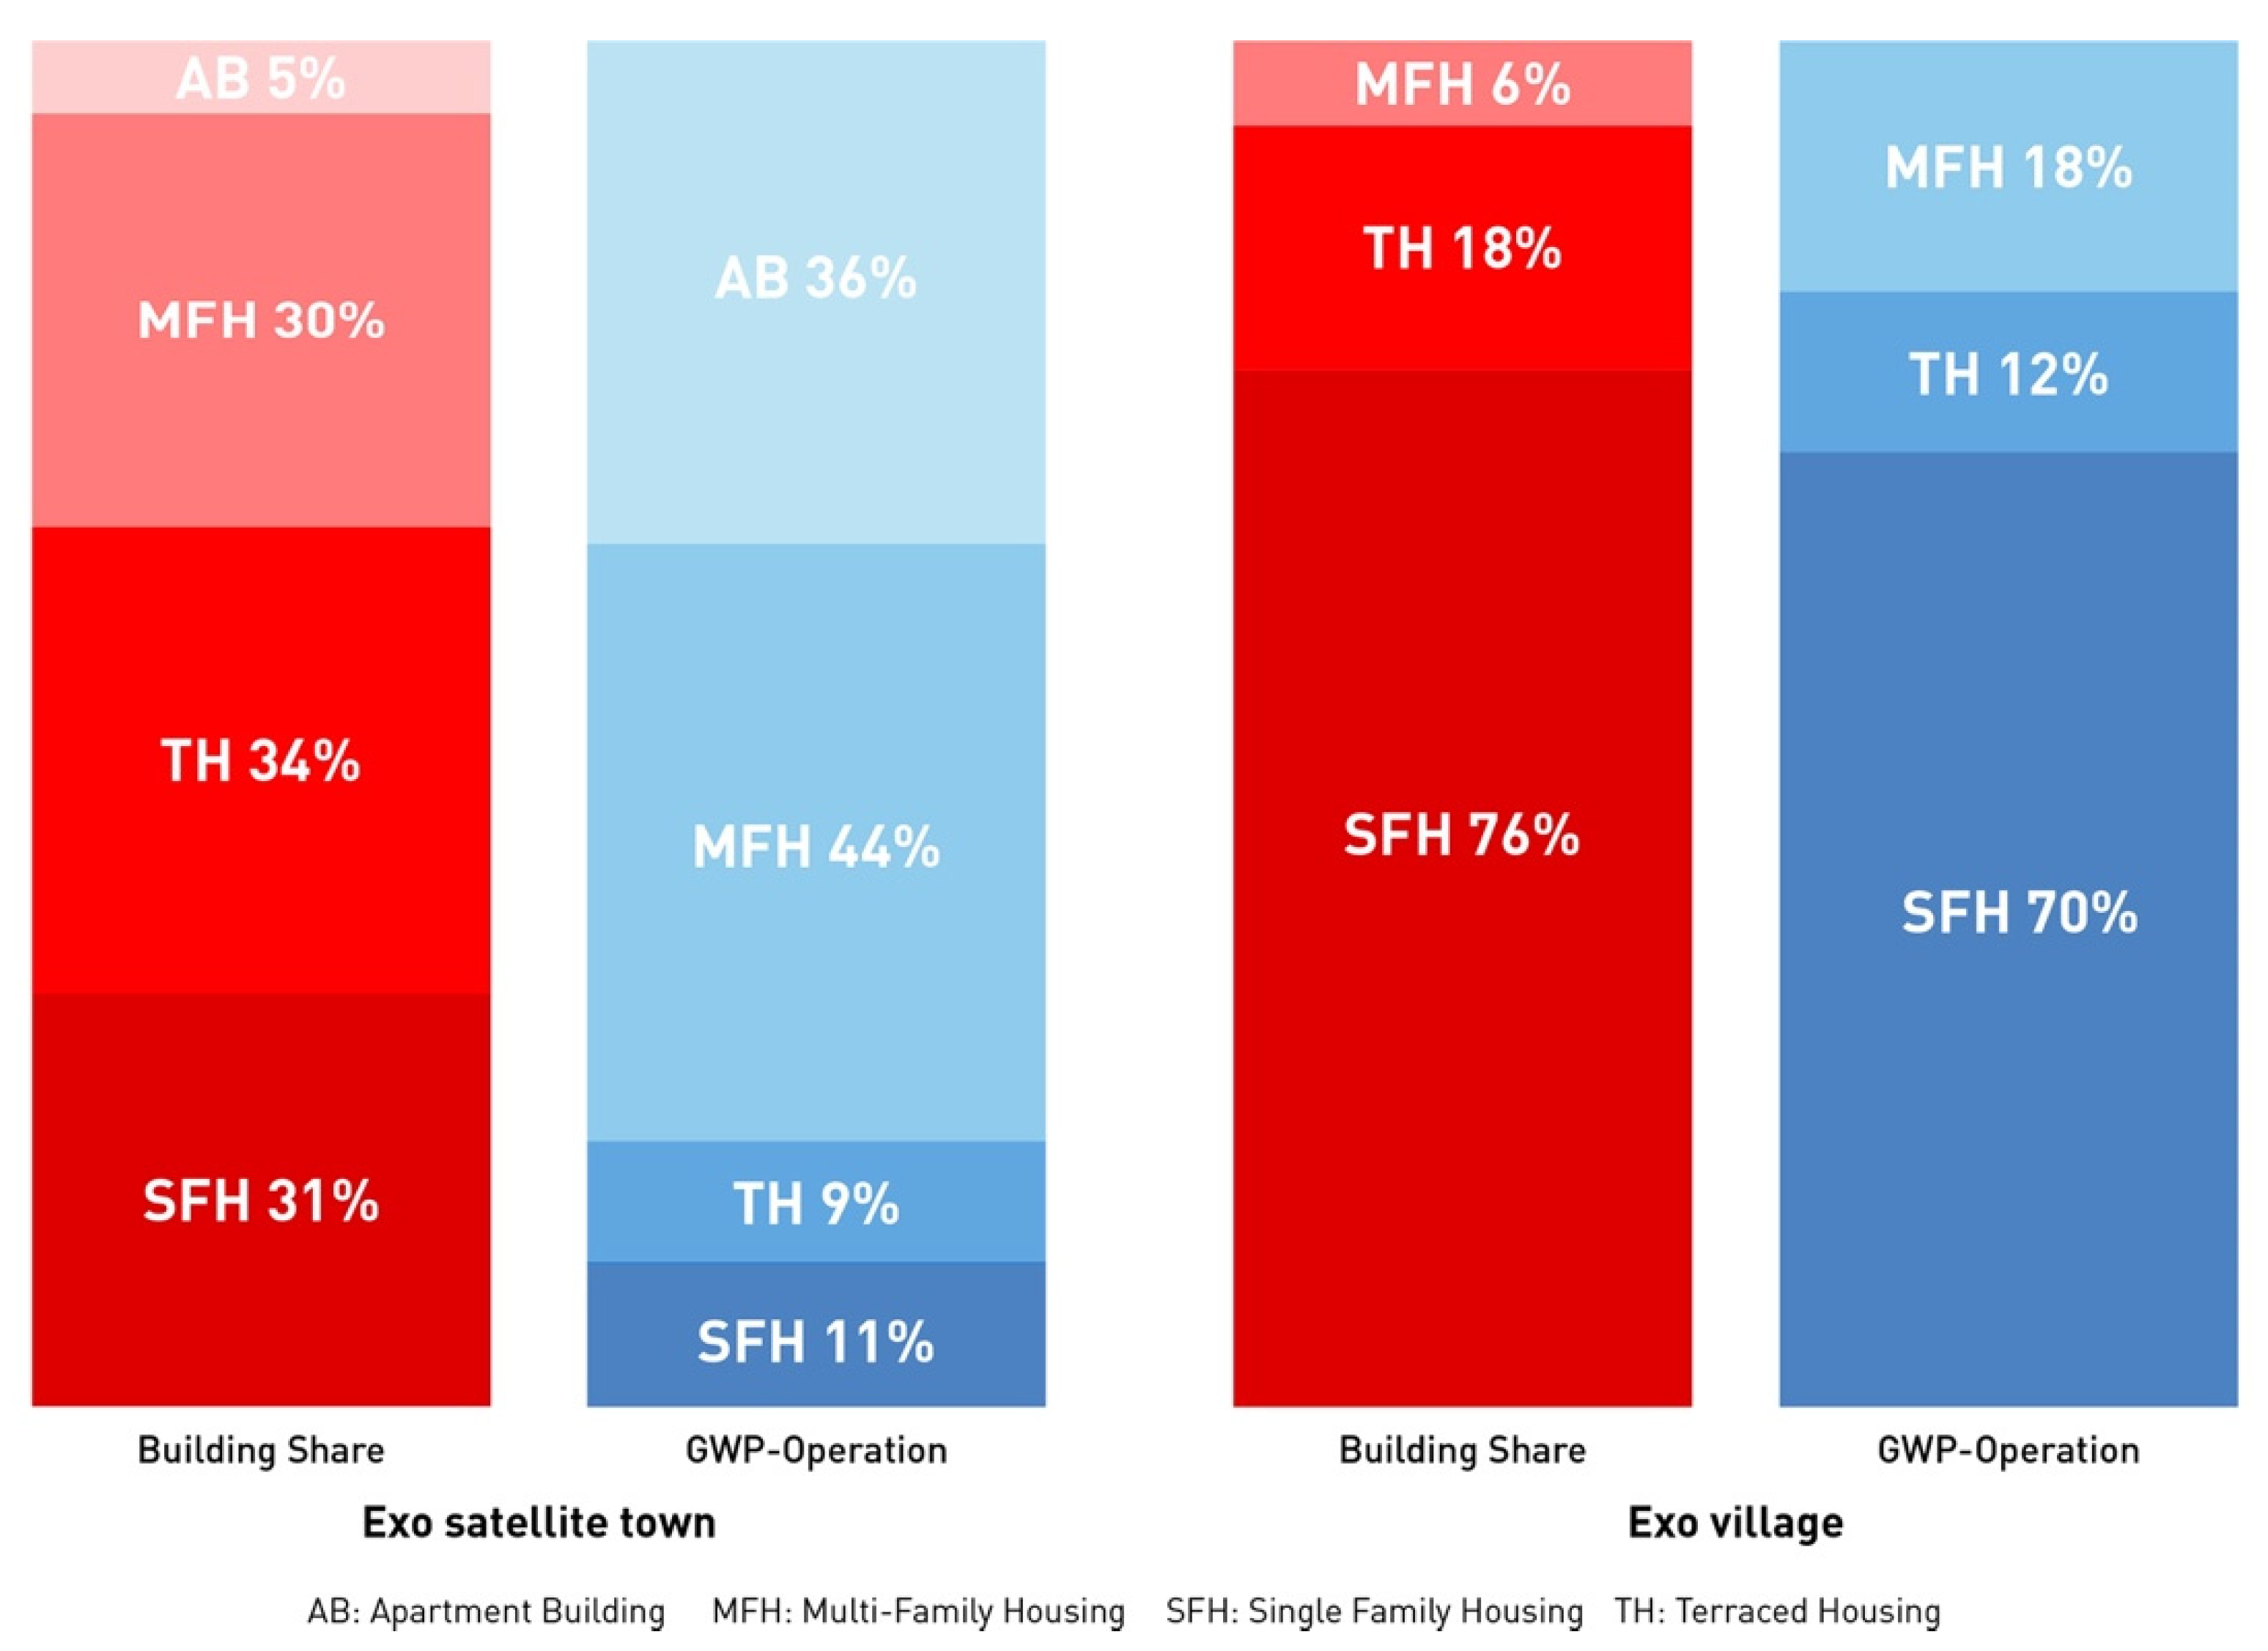
| Building Types | Description |
|---|---|
| Single-Family Houses (SFHs) | detached, 1–2 apartments |
| Terraced Houses (THs) | semi-detached or terraced, 1–2 apartments |
| Multi-Family Houses (MFHs) | 3–12 apartments |
| Apartment Blocks (ABs) | 13 or more apartments |
| Construction Year Classes A–F | Construction Year Classes G–L | ||
|---|---|---|---|
| A | before 1859 | G | 1979–1983 |
| B | 1860–1918 | H | 1984–1994 |
| C | 1919–1948 | I | 1995–2001 |
| D | 1949–1957 | J | 2002–2009 |
| E | 1958–1968 | K | 2010–2015 |
| F | 1969–1978 | L | after 2016 |
| INDICATOR | Min. | Max. |
|---|---|---|
| Population Density (PD) PD is the number of inhabitants per hectare. The sum of the total population per 1 ha cell within one settlement unit is divided by the area (A) of the settlement unit. | 0.00 inhabitants/ha | 83.32 inhabitants /ha |
| Residential Building Density (RBD) RBD is the number of buildings in the areas defined residential [54] in each settlement unit divided by the TOPOI area A (ha). | 0.00404 buildings/ha | 0.12021 buildings/ha |
| Residential land-uptake (RLU) RLU is the total area of residential land-uptake. A residential area is a structurally shaped area including the associated open space, which is used exclusively or predominantly for residential purposes [18,54]. RLU results from the count of erected residential buildings [32] multiplied by the average “residential building and open space area” per building (909 m2) in Lower Saxony [55]. | 0.186 ha | 599.860 ha |
| Construction Year Classes | Evaluation Classification | |
|---|---|---|
| A | before 1859 | Pre WWII buildings |
| B | 1860–1918 | |
| C | 1919–1948 | |
| D | 1949–1957 | Post WWII buildings |
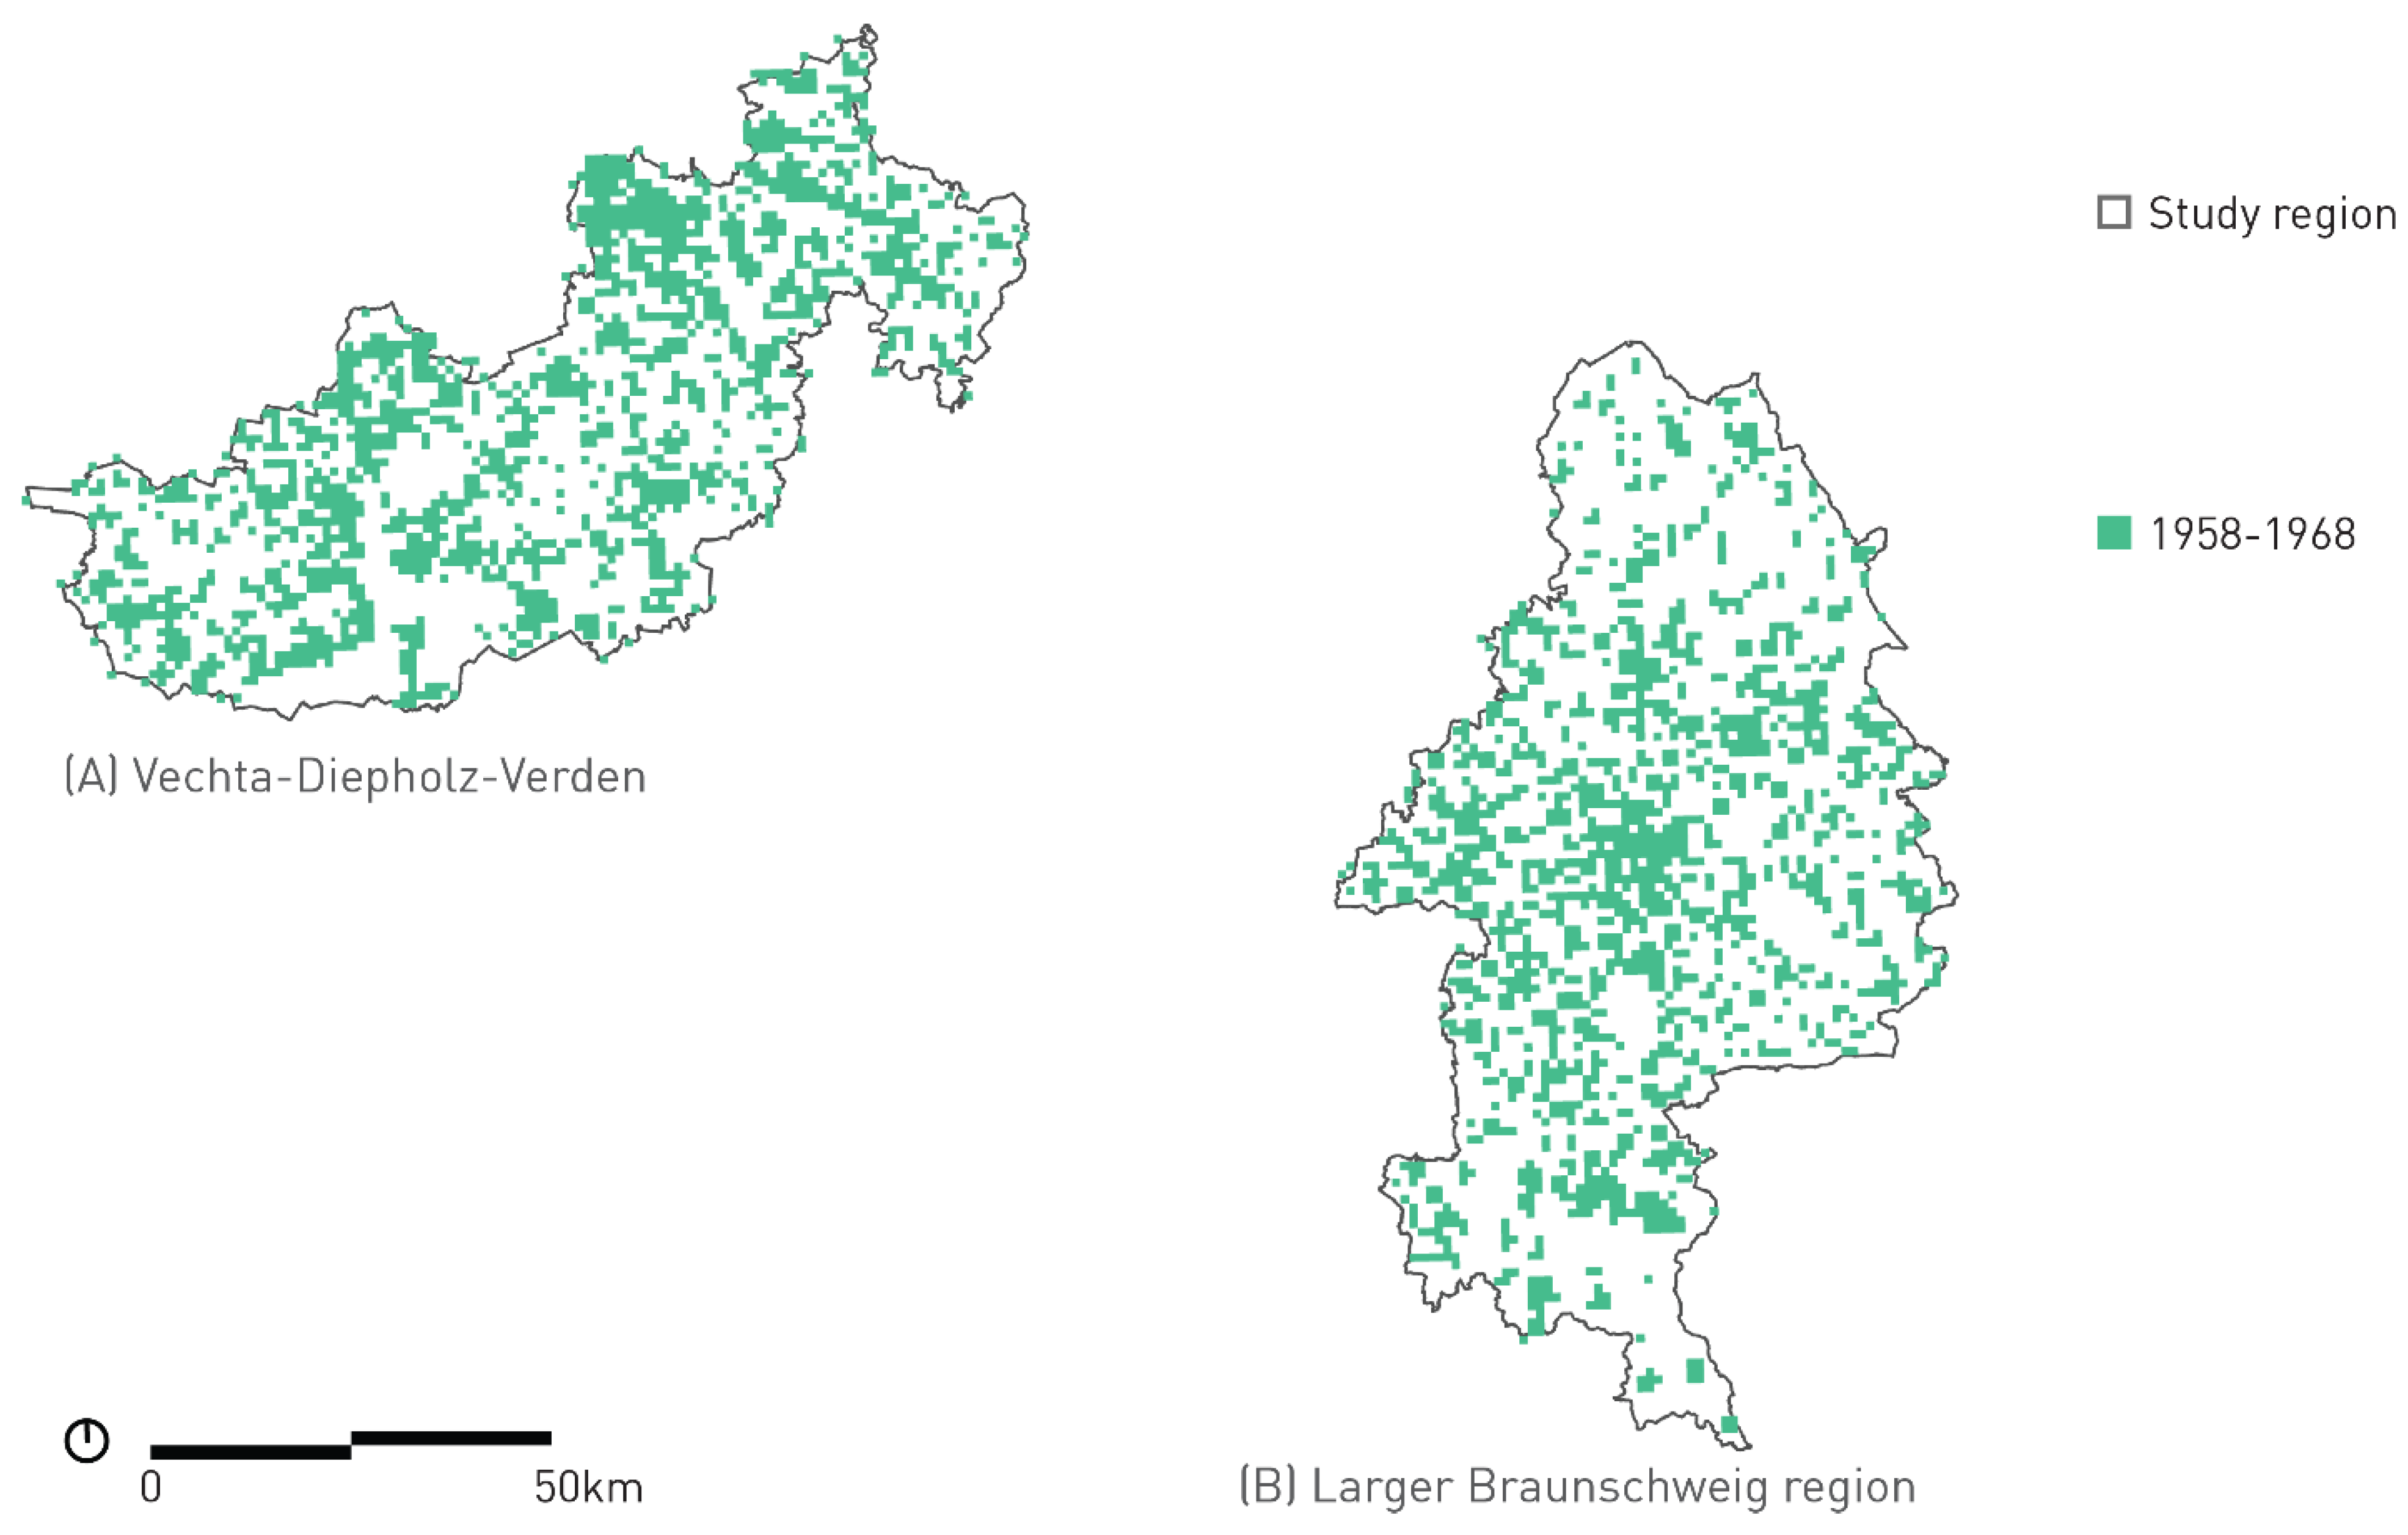
| E | 1958–1968 | |
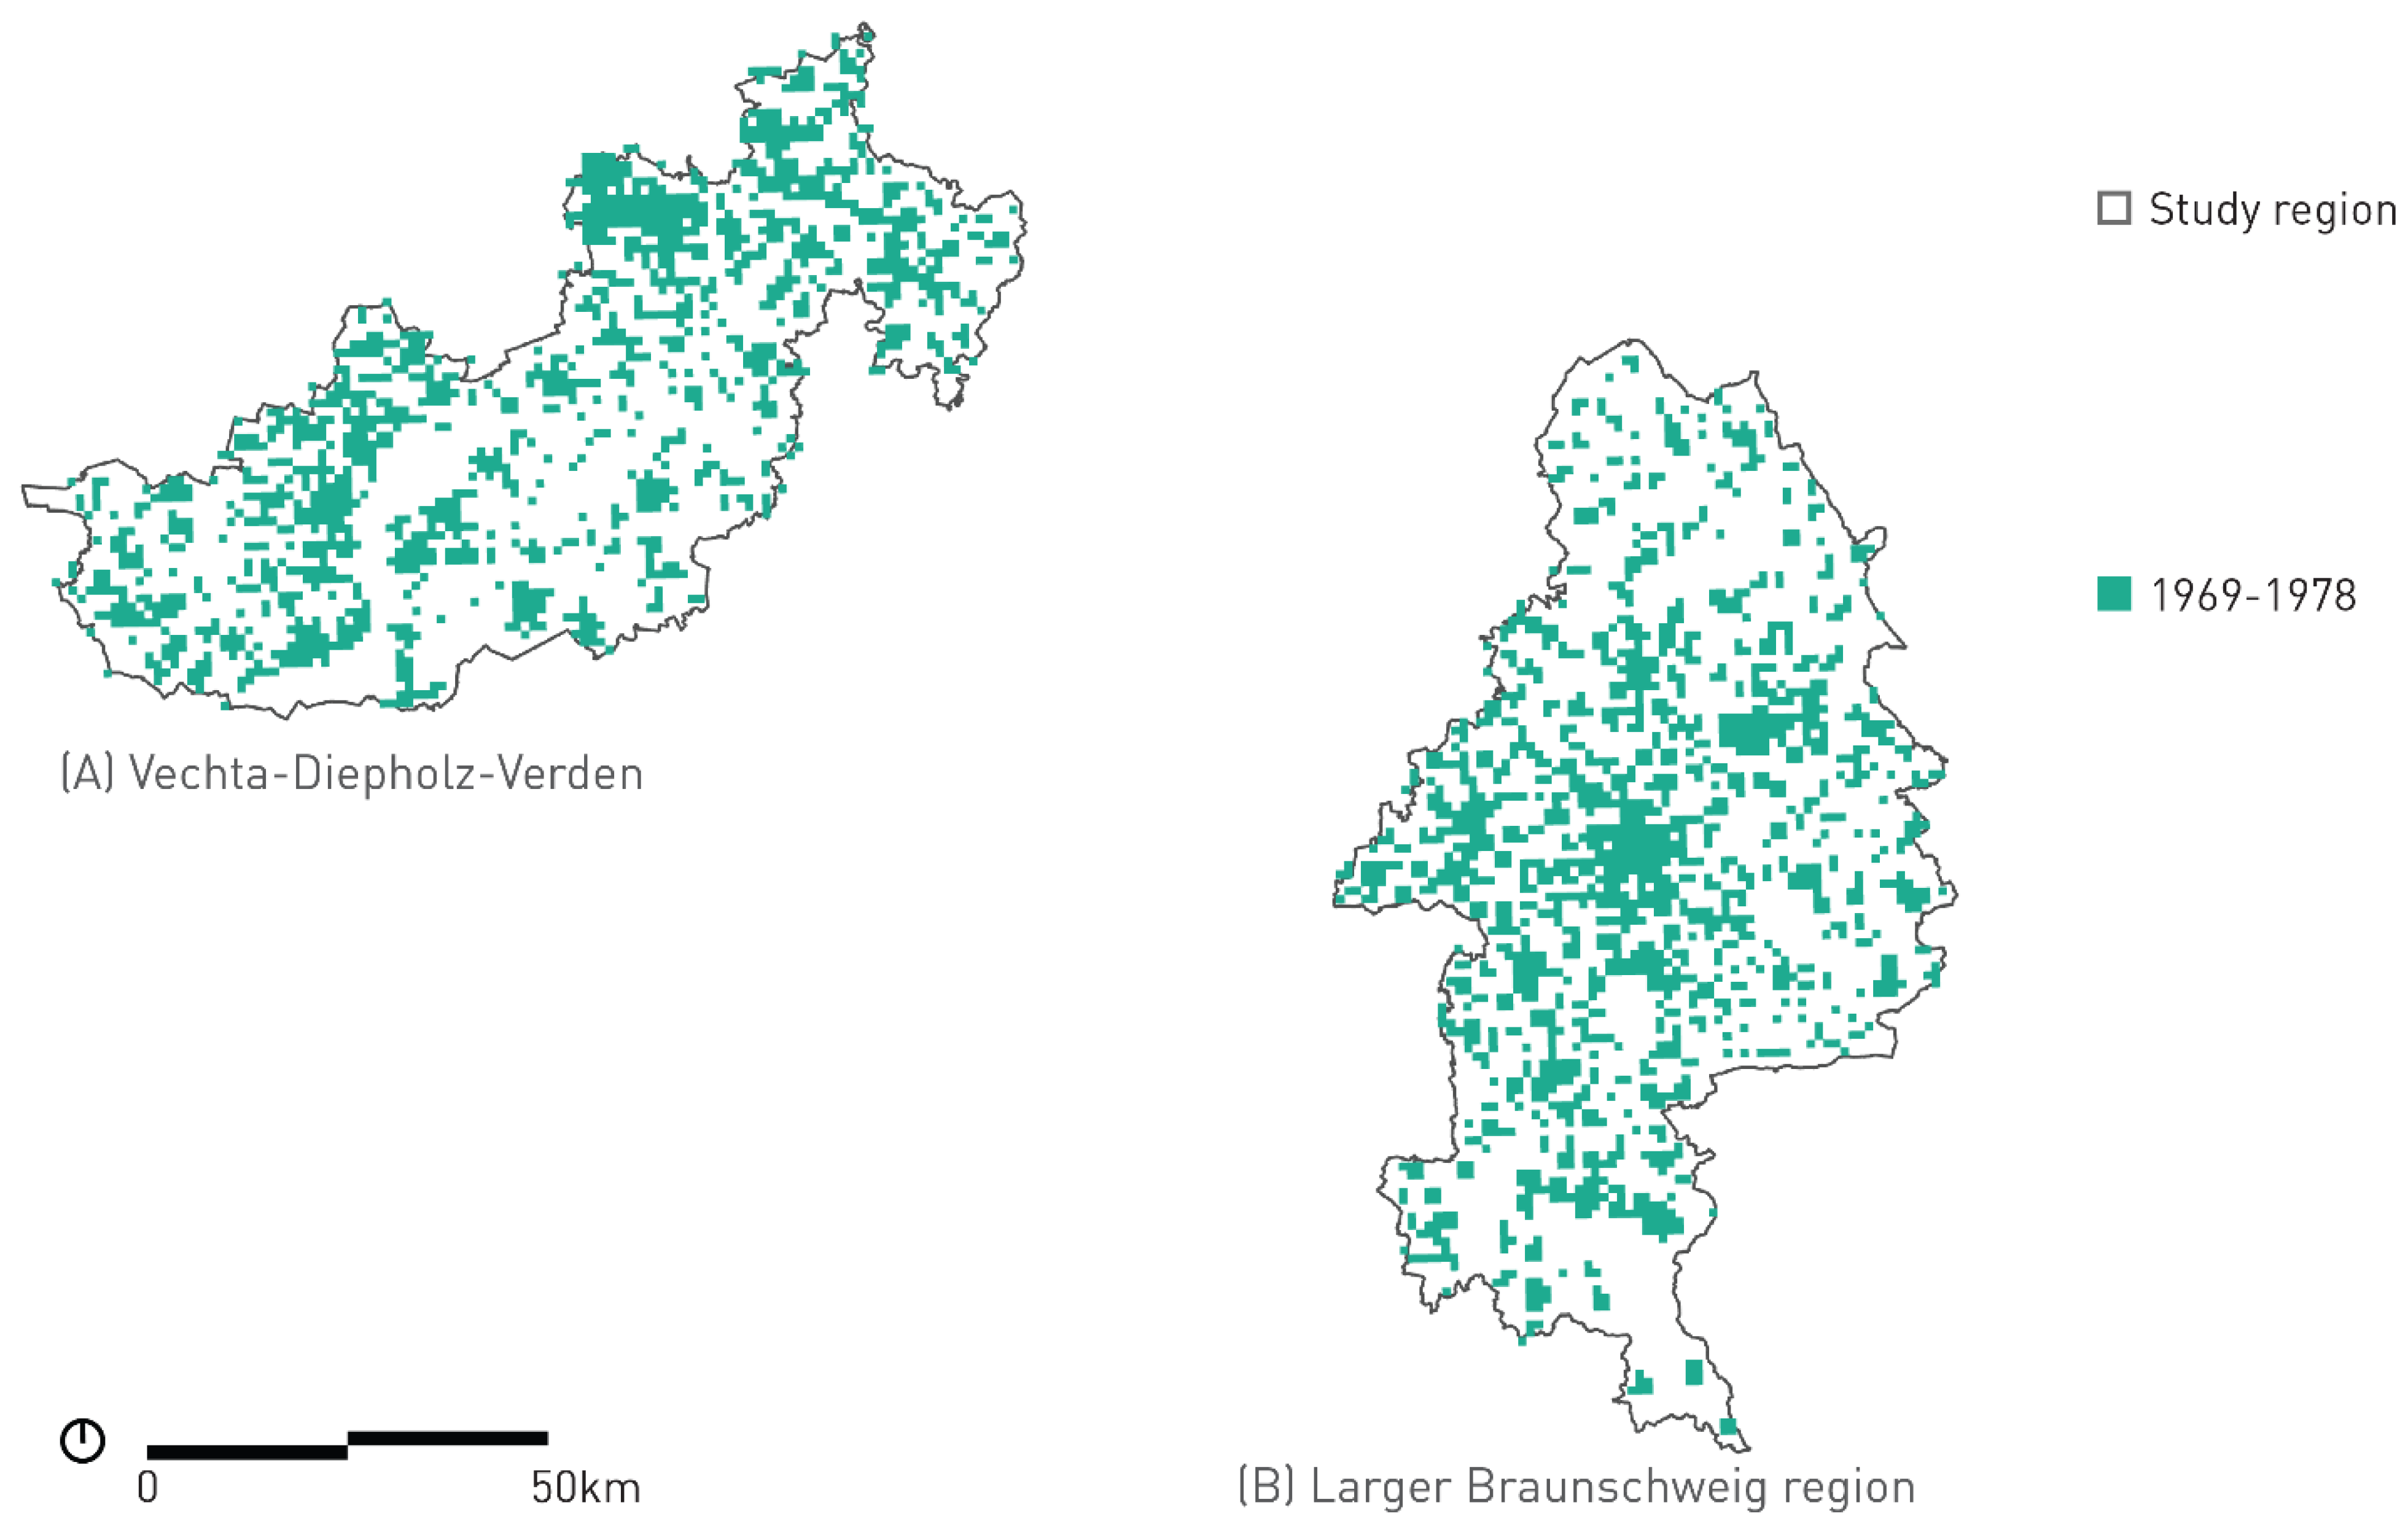
| F | 1969–1978 | |
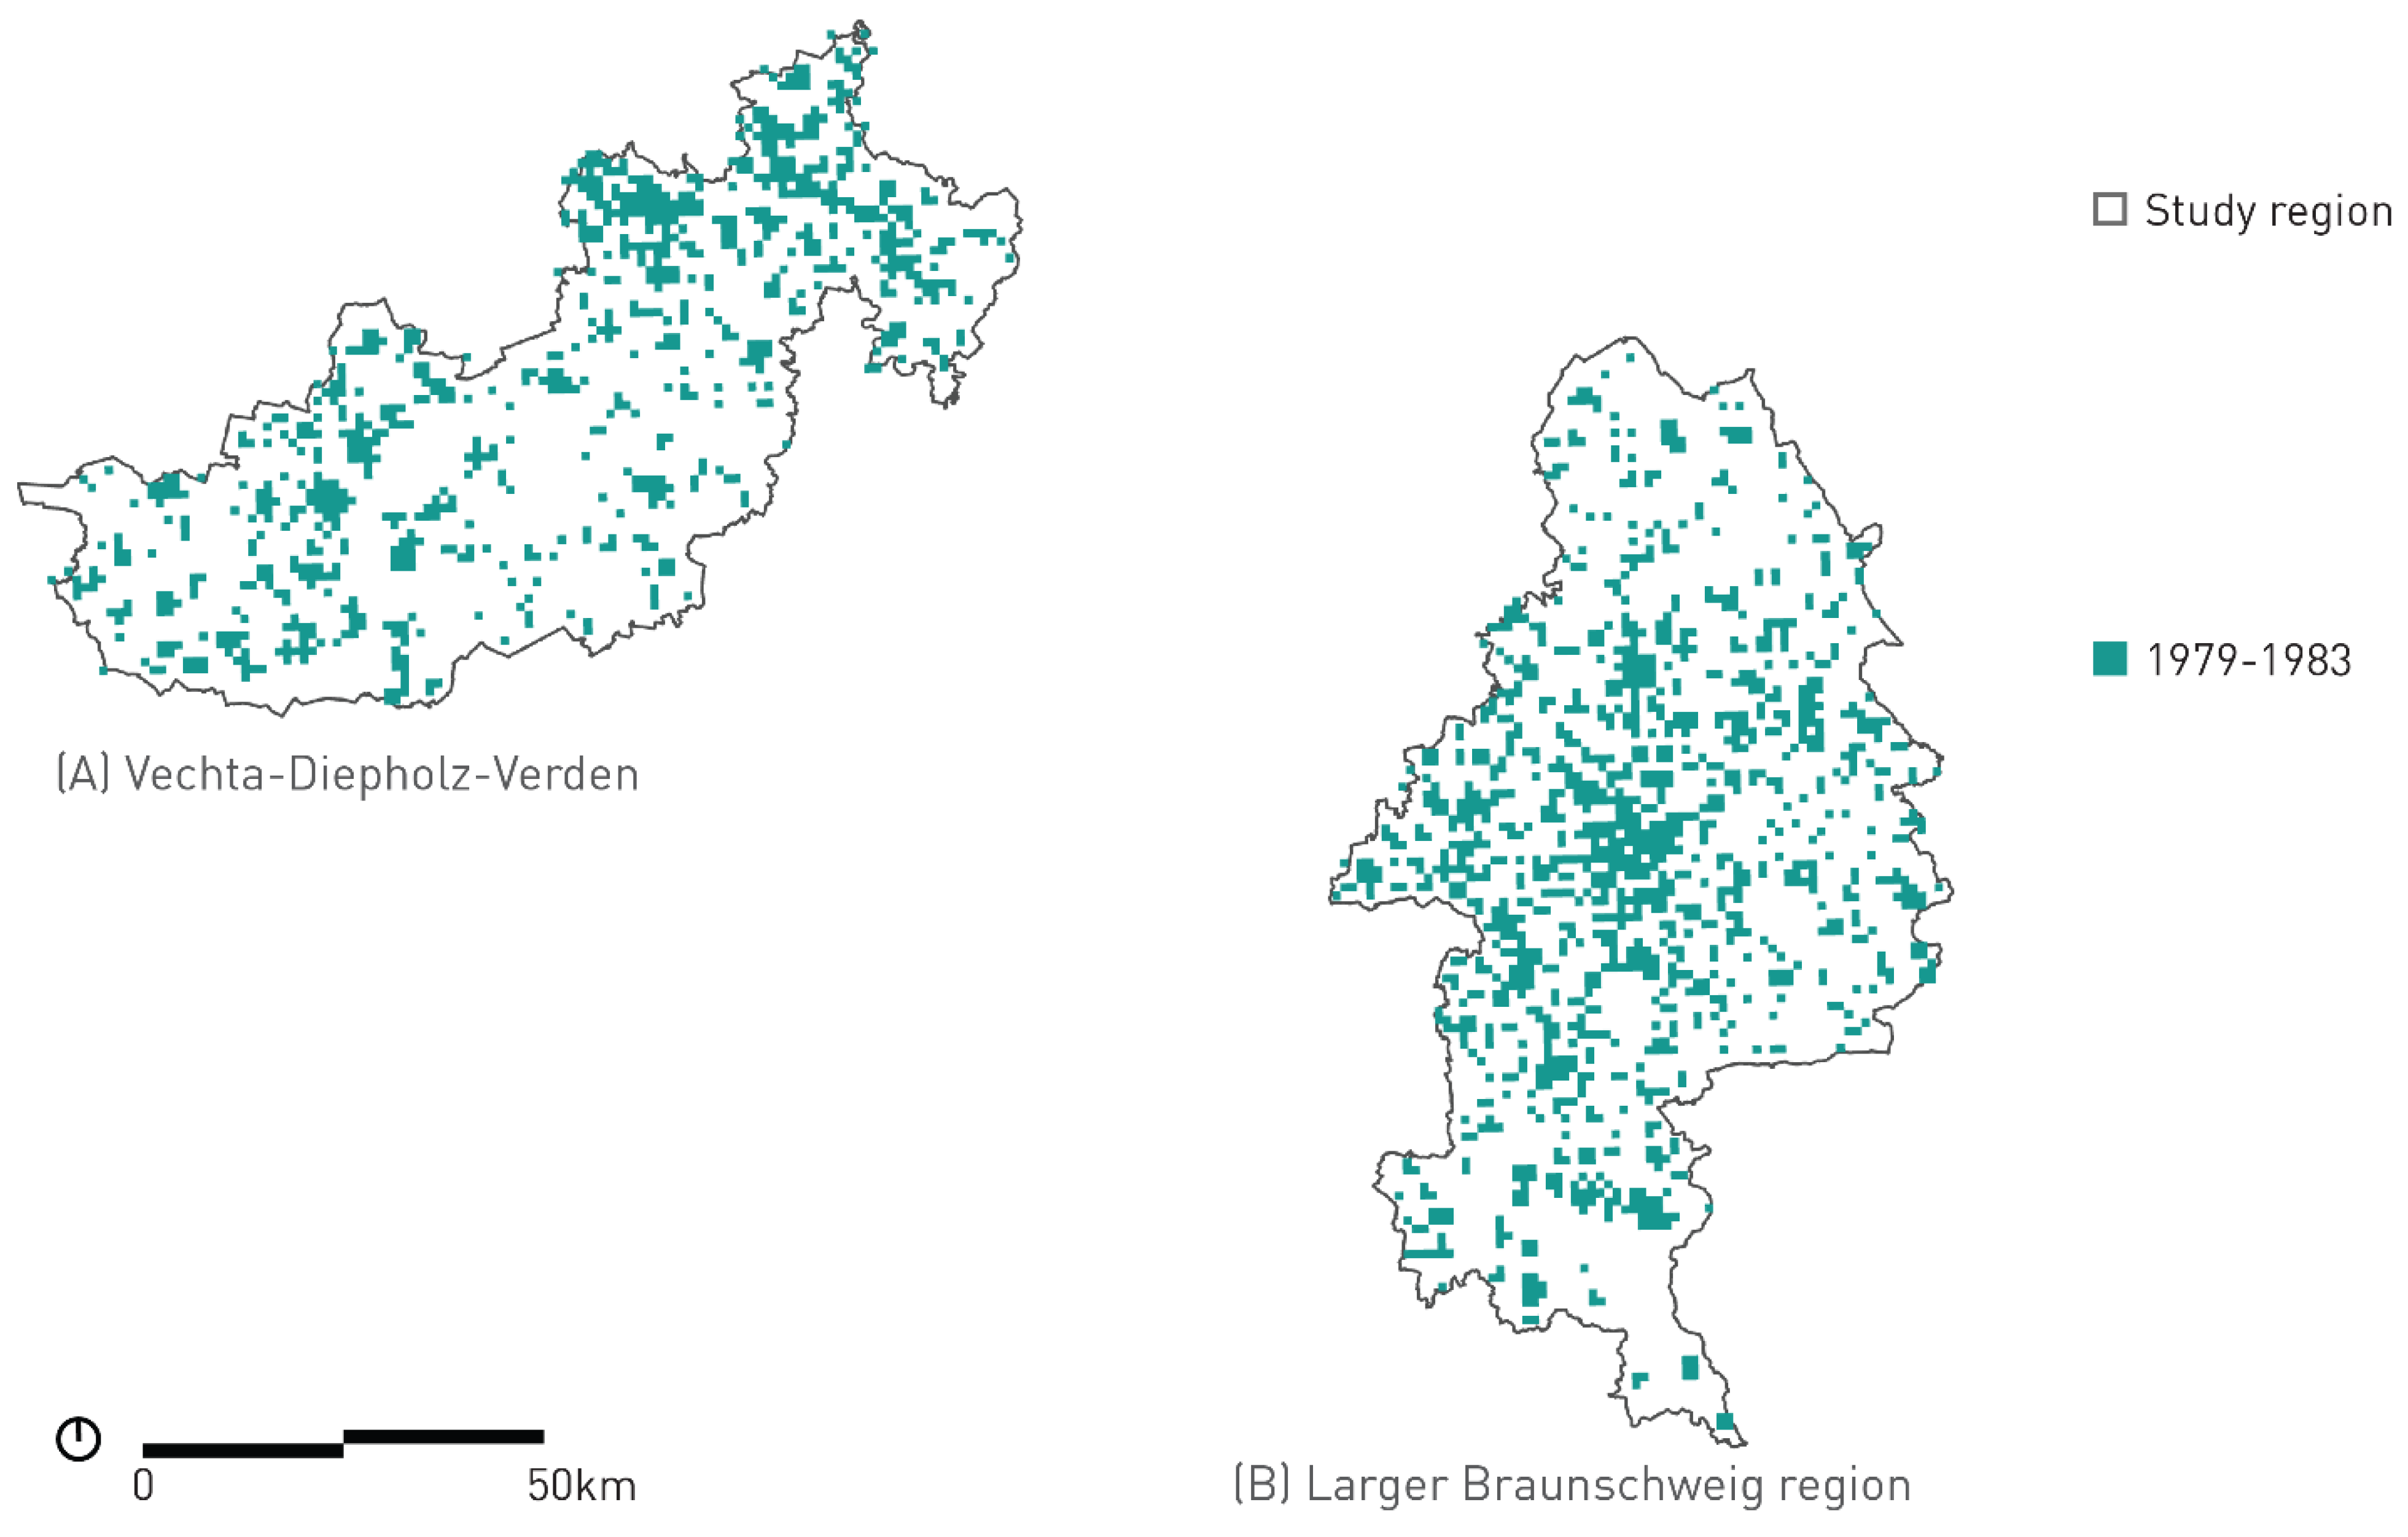
| G | 1979–1983 | 1st WSVO 1977 and 2nd WSVO 1984 (thermal insulation ordinance) |
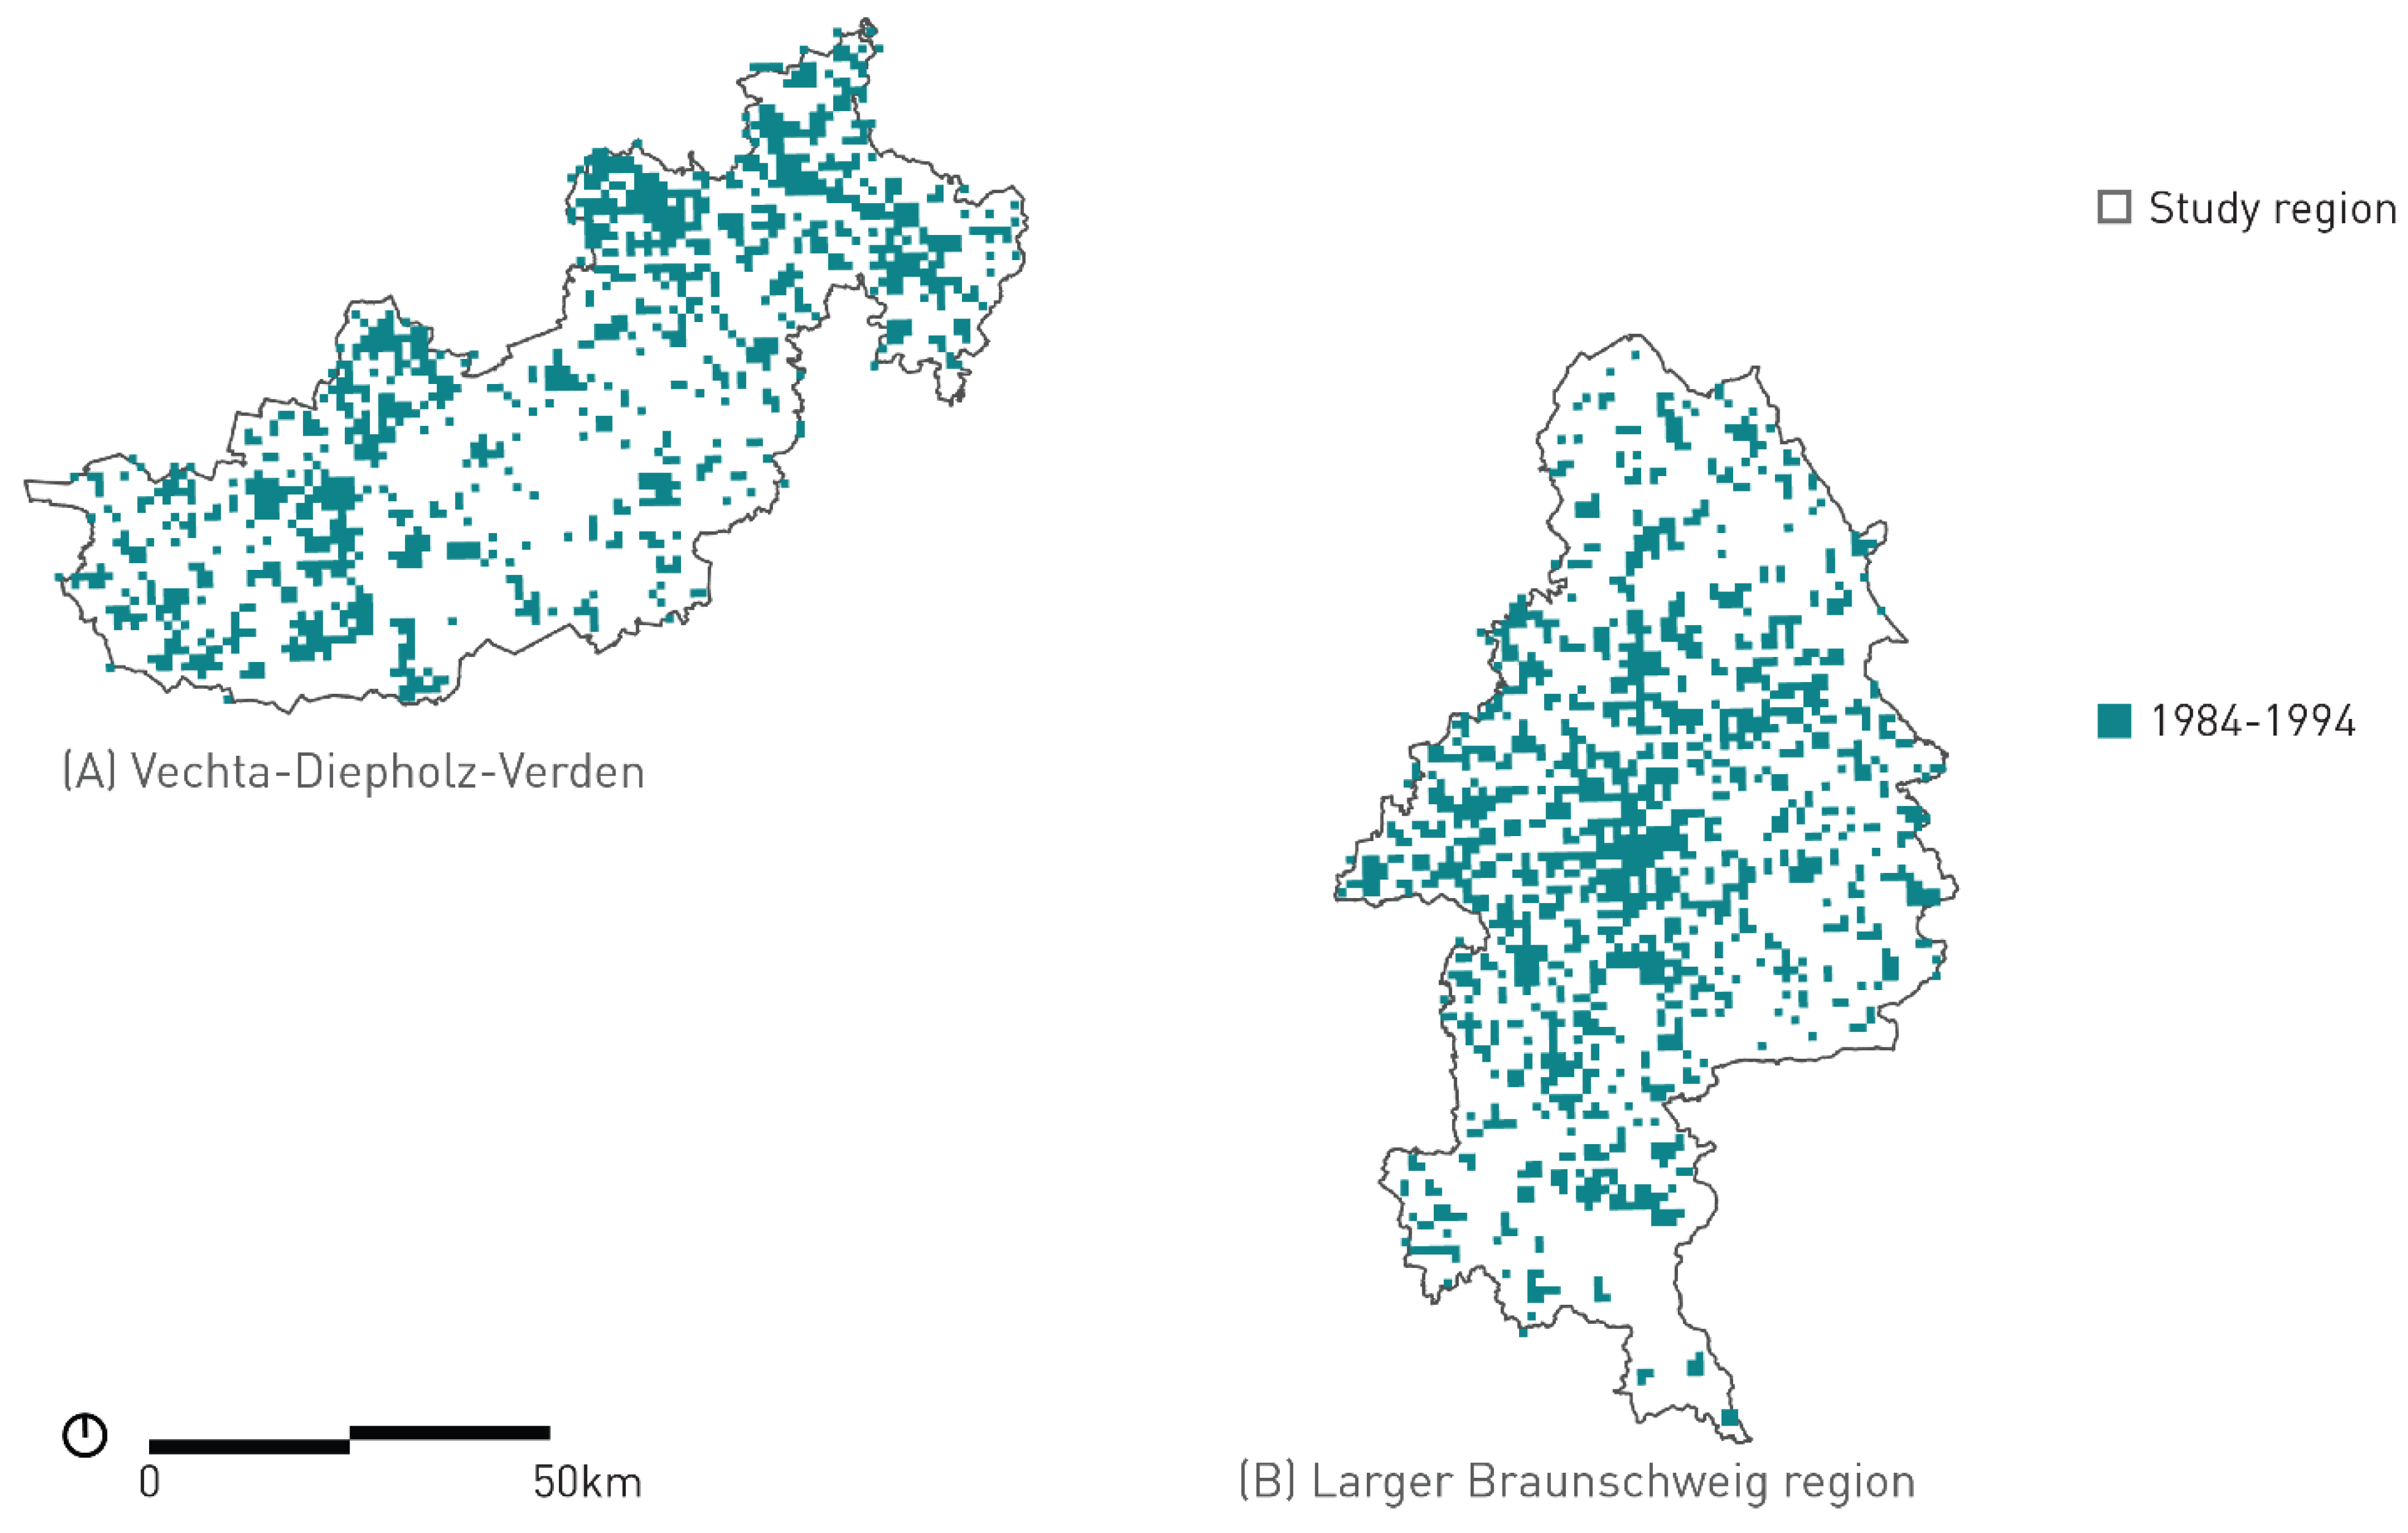
| H | 1984–1994 | |
| I | 1995–2001 | 3rd WSVO 1995 (thermal insulation ordinance) |
| J | 2002–2009 | EnEV 2002, 2004, 2007, 2009 (energy saving ordinance) |
| K | 2010–2011 | |
Publisher’s Note: MDPI stays neutral with regard to jurisdictional claims in published maps and institutional affiliations. |
© 2021 by the authors. Licensee MDPI, Basel, Switzerland. This article is an open access article distributed under the terms and conditions of the Creative Commons Attribution (CC BY) license (https://creativecommons.org/licenses/by/4.0/).
Share and Cite
Mühlbach, A.-K.; Mumm, O.; Zeringue, R.; Redbergs, O.; Endres, E.; Carlow, V.M. TOPOI RESOURCES: Quantification and Assessment of Global Warming Potential and Land-Uptake of Residential Buildings in Settlement Types along the Urban–Rural Gradient—Opportunities for Sustainable Development. Sustainability 2021, 13, 4099. https://doi.org/10.3390/su13084099
Mühlbach A-K, Mumm O, Zeringue R, Redbergs O, Endres E, Carlow VM. TOPOI RESOURCES: Quantification and Assessment of Global Warming Potential and Land-Uptake of Residential Buildings in Settlement Types along the Urban–Rural Gradient—Opportunities for Sustainable Development. Sustainability. 2021; 13(8):4099. https://doi.org/10.3390/su13084099
Chicago/Turabian StyleMühlbach, Ann-Kristin, Olaf Mumm, Ryan Zeringue, Oskars Redbergs, Elisabeth Endres, and Vanessa Miriam Carlow. 2021. "TOPOI RESOURCES: Quantification and Assessment of Global Warming Potential and Land-Uptake of Residential Buildings in Settlement Types along the Urban–Rural Gradient—Opportunities for Sustainable Development" Sustainability 13, no. 8: 4099. https://doi.org/10.3390/su13084099
APA StyleMühlbach, A.-K., Mumm, O., Zeringue, R., Redbergs, O., Endres, E., & Carlow, V. M. (2021). TOPOI RESOURCES: Quantification and Assessment of Global Warming Potential and Land-Uptake of Residential Buildings in Settlement Types along the Urban–Rural Gradient—Opportunities for Sustainable Development. Sustainability, 13(8), 4099. https://doi.org/10.3390/su13084099


