Article

Research on Indoor Thermal Comfort and Age of Air in Qilou Street Shop under Mechanical Ventilation Scheme: A Case Study of Nanning Traditional Block in Southern China

1
College of Civil Engineering and Architecture, Guangxi University, Nanning 530004, China
2
Guangxi Key Laboratory of Disaster Prevention and Engineering Safety, Guangxi University, Nanning 530004, China
*
Author to whom correspondence should be addressed.
Sustainability 2021, 13(7), 4037; https://doi.org/10.3390/su13074037
Submission received: 10 January 2021 / Revised: 25 March 2021 / Accepted: 2 April 2021 / Published: 5 April 2021
(This article belongs to the Special Issue Architecture and Indoor Environmental Quality)

Abstract

:
In hot summers, air conditioning (AC) and mechanical ventilation (such as fans) are used as cooling modes that strongly influence the resultant indoor environment, like thermal comfort and air quality in the shops of a Nanning arcade street (qilou). The air circulation mode in shops greatly affects the indoor thermal environment and level of air freshness. The approaches for effectively improving the indoor thermal comfort and air quality are developed in qilou street shops with air-conditioner in a humid and hot region in southern China. Consequently, the purpose of this study is to assess different ventilation schemes in order to identify the best one. By using two indices, i.e., the predicted mean vote (PMV) and the age of air (AoA), in situ measurement and numerical simulation are conducted to investigate humans’ thermal comfort in extreme summer. Then, the indoor thermal comfort and AoA levels in summer under three different ventilation schemes (upper-inlet–upper-outlet, upper-inlet–bottom-outlet, and side-inlet–side-outlet) are comparatively analyzed through numerical computations of the indoor thermal environment. The results show that the upper-inlet–upper-outlet mode of the AC ventilation scheme led to the creation of a favorable air quality and comfortable thermal environment inside the shop, which will help designers understand the influence of the ventilation scheme on the indoor thermal comfort and health environment.

1. Introduction

With the acceleration of urbanization in southern China in recent years, due to the high building density of the traditional urban blocks in the humid and hot areas, the urban heat island (UHI) effect is aggravated, which leads to the deterioration of the micro-climate in the urban blocks. On the other hand, high building density restricts the potential of natural ventilation in summer and increases the difficulty of thermal comfort and indoor air quality (IAQ) improvement in the blocks. Commercial buildings in these blocks provide consumption and recreational spaces that play a significant role in humans’ daily business activities. Their indoor thermal comfort directly affects their business and urban tourism [1]. Both thermal comfort and IAQ are beneficial to human health [2], since people spend almost 90% of their time indoors at present [3]. A thermal discomfort or poor IAQ environment reduces the productivity of dwellers and even their wellbeing [4].
One kind of colonnade shopping street (called qilou, see Figure 1a) gradually emerged in southern China as an adaptive response to the local humid and hot climate. At the end of the 19th century, many qilou shopping streets were built in Guangzhou, Wuzhou, Haikou, Nanning, and other Lingnan regions, all of which boasted flourishing trade and rapid economic development. Some negative effects are that micro-climates in qilou streets have higher air temperature and lower air velocity than their surroundings [5], which is referred to as the heat island effect [6]. The qilou streets and their pavements trap a lot of solar energy daily and emit it at night. Hence, this increases the requirement for air conditioning in qilou street shops to guarantee customers’ thermal comfort [7]. Though designed mainly for commercial use, qilou buildings integrate both residential and commercial functions, with the front part serving as a shop space and the rear part as a residential space. The colonnades of qilou also provide an environment protecting visitors from sunlight, wind, and rain. The shop space is connected with the colonnade walkway (see Figure 1b) and is used for displaying goods and conducting business. The shop space is enclosed on three sides, and the doorway side is used for the introduction of natural lighting and ventilation (see Figure 1c). Consequently, based on the requirements of indoor thermal comfort and air quality, the optimization to the ventilation scheme of air conditioning in qilou street stores is still a problem to be solved.
Summer is the peak season for traveling and shopping; the flow of people in a commercial street, such as a qilou, is denser; people would like to stay in the store for a quite long time; and there are higher requirements for the indoor thermal comfort and IAQ of commercial buildings [8,9]. Therefore, in the study of urban blocks’ redesign, attention should be paid to their indoor thermal environment, and the research on the thermal environment of buildings is rising in recent years. At present, the investigation on the thermal environment of buildings focuses on urban planning, residential planning, campus planning, and monomer building design. However, most of them are related research results in residential areas, schools, urban squares, outdoor thermal environment, and energy-saving, which are less involved in dealing with the thermal comfort level and IAQ inside traditional street stores [10,11].
The existing research on qilou streets has mainly focused on the perspective of historical preservation [12,13,14]. Few studies have been reported on the thermal environment of qilou street shops. With increasing attention paid to the thermal environment of urban shopping streets, thermal adaptation and thermal comfort models considering local urban climate factors and street morphology have become a research hotspot [15,16,17]. For example, Ruiz et al. [18] evaluated a model for the thermal environment of arid-climate cities and predicted urban thermal comfort in these cities. The thermal comfort of pedestrian streets in severe cold areas of China has received the attention of researchers, who investigated the major parameters influencing thermal comfort in different seasons and an optimization strategy [19]. They found that the mean radiant temperature (MRT) had the greatest influence on thermal comfort during the summer and winter, whereas the thermal resistance of clothing had the greatest influence on the thermal comfort of people during the transition seasons, i.e., spring and fall. Understanding the human thermal sensation in commercial buildings requires a field survey of the thermal environment in large commercial building complexes. Li et al. [20] conducted a field test and questionnaire survey of a large shopping complex in Guangzhou and found inconsistencies between the predicted and actual thermal sensations. Based on this, they established an adaptive model for describing the variations in interior thermo-neutral temperature with the exterior air temperature in winter. Chen [21] investigated the variation in thermal sensation with temperature in different areas of the same shopping complex using a similar method and obtained thermal adaptation models for four types of functional areas. Dang et al. [22] conducted a test and subjective evaluation of the indoor thermal environment of a large commercial complex in Beijing during winter, established an equation for an adaptive predicted mean vote (PMV) correction, and proposed a mathematical model for assessing the winter thermal environment of large shopping malls.
Based on the direct influence of ventilation scheme on thermal comfort and air quality and the unique airflow distribution of hotel lobbies, Zhang [23] numerically simulated the summer thermal environment of a hotel lobby using a computational fluid dynamics (CFD) method, comparatively analyzed the indoor thermal comfort levels under different air circulation modes, and explored the optimal air circulation solution. To develop approaches for improving the air quality of shopping malls, Huang et al. [24] measured the air quality and thermal parameters of a shopping mall in Ma’anshan through a field survey as well as the subjective assessment of the indoor air quality by the shopping assistants and customers through a questionnaire survey. They found that users were quite unsatisfied with the air quality. Compared with commercial complexes, street shops in traditional blocks have a different thermal environment owing to the unique street layout. Their thermal comfort is also worthy of attention. For the purpose of evaluating human thermal sensation precisely, Henderson et al. [25] suggested replacing the constant-temperature control strategy with a constant-comfort adjusting strategy in the control of air conditioning systems to maintain constant comfort instead of constant temperature. Under most circumstances, the constant-comfort based adjusting strategy also improves the indoor thermal comfort level at reduced energy consumption of the AC systems.
A salient characteristic of an urban climate is micro-climate differentiation. Different urban zones have diverse micro-climate environments owing to the influence of many factors, such as building layout, vegetation, water body, and spatial characteristics. Qilou street shops have markedly different building spaces than other street shops due to the unique colonnade walkway space. Namely, the urban features of qilou streets have enormous effects on their local thermal environment. Therefore, the research findings on the thermal environment mentioned above cannot be directly extended to qilou shopping streets. The reasons for this are as follows.
(1)
The existing research mostly focuses on ordinary shopping malls and large commercial complexes by measuring and qualitatively assessing their thermal environments. For traditional shopping streets in particular climates (such as humid and hot ones), the indoor thermal environment is greatly affected by the outdoor block layout and diverse human activities. Hence, the existing research findings are not sufficiently applicable to qilou shopping streets in humid and hot climates.
(2)
The two widely applied thermal comfort models, the PMV model proposed by Fanger [26] and the adaptive model presented by de Dear [27], do not take indoor air cleanliness into account. The IAQ, however, is also a research topic of significant and growing interest [28]. In order to improve the IAQ of school classrooms in the subtropical region, Liu et al. [29] analyzed the area ratio of AoA in the classroom plane to determine the optimal window orientation. For providing useful information for comprehending the situation of air quality in sensitive indoor and outdoor areas, Lucialli et al. [30] performed a test to investigate the indoor and outdoor concentrations of benzene, toluene, ethylbenzene, and xylene in eight schools. The results are helpful to enhance environmental quality in school construction renovation programs. Since classrooms and shops have similarities in air quality requirements and crowd density, the study of IAQ in classrooms has enlightened the IAQ study in shops. For the purpose of investigating the main influencing factors of air quality in commercial settings, Zhang et al. [31] continuously monitored IAQ in two large-scale comprehensive commercial places in Beijing and found that IAQ in functional areas of the shopping mall was related to human activities, ventilation, air freshness, and so on. The outbreak of COVID-19, furthermore, has increased the awareness of the importance of IAQ. Maintaining air freshness through healthy ventilation is critical for improving the IAQ of shops.
However, most of these studies were performed on cold and humid or cold and dry types of climates, and there are very few studies on the hot and humid type of climatic conditions prevailing in southern China. There also has been a lack of research on the thermal environment and IAQ of traditional commercial buildings (like qilou street shops) in areas of severe summer. To fill this research gap, this study will investigate the indoor thermal environment of qilou street shops in Nanning (see Figure 2a,b). Considering that the airflow mode is a major factor influencing the thermal comfort and IAQ in mechanically ventilated qilou street shops, the thermal environment of these shops will be evaluated using two indices, PMV and AoA, which are the time of air particles required to reach a certain location in the airflow field [32]. The patterns influencing the ventilation scheme on the indoor thermal comfort and IAQ are analyzed, and approaches are proposed for effectively improving the thermal environment and IAQ of qilou street shops in hot and humid areas. This study aims to analyze the effects of mechanical ventilation scheme (air circulation modes for cooling) on thermal comfort and air quality in a qilou street shop with air conditioner. In Section 2, we introduce the parameters of micro-climate in qilou streets, including monthly average temperature, hourly dry bulb temperature, monthly relative humidity, and the summer wind environment in qilou street areas. The indices (PMV and AoA) to evaluate the thermal performance and air quality in a qilou street shop are established in Section 3, and the indoor thermal environment of a qilou street shop is measured and simulated in Section 4. Then, the analysis of numerical simulations is conducted to optimize the ventilation scheme by evaluation in terms of PMV and AoA in Section 5. Finally, the conclusions are provided in Section 6.

2. Micro-Climate Environment in Qilou Street Block

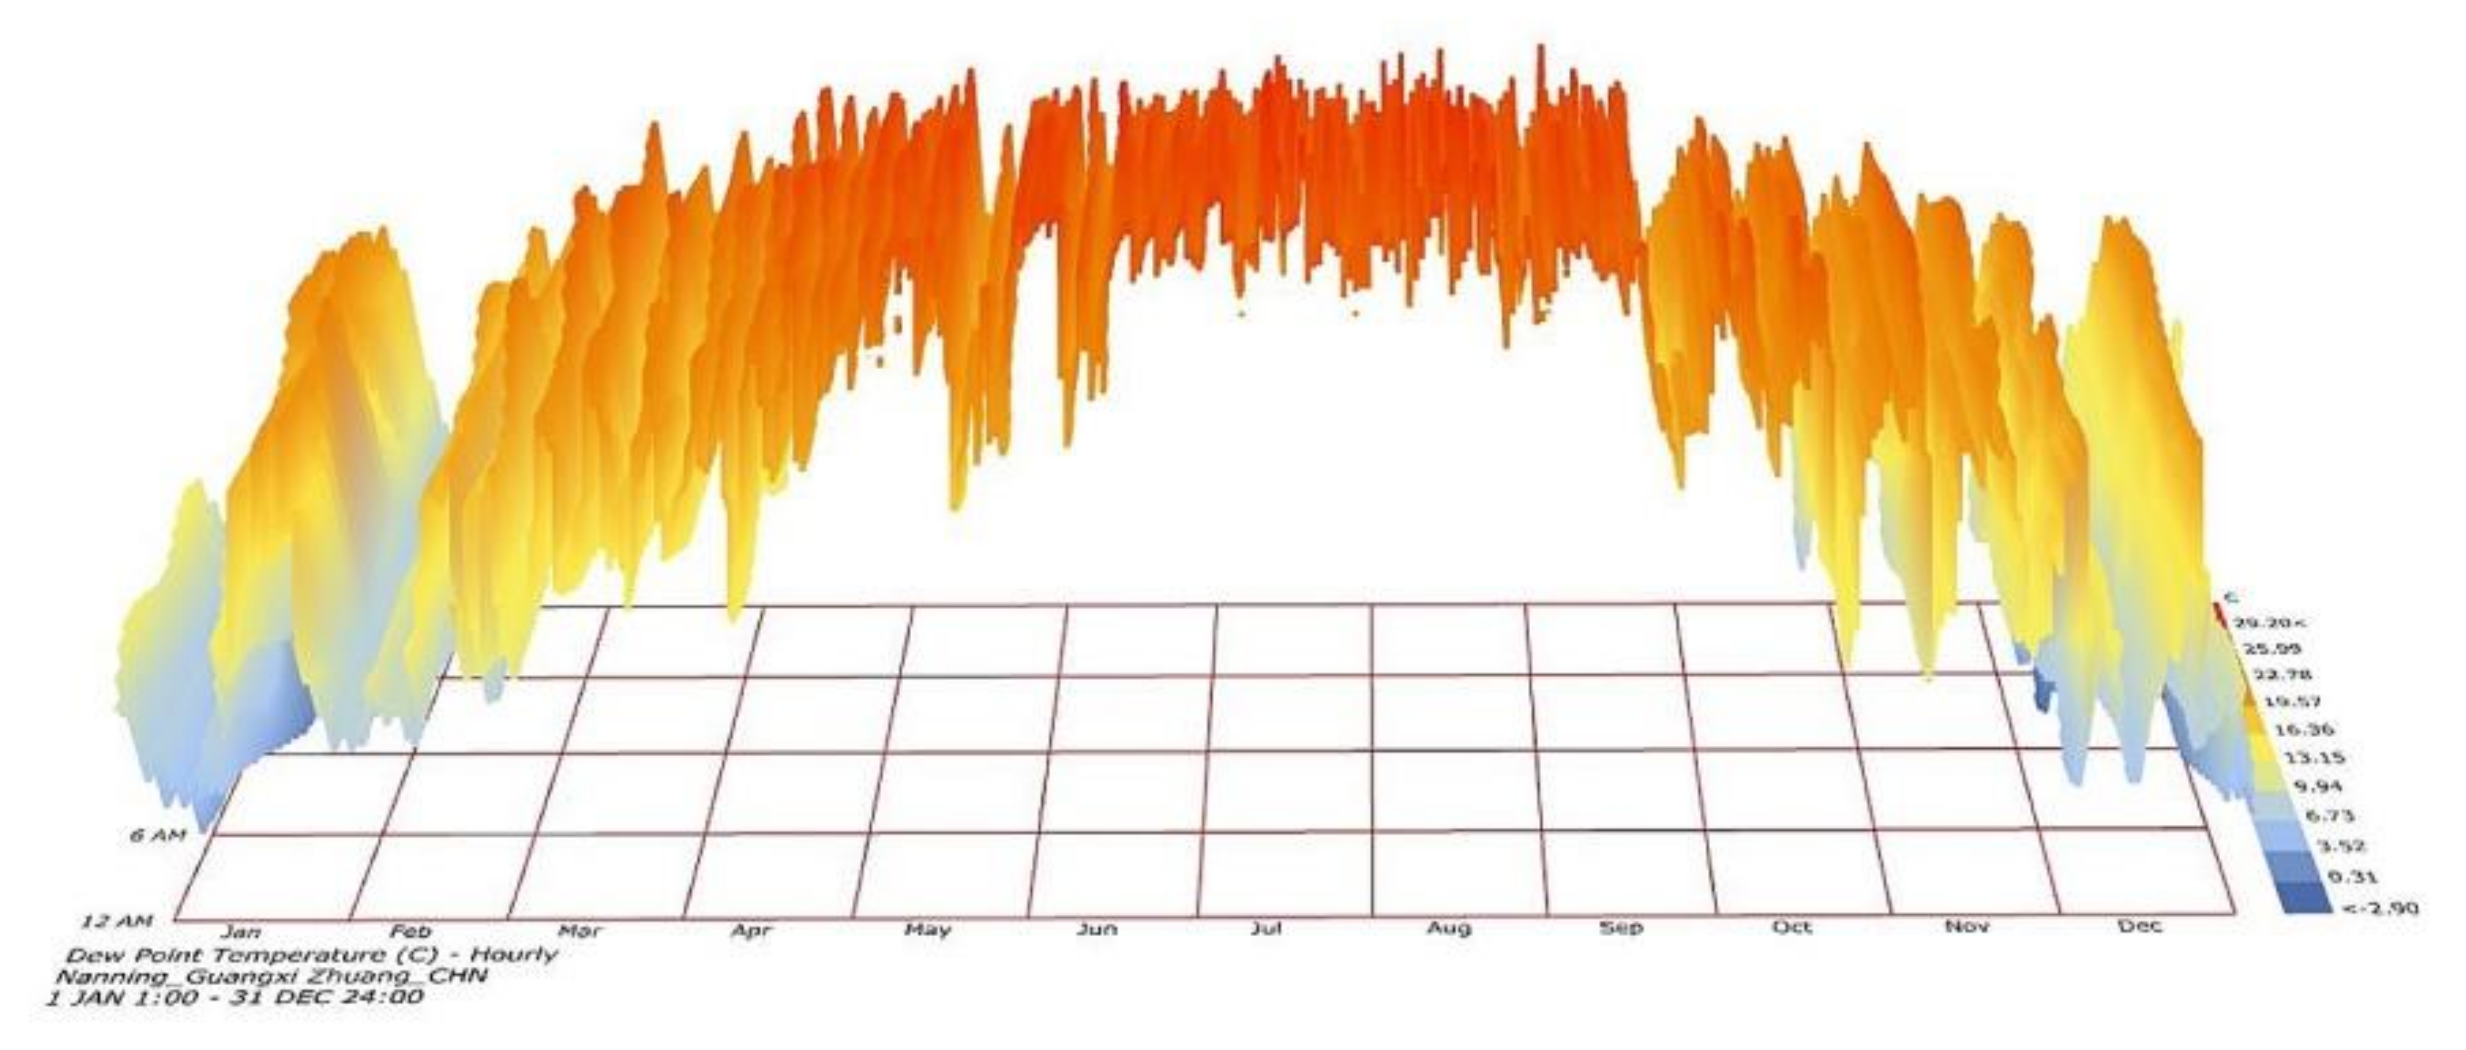
Nanning is located south of the Tropic of Cancer and has a wet subtropical monsoon climate. The annual highs of monthly average temperature (MAT) occur from June to September (see Figure 3) [33]. The MAT values in these four months are 28.1, 27.9, 28.1, and 27.3 °C, respectively. The annual lows of MAT occur from December to February. The MAT values in these three months are 14.9, 13.9, and 14.4 °C, respectively. Thus, Nanning has a long period of high temperature annually, with four months having an MAT of above 27 °C. As shown in Figure 4, the weather is fairly hot for most hours of the year. High air temperature in urban blocks can impair human health; as a consequence, reduction of indoor air temperature should be a key consideration inside a building and block micro-environment redesign.
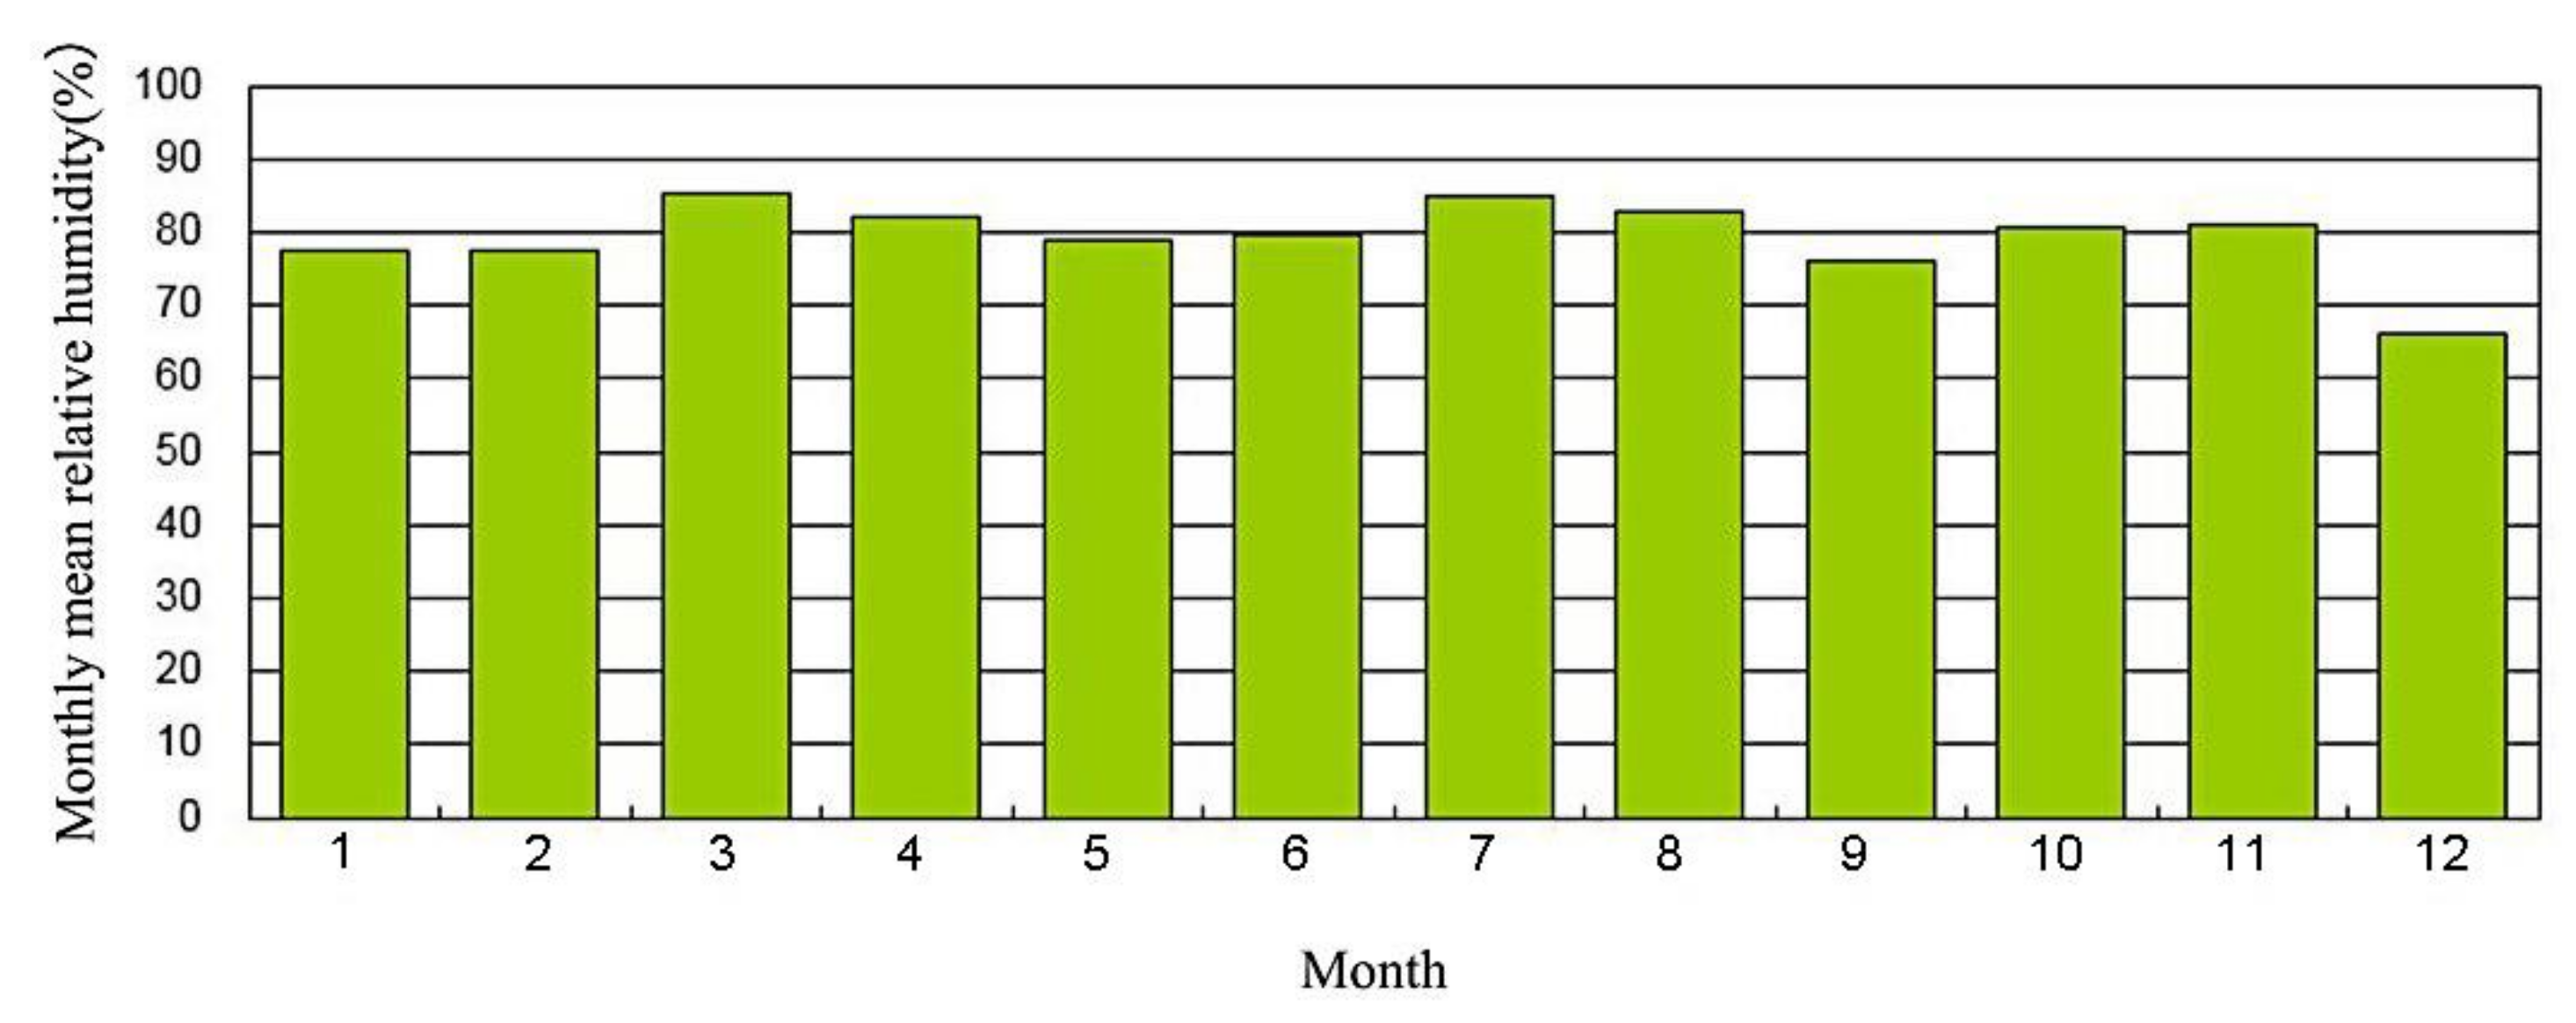
The relative humidity (RH) in Nanning varies insignificantly throughout the year and is fairly high for most of the year. The monthly average RH is approximately 75–85% and is much higher than many other cities in China for most months of the year (see Figure 5). In summer, a high humid environment increases the sensible temperature, causing sultriness and discomfort.
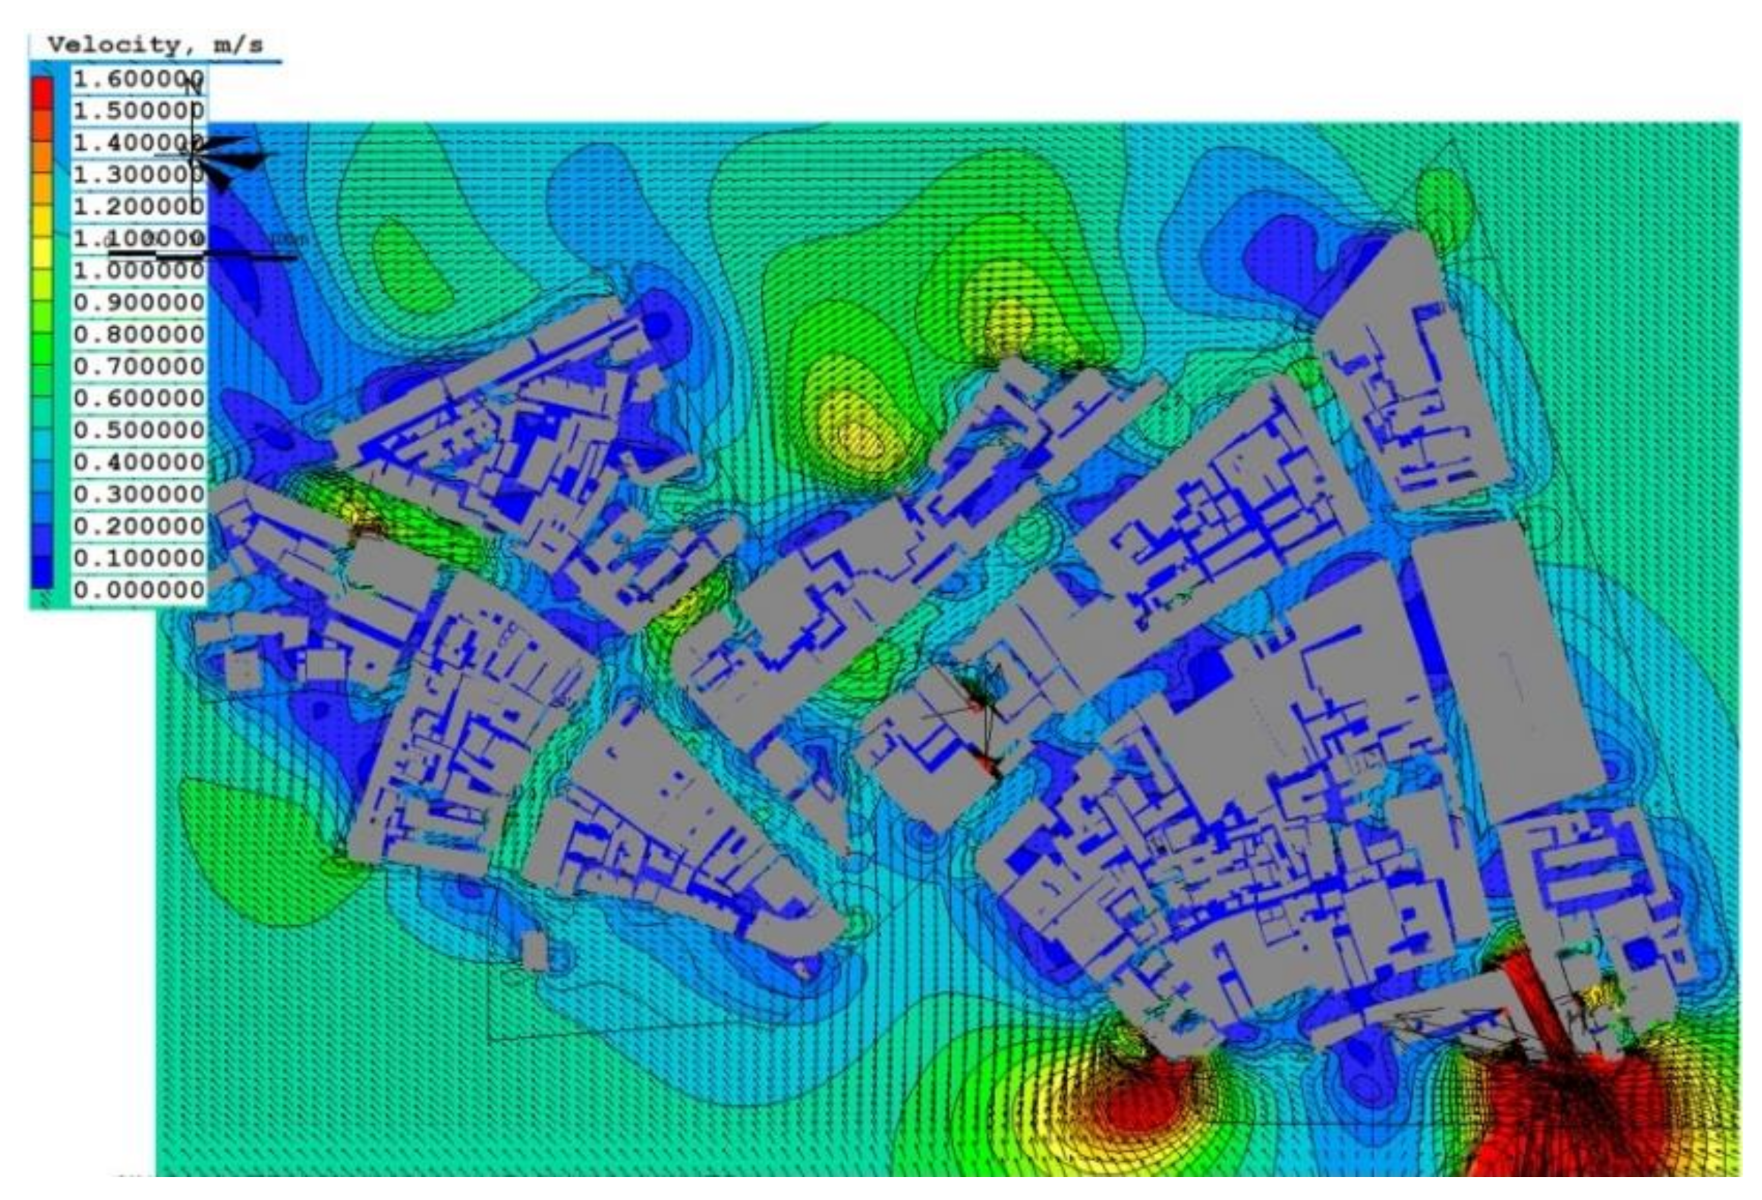
To further understand the climatic characteristics of qilou shopping streets in Nanning, the summer wind environment of the block was simulated using the PHOENICS software (see Figure 6). The software PHOENICS that was first launched in 1981 by Cham UK is a well-known numerical simulation software, which is used to simulate wind fields and heat transfer in building environments [34] and offers different kinds of turbulence models. The results showed that the airflow velocity was low in the building clusters, the wind-free areas are developed, and the ventilation is weak in the building clusters owing to the dense network of roads of different widths in the block. The poor ventilation and high density of the building clusters resulted in a relatively high temperature, and several high-temperature concentration zones and thermal discomfort in these areas are developed. Therefore, the indoor thermal discomfort level in qilou streets could not be solved through natural ventilation. Air conditioners and electric fans are commonly employed for cooling and ventilation.

3. Indoor Thermal Comfort and AoA

3.1. PMV and Predicted Percentage of Dissatisfied (PPD)

There are several indices for evaluation of indoor thermal comfort, such as effective temperature (ET), new effective temperature (ET *), standard effective temperature (SET), heat stress index (HSI), predicted mean vote (PMV), etc. Among the many comfort assessment indices, the most widely recognized is the thermal balance theory-based PMV created by Fanger [26] and standardized in EN ISO 7730 [35]. This index statistically predicts the human thermal sensation in a steady thermal environment to obtain the association between the human thermal sensation and comfort with six parameters (air velocity, air temperature, humidity, interior surface radiant temperature, thermal resistance of clothing, and activity level) under steady-state, uniform thermal environment conditions. The PMV is a statistical index, which is equal to the mean value of thermal sensation measurements. The PMV-PPD index system proposed by Fanger has been adopted by the International Organization for Standardization (ISO) as a standardized method for indoor thermal environment assessment and measurement (ISO 7730). PMV is calculated using the following equation [36]:
P M V = ( 0.303 e 0.036 M + 0.0275 ) { M W 3.05 [ 5.733 0.007 ( M W ) p a ] 0.42 ( M W 58.15 ) 0.0173 M ( 5.867 p a ) 0.0014 M ( 34 t a ) Q }
where M is the human metabolic rate (W/m2), depending on the activity level, W is the mechanical work from human activities, pa is the water vapor pressure of the ambient air (kPa) and is a measure of the effect of RH, ta is the ambient air temperature (°C), and Q is the sensible heat loss (W):
Q = 3.96 × 10 8 f c l [ ( t c l + 273 ) 4 ( t r + 273 ) 4 ] + f c l h c ( t c l t a ) ,
where
t c l = 35.7 0.028 ( M W ) 0.155 I c l Q .
h c = 2.38 ( t c l t a ) 0.25 2.38 ( t c l t a ) 0.25 > 12.1 v 12.1 v 2.38 ( t c l t a ) 0.25 < 12.1 v ,
tr is the mean indoor radiant temperature (°C), and
t r = j = 1 n S j θ i , j j = 1 n S j ,
where Sj is the inner surface area of the enclosure structure (m2), θi,j represents inner surface temperature of building envelope (°C), tcl is the outer surface temperature of the clothed human body (°C), hc is the convection heat transfer coefficient (W/(m2·K)), v is the air velocity (m/s), Icl is the thermal resistance of clothing (clo) and is 0.5 col for summer clothing, and fcl is the clothed surface area coefficient and is expressed as
f c l = 1 + 0.25 I c l .
Owing to the variation between individuals, PMV may not be indicative of the thermal sensation of all people in the area. Hence, Fanger proposed another index, the PPD, which represents the percentage of occupants dissatisfied with a given thermal environment and is related to the PMV as follows:
P P D = 100 95 e ( 0.03353 P M V 4 + 0.2179 P M V 2 ) .
The PMV is derived from thermal comfort equations based on a steady-state human body thermal balance. Its validity is premised on the assumption that the human body is in a state of thermal equilibrium with the surroundings. The PMV is an accurate measurement of human thermal sensation in air-conditioned, low airflow velocities and steady-state environments. Hence, it is applicable to air-conditioned qilou street shops. It also has the theoretical potential to reduce the energy consumption of indoor cooling systems without compromising the thermal comfort level [16].

3.2. AoA

The concept of AoA was proposed by Sandberg [37], referring to the time an air particle takes to travel from an inlet to a point in the room, or the time for the inlet air to move to the measurement point. AoA refers to the time the air stays in the room, but is actually the speed at which the stale air is replaced by fresh air. It is a clear description of the air freshness at every point in the room. A lower value of AoA indicates greater air freshness and better air quality. AoA is a comprehensive measurement of the effectiveness of ventilation and air exchange and a major index for an IAQ assessment. Designate the probability distribution function (i.e., proportional distribution) of the AoA of all micro-particles at an indoor point p as f (τ), where τ refers to AoA; thus, the following equation can be obtained:
0 f ( τ ) d τ = 1 .
Hence, the relationship between cumulative distribution function F(τ) and probability distribution function for micro-particles can be given:
F ( τ ) = 0 τ f ( τ ) d τ .
Hence, the mean AoA at point p τp is expressed:
τ p = 0 τ   f ( τ ) d τ = 0 [ 1 F ( τ ) ] d τ .
The cumulative distribution function F(τ) refers to the proportion of air micro-particles with an AoA of younger than τ. τp is a passive scalar and governed by the equation [2]:
ρ τ p v j x j = x j 2.88 ρ × 10 5 + μ e f f S c t τ p x j + S τ
where vj is the jth component of velocity, m/s, μeff is the effective turbulent viscosity, Sct represents the turbulent Schmidt number, Sτ is the source term, and ρ is the air density, kg/m3. With the AoA at the inlet assumed as zero, the time experienced by the air micro-particles starting from their entrance and moving into the ventilation systems is referred to as the overall AoA, and reducing the overall AoA inside the building can increase indoor air freshness and greatly decrease the spread of various viruses and bacteria [38,39].

4. Measurement and Simulation

4.1. Measurement

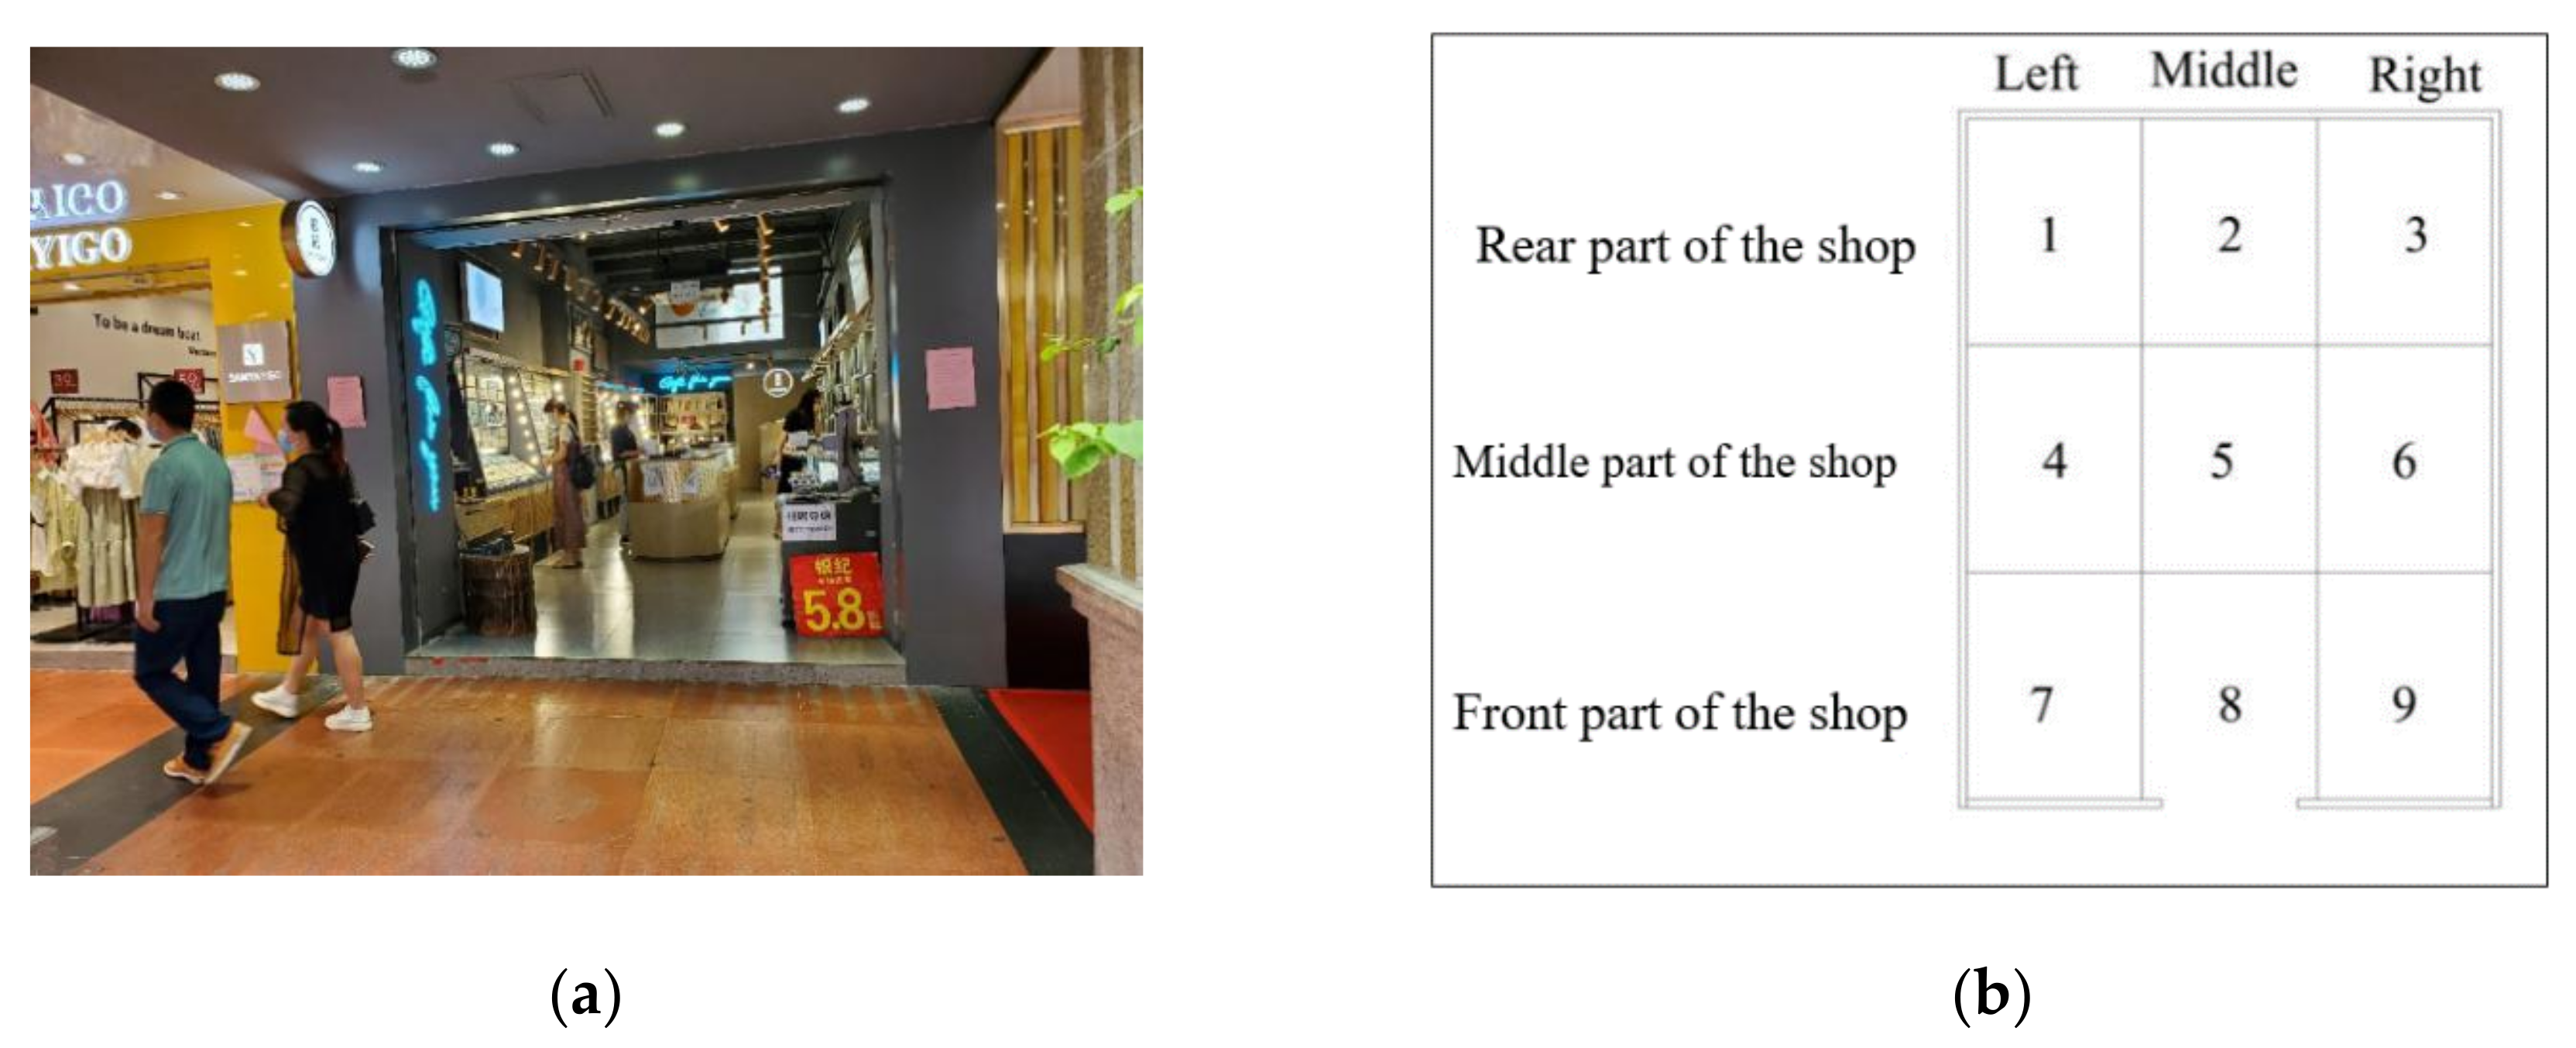
The indoor thermal environment of a qilou street shop (Figure 7a) will be investigated. First, the thermal environment parameters, including air temperature (response rate: 0.5 °C/s), RH (response rate <3 min from 45% to 90%), and velocity, are measured. The measurement uses the humility/temperature meter (TES-1361C) and anemometer (testo 405i), whose parameters are shown in Table 1, and their calibrations are in accordance with ISO 9002. Since most shops with air-conditioning systems in the qilou streets have almost the same area size, shape (as shown in Figure 1c), and floor height, one of them, which is selected for investigation, is representative. Besides the entrance of the shops, there are no windows or openings that are placed in the surrounding walls and ceiling. Table 1 indicates that the measurement range and resolution of the instrument meets the measurement requirements. During the measurement, the recorded interval was set to 5 min, and the data loggers were placed at a height of 1.5 m above the floor due to measuring the thermal parameters in the breathing zone. Additionally, the measurements were taken during a 9-h period (09:00–18:00) each day from 16–30 July 2019, so the time period of measurement represents the hottest period on the qilou street (see Figure 3 and Figure 4). The shop’s indoor space was basically ventilated mechanically. The thermal comfort in the space varied from point to point owing to the configuration of the air conditioners, showcases, and lights. The plane of the shop is divided into nine areas using a 3 × 3 grid. The data loggers have been fitted to each area in the shop to measure environmental parameters simultaneously. Figure 7b shows the layout of the measurement points.
Because the qilou shop’s indoor thermal environment is controlled using air conditioners and ventilation equipment, the indoor temperature and humidity varied insignificantly. Hence, the measurements of the thermal environment parameters at individual measurement points were averaged. Table 2 and Table 3 show the environmental parameters and their statistical summary for measurement points 1–9. In the rear part of the shop, the airflow is restricted by the closed rear wall and the concentration of cool air, resulting in low temperature. A relatively low temperature occurs in the middle of the shop, because it is located in the position of the air conditioning outlet and inlets. The front part of the shop has a high airflow velocity but a high air temperature. Because all of these several parameters greatly affect the human thermal sensation, their combined effect should be considered. As shown by the analysis above, the shop’s rear part (measurement points 1–3) is a place with relatively low temperature and restricted airflow; in the middle part, there are moderate temperature, lower relative humidity, and lower level of airflow; and the front part has higher wind speed, higher relative humidity, and higher air temperature, thus easily producing the thermal discomfort in this area.

4.2. Simulation

First, the model of the air-conditioned shop space was established for the numerical simulation. The simulation model measured as 6 × 4 × 3.3 m (length × width × height). The southern side is defined as the doorway (entrance) side. An air curtain is installed over the doorway. The vertically downward stream of air blowing from the machine formed an air curtain over the doorway to reduce the indoor–outdoor air exchange. The eastern, western, and northern sides of the shop are connected to the adjacent shops and have similar temperatures of wall surfaces. Square chairs, showcases, and a cashier desk were placed inside the shop (see Figure 7a). The ceiling was installed with 15 lights, 40 W each.
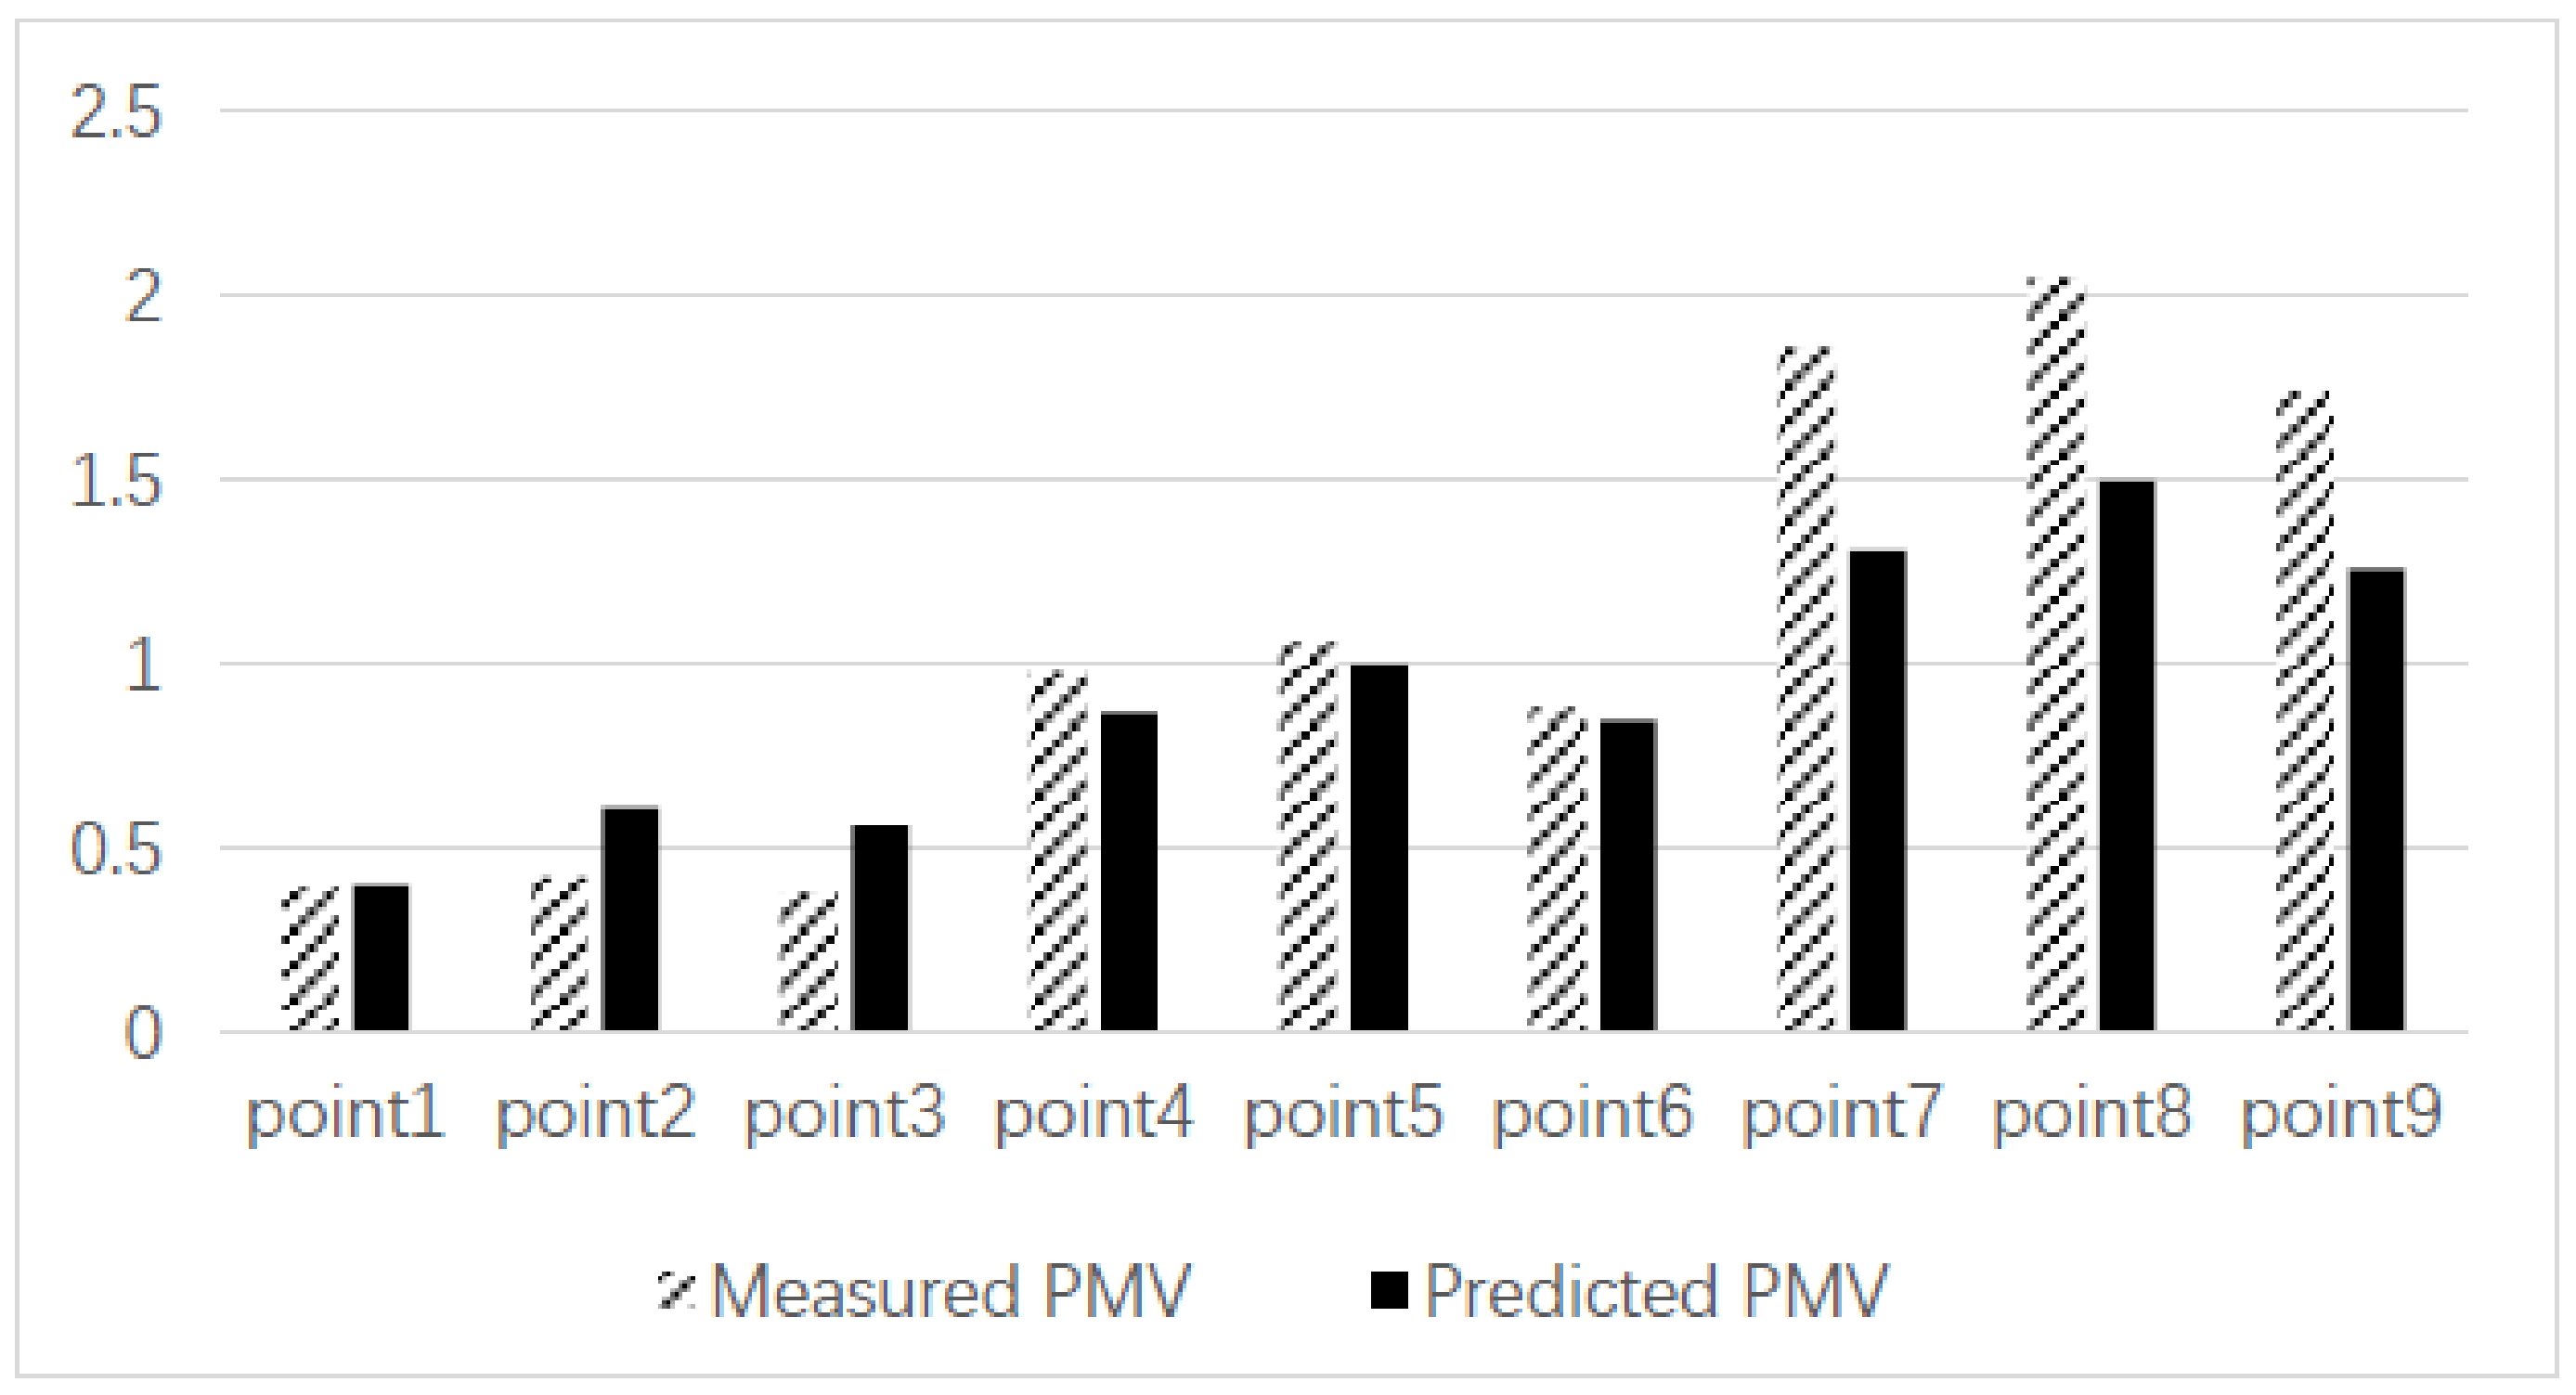
The PMV values at the measurement points were calculated by substituting the measured data given in Table 2, the clothing resistance, and metabolic rate data obtained from a questionnaire survey into Equation (1) according to GB/T 50785–2012 Evaluation Standard for Indoor Thermal Environment in Civil Buildings [40]. The calculation results are displayed in Figure 8.
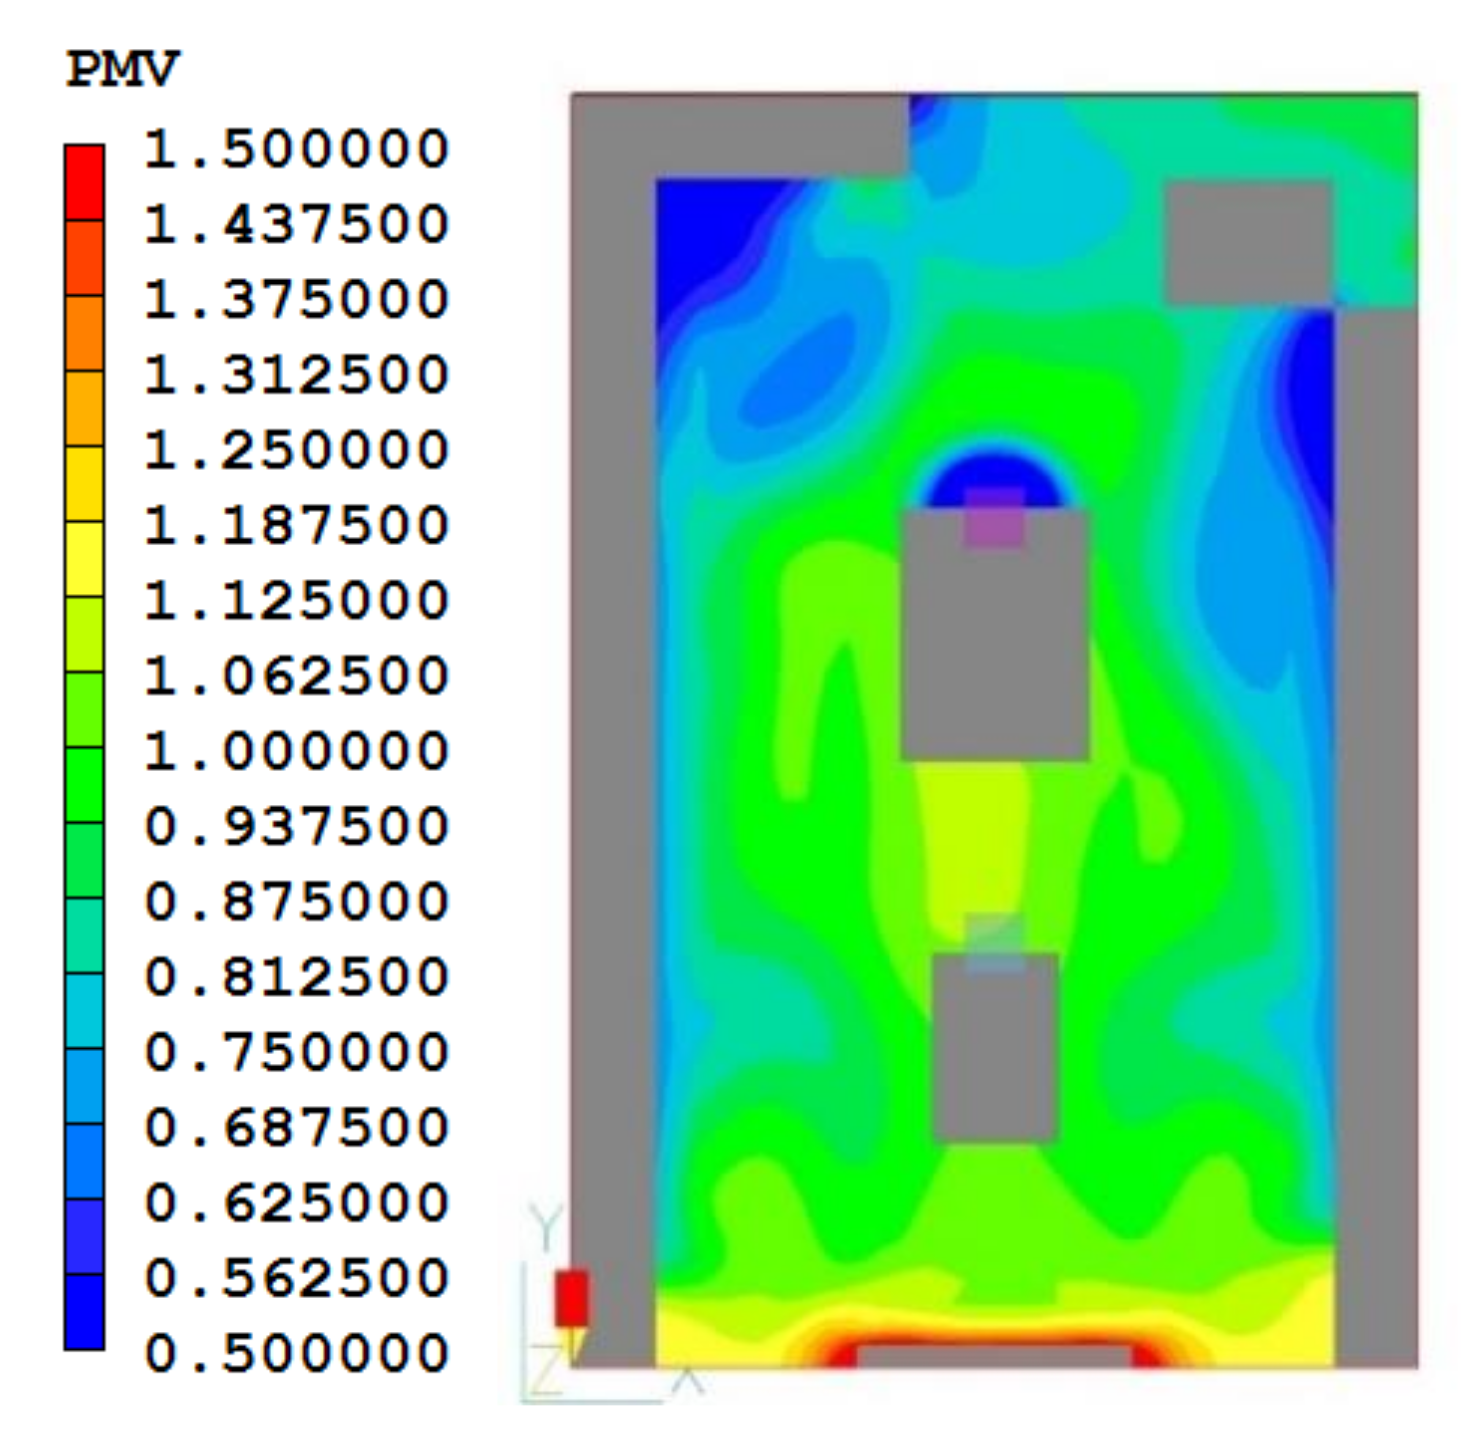
The applicability of the software PHOENICS was verified in Figure 8; the PMV values calculated using the measurement data are consistent with those yielded by the PHOENICS simulation. Therefore, the PHOENICS can be used to conduct a simulation analysis of the thermal environment in the qilou street shop. Figure 9 shows the PMV distribution in the shop derived from the simulation, and it indicates that the PMV value increases gradually from the rear part to the front part of the shop. In summer, the rear part of the shop is relatively comfortable, but the front part that connects with the colonnade space has a low comfort level and people feel hot there. Hence, reduction of the PMV value in the front part of the shop is the focus of thermal environment improvement, and enhancing the natural ventilation of the colonnade space helps to improve the indoor thermal comfort in this zone of the store [41].

5. Optimization and Discussion

Indoor space differs from the outdoor space that makes up the qilou street environment; the customers staying in the shop experience variations in thermal sensation due to ventilation schemes that directly affect humans’ thermal comfort and air freshness.
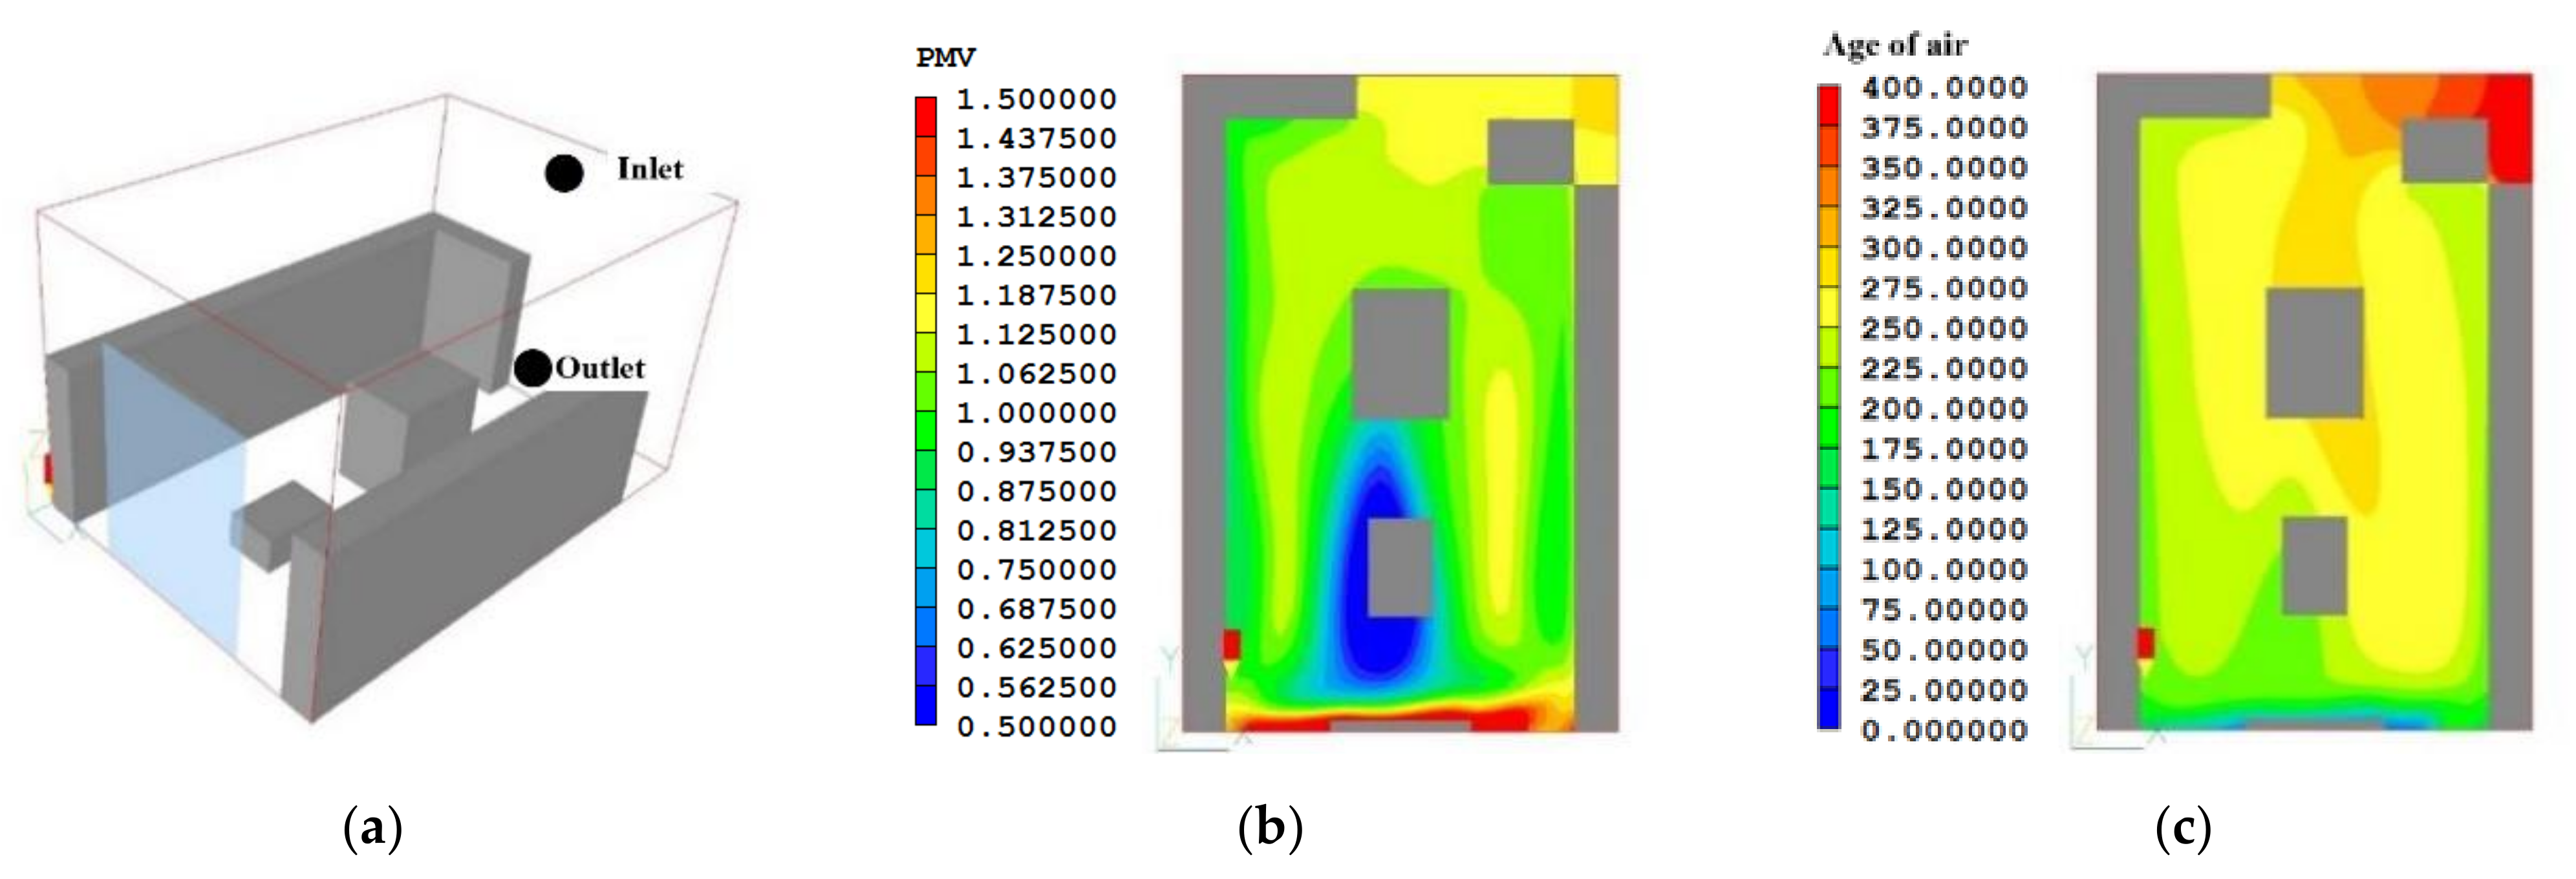
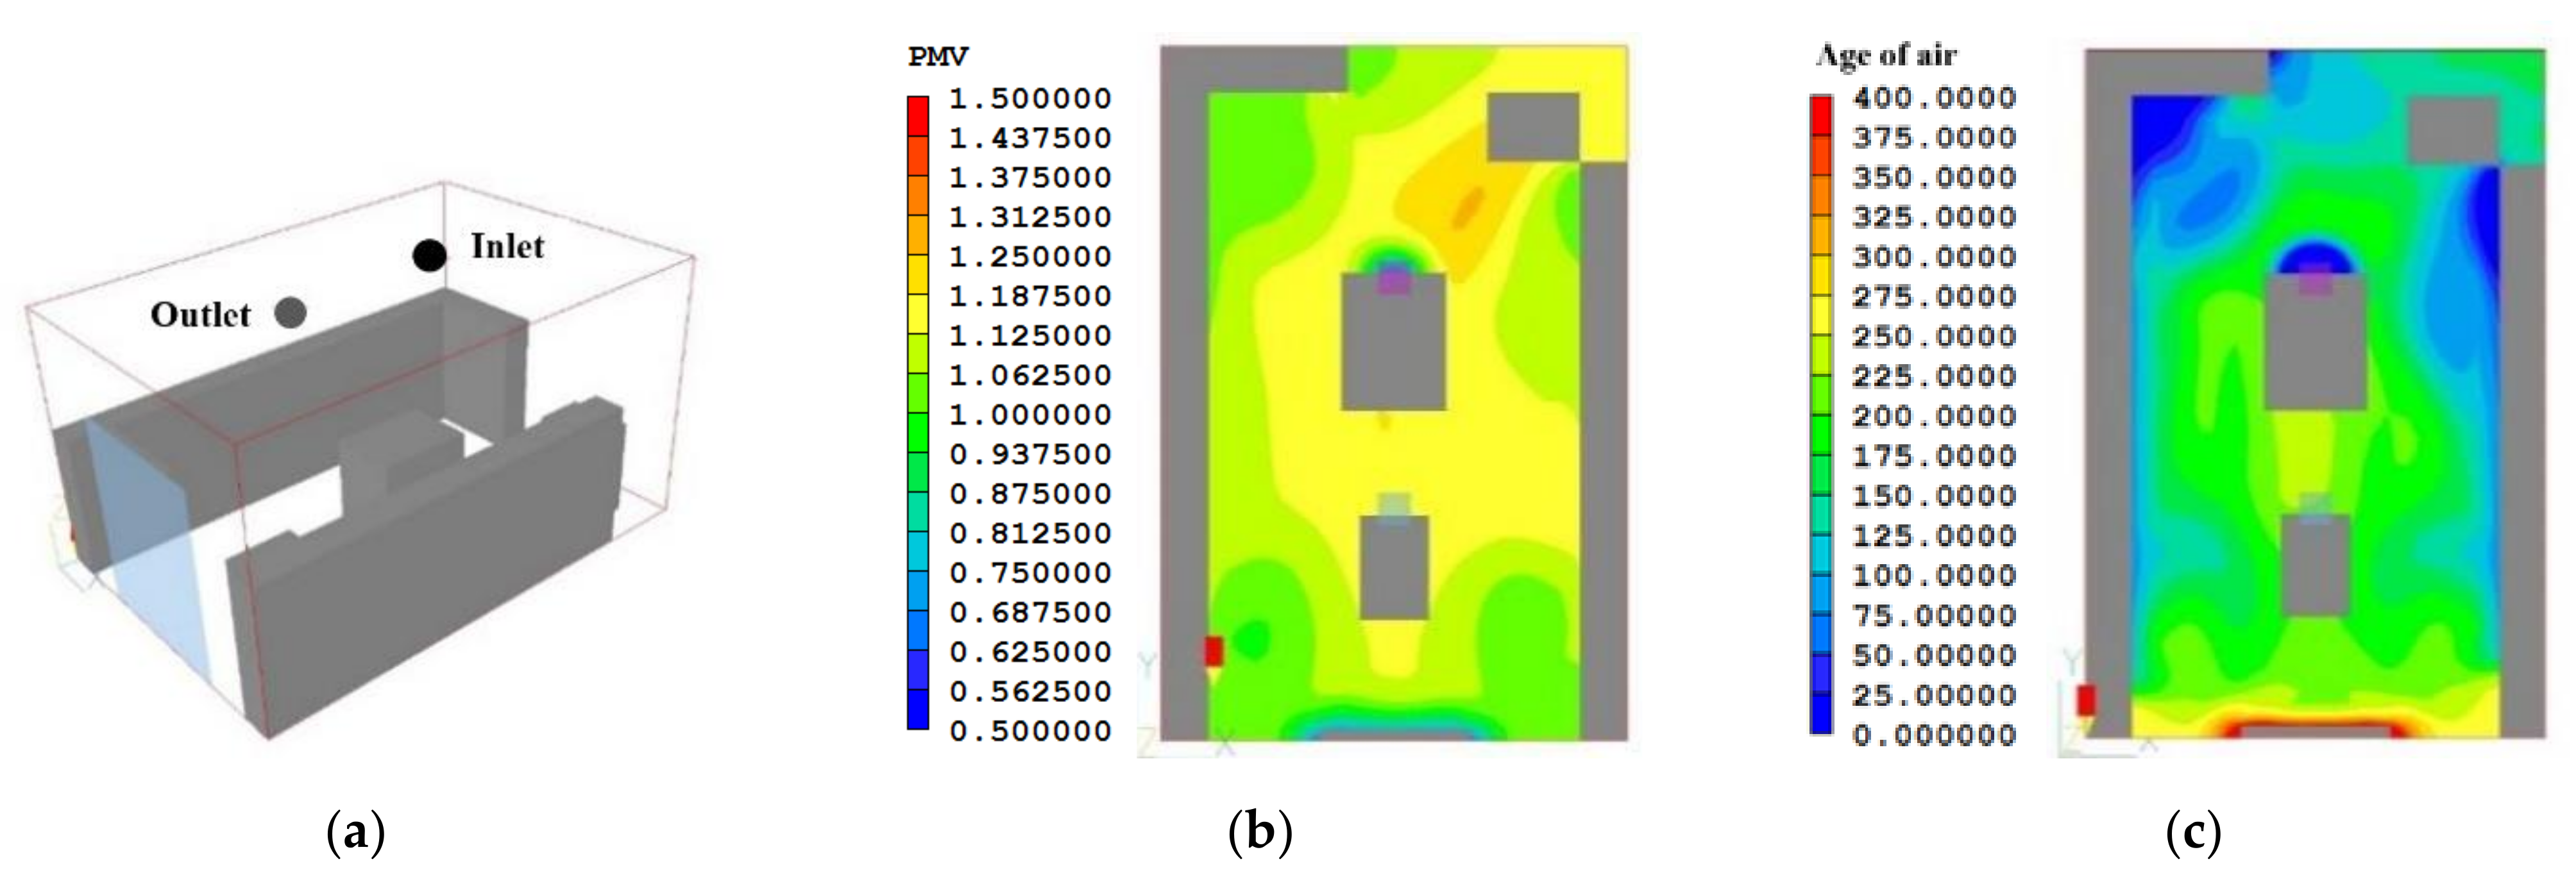
Generally, the ventilation schemes for the shop include the upper-inlet–bottom-outlet, upper-inlet–upper-outlet, and side-inlet–side-outlet [21]. The thermal environments inside the shop under the three ventilation schemes will be simulated separately by using PHOENICS software. Figure 10, Figure 11 and Figure 12 show the shop models, PMV, and AoA distribution in the occupied zone under three ventilation schemes, respectively.
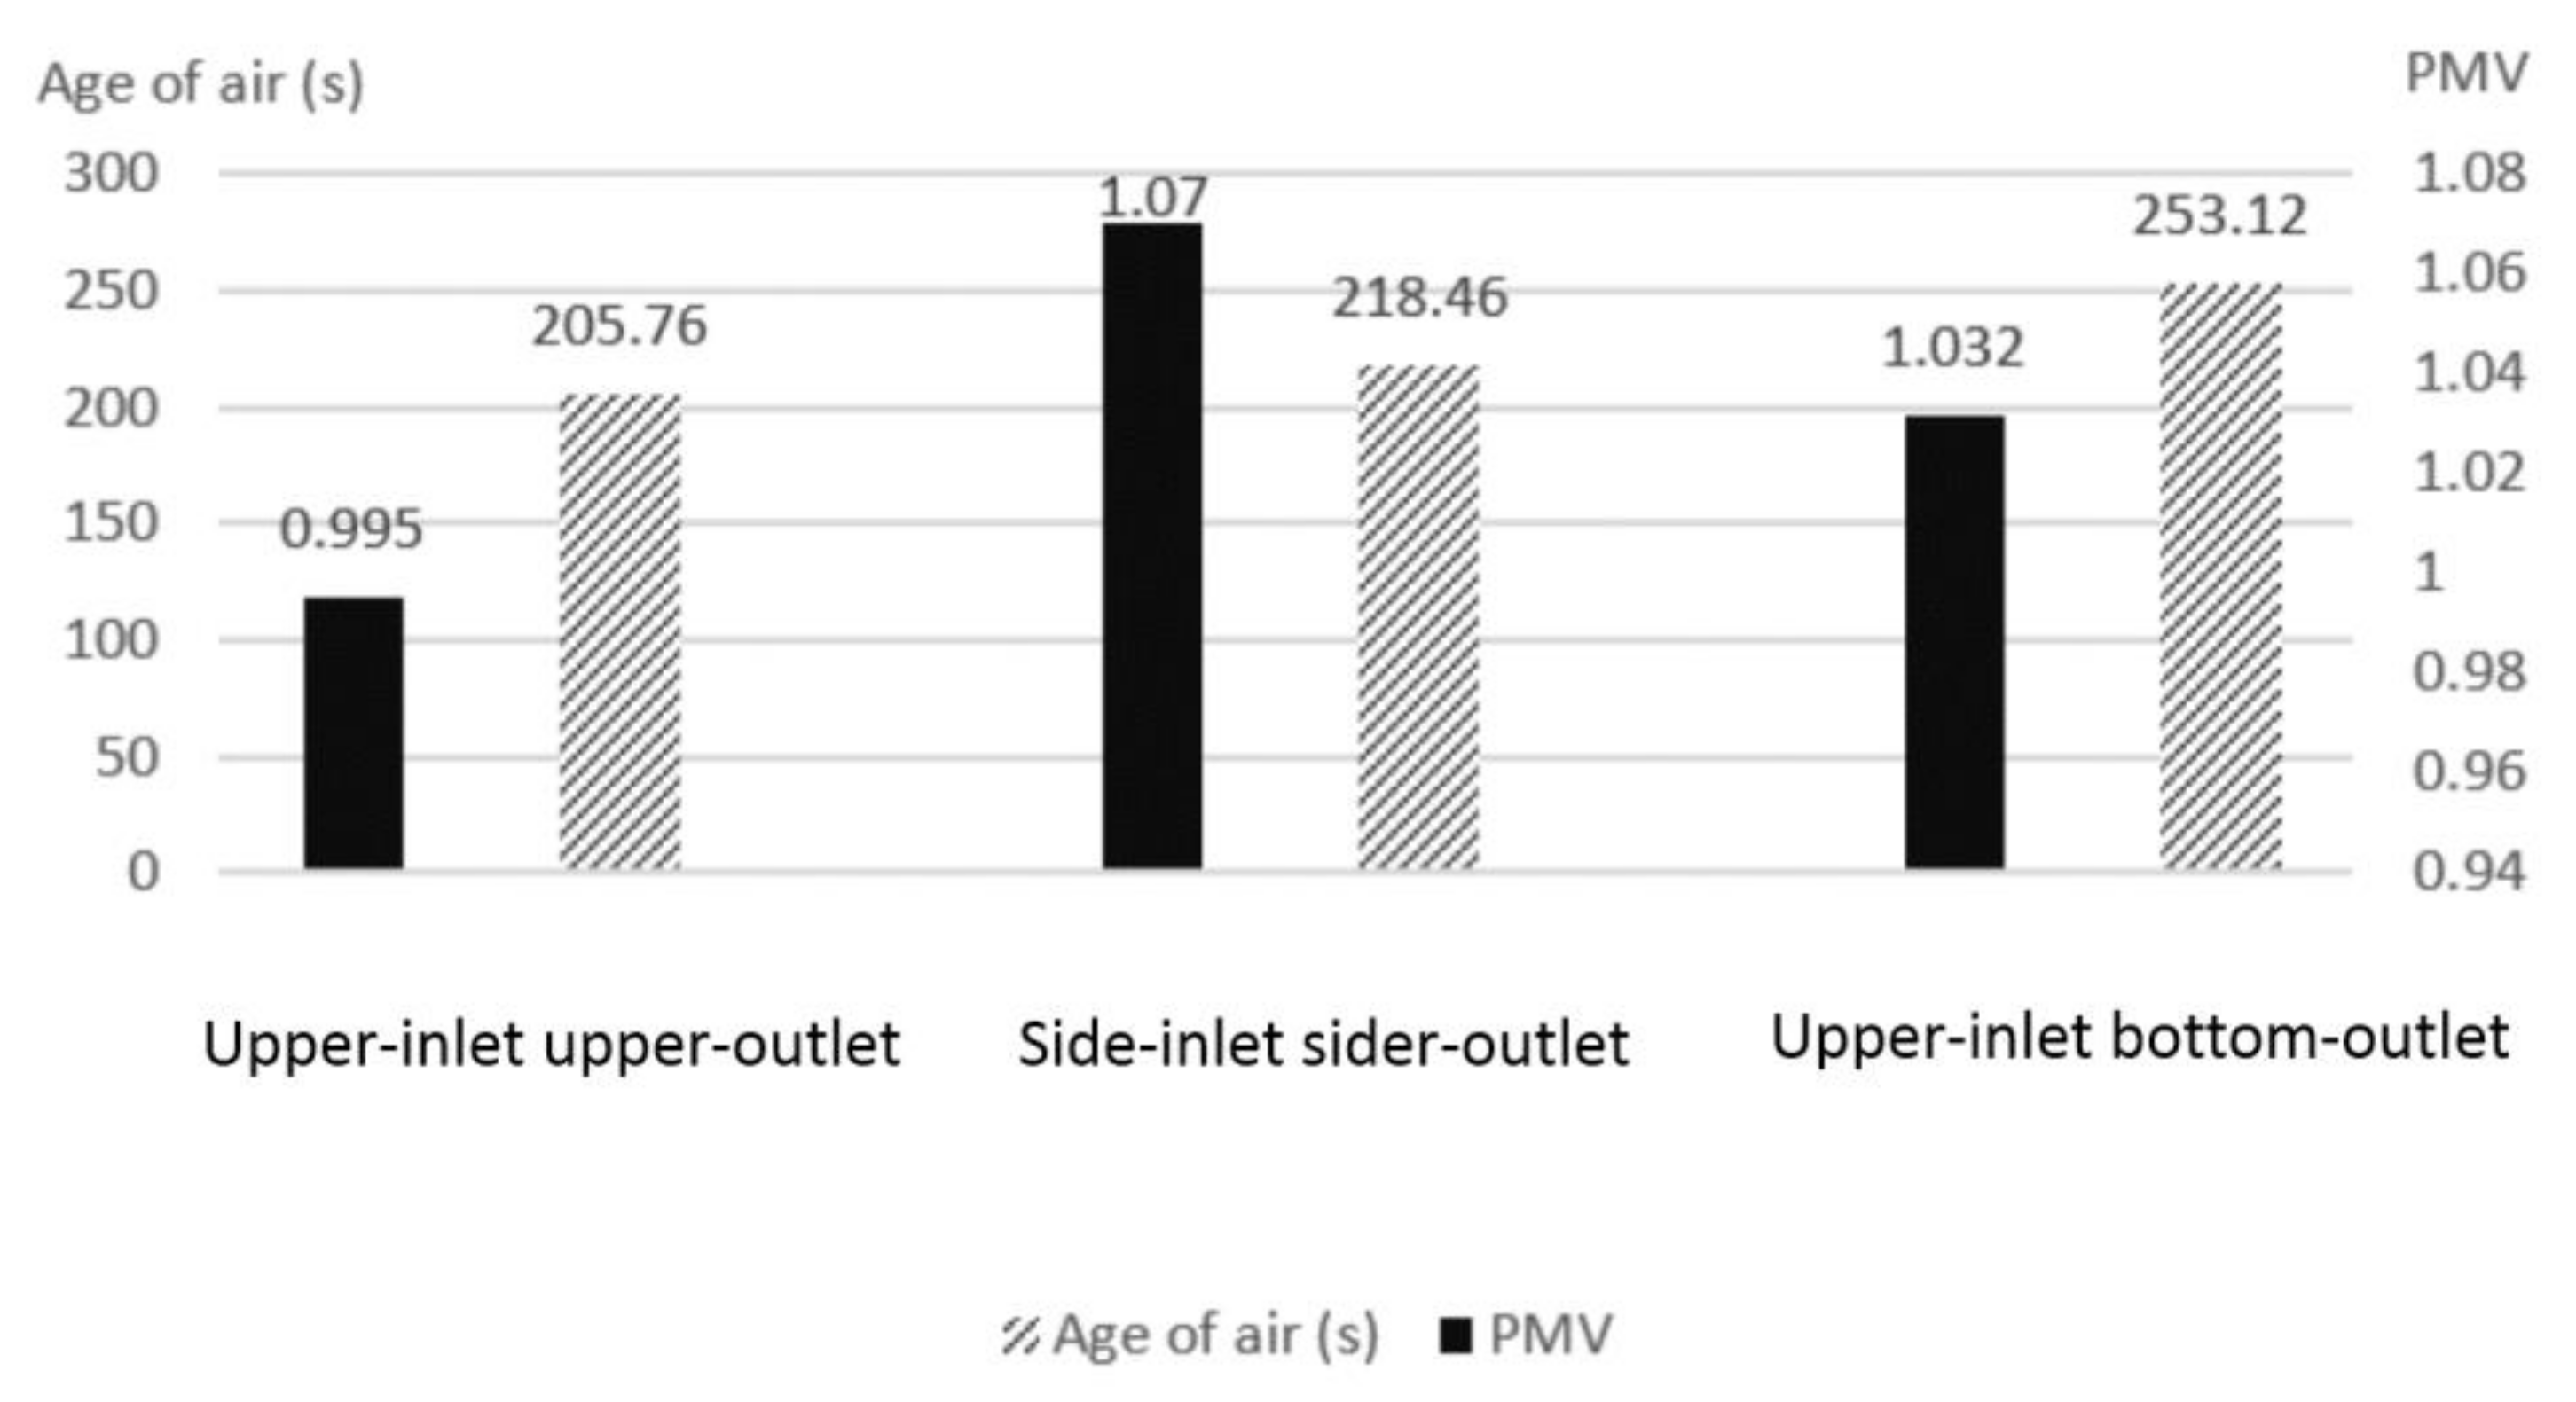
When the shop is air-conditioned adopting the upper-inlet–bottom-outlet scheme (see Figure 10a), owing to the combined effect of the air curtain and the air-conditioning outlets, the cooling air first blows towards the floor, forming a zone of cool high-pressure air in the middle-to-front part of the shop, with an average PMV of 1.032. This zone is adjacent to the hot space near the doorway, resulting in a non-uniform PMV distribution inside the shop space, as shown in Figure 10b. The rapid variation between cool and hot easily makes the occupants feel uncomfortable. Under this ventilation scheme, the airflow in the rear part of the shop space is restricted, resulting in a high AoA (with an average value of 253.12 s) and a low air freshness level in the rear space of the shop (see Figure 10c), creating a feeling of sultriness.
Under the side-inlet–side-outlet scheme (see Figure 11a), the inlet airflow zone in the upper side of the shop has a high level of air freshness. The inlet airflow descends owing to the low temperature. High air freshness level and low AoA occur in the place that is near the opposite wall from the inlet. The cool air descends along the wall and absorbs heat to move up to the ceiling level, creating an airflow circulation in the vertical direction of the shop space. The thermal sensation on the air inlet side is relatively cool, resulting in a certain level of temperature variance across the different parts of the human body and attenuated comfortable feeling. Figure 11b indicates that the thermal sensation inside the shop is slightly hot, as the average PMV is 1.07 and PMV is an uneven distribution. The resulting air circulation makes the air linger for quite a long time inside the shop, with a mean AoA of 218.46 s. In particular, the rear space of the shop has a high AoA and low air freshness level, and the AoA varies considerably from point to point as shown in Figure 11c, making the shop space unsuitable for a long occupancy. Therefore, the IAQ of the shop is relatively poor in the shopping area.
As illustrated in Figure 12a,b, the upper-inlet–upper-outlet scheme produces a relatively uniform PMV field in the shop, which exhibits a slightly warm feeling in the front part and a slightly cool feeling in the rear part, and a warm–cool transition is reasonable, thus avoiding the discomfort caused by abrupt changes and minimizing the impact on the thermal sensation of the customer. Satisfying thermal comfort is provided for people standing beside the showcases to select and purchase goods, owing to this shopping area with a low value of PMV. Most of the space of the shop also has lower PMV values, with an average PMV of 0.995. As the indoor thermal comfort requirement in China is −1 ≤ PMV ≤ 1, the expected PPD of the indoor environment should not be greater than 25% [42], so that the indoor thermal comfort under the upper-inlet–upper-outlet scheme meets the requirement of GB/T33658-2017. In addition, the indoor AoA has a uniform distribution and is young, with a mean AoA of 205.76 s in the breathing zone, indicating that there is a relatively high level of air freshness and it does not make the occupants feel stuffy in the store. Figure 12c displays a uniform and low AoA distribution, which satisfies requirements for comfort and air hygiene developed in the shop.
Among the three ventilation schemes, the upper-inlet–upper-outlet scheme with the lowest PMV and highest air freshness level exhibits the most favorable indoor thermal environment. Figure 13 shows a comparison of the mean values of PMVs and mean AoAs under three schemes, and indicates that the upper-inlet–upper-outlet mode of air circulation is more conducive to creating the favorable PMV and AoA distribution. In addition, this kind of mechanical ventilation requires less AC energy consumption to provide the same level of thermal sensation. Hence, this ventilation scheme better facilitates energy saving. Therefore, the comparative analysis above shows that the upper-inlet–upper-outlet scheme can create a comfortable, healthy, and energy-saving thermal environment in the qilou street shop.
By analyzing the impact of the ventilation scheme on indoor thermal comfort and AoA, this study indicates that the ventilation performance of upper-inlet–upper-outlet mode is an optimal scheme. During simulation, some details of the shop have been simplified. In the shop, the effects of enclosing structures and different heights of inlets and outlets are not taken into account. It is recognized that the building model adopted in the present study was relatively simple in comparison to the real qilou street shops. However, the obtained results in the study do provide useful insight into the magnitude of effect that mechanic ventilation schemes are likely to have on qilou street shops. Since only indoor thermal environment under summer conditions is investigated in this paper, the future work will focus on investigating the indoor thermal environment of qilou street shops in different seasons, and describing the vertical distribution of PMV and AoA in these shops.

6. Conclusions

The urban island effect has raised attention to thermal comfort in urban blocks; this study investigated the indoor thermal environment of a traditional block, i.e., a qilou shopping street, in Nanning through field measurements and simulation computations based on the local climate conditions. Research about indoor thermal comfort and air quality has been conducted, and indoor thermal comfort and air freshness are quantified by PMV and AoA, respectively. Then, the distributions of PMV and AoA inside the shop space are described by using data provided by measurement and numerical simulation. The influences of the three different ventilation schemes on the indoor thermal environment are comparatively analyzed, with the aim of finding the optimal air circulation solution for the shop. The following conclusions are obtained:
(1)
An investigation shows that the human thermal comfort sensation in shops is affected by indoor environmental factors, such as air temperature, velocity, and humidity. This finding is consistent with the PMV-PPD thermal comfort theory. In addition, the quality of the indoor thermal environment is closely related to shopping behavior, and a comfortable and healthy environment has a positive effect on commercial consumption.
(2)
The qilou street shop is enclosed on three sides, and the entrance opens towards the colonnade. The rear space of the shop has weak air movement owing to the windowless rear wall, and cool air concentrates there, resulting in low temperature. The front space of the shop has inadequate ventilation and relatively high air temperature, resulting in a low thermal comfort level and directly affecting the consumption behavior. Hence, under natural ventilation, the airflow field in the colonnade walkway space is conducive to improving the indoor thermal environment inside the shop.
(3)
A comparative analysis of three ventilation schemes (upper-inlet–bottom-outlet, upper-inlet–upper-outlet, and side-inlet–side outlet) for the qilou street shop showed that the upper-inlet–upper-outlet scheme is more beneficial to creating a comfortable thermal environment and to improving the air freshness level in the shop along qilou streets. Additionally, the agreement between this result and the finding derived from other literatures [43,44] suggests the accuracy of the analysis adopted in this study and its further application.
For the purpose of creating a thermally comfortable, high IAQ environment in a shop in a qilou street, this study highlights the essentiality of optimization strategies in ventilation schemes to provide the design guidelines for commercial buildings in humid and hot regions.

Author Contributions

Conceptualization: X.H.; methodology: X.H.; investigation: X.H. and C.Q.; writing: X.H. and C.Q.; visualization: X.H. and C.Q.; supervision: X.H.; project administration: X.H.; funding acquisition: X.H. All authors have read and agreed to the published version of the manuscript.

Funding

This research was funded by National Natural Science Foundation of China, grant number 51568003.

Institutional Review Board Statement

Not applicable.

Informed Consent Statement

Not applicable.

Data Availability Statement

The data presented in this study are available on request from the corresponding author.

Conflicts of Interest

The authors declare no conflict of interest.

References

  1. Ma, X.; Fukuda, H.; Zhou, D.; Gao, W.; Wang, M. The study on outdoor pedestrian thermal comfort in blocks: A case study of the Dao He Old Block in hot-summer and cold-winter area of southern China. Sol. Energy 2019, 179, 210–225. [Google Scholar] [CrossRef]
  2. Qin, C.; Lu, W. Effects of ceiling exhaust location on thermal comfort and age of air in room under impinging jet supply scheme. J. Build. Eng. 2021, 35, 101966. [Google Scholar] [CrossRef]
  3. Kelly, F.J.; Fussell, J.C. Improving indoor air quality, health and performance within environments where people live, travel, learn and work. Atmos. Environ. 2019, 200, 90–109. [Google Scholar] [CrossRef] [Green Version]
  4. Wyon, D.P. The effects of indoor air quality on performance and productivity. Indoor Air 2004, 14, 92–101. [Google Scholar] [CrossRef] [PubMed]
  5. Huang, X.; Li, C.; Zhuang, Z. Analysis of height-to-width ratio of commercial streets with arcades based on sunshine hours and street orientation. Appl. Sci. 2021, 11, 1706. [Google Scholar] [CrossRef]
  6. Yahia, M.; Johansson, E. Influence of urban planning regulations on the microclimate in a hot dry climate: The example of Damascus, Syria. J. Hous. Built Environ. 2013, 28, 51–65. [Google Scholar] [CrossRef]
  7. Krüger, E.; Minella, F.; Rasia, F. Impact of urban geometry on outdoor thermal comfort and air quality from field measurements in Curitiba. Build. Environ. 2011, 46, 621–634. [Google Scholar] [CrossRef]
  8. Qi, J.; Adam, N.; Sahari, B. Thermal comfort assessment and potential for energy efficiency enhancement in modern tropical buildings: A review. J. Energy Build. 2014, 68, 547–557. [Google Scholar]
  9. Ozel, M. Effect of indoor design temperature on the heating and cooling transmission loads. J. Build. Eng. 2016, 7, 46–52. [Google Scholar] [CrossRef]
  10. Wang, Y.; Chen, Y.; Xiao, X.; Kan, W.; Luo, X. Investigation and analysis on energy consumption of market buildings in Guangzhou. Build. Sci. 2012, 28, 67–71. [Google Scholar]
  11. Hwang, Y.; Lum, Q.; Chan, Y. Micro-scale thermal performance of tropical urban parks in Singapore. Build. Environ. 2015, 94, 467–476. [Google Scholar] [CrossRef]
  12. Gao, H. Arcade and Arcade Street, Guangzhou. Master’s Thesis, Xi’an University of Architecture and Technology, Xi’an, China, 2003. [Google Scholar]
  13. Jung, J. Spatial distribution characteristics and protective measures of Guangzhou Qilou Street. Urban Plan. 1999, 11, 18–25. [Google Scholar]
  14. Chen, J.; Liu, J. Arcade street in Haikou under the change of commercial pattern. Build. Sci. 2011, 10, 13–19. [Google Scholar]
  15. Djongyang, N.; Tchinda, R.; Njomo, D. Thermal comfort: A review paper. Renew. Sustain. Energy Rev. 2010, 14, 2626–2640. [Google Scholar] [CrossRef]
  16. Yan, H.Y.; Mao, Y.; Yang, L. Thermal adaptive models in the residential buildings in different climate zones of Eastern China. Energy Build. 2017, 141, 28–38. [Google Scholar] [CrossRef]
  17. Zaki, S.A.; Damiati, S.A. Adaptive thermal comfort in university classrooms in Malaysia and Japan. Build. Environ. 2017, 122, 294–306. [Google Scholar] [CrossRef]
  18. Ruiz, M.A.; Correa, E.N. Adaptive model for outdoor thermal comfort assessment in an Oasis city of arid climate. Build. Environ. 2015, 85, 40–51. [Google Scholar] [CrossRef]
  19. Jin, H.; Liu, S.; Kang, J. The thermal comfort of urban pedestrian street in the severe cold area of northeast China. Energy Procedia 2017, 134, 741–748. [Google Scholar] [CrossRef]
  20. Li, L.; Yan, J.; Zhou, X.; Feng, J. Study on indoor thermal comfort of shopping malls in hot summer and warm winter zone. Heat. Vent. Air Cond. 2015, 6, 76–81. [Google Scholar]
  21. Chen, C. Study on Thermal Comfort in Winter in Functional Area of Comprehensive Shopping Mall in Hot Summer and Warm Winter Zone. Master’s Thesis, South China University of Technology, Guangzhou, China, 2016. [Google Scholar]
  22. Dang, R.; Yan, Z.; Liu, K.; Shan, C.; Liu, G. Study on indoor thermal comfort evaluation model of large-scale commercial complex in cold area in winter. Build. Sci. 2017, 33, 16–21. [Google Scholar]
  23. Zhang, L.L. Numerical simulation and analysis of air distribution in a hotel lobby. Clean Air Cond. Technol. 2020, 1, 21–26. [Google Scholar]
  24. Huang, Z.; Shen, J. Indoor air quality research for large shopping malls in Ma’anshan. Heat. Vent. Air Cond. 2006, 36, 101–104. [Google Scholar]
  25. Henderson, H.I.; Rengarajan, K.; Shirley, D.B. The impact of comfort control on air conditioner energy use in humid climate. ASHRAE Trans. 1992, 98, 104–113. [Google Scholar]
  26. Fanger, P.O. Thermal Comfort; Danish Technical Press: Copenhagen, Denmark, 1970. [Google Scholar]
  27. de Dear, R.J.; Brager, G.S. Thermal comfort in naturally ventilated buildings revisions to ASHRAE Standard 55. Energy Build. 2002, 34, 549–562. [Google Scholar] [CrossRef] [Green Version]
  28. Staveckis, A.; Borodinecs, A. Impact of impinging jet ventilation on thermal comfort and indoor air quality in office buildings. Energy Build. 2021, 235, 110738. [Google Scholar] [CrossRef]
  29. Liu, X.; Yang, L.; Qian, F. Study on ventilation conditions for different types of teaching buildings. Build. Sci. 2019, 35, 102–109. [Google Scholar]
  30. Lucialli, P.; Marinello, S.; Pollini, E.; Scaringi, M.; Sajani, S.Z.; Marchesi, S.; Cori, L. Indoor and outdoor concentrations of benzene, toluene, ethylbenzene and xylene in some Italian schools evaluation of areas with different air pollution. Atmos. Pollut. Res. 2020, 11, 1998–2010. [Google Scholar] [CrossRef]
  31. Zhang, Y.; Zhao, R.; Jia, Y.; Shen, F. Air quality pollution levels in two large comprehensive commercial sites in Beijing. Occup. Health 2014, 30, 2623–2625. [Google Scholar]
  32. Lin, Z.; Chow, T.T.; Tsang, C.F.; Fong, K.F.; Chan, L.S. Stratum ventilation—A potential solution to elevated indoor temperatures. Build. Environ. 2009, 44, 2256–2269. [Google Scholar] [CrossRef]
  33. China Meteorological Administration, Department of Building Technology Science, Tsinghua University. Special Meteorological Data Set for Thermal Environment Analysis of Buildings in China; China Architecture & Building Press: Beijing, China, 2005. [Google Scholar]
  34. Huang, Z.; Li, L.; Zhao, L.; Zhao, X. Quantitively analysis for impact of first floor overhead on natural ventilation under different building densities and plot ratios. HVAC 2016, 49, 124–127. [Google Scholar]
  35. ISO 7730: 2005 Ergonomics of the Thermal Environment—Analytical Determination and Interpretation of Thermal Comfort Using Calculation of the PMV and PPD Indices and Local Thermal Comfort Criteria; International Organization for Standardization: Geneva, Switzerland, 2005.
  36. ASHRAE. ANSI/ASHRAE Standard 55–2010. Thermal Environmental Conditions for Human Occupancy; American Society of Heating, Refrigerating and Air-Conditioning Engineers, Inc.: Atlanta, GA, USA, 2010. [Google Scholar]
  37. Sandberg, M.; Sjoberg, M. The use of moments for assessing air quality in ventilated rooms. Build. Environ. 1983, 18, 181–197. [Google Scholar] [CrossRef]
  38. Li, D.; Li, X.; Yang, X.; Yang, J. Total air age in the room ventilated by multiple air- handling units: Part 1, An algorithm. ASHRAE Trans. 2003, 109, 829–836. [Google Scholar]
  39. Li, X.; Li, D.; Yang, X.; Yang, J. Total air age: An extension of the air age concept. Build. Environ. 2004, 13, 287–294. [Google Scholar] [CrossRef]
  40. Chongqing University, Chinese Academy of Building Sciences. GB/T 50785—2012 Indoor Thermal and Humid Environment Evaluation Standard for Civil Buildings; China Architecture & Building Press: Beijing, China, 2012; pp. 25–27. [Google Scholar]
  41. Huang, X.; Lu, Z.; Zhuang, Z. Analysis of the wind environment to improve the thermal comfort in the colonnade space of a qilou street based on the relative warmth index. Sustainability 2019, 11, 4402. [Google Scholar] [CrossRef] [Green Version]
  42. GB/T33658—2017 Thermal Comfort Requirements and Evaluation for indoor Environment; China Standards Press: Beijing, China, 2017.
  43. Yang, J.; Pei, C.; Chen, X. Study on the influence of air supply mode on contaminant transport in aircraft cabin. Chin. J. Appl. Mech. 2021, 38, 241–248. [Google Scholar]
  44. Tian, Z.; Yang, L.; Wu, X.; Guan, Z. A field study of occupant thermal comfort with radiant ceiling cooling and overhead air distribution system. Energy Build. 2020, 223, 109949. [Google Scholar] [CrossRef]
Figure 1. Traditional block in Nanning: (a) qilou shopping street; (b) colonnade walkway of qilou street; (c) layout of shops.
Sustainability 13 04037 g001
Figure 2. The location of (a) Nanning in China and (b) the qilou street in Nanning.
Sustainability 13 04037 g002
Figure 3. MAT in a typical meteorological year of Nanning.
Sustainability 13 04037 g003
Figure 4. Hourly dry bulb temperature in Nanning.
Sustainability 13 04037 g004
Figure 5. Monthly average RH in Nanning.
Sustainability 13 04037 g005
Figure 6. Wind environment of a qilou street block in Nanning.
Sustainability 13 04037 g006
Figure 7. The shop in qilou street block: (a) indoor setting and (b) layout of measurement points.
Sustainability 13 04037 g007
Figure 8. Measured and predicted PMV values at each measurement point.
Sustainability 13 04037 g008
Figure 9. PMV distribution in the shop.
Sustainability 13 04037 g009
Figure 10. Upper-inlet–bottom-outlet scheme: (a) the shop model, (b) PMV distribution, and (c) AoA distribution.
Sustainability 13 04037 g010
Figure 11. Side-inlet–side-outlet scheme: (a) the shop model, (b) PMV distribution, and (c) AoA distribution.
Sustainability 13 04037 g011
Figure 12. Upper-inlet–upper-outlet scheme: (a) the shop model, (b) PMV distribution, and (c) AoA distribution.
Sustainability 13 04037 g012
Figure 13. Comparison of the PMVs and mean AoAs under different ventilation schemes.
Sustainability 13 04037 g013
Table 1. Parameters of humility/temperature meter and anemometer.
Measurement ParametersMeasurement RangeResolution
Temperature (°C)−20–600.1
Relative humidity (%)10–950.1
Wind speed (m/s)0.1–30.0 0.01
Table 2. Thermal environment parameters at measurement points.
Measured PointAir Temperature (°C)Relative Humidity (%)Wind Speed (m/s)
127.5470.250.059
227.7471.270.098
327.0072.030.164
429.0562.820.063
529.2163.440.041
628.7964.080.055
731.2072.290.111
831.6272.600.139
930.9272.040.111
Table 3. Statistical summary of indoor thermal environment parameters.
ParameterMinimumMaximumMeanS.D.
Air Temperature (°C)27.5431.6229.232.75
Relative Humidity (%)62.8272.6068.986.89
Air velocity (m/s)0.0410.1390.0930.068
Publisher’s Note: MDPI stays neutral with regard to jurisdictional claims in published maps and institutional affiliations.