Article

Spatiotemporal Evolution and the Influencing Factors of Tourism-Based Social-Ecological System Vulnerability in the Three Gorges Reservoir Area, China

1
School of Geography and Tourism, Chongqing Key Laboratory of GIS Application, Chongqing Normal University, Chongqing 401331, China
2
Sichuan Forestry and Grassland Survey and Planning Institute, Chengdu 610081, China
*
Author to whom correspondence should be addressed.
Sustainability 2021, 13(7), 4008; https://doi.org/10.3390/su13074008
Submission received: 26 February 2021 / Revised: 1 April 2021 / Accepted: 1 April 2021 / Published: 3 April 2021

Abstract

:
With the rapid development of global tourism, identifying the vulnerability of tourism-based social-ecological systems (SESs) has become an important topic in sustainable development research. This study aimed to quantitatively evaluate the vulnerability, spatiotemporal evolution characteristics, and influencing factors of tourism-based SESs in the counties of the Three Gorges Reservoir Area (TGRA). A comprehensive evaluation system containing 46 indicators was constructed using a model that combines a social–economic–ecological model and a pressure–state–response model (SEE-PSR). The entropy and composite index methods were used to calculate the vulnerability values of the indicators, and Geodetector was used to explore the factors influencing system vulnerability in the whole study area. The results showed the following: (1) The mean value of the composite vulnerability index of the TGRA from 2010 to 2018 was 0.4849, indicating a moderate vulnerability state. The system vulnerability of the study area gradually decreased from moderately high to moderately low. (2) There were obvious differences in the spatiotemporal evolution of vulnerability in different counties; high and moderately high vulnerability continued to decrease, moderately low and low vulnerability increased, and moderate vulnerability showed a trend of increasing and then decreasing. Meanwhile, the relative differences in vulnerability among counties were small but gradually increasing. (3) System vulnerability was mainly caused by the social subsystem. Six factors, including the growth rate of the number of tourists and the amount of fiscal expenditure, were more likely to contribute to system vulnerability than other factors. The interaction types were mainly nonlinear enhancement types, supplemented by two-factor enhancement. This study presents an approach for evaluating the vulnerability of tourist destinations and constructing an evaluation index system. In this way, it has reference value for reducing regional vulnerability and promoting sustainable development.

1. Introduction

Vulnerability studies took shape in the context of natural hazard research in the 1960s [1,2]. Timmerman [3], who worked in the field of geology, first introduced the concept of vulnerability in 1981. In the 1990s, international scientific programs and agencies, such as the IHDP, IGBP, and IPCC, began to include vulnerability as an important research component [4,5]. Since then, vulnerability research has become a frequent topic in the field of global environmental change and sustainable development [6]. It has gradually been applied to many fields, such as climate change, disaster management, ecology, public health, and engineering [7]. Its connotation has gradually evolved from a single-factor, single-dimensional concept of natural vulnerability into a composite, multifactor, multidimensional concept, covering factors such as a system’s exposure, sensitivity, and adaptability to disturbance, involving social, economic, environmental, and institutional dimensions [8]. Accordingly, the amount of research on vulnerability has grown rapidly. At the same time, the analytical frameworks of vulnerability have undergone the following developmental shifts: first, from the study of single disturbance factors to the study of multiple disturbance factors and their interactions; second, from one-way, static studies to multifeedback, dynamic vulnerability studies; and third, from a one-sided focus on a single natural or social system to a focus on social-ecological systems (SESs) [8]. The related research methods have also been steadily enriched, mainly including the composite index method [8], fuzzy matter–element method [9], scenario analysis method [10], and 3S (GIS, RS, and GPS) technology [11].
In the context of increasingly severe global environmental problems, Holling [12] proposed the SESs concept in 2001. The SESs was defined as a complex system with close connections between humans and nature, subject to the influence of its own structural stability and the intensity of external disturbances, characterized by unpredictability, multistability, threshold effect, and historical dependence. Later, researchers began to view tourism destinations as relatively complete SESs. Farrell et al. [13], for instance, suggested that if the regional tourism industry is to transition to sustainable development, it is necessary to study that type of SESs using composite and nonlinear approaches. Petrosillo et al. [14] quantitively studied SES vulnerability in the Salento region in southern Italy under the influence of tourism pressure. A tourism-based SES is a territorial system comprising human–earth relations, with tourism activities as the main disturbance. It is, moreover, a coupled humans–nature–society system in which social and natural systems are closely linked [15], characterized by complexity, dynamism, and multiple scales, as well as key attributes such as resilience, adaptability, and vulnerability [8,16]. The vulnerability of SESs in special areas is considered a core issue in sustainable development research [17]. A modern tourist destination is a region that is vulnerable to economic crisis, political unrest, terrorism, and epidemics [18]. It is therefore essential to study the vulnerability of tourism-based SESs. However, there is a lack of research on the vulnerability of tourist destinations from the perspective of coupled humans–earth systems, as indicated by Calgaro [19], Browne [20], Chen [21], and Wang [8].
The Three Gorges Reservoir Area (TGRA) is a special region that combines ethnic areas, old revolutionary areas, and concentrated contiguous special hardship areas. It is also a core ecological barrier area in the upper reaches of the Yangtze River and a typical ecologically vulnerable area of the South China Karst [22]. The region has faced many problems in the urbanization process, such as the contradiction between people and land, uneven development levels between towns and cities, imperfect public service facilities [23], increasingly serious environmental pollution, a significant loss of native culture [24], and deteriorating soil erosion [25]. In addition, with increased tourism in the TGRA, the SESs in the county tourism destinations face greater disturbances and external pressures.
In light of the above, adopting a coupled human–earth system and the perspective that tourism activities are the main reasons lead to the vulnerability of SESs at tourist destinations, this study aimed to quantitatively measure the vulnerability of tourism-based SESs in the TGRA for the years 2010, 2014, and 2018. To this end, this study adopted a model that combines a social–economic–ecological model and a pressure–state–response model (hereafter, SEE-PSR). In this way, a composite evaluation index system was established to clarify the spatiotemporal evolution characteristics, processes, and influencing factors of vulnerability in the study area. Based on this approach, this study can provide reference value for reducing vulnerability and promoting sustainable regional development.

2. Materials and Methods
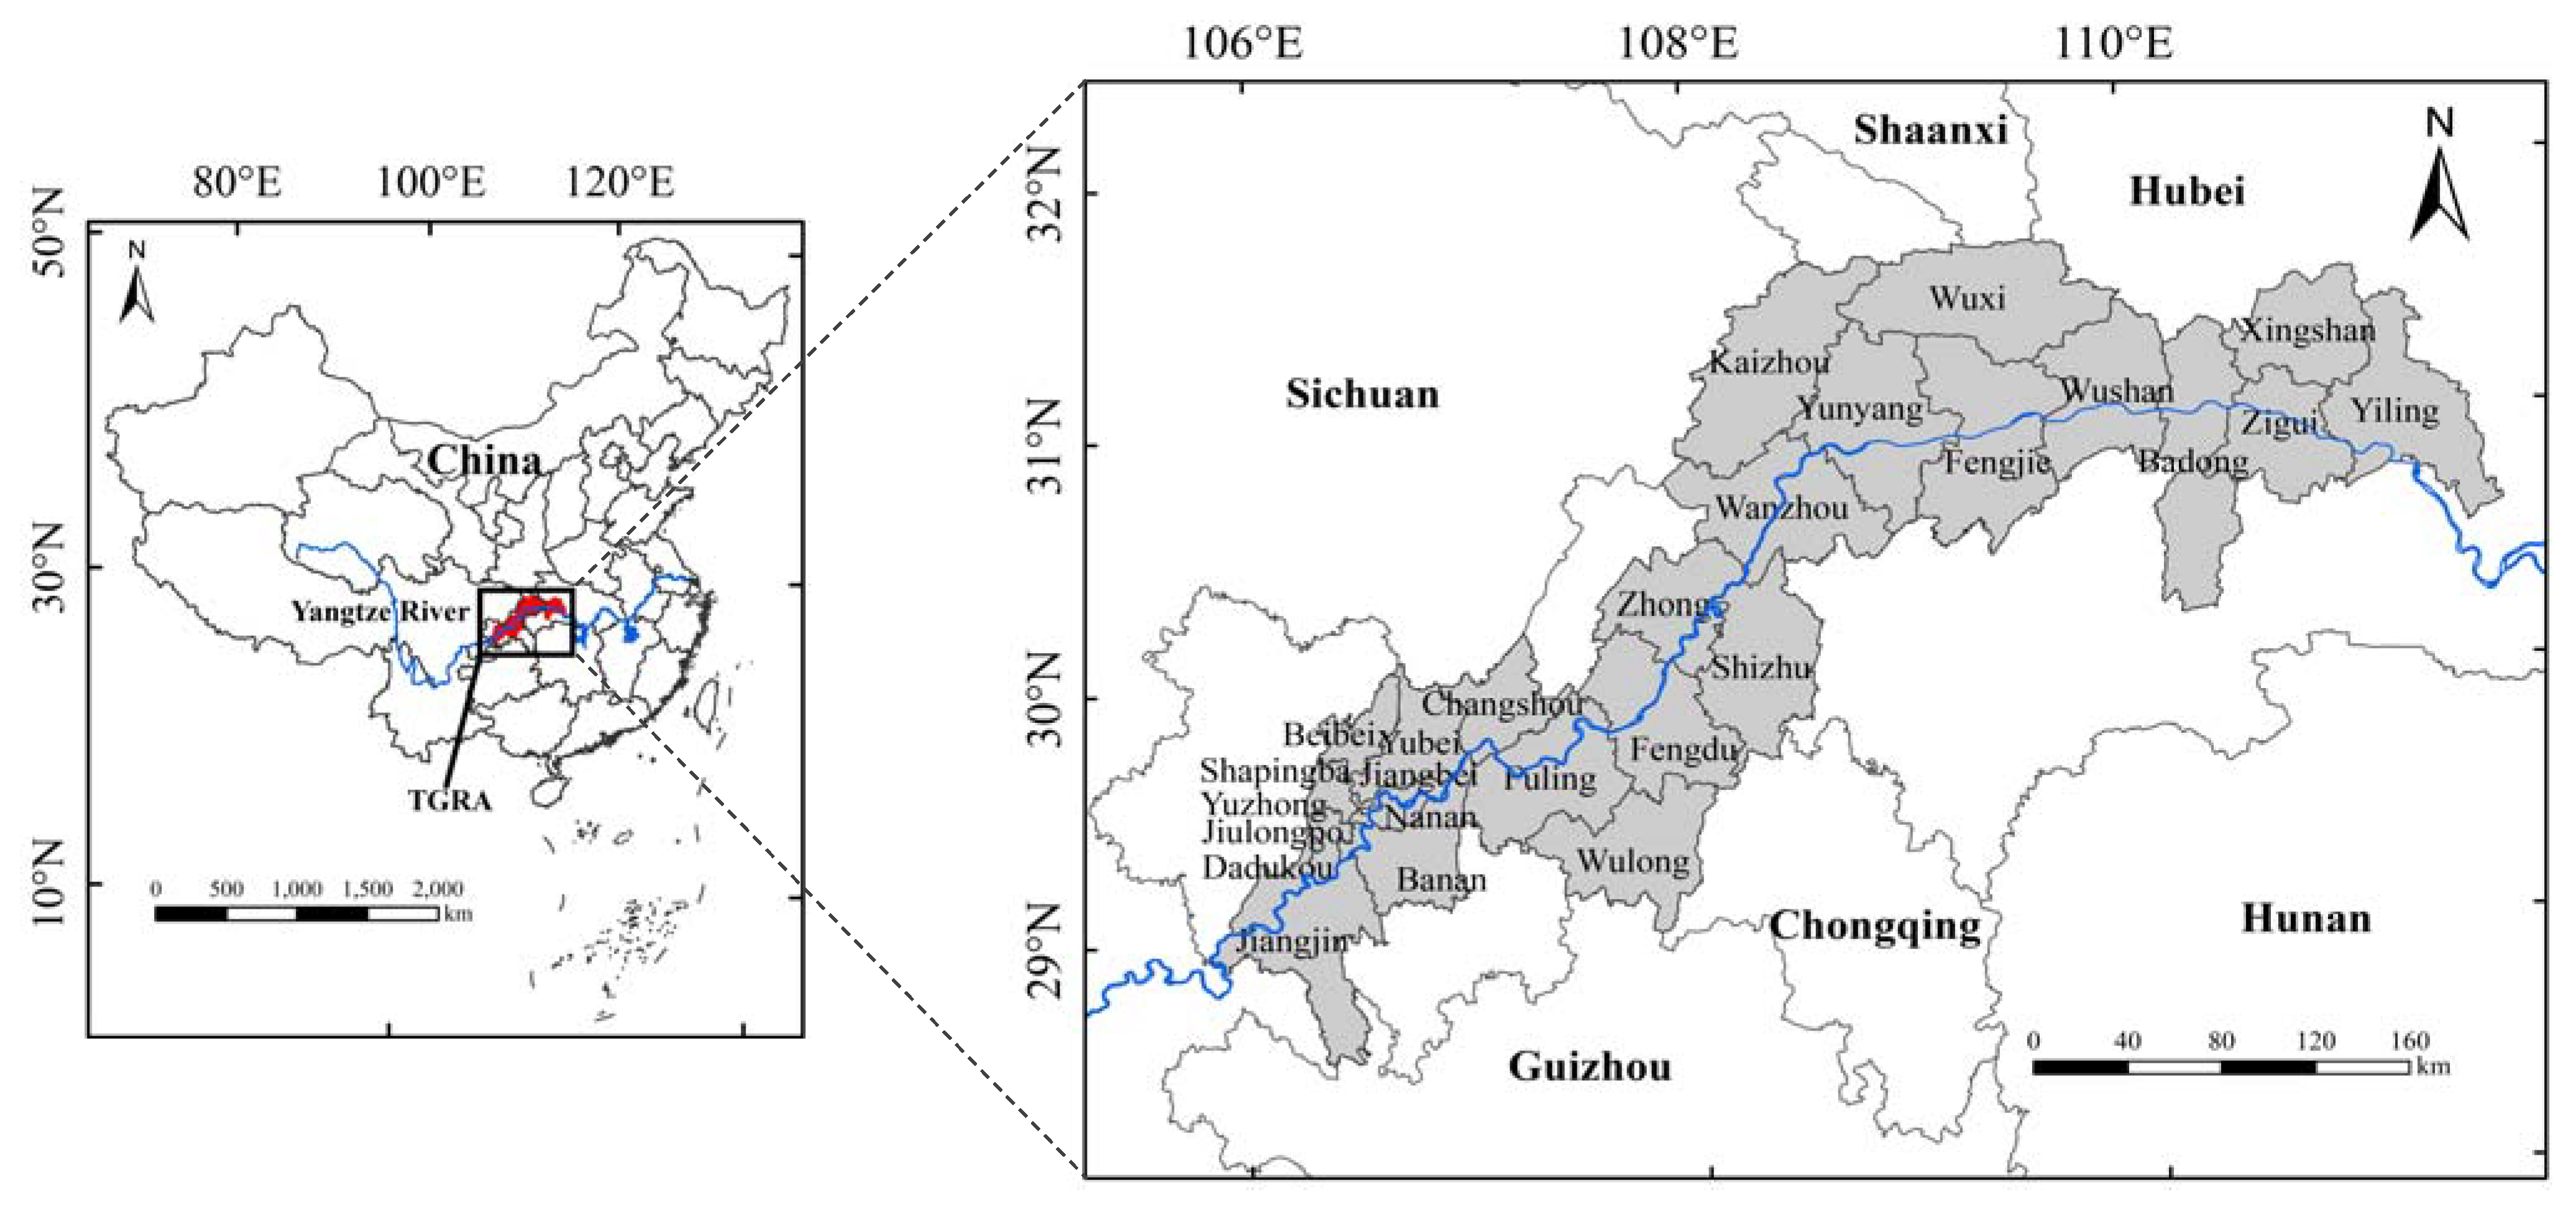
2.1. Study Area

The Yangtze River TGRA refers to the area flooded by the construction of the Three Gorges Hydropower Station, which required the relocation of many residents. With a total area of about 58,000 km2 and a geographical range of 28°52′ N–31°72′ N, 105°82′ E–111°66′ E [26], it consists of four districts and counties in Hubei Province and 22 districts and counties in Chongqing (Figure 1). The region has a subtropical monsoonal humid climate with four distinct seasons and average annual rainfall of 1000–1400 mm, concentrated in April–September [27]. Its average annual temperature is 17 °C–19 °C. The landscape is dominated by mountains and hills, accounting for 74% and 21.7% of the total reservoir area, respectively [28]. Soil erosion is severe in the reservoir area, and landslides, mudslides, and earthquakes occur frequently [29]. In 2018, the resident population of the TGRA was 21,025,900, with an urbanization rate of 64.42% and a per capita disposable income of USD 4119. This is slightly lower than the average per capita disposable income of USD 4266 in China. The study area is rich in tourism resources, including natural landscapes such as mountains, water, gorges, forests, and springs, as well as in cultural attractions such as traditional houses, festivals, ethnic costumes, and music in areas where ethnic minorities, such as the Shizhu and Badong, gather [30]. There are 177 A-class scenic spots, including 13 5A scenic spots, such as Dazu Rock Carvings, Three Gorges Dam, and Badong Shenlong Stream. These tourism resources have created favorable conditions for tourism development in the TGRA. In 2018, the region received 564,096,800 tourists accounting for 21% of the total number of tourists received in China and generated USD 39.58 billion, which accounted for 21% of the total tourism revenue. In recent years, tourism development in the TGRA has faced both opportunities and challenges under the national development strategies of Yangtze River Economic Belt, One Belt One Road, and All-for-One Tourism. In 2018, the region received a total of 564,096,800 tourists accounting for 21% of the total number of tourists received in China and generating a total tourism income of USD 39.58 billion, which accounted for 21% of the total tourism revenue.

2.2. Data Sources

The basic data for this study included statistical data and remote sensing data. Statistical data were mainly obtained from municipal and county-level statistical yearbooks; some data came from statistics and bulletins provided by the relevant government departments. Thirty-three indicators (e.g., natural population growth rate, urbanization rate, and tourist growth rate) were extracted from the statistical yearbooks of Chongqing and the corresponding districts and counties in Hubei Province (i.e., Chongqing Statistical Yearbook, Yichang Statistical Yearbook, Enshi Prefecture Statistical Yearbook, and China County Statistical Yearbook). Annual precipitation and underground water resources were obtained from the Chongqing Water Resources Bulletin, Enshi Prefecture Water Resources Bulletin, and Yichang Water Resources Bulletin. Data for the following were obtained by submitting “Government Information Disclosure Applications” to the relevant municipal government departments: the area of built-up areas (from the Housing and Urban–Rural Development Commissions of Chongqing, Enshi Prefecture, and Yichang), the area of planted forests (from the Forestry Bureau of Chongqing, the Forestry Bureau of Enshi Prefecture, and the Forestry and Garden Bureau of Yichang), and wastewater and waste gas emissions (from the Ecological Environment Bureaus of Chongqing, Enshi Prefecture, and Yichang). Information about A-class tourist attractions came from the following official websites: the Chongqing Culture and Tourism Development Committee (http://whlyw.cq.gov.cn/, accessed on 2 April 2021), Enshi Tujia and Miao Culture and Tourism Bureau (http://wtxgj.enshi.gov.cn/, accessed on 2 April 2021), and Yichang Culture and Tourism Bureau (http://whly.yichang.gov.cn/, accessed on 2 April 2021). Missing individual data were interpolated based on adjacent-year values. Regarding remote sensing data, Normalized Difference Vegetation Index (NDVI) data were obtained from the MODIS vegetation index product MOD13Q1 provided by NASA, with a temporal resolution of 16 d and a spatial resolution of 500 m. Since vegetation in the TGRA is the most luxuriant around August, NDVI data for August 2010, 2014, and 2018 were selected. The MOD13Q1.HDF data were concatenated using MRT (MODIS Reprojection Tool) and then projected, mosaicked, cropped, and resampled in ArcGIS.

2.3. Construction of Evaluation Index System

A combined SEE-PSR framework was adopted based on previous studies [8,31]. Combining the vulnerability concept with the actual situation of the study area, an evaluation system comprising 46 indicators was constructed based on the principles of scientific, systematic, typical, and accessible index selection (Table 1). This evaluation system aimed to comprehensively reflect the pressures faced by tourism-based SESs, the present state, and the dynamic response measures in each study period.

2.4. Entropy Method

2.4.1. Data Standardization

To eliminate the problem of different dimensions among the indicator data, the raw data needed to be standardized. Since positive and negative vulnerability indicators have different effects on tourism-based SESs, the range standardization method was used to deal with the positive and negative indicators, as follows:
positive indicator:
X i j = X i j λ j min λ j max λ j min , ( i = 1 , 2 , n ; j = 1 , 2 , m ) ,
negative indicator:
X i j = λ j max X i j λ j max λ j min , ( i = 1 , 2 , n ; j = 1 , 2 , m ) ,
where x i j is the standardized value of the jth indicator of the ith year of a district or county, x i j is the original value of the jth indicator of the ith year of a district or county, and λ j max and λ j min are the maximum and minimum value of the original data of the jth indicator of all years of a district or county.

2.4.2. Determining the Indicator Weights

The entropy method is an objective weighting method that determines weight coefficients based on the amount of information carried by each evaluation factor. It avoids interference from subjective factors and overcomes information overlap between indicators. Therefore, this study used the entropy method to assign weights to each vulnerability index; the calculation steps and formulas are as follows:
weight of the jth indicator value in ith year:
Y i j = X i j / i = 1 m X i j ,
indicator information entropy:
e j = k i = 1 m ( Y i j × ln Y i j ) , k = 1 ln m , 0 e 1 ,
information entropy redundancy:
d j = 1 e j ,
indicator weight coefficient:
w j = d j / j = 1 n d j ,
where m is the evaluation year, and n is the number of indicators.

2.5. Composite Vulnerability Index

The composite vulnerability index [33] was used to calculate the composite vulnerability of 26 districts and counties; it is calculated as follows:
single-indicator vulnerability index:
S i j = w j × X i j ,
composite vulnerability index of a district and county in the ith year:
S i = j n S i j .

2.6. Vulnerability Classification

Since the criteria for classifying the vulnerability of tourism-based SESs are not unified, referring to the literature (e.g., on urban vulnerability [34] and ecological vulnerability [35]), this study combined the study area’s vulnerability characteristics to classify the vulnerability index into five levels: S i 0.36 is low vulnerability, 0.36 < S i 0.45 is moderately low vulnerability, 0.45 < S i 0.54 is moderate vulnerability, 0.54 < S i 0.63 is moderately high vulnerability, and 0.63 < S i is high vulnerability.

2.7. Geodetector

Geodetector is a recent statistical method developed by Professor Wang et al. [36] of the Chinese Academy of Science to detect spatially stratified heterogeneity and reveal the driving forces behind it. It includes the four modules of factor detection: interaction detection, risk detection, and ecological detection. This method has been extensively utilized in the literature [37,38]. It is a software that is compiled by Excel and easy to use. Besides, it can be downloaded for free from the following website: http://www.geodetector.cn/ (accessed on 2 April 2021). The independent variables in Geodetector that are continuous need to be discretized into the type of variables for spatial partitioning. Thus, the K-means clustering algorithm was used in this study. Moreover, factor detection and interaction detection were used to analyze the intensity of influence of each influencing factor on the vulnerability of the TGRA system. The core idea of the two detectors is that the relevant factors, which has affected the vulnerability of the TGRA system, are spatially different [39]. A certain factor has significant spatial consistency with the distribution of the vulnerable TGRA system, which means that this factor is of significantly decisive significance to the spatial distribution of the vulnerability of the TGRA system.
(1) Factor detection was used to measure the influence of each influencing factor on the vulnerability of tourism-based SESs, modeled as follows:
q = 1 1 N σ 2 h = 1 L N h σ h 2 ,
where q is the effect of the influencing factor on system vulnerability; L is the number of subregions; N h and N are the number of cells in layer h and the study area as a whole, respectively; σ h 2 and σ 2 are the variance in layer h and the study area as a whole, respectively; and q has a value range of [0, 1]—the larger the value, the stronger the effect of the influencing factor on system vulnerability, and vice versa.
(2) Interaction detection was used to detect whether the influencing factors X 1 and X 2 could act together to increase or decrease the effect on system vulnerability. The interactions could be divided into five categories (Table 2).

3. Results

3.1. Overall Vulnerability of the SESs in the Study Area

3.1.1. Vulnerability of Subsystems

From 2010 to 2018, the mean value of the social subsystem vulnerability index showed a continuous decreasing trend (Table 3), with a decrease of 47.83%. Its maximum value was 0.2927 in Fuling in 2010; its minimum value was 0.0797 in Xingshan in 2018. The number of people receiving the subsistence security allowance and the unemployment rate in the whole study area first decreased and then increased from 2010 to 2018. Furthermore, with the development of the tourism economy, the density of tourists increased from 47,162 to 147,058 persons/km2, and the ratio of tourists to local residents increased from 8:1 to 30:1, placing greater pressure on the social system and the regional carrying capacity of the tourism destinations. However, with the growth of local fiscal funds from USD 15.61 billion to USD 37.08 billion; investment in transportation, education, and social security; and an increase in tertiary industry employees from 3.7947 million to 6.0284 million, pressure from internal and external sources combined with a series of response measures eventually shaped the social subsystem vulnerability in a rapid and then slowly declining process.
The mean value of the economic subsystem vulnerability index also continued to decline, showing a significantly larger decline from 2010 to 2014 than from 2014 to 2018. The maximum value was 0.2362 in Shizhu in 2010, and the minimum value was 0.0916 in Wanzhou in 2014. From 2010 to 2018, the regional GDP of the whole study area increased from USD 92.93 billion to USD 255.17 billion. Fiscal revenues increased from USD 8.76 billion to USD 21.12 billion, the per capita GDP increased from USD 4590 to USD 10,108, the per capita disposable income of urban and rural residents increased by about 2.36 times, and the Engel’s coefficient decreased by 17.95%. These favorable factors all helped weaken the vulnerability of the economic subsystem in the study area, as economic strength increased and living standards improved. In addition, the economic density of tourism increased from 1974 to 73,659,600 yuan/km2, and the proportion of total tourism revenue to GDP increased from 9.80% to 24.05%. While this highlights the important role of tourism in promoting the economic development of the TGRA, it also points to the possibility of vulnerability and volatility, especially in the period following a crisis event.
The mean value of the ecosystem vulnerability index showed a “rising and then falling” trend. The maximum value was 0.2242 in Fengdu in 2014, and the minimum was 0.0704 in Nanan in 2018. From 2010 to 2018, the total retail sales of consumer goods and total wastewater discharge increased, going up by 138.88% and 54.44%, respectively. Thus, with the socioeconomic development of the area’s tourist destinations, resource consumption and pollution increased the pressure on and vulnerability of the ecosystem. However, there has also been increased awareness of energy conservation and environmental protection among governments, residents, tourists, and factories in the tourist areas. This is seen in the increasing rate of urban domestic sewage treatment (from 85.59% to 92.02%). Moreover, waste gas emissions showed a trend of rising then falling—from 1.2302 million tons in 2010 to 2.347 million tons in 2014, and then down to 1.2378 million tons in 2018. The trajectory of the good air quality rate is the opposite of that of total emissions; in fact, the good air quality rate in 2018 was 2.01% higher than in 2010.

3.1.2. Composite Vulnerability of SESs

The mean value of the composite vulnerability index of the SESs decreased from 2010 to 2018 by 42.37%. The evolution of its vulnerability level was in the order of moderately high vulnerability–moderate vulnerability–moderately low vulnerability. The maximum value was 0.6468 in Badong in 2010, and the minimum was 0.3219 in Xingshan in 2018. The situations for subsystems with the highest vulnerability varied from year to year. Among them, the social subsystem progressed the fastest, changing from the most vulnerable subsystem to the least vulnerable one, with the largest coefficient of variation (0.3381). Meanwhile, the ecological subsystem had the smallest coefficient of variation, indicating that it was more stable than the other subsystems. From 2014 to 2018, the economic subsystem showed a small decrease in vulnerability, thus leading it to becoming the most vulnerable subsystem in 2018. The mean value of the multiyear composite vulnerability index in the study area was 0.4849, which is moderately vulnerable.

3.2. Spatiotemporal Evolution and Vulnerability Characteristics of Tourism-Based SESs in Counties

3.2.1. Spatiotemporal Evolution Characteristics of the Vulnerability Types of the SESs

From 2010 to 2014, there was an overall decreasing trend in the vulnerability of the area’s districts and counties (Figure 2). Spatially, the dominant vulnerability type shifted from moderately high to moderate vulnerability, with moderately low and moderate vulnerability replacing high vulnerability. In 2010, there were 4 districts and counties with high vulnerability, 15 with moderately high vulnerability, and 7 with moderate vulnerability. In 2014, there were 4 districts and counties with moderately high vulnerability, 14 with moderate vulnerability, and 8 with moderately low vulnerability. Wulong had the largest decreases in vulnerability, and Badong, Fuling, and Dadukou decreased from high vulnerability to moderately low vulnerability as well. However, Changshou and Yubei rose from moderate vulnerability to moderately high vulnerability. Zigui, Yiling, Banan, Yuzhong, Shapingba, and Jiangbei had no differences in level, showing moderately high and moderate vulnerability. Other districts and counties decreased by 1–2 vulnerability levels. The highest value of vulnerability decreased from 0.6468 in Badong to 0.5779 in Yubei, and the lowest value decreased from 0.4767 in Yuzhong to 0.3975 in Dadukou (Figure 3).
The overall vulnerability level of the districts and counties also showed a decreasing trend from 2014 to 2018. Spatially, the dominant vulnerability type shifted from moderate to moderately low vulnerability, with low and moderately low vulnerability replacing moderately high vulnerability. There were 4 districts and counties with moderately high vulnerability, 14 with moderate vulnerability, and 8 with moderately low vulnerability in 2014. Meanwhile, there were 6 districts and counties with moderate vulnerability, 15 with moderately low vulnerability, and 5 with low vulnerability in 2018. Zigui, Xingshan, Kaizhou, Zhong, Changshou, Yubei, Banan, and Jiangjin all decreased by two levels, containing types ranging from low to moderately high vulnerability. Wanzhou, Shizhu, and Nanan rose from moderately low to moderate vulnerability. Wushan, Fengjie, Yuzhong, Shapingba, Dadukou, and Jiangbei had no differences in level, showing moderately low and moderate vulnerability. Other districts and counties decreased by one vulnerability level each. The highest vulnerability value was reduced from 0.5779 in Yubei to 0.5013 in Wanzhou, and the lowest was reduced from 0.3975 in Dadukou to 0.3219 in Xingshan.
In addition, based on the characteristics of the numerical changes in the vulnerability of each district and county from 2010 to 2018, they can be divided into gradually declining, stable, and fluctuating. First, the districts and counties belonging to the gradually declining type were Xingshan, Yiling, Badong, Wushan, Wuxi, Fengjie, Yunyang, Kaizhou, Zhong, Fuling, Fengdu, Wulong, Banan, Jiangjin, Beibei, Jiulongpo, and Dadukou. These 17 districts and counties had an average drop of 36.10%, among which Zhong and Yunyang had the largest and smallest drops of 46.47% and 18.96%, respectively. Second, the districts and counties belonging to the stable type were Yuzhong, Shapingba, and Jiangbei; the coefficients of variation of their composite vulnerability indexes were 0.0233, 0.0805, and 0.0329, respectively. This shows that these three districts had better stability. Finally, six districts and counties belonged to the fluctuating type, among which Wanzhou, Shizhu, and Nanan showed a decreasing and then increasing change process, while Zigui, Changshou, and Yubei showed the opposite process.

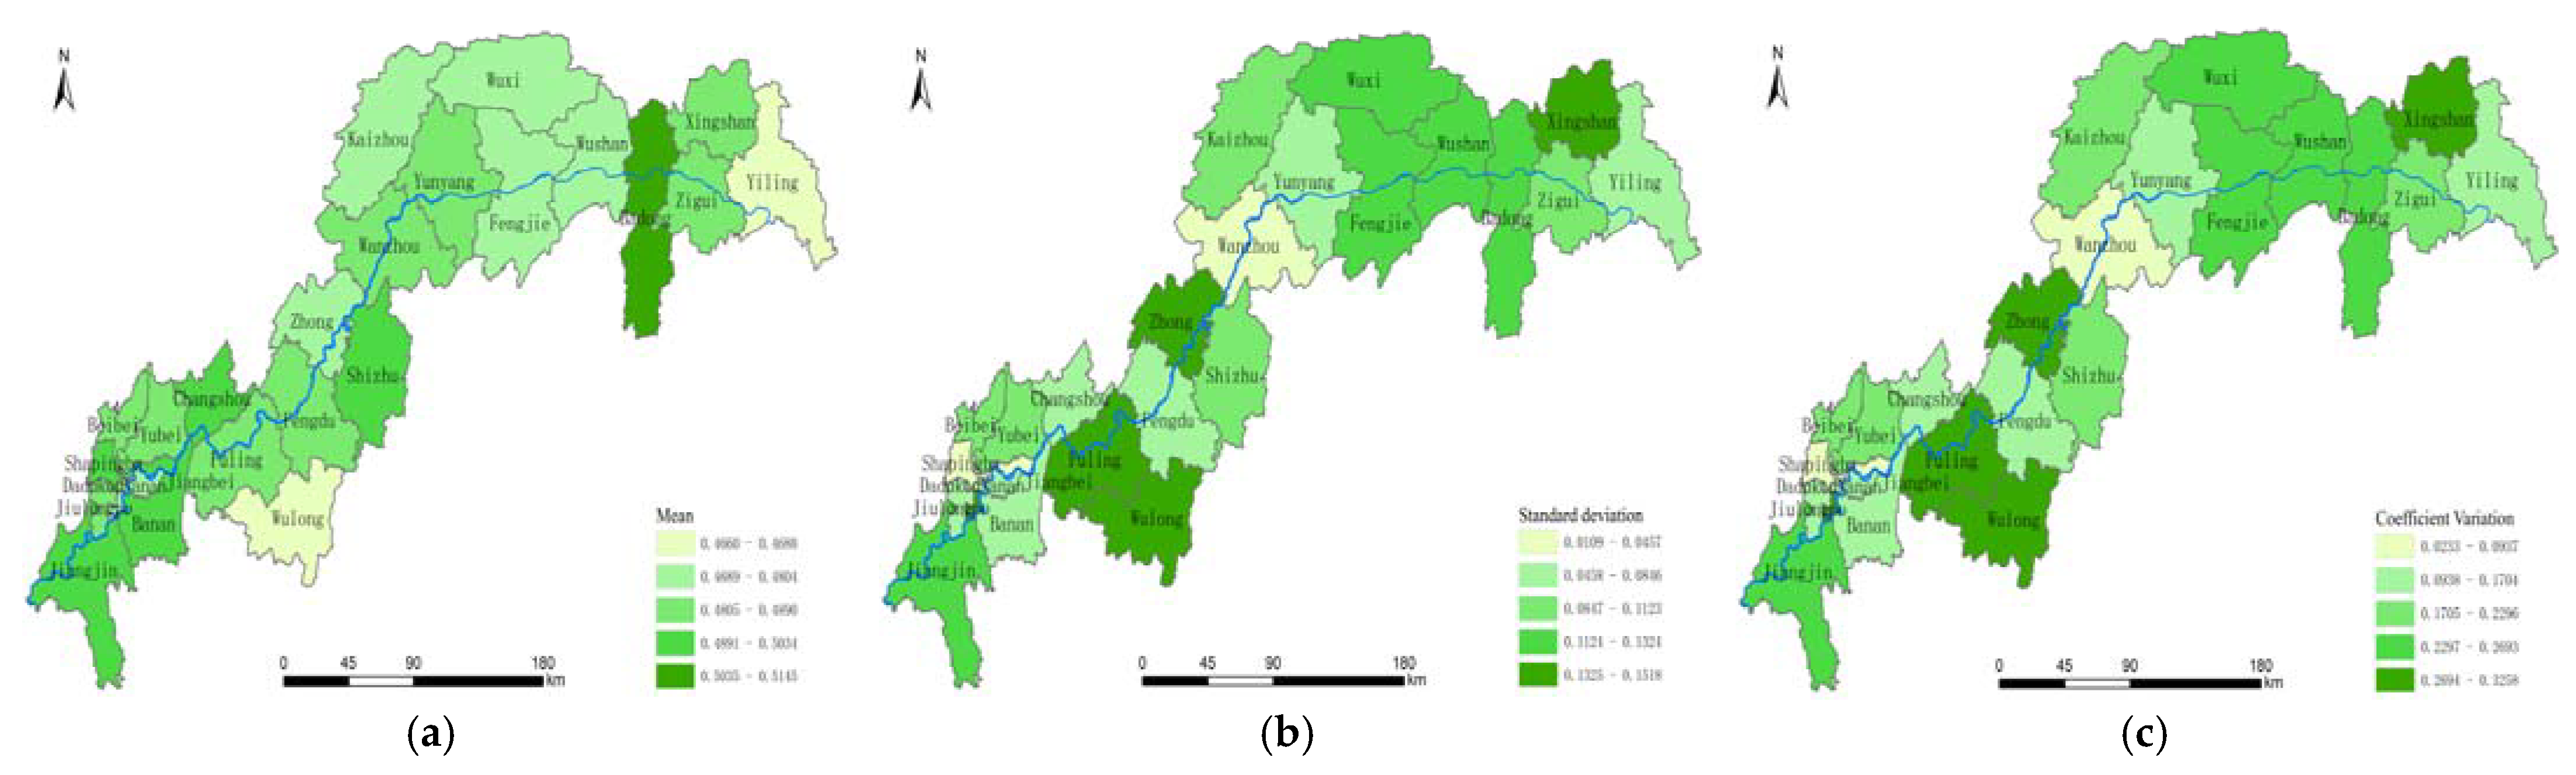
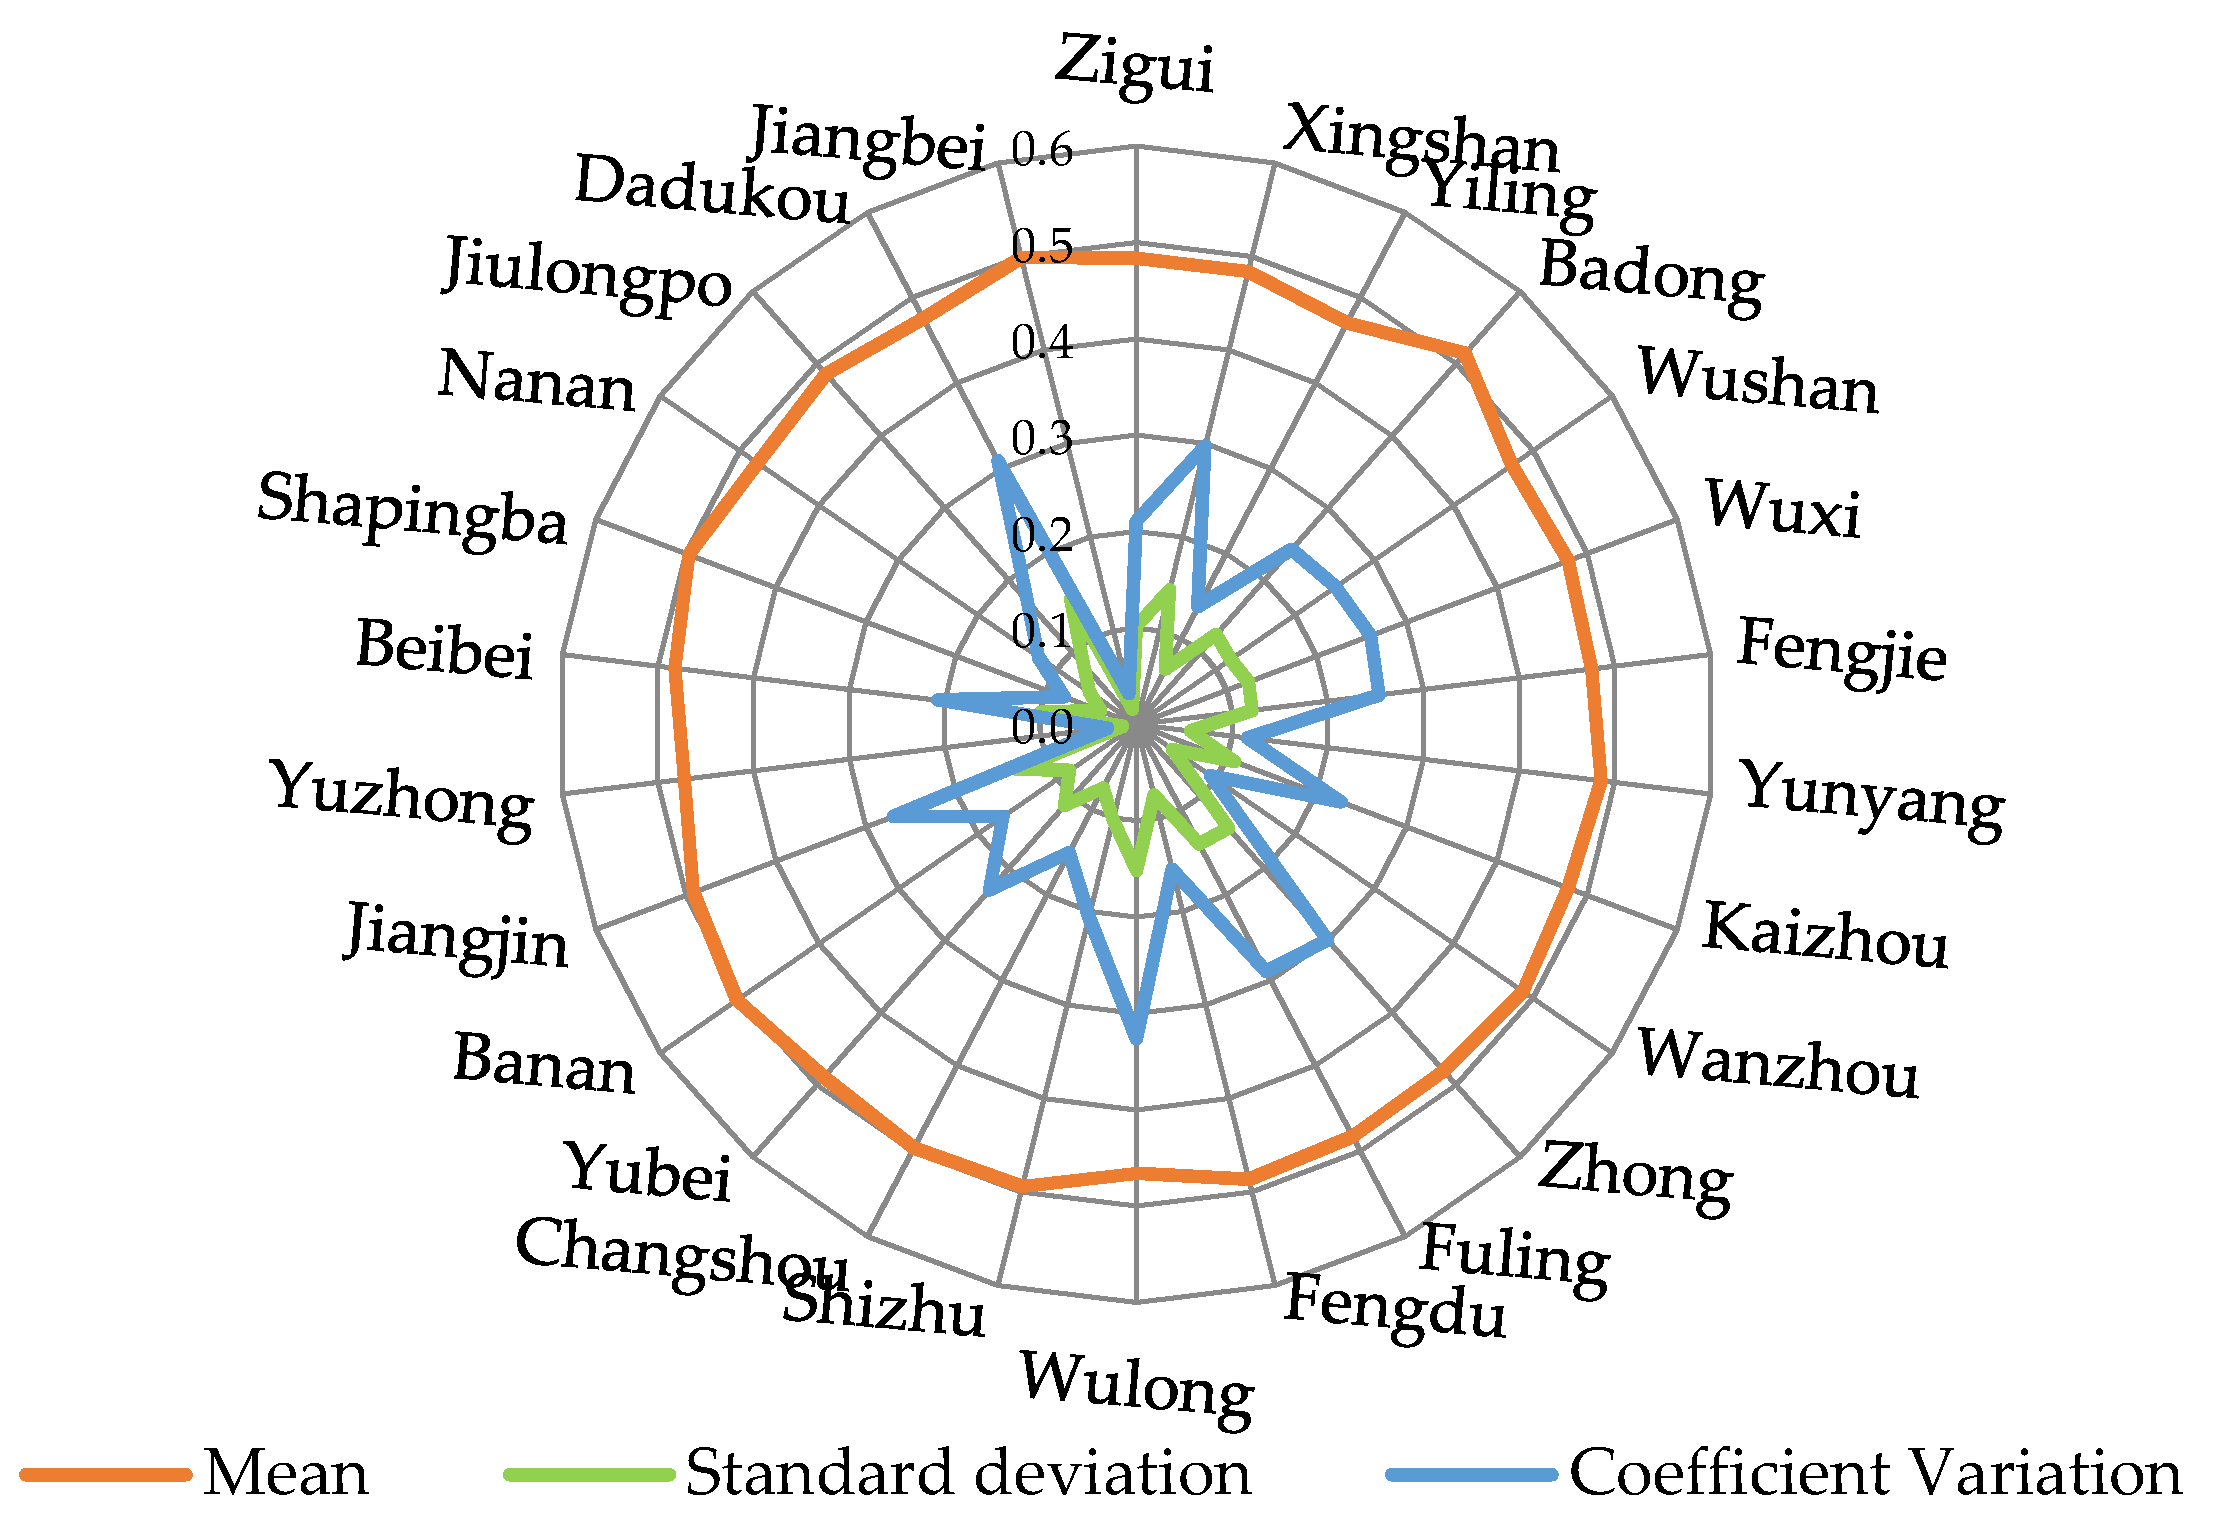
3.2.2. Spatial Variation Characteristics of the Vulnerability of SESs among Counties

Calculating the mean value of the composite vulnerability of each district and county during the study period (Figure 4), it can be seen that Badong (0.5145) and Banan (0.5034) were in the top two positions while Yiling (0.4704) and Wulong (0.4660) were at the bottom. Similarly, the standard deviation and coefficient of variation were calculated to reflect the absolute and relative differences among the districts and counties during the study period (Figure 4). As shown in Figure 5, the standard deviation and coefficient of variation of Yuzhong were the smallest, with values of 0.0109 and 0.0233, indicating the smallest dispersion and smallest variation of vulnerability. However, the standard deviation and coefficient of variation of Wulong were the largest, with values of 0.1518 and 0.3258. The coefficients of variation for the whole study area were 0.0898, 0.1052, and 0.1230 in 2010, 2014, and 2018, respectively. This shows that the relative differences in vulnerability among counties were small but gradually increasing. The mean values of the standard deviation and coefficient of variation of the composite vulnerability index for all districts and counties over the study period were 0.0956 and 0.1976, respectively. It is noteworthy that the mean value of the composite vulnerability of Wulong was the smallest among all districts and counties, but its standard deviation and coefficient of variation were the largest. This difference is consistent with the actual situation in which Wulong has risen and developed rapidly as a result of tourism. Specifically, in 2007, the Southern China Karst (with the Wulong Karst as one of its three components) applied to become a World Natural Heritage Site, and, in 2011, Wulong was reconfirmed as a 5A tourist attraction. Since then, Wulong’s popularity has increased dramatically, attracting a large number of tourists and thus leading to the high vulnerability of its SESs. Later, Wulong gradually decreased to low vulnerability under the combined effects of a series of response measures.

3.3. Factors Influencing the Vulnerability of SESs in the Study Area

3.3.1. Main Influencing Factors

Based on the q values of each influencing factor calculated by Geodetector, the top 10 indicators in 2010, 2014, and 2018 were selected as the main factors affecting the vulnerability of SESs in the counties of the TGRA in descending order (Table 4). The top 10 influencing factors from 2010 to 2018 had numerical evolutions of the vulnerability indicators within the social, economic, and ecological subsystems of 4-3-7, 3-3-3, and 3-4-0, respectively. This indicates that social subsystem vulnerability was the main cause of SES vulnerability. In addition, the numerical evolutions of the vulnerability indicators within the pressure, state, and response layers were 4-3-4, 2-1-2, and 4-6-4, respectively, indicating that system vulnerability was caused by a lack of power in the response layer and an overload in the pressure layer. Notably, the growth rates of tourist number (V3), fiscal expenditure amount (V12), population density (V33), accommodation and catering business volume (V31), industrial structure diversification index (V32), and forest coverage rate (V39) all appeared twice, indicating that they were more likely to contribute to system vulnerability than other factors. Therefore, adopting relevant response measures will help reduce the system vulnerability of the study area, such as improving tourism reception capacity, increasing financial investment (e.g., to improve livelihoods and public service facilities), improving the star level and service quality of accommodations and catering, diversifying the industrial structure, continuing to increase the forest coverage rate, and moderately controlling the population density of tourist destinations.

3.3.2. Interactions between Factors

Due to the large amount of data and limited space, the overall interactions are summarized, and some data characteristics are explained. In 2010, the types of interactions between factors included 542 groups of two-factor enhancement types and 493 groups of nonlinear enhancement types, indicating that any two-factor interaction will increase the vulnerability of the study area. The top 10 groups of interaction factors, represented by green space per capita (V43) and domestic wastewater treatment rate (V45), were all nonlinear enhancement types (Table 5); their interaction values were higher than 0.8 and showed high interaction effects. When the proportion of school students to the resident population (V5), urban registered unemployment rate (V10), social security and employment expenditure to total fiscal expenditure (V14), total retail sales of consumer goods (V34), and domestic sewage treatment rate (V45) interacted with other factors, the number of groups with interaction values higher than 0.8 were six, five, five, five, and five, respectively. This indicates that they are more likely to interact than other factors. The year 2014 included 221 groups of two-factor enhancement types and 814 groups of nonlinear enhancement types. The top 10 groups of interaction factors, represented by the growth rate of the number of tourists (V3) and the ratio of the number of school students to the resident population (V5), were also nonlinear enhancement types. When the proportion of education expenditure to total fiscal expenditure (V15), domestic sewage treatment rate (V45), proportion of school students to the resident population (V5), number of rated road miles (V11), and Engel’s coefficient (V21) interacted with other factors, the number of groups with interaction values higher than 0.8 were three, three, two, two, and two, respectively. The year 2018 included 400 groups of two-factor enhancement types and 635 groups of nonlinear enhancement types. The first 10 groups of interactions included three groups of two-factor enhancement types represented by the growth rate of the number of tourists (V3) and the share of social security and employment expenditures in total fiscal expenditures (V14), as well as seven groups of nonlinear enhancement types represented by the growth rate of the number of tourists (V3) and the density of tourists (V7). When the share of social security and employment expenditures in total fiscal expenditures (V14), growth rate of tourist numbers (V3), natural population growth rate (V1), and urban registered unemployment rate (V10) interacted with other factors, the number of groups with interaction values higher than 0.8 were 21, 15, 6, and 4, respectively.
From 2010 to 2018, the interaction type was mainly the nonlinear enhancement type, supplemented by two-factor enhancement types, and the mean value of the interaction (0.5604, 0.4854, 0.5253) decreased and then increased. Therefore, adopting comprehensive response measures will help reduce the negative effects of increasing the interaction values. Such measures can include continuously improving the reception and service capacity of tourist destinations, enhancing their ability to prevent and cope with tourism risks, expanding the number of miles of district and county-level roads (or building direct highways to tourist attractions in districts and counties with high tourism development), increasing financial investment in education development, creating more jobs, providing vocational skills training, encouraging residents to work in the tourism service industry, controlling the natural population growth rate, increasing the incomes of local residents, and improving locals’ consumption structure.

4. Discussion and Conclusion

4.1. Discussion

(1)
Constructing a sound evaluation index system and selecting a suitable research method are the foundations of evaluation-focused research [8,40]. Based on the vulnerability concept, previous literature, and the principles of indicator selection, this study constructed a comprehensive evaluation system consisting of 46 indicators, aiming to reflect the actual vulnerability status of the study area as much as possible. This study then calculated the vulnerability values of each system and its subsystems using the entropy method, which is an objective assignment method and composite index method. Despite the rationality of this research process, some limitations exist. These include a lack of a deep understanding of vulnerability; moreover, the rationality of the selection of indicators and methods need to be justified and tested. Considering that some studies [41,42] have used multiple weighting methods at the same time, it is proposed that, if a certain vulnerability evaluation supports important decision-making or special needs, a multimethod, multi-indicator, or multiscale approach could be used to ensure the scientificity and feasibility of the results.
(2)
There are few studies on vulnerability in the TGRA. Research has mainly been conducted from a single perspective, such as farmers’ livelihoods, agriculture, the drawdown zone environment, landslide hazard risk, or ecological and economic vulnerability. Ma [43], for example, evaluated the ecological vulnerability of the TGRA from 2001 to 2010. Comparing the present study’s findings with that study’s spatial distribution map of ecological vulnerability in 2010, we found that the two maps basically matched, albeit with some differences. The differences could be due to the fact that Ma selected more indicators with “natural attributes” while the present study selected more indicators under the influence of human society according to the SEE-PSR model. Thus, the vulnerability of Wulong, Wuxi, Fengjie, and Wushan, which are mainly mountainous areas, is higher in the present study. From 2010 to 2014, the mean system vulnerability and economic subsystem vulnerability of the TGRA showed a decreasing trend, which is consistent with Liu et al. [40]. The difference, however, is that the SEE vulnerability in Chongqing in Liu’s study showed a spatial distribution feature of high in the west and low in the northeast and southeast. In the present study, however, no specific distribution feature was formed. The reason for this difference could be because Liu et al. assigned higher weights to the ecological subsystems, such that the northeastern and southeastern regions of Chongqing—which have better natural conditions, higher vegetation cover, and less human activity—had lower vulnerability while the more developed western regions had higher vulnerability. In addition, the higher comprehensiveness of the evaluation index system and the smaller relative differences in weights among the subsystems may be important reasons for the insignificant spatial distribution characteristics in this study.
(3)
SESs vulnerability in tourism destinations deserves more attention and in-depth study. With the overall positive development of tourism worldwide, there are increasing flows of people, materials, capital, and information between tourism-based SESs and the external environment. This positively affects local socioeconomic development, facilitates cultural exchange, increases employment opportunities, and alleviates poverty. However, excessive tourism development and poor resource protection have exacerbated conflicts among populations, environments, resources, and development. Therefore, enhancing tourism destinations’ resilience to stresses and risks while reducing the vulnerability of their systems will contribute to regional sustainable development. Given the complexity and dynamics of tourism-based SESs [8,16], it is difficult to accurately measure their vulnerability. Evaluation research on their vulnerability is still in the process of exploration, validation, and revision with regard to evaluation index system construction, research method selection, concept cognition, threshold determination, and influencing factors. Additional work in this area will therefore deepen the theory and methods of vulnerability research.
(4)
The Geodetector model has both advantages and disadvantages. The model is good at detecting spatial heterogeneity and revealing the driving forces behind it; thus, it was employed to analyze the factors affecting the vulnerability of SESs in the TGRA as a whole. However, its properties also hindered analyzing the factors that affected vulnerability in each district and county. Therefore, future work can explore and simulate the factors affecting the vulnerability of each district and county, the influencing mechanism of the vulnerability of tourism-based SESs, and future vulnerability scenarios in each area.

4.2. Conclusions

Adopting an SEE-PSR model, this study constructed an evaluation system comprising 46 indicators to analyze the spatiotemporal evolutionary characteristics and influencing factors of the vulnerability of SESs in the TGRA using the composite index method and Geodetector. The main conclusions are as follows: (1) From 2010 to 2018, the mean value of the composite vulnerability index of the TGRA was 0.4849, which is a moderate vulnerability state. (2) The system vulnerability of the study area gradually decreased from moderately high vulnerability to moderately low vulnerability, and the vulnerability of socioeconomic subsystems showed a continuous decreasing trend while the ecological subsystem shows a trend of rising then falling. (3) The spatiotemporal evolution of vulnerability in counties showed obvious differences. In terms of the vulnerability types of districts and counties, high vulnerability and moderately high vulnerability types kept decreasing, and moderately low vulnerability and low vulnerability types kept increasing, while moderate vulnerability showed a trend of increasing and then decreasing. In addition, changes in the system vulnerability of districts and counties could be divided into gradually decreasing, stable, and fluctuating. Spatially, the relative differences in vulnerability among counties were small but gradually increasing. (4) The factor detection results showed that system vulnerability was mainly caused by the social subsystem but also by a lack of power in the response layer and an excessive load in the pressure layer. Six factors, including the growth rate of the number of tourists and the amount of fiscal expenditure, were more likely to contribute to system vulnerability than other factors. (5) The interaction detection results showed that the interaction type was mainly the nonlinear enhancement type, supplemented by the two-factor enhancement type, and the mean value of interaction showed a trend of decreasing and then increasing.
This study focused on the vulnerability of special tourism-based social-ecological systems in the context of rapid global tourism development. It exploratively constructed a tourism-based vulnerability evaluation index system and used it for an empirical investigation. In this way, this study may enrich theoretical approaches and practical cases in vulnerability research. In addition, this study clarified the extent, spatiotemporal evolution characteristics, and main influencing factors of the vulnerability of SESs in the TGRA. This study suggests that the response measures intended to reduce regional vulnerability and enhance the ability of tourism destinations to resist pressure and risk will contribute to regional sustainable development.

Author Contributions

Conceptualization, J.T. and S.L.; methodology, J.T.; investigation, J.T. and P.Q. (Puyan Qin); writing—original draft preparation, J.T. and P.Q. (Puyan Qin); writing—review and editing, Y.Y., S.L. and Q.L.; visualization, P.Q. (Pengwei Qi); supervision, S.L.; funding acquisition, Y.Y. All authors have read and agreed to the published version of the manuscript.

Funding

This research was funded by the National Social Science Foundation of China, grant number 18XSH013.

Institutional Review Board Statement

Not Applicable.

Informed Consent Statement

Not Applicable.

Data Availability Statement

The data used in this study are available from the corresponding author upon request. The data are not publicly available due to privacy restrictions.

Acknowledgments

Special thanks to the municipal and county-level government departments in the Three Gorges Reservoir Area for providing statistical data and Feitong, Zhai’s help in the early visualization of this research.

Conflicts of Interest

The authors declare no conflict of interest.

References

  1. Turner, B.L.; Kasperson, R.E.; Matson, P.A.; McCarthy, J.J.; Corell, R.W.; Christensen, L.; Eckley, N.; Kasperson, J.X.; Luers, A.; Martello, M.L.; et al. A framework for vulnerability analysis in sustainability science. Proc. Natl. Acad. Sci. USA 2003, 100, 8074–8079. [Google Scholar] [CrossRef] [Green Version]
  2. Roberts, M.G.; Yang, G.A. The international progress of sustainable development research: A comparison of vulnerability analysis and the sustainable livelihoods approach. Prog. Geogr. 2003, 22, 11–21. [Google Scholar]
  3. Timmerman, P. Vulnerability, Resilience and the Collapse of Society: A Review of Models and Possible Climatic Applications; Environmental Monograph 1; Institute for Environmental Studies, University of Toronto: Toronto, Canada, 1981. [Google Scholar]
  4. McCarthy, J.J.; Canziani, O.F.; Leary, N.A.; Dokken, D.J.; White, K.S. Climate change 2001: Impacts, adaptation and vulnerability. In Proceedings of the Third Assessment Report of the IPCC, Geneva, Switzerland, 13–16 February 2001. [Google Scholar]
  5. Moran, E.; Ojima, D.S.; Buchman, B.; Canadell, J.G.; Coomes, O.; Graumlich, L.; Jackson, R.; Jaramillo, V.; Lavorel, S.; Leadley, P.; et al. Global land project: Science plan and implementation strategy. In Proceedings of the The 6th Open Meeting of IGBP, Bonn, Germany, 9–13 October 2005. [Google Scholar]
  6. Paleo-Torres, A.; Gurley, K.; Pinelli, J.P.; Baradaranshoraka, M.; Zhao, M.W.; Suppasri, A.; Peng, X.L. Vulnerability of Florida residential structures to hurricane induced coastal flood. Eng. Struct. 2020, 220, 111004. [Google Scholar] [CrossRef]
  7. Li, H.; Zhang, P.Y. Research progress and prospective applications of vulnerability approach under global change. Prog. Geogr. 2011, 30, 920–929. [Google Scholar]
  8. Wang, Q.; Yin, M.H.; Yang, X.Z.; Yao, Z.Z. Spatio-temporal evolution and impact mechanism of socio-ecological system vulnerability in poor mountainous tourist destinations: Taking dabie mountain area as example. Acta Geogr. Sin. 2019, 74, 1663–1679. [Google Scholar]
  9. Alcamo, J.; Acosta-Michlik, L.; Carius, A.; Eierdanz, F. A new approach to quantifying and comparing vulnerability to drought. Reg. Environ. Chang. 2008, 8, 137–149. [Google Scholar] [CrossRef]
  10. Carpenter, S.R.; Bennett, E.M.; Peterson, G.D. Scenarios for ecosystem services: An overview. Ecol. Soc. 2006, 11, 29–43. [Google Scholar] [CrossRef]
  11. Rapicetta, S.; Zanon, V. GIS-based method for the environmental vulnerability assessment to volcanic ashfall at Etna Volcano. Geoinformatica 2009, 13, 267–276. [Google Scholar] [CrossRef]
  12. Holling, C.S. Understanding the complexity of economic, ecological, and social systems. Ecosystems 2001, 4, 390–405. [Google Scholar] [CrossRef]
  13. Farrell, B.H.; Twining-Ward, L. Reconceptualizing tourism. Ann. Touris. Res. 2004, 31, 274–295. [Google Scholar] [CrossRef]
  14. Petrosillo, I.; Zurlini, G.; Grato, E.; Zaccarelli, N. Indicating fragility of socio-ecological tourism- based systems. Ecol. Indic. 2006, 6, 104–113. [Google Scholar] [CrossRef]
  15. Zhao, H. A review on the adaptability of tourism and social-ecosystem. J. Serv. Sci. Manag. 2018, 11, 565–577. [Google Scholar] [CrossRef] [Green Version]
  16. Chen, Y.L.; Yang, X.J.J. Tourism social-ecological systems and resilience research. J. Arid Land. Resour. Environ. 2011, 25, 206–211. [Google Scholar]
  17. Kates, R.W. Environment and development. Sustain. Sci. 2001, 292, 641–642. [Google Scholar]
  18. Sharpley, R. The tsunami and tourism: A comment. Curr. Issues Tour. 2005, 8, 344–349. [Google Scholar] [CrossRef]
  19. Calgaro, E.; Lloyd, K.; Dominey-Howes, D. From vulnerability to transformation: A framework for assessing the vulnerability and resilience of tourism destinations. J. Sustain. Tour. 2014, 22, 341–360. [Google Scholar] [CrossRef]
  20. Cole, S.; Browne, M. Tourism and water inequity in Bali: A social-ecological systems analysis. Hum. Ecol. 2015, 43, 439–450. [Google Scholar] [CrossRef]
  21. Chen, J.; Yang, X.J.; Yin, S.; Wu, K.S. The vulnerability evolution and simulation of the social-ecological systems in the Semi-Arid Area based on the VSD framework. Acta Geogr. Sin. 2016, 71, 1172–1188. [Google Scholar]
  22. Hu, J.X.; Wen, C.H.; Lan, X.J. Analysis and prediction on ecological pressure of economic sustainable development in Three Gorges Reservoir Area: Based on Grey Prediction model. Technol. Econ. 2015, 34, 55–60. [Google Scholar]
  23. Jiang, J.D.; Song, H.B. Situation of urbanization development in Three Gorges Reservoir Area and countermeasures. Yangtze River. 2015, 46, 67–70. [Google Scholar]
  24. Shi, J.Y. The realistic problems and thinking of the Three Gorges Reservoir Area in Chongqing rural human settlements ecological construction. Ecol. Econ. 2015, 31, 167–172. [Google Scholar]
  25. Chen, Y.R.; Xiao, W.F. Research progress on land use and ecological environment change in the Three Gorges Reservoir Area. Ecol. Sci. 2017, 36, 213–221. [Google Scholar]
  26. Wang, D.J.; Wei, H.Y.; He, M.; Gu, Q.; Ma, M.G.; Li, J. Temporal and spatial patterns of ecosystem services value in the Three Gorges Reservoir Area based on land use. Resour. Environ. Yangtze Basin. 2020, 29, 90–100. [Google Scholar]
  27. Zheng, J.T.; Peng, T.; Dong, X.H.; Liu, J.; Chang, W.J.; Lin, Q.X.; Wang, J.B. Evolution characteristics of meteorological drought and assessment of risk of disaster factors in the Three Gorges Reservoir Area. Res. Soil Water Conserv. 2020, 27, 213–220. [Google Scholar]
  28. Yang, Y.F.; Li, J.L. Spatial-temporal characteristics of urban household solid waste production and discharge amount in Three Gorges Reservoir Area. J. Chongqing Norm. Univ. Nat. Sci. 2019, 36, 55–61. [Google Scholar]
  29. Li, H.; Tan, M.; Jiang, W.; He, C.H. Spatiotemporal characteristics of coupling economic development and ecological environment in Three Gorges Reservoir Area. Bull. Soil Water Conserv. 2020, 40, 243–249. [Google Scholar]
  30. Cao, H.S.; Cheng, C.J. Identification of the non-optimal tourism regions in the Three Gorges Area and its development approach. Econ. Geogr. 2014, 34, 187–192. [Google Scholar]
  31. Zhou, B.; Zhong, L.S.; Chen, T.; Zhang, A.P. Spatio-temporal pattern and obstacle factors of ecological security of tourism destination: A case of Zhejiang province. Sci. Geogr. Sin. 2015, 35, 599–607. [Google Scholar]
  32. Wang, Q.; Lu, L.; Yang, X.Z. Study on measurement and impact mechanism of socio-ecological system resilience in Qiandao Lake. Acta Geogr. Sin. 2015, 70, 779–795. [Google Scholar]
  33. Turvey, R. Vulnerability assessment of developing countries: The case of small-island developing states. Dev. Policy Rev. 2007, 25, 243–264. [Google Scholar] [CrossRef]
  34. Fang, C.L.; Wang, Y.; Fang, J. A comprehensive assessment of urban vulnerability and its spatial differentiation in China. J. Geogr. Sci. 2016, 26, 153–170. [Google Scholar] [CrossRef]
  35. Yang, J.; Guan, Y.Y.; Li, X.M.; Xi, J.C. Urban fringe area ecological vulnerability space-time evolution research: The case of Ganjingzi District, Dalian. Acta Ecol. Sin. 2018, 38, 778–787. [Google Scholar]
  36. Wang, J.F.; Xu, C.D. Geodetector: Principle and prospective. Acta Geogr. Sin. 2017, 72, 116–134. [Google Scholar]
  37. Zheng, D.F.; Wang, J.Y.; Li, Y.; Jiang, J.C.; Lyu, L.T. Spatial-temporal variation of water resources stress and its influencing factors based on water-saving in China. Sci. Geogr. Sin. 2021, 41, 157–166. [Google Scholar]
  38. Wan, J.; Zhang, L.; Yan, J.; Wang, X.; Wang, T. Spatial–temporal characteristics and influencing factors of coupled coordination between urbanization and eco-environment: A case study of 13 urban agglomerations in China. Sustainability 2020, 12, 8821. [Google Scholar] [CrossRef]
  39. Wang, J.F.; Hu, Y. Environmental health risk detection with geogdetector. Environ. Modell. Softw. 2012, 33, 114–115. [Google Scholar] [CrossRef]
  40. Liu, C.; He, Q.; Li, Y. Spatiotemporal evaluation of socio-ecological-economic system vulnerability: A county-level analysis of Chongqing, China. Sustainability 2020, 12, 3912. [Google Scholar] [CrossRef]
  41. Dhamija, V.; Shukla, R.; Gornott, C.; Joshi, P. Consistency in vulnerability assessments of wheat to climate change—A district-level analysis in India. Sustainability 2020, 12, 8256. [Google Scholar] [CrossRef]
  42. Li, B.; Su, F.; Yang, Z.; Han, Z.L.; Peng, F. Vulnerability-based analysis of the spatial-temporal dynamic patterns of the human-sea territorial system of the Bohai-rim region, China. Acta Ecol. Sin. 2018, 38, 1436–1445. [Google Scholar]
  43. Ma, J.; Li, C.X.; Wei, H.; Ma, P.; Yang, Y.J.; Ren, Q.S.; Zhang, W. Dynamic evaluation of ecological vulnerability in the Three Gorges Reservoir Region in Chongqing municipality, China. Acta Ecol. Sin. 2015, 35, 7117–7129. [Google Scholar]
Figure 1. Study area.
Sustainability 13 04008 g001
Figure 2. Spatiotemporal evolution of the vulnerability of the SESs in each tourist destination. (a) 2010; (b) 2014; (c) 2018.
Sustainability 13 04008 g002
Figure 3. Composite vulnerability index of the SESs by tourist destination in 2010, 2014, and 2018.
Sustainability 13 04008 g003
Figure 4. Spatil difference in the vulnerability of the SESs by tourist destination. (a) mean; (b) standard deviation; (c) coefficient of variation.
Sustainability 13 04008 g004
Figure 5. Mean, standard deviation, and coefficient of variation in the vulnerability of the SESs by tourism destination.
Sustainability 13 04008 g005
Table 1. Vulnerability evaluation index system for tourism-based social-ecological systems (SESs) under a social–economic–ecological and pressure–state–response (SEE-PSR) framework.
System LayerCriteria LayerIndex LayerIndicator Description and PropertyWeight
Social vulnerabilityPressureV1 Natural growth rate of population (‰)Reflects the local population growth rate (+)0.0229
V2 Urbanization rate (%)Reflects the urbanization process (+)0.0178
V3 Growth rate of number of tourists (%)Reflects tourists’ growth rate (+)0.0256
V4 Number of people receiving the subsistence security allowance (people)Reflects the social pressure (+)0.0259
V5 Number of students in primary and secondary schools as a proportion of resident population (%)Reflects the social pressure (+)0.0256
V6 Number of criminal cases filed (people)Reflects the regional safety level (+)0.0209
StateV7 Tourist density (people/km2)Reflects tourist pressure (+)0.0209
V8 Number of workers in tertiary sector (104 people)Reflects service industry development level (−)0.0233
V9 Ratio of tourists to local residentsReflects the population structure (+)0.0208
V10 Urban unemployment registration rate (%)Reflects employment level (+)0.0238
ResponseV11 Number of miles of rated roads (km)Reflects transportation accessibility (−)0.0186
V12 Total financial expenditure (104 yuan)Reflects financial spending strength (−)0.0206
V13 Number of hospital bedsReflects medical infrastructure status (−)0.0201
V14 Share of social security and employment expenditures in total fiscal expenditures (%)Reflects the strength of social security and employment support (−)0.0206
V15 Share of education expenditure in total fiscal expenditure (%)Reflects the strength of education support (−)0.0232
V16 Built-up area (km2)Reflects the scale of construction land (−)0.0217
Economic vulnerabilityPressureV17 Tourism revenue growth rate (%)Reflects the economic growth rate of tourism (+)0.0262
V18 All disposable income per capita (yuan)Reflects the level of disposable income of the population (+)0.0196
V19 GDP per capita (yuan)Reflects the level of economic development (+)0.0190
V20 Tourism economic density (104 yuan/km2)Reflects economic pressure from tourism (+)0.0230
StateV21 Engel’s coefficient (%)Reflects residents’ living standards (+)0.0214
V22 Total tourism revenue (104 yuan)Reflects the economic benefits of tourism (−)0.0177
V23 Total tourism revenue as a proportion of GDP (%)Reflects the position of the tourism economy in the national economy (+)0.0217
V24 Added value of agriculture, forestry, animal husbandry, and fishery as a proportion of GDP (%)Reflects the position of agriculture in the national economy (+)0.0207
V25 Added value of industry as a proportion of GDP (%)Reflects the position of industry in the national economy (−)0.0228
ResponseV26 Tourism growth elasticity coefficientReflects the role of tourism growth in promoting economic growth (+)0.0284
V27 Total fiscal revenue (104 yuan)Reflects regional financial strength (−)0.0223
V28 Gross regional product (104 yuan)Reflects the total economic volume (−)0.0192
V29 Total investment in fixed assets (104 yuan)Reflects the amount of capital investment (−)0.0208
V30 Balance of deposits of financial institutions (104 yuan)Reflects the capital reserve of financial institutions (−)0.0196
V31 Business volume of accommodation and catering industry (104 yuan)Reflects the ability of accommodations and catering to meet tourist demand (−)0.0200
V32 Industrial structure diversification indexReflects the reasonableness of the industrial structure (−)0.0227
Ecological vulnerabilityPressureV33 Population density (people/km2)Reflects local population pressure (+)0.0197
V34 Total retail sales of social consumer goods (104 yuan)Reflects consumer waste disposal pressure (+)0.0187
V35 Annual precipitation (Mm)Reflects landslide risk due to rainfall (+)0.0263
V36 Total wastewater discharge (104 ton)Reflects ecological pressure due to wastewater discharge (+)0.0227
V37 Regional environmental noise value (db)Reflects noise disturbance conditions (+)0.0208
V38 Total exhaust gas emissions (104 ton)Reflects ecological pressure due to exhaust emissions (+)0.0220
StateV39 Forest coverage rate (%)Reflects the level of vegetation cover (−)0.0206
V40 Good air quality rate (%)Reflects the air quality condition (−)0.0262
V41 Amount of underground water resources (108m3)Reflects the potential for groundwater-induced landslides (+)0.0198
ResponseV42 Share of social security and employment expenditures in total fiscal expenditures (%)Reflects environmental protection and new energy utilization (−)0.0184
V43 Green space per capita (m2)Reflects habitat status (−)0.0238
V44 Artificial forestation area (ha)Reflects the status of artificially restored vegetation (−)0.0200
V45 Domestic sewage treatment rate (%)Reflects the sewage treatment level (−)0.0233
V46 Investment in environmental pollution treatment (104 yuan)Reflects investment in pollution control (−)0.0204
Note: (1) “+” and “−” indicate positive and negative correlations between the indicators and system vulnerability. To a certain extent, the definition of the nature of the indicators, of both its positive and negative effects, is subjective and relative. For example, the tourism growth elasticity coefficient, which is the most weighted indicator in this study, reflects the degree to which tourism income growth rate contributes to GDP growth rate. The higher the value is, the greater the tourism economy contributes to the GDP growth in the study area. However, what is emphasized in this study is that the instability of the tourism economy will not benefit from the steady growth of the GDP in the study area. In addition, it is also emphasized in this article that there is the possibility of landslides and floods under the circumstance of precipitation in the TGRA. (2) Tourism economic density = total tourism revenue/total land area [8]. (3) Tourism growth elasticity coefficient = tourism revenue growth rate/GDP growth rate [32]. (4) The industrial structure diversification index D is calculated as D = t = 1 n P t log P t , where P t is the proportion of the output of each industry, and n is the number of industries [21].
Table 2. Types of interaction between two covariates.
Graphical RepresentationCriterionInteraction
Sustainability 13 04008 i001 q ( X 1 X 2 ) < M i n ( q ( X 1 ) , q ( X 2 ) ) Nonlinear weakening
Sustainability 13 04008 i002 M i n ( q ( X 1 ) , q ( X 2 ) ) < q ( X 1 X 2 ) < M a x ( q ( X 1 ) , q ( X 2 ) ) Single-factor nonlinear weakening
Sustainability 13 04008 i003 q ( X 1 X 2 ) > M a x ( q ( X 1 ) , q ( X 2 ) ) Two-factor enhancement
Sustainability 13 04008 i004 q ( X 1 X 2 ) = q ( X 1 ) + q ( X 2 ) Independent
Sustainability 13 04008 i005 q ( X 1 X 2 ) > q ( X 1 ) + q ( X 2 ) Linear enhancement
Note: M i n ( q ( X 1 ) , q ( X 2 ) ) : gets the minimum value from q ( X 1 ) , q ( X 2 ) ; M a x ( q ( X 1 ) , q ( X 2 ) ) : gets the maximum value from q ( X 1 ) , q ( X 2 ) ; q ( X 1 ) + q ( X 2 ) : q ( X 1 ) , q ( X 2 ) are summed; q ( X 1 X 2 ) : q ( X 1 ) , q ( X 2 ) interact.
Table 3. Mean of the vulnerability index of tourism-based SESs and their subsystems in 2010, 2014, and 2018.
Vulnerability Index.201020142018
SESs0.57060.48330.4008
Social subsystem0.23060.15640.1186
Economic subsystem0.19410.15270.1503
Ecological subsystem0.14600.17420.1319
Table 4. Top 10 factors influencing the vulnerability of tourism-based SESs in 2010, 2014, and 2018.
Factor201020142018
qp qp qp
V340.6216 0.6135 V310.4807 0.9208 V30.5128 0.9792
V390.4474 1.0000 V450.4412 0.6275 V140.5116 0.9963
V30.4434 1.0000 V110.4074 0.8952 V10.4929 0.9456
V120.4299 0.2719 V390.3979 0.9997 V300.3984 1.0000
V40.4278 0.9997 V50.3611 0.6566 V130.3458 0.9998
V80.3772 0.9842 V270.3164 1.0000 V320.3448 1.0000
V330.3742 1.0000 V170.3032 1.0000 V60.3155 0.9897
V310.3659 0.9957 V440.2898 1.0000 V70.2996 1.0000
V320.3531 0.9998 V330.2482 1.0000 V200.2929 1.0000
V280.3484 0.9986 V120.2457 0.9996 V90.2896 1.0000
Table 5. Top 10 groups of interactions for the vulnerability of tourism-based SESs in 2010, 2014, and 2018.
201020142018
Factor
Interaction
Interaction
Value
Value
Comparison
Interaction
Result
Factor
Interaction
Interaction
Value
Value
Comparison
Interaction
Result
Factor
Interaction
Interaction
Value
Value
Comparison
Interaction
Result
V43∩V450.8995>V43 + V45NEV3∩V50.8650>V3 + V5NEV3∩V140.9380>max(V3, V14)BE
V27∩V430.8990>V27 + V43NEV13∩V450.8465>V13 + V45NEV3∩V70.9160>V3 + V7NE
V34∩V430.8883>V34 + V43NEV15∩V450.8441>V15 + V45NEV3∩V270.9155>V3 + V27NE
V10∩V120.8874>V10 + V12NEV11∩V130.8276>V11 + V13NEV3∩V200.9116>V3 + V20NE
V14∩V340.8818>V14 + V34NEV6∩V450.8262>V6 + V45NEV3∩V390.9016>V3 + V39NE
V14∩V270.8741>V14 + V27NEV12∩V150.8255>V12 + V15NEV3∩V90.9012>V3 + V9NE
V14∩V330.8723>V14 + V33NEV11∩V170.8148>V11 + V17NEV1∩V170.8997>V1 + V17NE
V14∩V390.8712>V14 + V39NEV5∩V290.8110>V5 + V29NEV1∩V30.8950>max(V1, V3)BE
V10∩V370.8632>V10 + V37NEV14∩V310.8105>V14 + V31NEV3∩V60.8927>V3 + V6NE
V11∩V130.8547>V11 + V13NEV5∩V430.8096>V5 + V43NEV13∩V140.8903>max(V13, V14)BE
Publisher’s Note: MDPI stays neutral with regard to jurisdictional claims in published maps and institutional affiliations.

