Abstract
The process to define the 2023–2027 Common Agricultural Policy (CAP) is underway. The implementation model governing the process requires each EU Member State to design a National Strategic Plan to deliver operational actions exploiting the synergies under the two pillars of the policy. Each Plan must be built from an evidence-based needs assessment that undergoes rigorous prioritisation and planning to create comprehensive, integrated, and achievable interventions. In Italy, the success of this planning process requires all interested stakeholders to generate options for the regional authorities who plan, manage, and legislate agricultural activities. This research proposes a decision-making technique, based on the cumulative voting approach, that can be used effectively when multiple persons from different backgrounds and perspectives are engaged in problem-solving and needs prioritisation. The results indicate that the model can be applied both theoretically and practically to prioritise Strategic Plan needs that involve national and regional authorities. Validation of the model allows it to be used in the next consultative processes and for expansion to socioeconomic stakeholders.
1. Introduction
In 2018, the European Commission proposed [1] a new architecture for the Common Agricultural Policy (CAP). Termed ‘the new delivery model’, it is based on National Strategic Plans (NSPs) developed by EU Member States (MSs). The Commission called for each MS to design a single NSP capable of supporting the two principal CAP goals—direct income/market support and rural development. The plan specified nine objectives ([1], article 6), divided into three groups (economic, environmental, and social), plus one cross-cutting objective on knowledge and innovation for which synergistic and operational measures must be described. The new delivery model has several aims, including improved policy effectiveness to meet its objectives, eased access to support for its beneficiaries, and enhanced plan governance through reduced EU-level rules and controls to focus on results. As the structure intended, it gives MSs greater manoeuvrability to respond to their specific needs and contexts. Some experts [2,3,4,5] have even suggested that the NSP is the most crucial element among the legislative proposals of the Commission. In fact, when compared to the past, the change transfers a relevant amount of responsibility to MSs, allowing them to design more freely and implement their own strategies to fit within EU-level defined objectives [6].
To date, trilogues among the Commission, Parliament, and Council continue, while MSs have targeted the development of their national CAP Strategic Plans to meet a submission, final Commission approval, and entrance into force timeline of January 2023 [7]. Meeting this challenge requires engaging a broad partnership to define an intervention logic for NSP design. This process contains four main steps, i.e., (1) diagnostic and context analysis, (2) SWOT analysis and needs assessment using the 9 + 1 Specific Objectives, (3) prioritisation of needs and quantification of targeted result indicators, and (4) establishment of a strategy to integrate interventions as each intervention may be linked to more than one Specific Objective [2]. Simultaneously, the process must be conducted with a participatory and transparent approach ([1], article 94) that involves and allows for feedback from regional and autonomous province administrations through national institutional and legal framework procedures.
During the next CAP programming cycle, assuming confirmation of the Commission’s proposal, Italy will have to identify the priority needs at the national level. The technical analyses used in the steps outlined above are both known and understood. Where the biggest challenges lie in Italy, and in France, Germany, and Spain, is how to involve regional administrations in the process to frame the needs identification and prioritisation processes. In Italy, Rural Development Programmes (RDPs) are managed regionally and are currently in the 2014–2020 planning period (now extended to 2022) [8]. Moreover, in addition to developing a single national plan from the needs and interventions identified at the sub-national level, Italy must create a plan that spans its wide variety of agro-ecosystems and rural landscapes.
Achievement of this goal will require integration of the need to build a coherent, unified NSP with a clear national political vision and the need to represent the priorities expressed by the regional authorities of the various territories. Figure 1 is a schematic of the process co-developed by the Ministry of Agricultural, Food, and Forestry Policies (MIPAAF) and the National Rural Network (NRN) that will be completed in the following months to attain validation of final needs and priorities. This study, aimed at informing steps 1 (declaration of the level of priority of needs) and 2 (aggregation of the assessments expressed in step 1), analyses and tests the prioritised needs that resulted from a cumulative model.
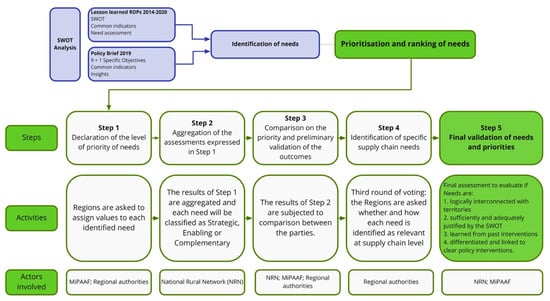
Figure 1.
Process to validate assessed needs and priorities in Italy. Source: authors’ elaborations.
Aggregation of the needs expressed by regional authorities is a complex task. This study aims to support decision making based on knowledge gleaned using a voting aggregation technique (Cumulative Voting) and to develop a method to assess prioritisation among items and a priori policy needs of equal priority [9]. In particular, the voting technique addresses three operational objectives, namely, (1) analysis of current methods for stakeholder to participate in the expression and aggregation of their voting intentions; (2) design of a theoretical model that uses a participatory approach to share a prioritisation process, even under conditions such as the COVID-19 pandemic; and (3) assessment of the strengths, weaknesses, and potential policy implications of the model given its methodology.
2. Theoretical Framework
Decision makers must often choose among competing options when asked to allocate a fixed budget across many projects. A common approach used for this allocation of decisions is the prioritisation of the available options [10]. The output of prioritisation-based decision making does not result in a single chosen alternative; instead, it produces a list of options ranked from most to least important. In this way, the ranking represents the preferences of an individual relative to other available options [11]. While a single decision-maker can effectively prioritise, more formal prioritisation processes are typically associated with working groups (‘group prioritisation’). Indeed, prioritising projects, interventions, and/or needs is the kind of complex problem that can benefit from the involvement of different experts. Similarly, prioritisation can also be used when multiple priorities of various individuals must be combined into a single priority list, as it is necessary in the next CAP programming period. At that time, direct involvement of regional and autonomous province administrations will be required for prioritisation of needs.
The key challenge for using participatory approaches in prioritisation processes is to find a suitable approach for making shared decisions that will respond to individual needs and build consensus among the different parties with differing economic, social, environmental interests, and cultural values. Consensus-building processes typically involve voting procedures as a means by which to infer collective choice from individual preferences [12]. The theory behind a voting process to aggregate individual preferences relies on the assumption that each individual is able to express preferences by ranking a set of options without contradiction.
Mathematicians, political scientists, economists, and others have all proposed various methods for aggregating results that closely align with the real distribution of the differing opinions of various stakeholders, such as majority rule, scored dot voting, and cumulative voting (CV) [13,14]. Table 1 displays four major taxonomies, ranked from less to more informative, used to describe the results given by prioritisation techniques—nominal, ordinal, interval, and ratio scales.

Table 1.
The four prioritisation method taxonomies. Source: Authors’ elaborations from [15,16].
- -
- Nominal scale techniques categorise items into groups according to perceived importance, such as ‘very important’, ‘somewhat important’, etc. Even though nominal scales are usually easy to use, they do not allow differentiation of relative importance among items in the same group. Examples of popular nominal-level techniques are the ‘Top 10’ and MoSCoW methods (acronym of M-Must have S-Should have C-Could have W-Won’t have).
- -
- Ordinal scale techniques produce a list of items ranked according to their relative importance. These techniques allow for the importance of items to be differentiated, but not to what extent. Numerical assignment and Wieger’s Method are two examples of ordinal scale techniques.
- -
- Interval scales rank items and reveal information on the size of the difference between the ordered options. Interval-level techniques are not commonly employed; however, one notable example is the requirement uncertainty prioritisation approach (RUPA).
- -
- Ratio scales use zero to represent the absolute absence of the measured value, which allows values at any point other than the origin to be multiplied or divided by constants without altering the information divulged by the scale. These scales produce an ordered list of items, in which the ratio between each pair of values is known. Items are typically evaluated on a 0–100 or similar scale, making it easy to quantify their absolute and relative importance. Their ability to order, to determine intervals, relative distances, and ratios between items, and to be used in refined statistical computations, has positioned ratio scale techniques as the most valuable of all prioritisation taxonomies [15,16].
The two most studied ratio-level prioritisation techniques are the analytic hierarchy process (AHP) and cumulative voting (CV). Briefly, AHP [17] and its derived methods, such as the analytic network process (ANP) [18], also known as the pair-wise comparison technique, calculates priorities by comparing all unique item pairs to estimate their relative importance. These methods are highly accurate because they test for judgment consistency. For example, if item A is more important than item B, and item B is more important than item C, then item A must be judged to be more important than item C to maintain process consistency. At the same time, the test for consistency requires many pair-wise comparisons that produce much redundancy, making it especially hard to implement when there are many alternatives [16,19,20]. Studies that compared different prioritisation methods found AHP to be the lowest-ranking technique because it is difficult to handle, not scalable, and time consuming [20,21,22].
CV, also known as multi-voting, dot-voting, or the 100-point method, is a simple and straightforward method for prioritising a list of items [9,23]. In CV, each stakeholder participating in the prioritisation process is given a number of imaginary ‘points’ (e.g., 100 dollars, 8 dots, etc.) for distribution among the items undergoing prioritisation [20]. In its simplest form, stakeholders are free to assign all the points to one item or to distribute them among all or some of the items. Assigning more points to an item raises its priority. In sophisticated variations of the technique, it is possible to insert constraints or to use aggregate and/or weighted values, such as banknotes. CV has been studied and applied in a variety of fields: corporate governance [24], government elections [25], forestry [26], computer science [27], software engineering [28], and innovation [29].
The main advantage of CV is that it is a relatively simple and quick method for producing priorities on a ratio scale [9]. In the aforementioned study comparing five prioritisation methods, CV was identified as being one of the fastest and most accurate of methods that study participants also rated as easy to use [22]. Some disadvantages are associated with CV. The first drawback is common to most prioritisation techniques, wherein the technique becomes harder to use with a large number of items. While the burden is less than that associated with performing many pair-wise comparisons in AHP, stakeholders may lose perspective. Second, the basic form of CV is susceptible to ‘shrewd tactics’. These opportunistic behaviours arise when stakeholders distribute their points based on what they think others will do to raise the priority of their favourite items [20]. For example, if a stakeholder expects others to spread their points among many items, then s/he may assign all her/his points to one pet project to elevate its relevance on the aggregate priority list (called ‘plumping’).
In conclusion, CV represents an appropriate method for conducting prioritisation sessions, including those that involve multiple stakeholders because it is easy to use, and it allows expressive voting with fine-grained information on stakeholder/voter preference intensity. On the other hand, it has some robustness concerns linked to tactical voting when used in its simplest form and requires some cognitive effort when used for lists of many items. However, according to Skowron et al. [30], the gains in expressiveness can outweigh the cognitive burden. Likewise, voters rate its aggregation approach as significantly more satisfactory than other methods with simpler types of inputs.
This discussion would be incomplete without mentioning two setting-related pitfalls that are often used when conducting any participatory selection and prioritisation process. These effects are well described in the social and cognitive psychology literature [31,32,33,34,35,36]. Although meeting face to face, often around a table, is useful for stimulating participant discussion, the associated practice of recording votes on a big whiteboard risks exposing the process to bias from the effects of social pressure and conformity [31]. Authority bias [32] is one of the biases that come into play if participants assign a higher priority to an item sponsored by the most influential group member (see also the highest-paid person opinion (HiPPO) effect) [33]. This effect is present if those voting later are inclined to vote for an alternative previously voted for by others (social proof or bandwagon effects) [34,35]. The second bias, the primacy effect [36], arises from enhanced memory and preference placed on the first elements in a list of alternatives. As a consequence, the first items presented in the prioritisation process may receive more votes simply by virtue of their position on the list [37]. Simple solutions for both problems are to anonymise votes, not to share partial results until voting has finished, and to randomise the presentation of the items for each participant, which is easily performed with ad hoc software tools as opposed to face-to-face meetings.
3. Main Methodological Issues and a Proposed Improved Methodology
A number of methodological issues have been identified from the practice and study of collaborative voting methods in various situations. In fact, understanding the nuances, strengths, and weaknesses of different approaches has generated a list of factors that should be considered when selecting a suitable participatory approach, such as the one needed for the next CAP programming period. These five key elements, viewed as process requirements, are identified and described below:
- The process should be ‘transparent’, both in the expression of individual preferences and in how those preferences will be aggregated to compute the final ranking;
- The process should be ‘easy to understand and execute’, yet simultaneously allow for expressive votes. Expressing preferences in complex domains is cognitively demanding, so the prioritisation method should not burden the decision maker;
- The process should be ‘flexible’ enough to be used and yield coherent results with small, medium, and large sets of items to be prioritised by a range in the count of participants;
- The process should be ‘software-based’, so that stakeholders from different places, or regional administrations in the case of Italy, can be involved. Methods that require face-to-face interaction are impractical and not recommended, especially in the COVID-19 pandemic;
- The process should be able to ‘run iteratively’. The prioritisation of needs specified in CAP is a complex process that requires multiple rounds to refine individual evaluations. Therefore, the method should not be too time-consuming to be run iteratively.
The theoretical framework and five requirements discussed above indicate that CV represents the most promising technique for collective prioritisation. It is the most transparent and easy-to-use method that can capably produce ratio-level results and is relatively unburdened by large lists of items as compared to other techniques. However, its basic version begs for improved adherence to the five elemental requirements and for some of its intrinsic limitations to be minimised. Thus, the ‘constrained cumulative voting’ (CCV) method has been proposed. It contains some upgrades to the standard CV technique: software-based, non-fixed vote counts, reduced participant polarisation, and an enhanced ability to explain prioritisation variability.
The first enhancement offered by CCV over CV is that the entire CCV process is software based to run on the very available Microsoft® Excel® application. This adaptation has multiple advantages, which include (1) the prioritisation pathway can be performed virtually rather than in person; (2) the intra-process potential for human error is reduced while the reproducibility across countries/situations is increased; (3) the need for synchronous interaction is lifted, which frees participants of timeframe pressure and allows adequate time to ponder and/or change their votes; (4) the primacy effect is minimised through automatic randomisation of the options to be prioritised; and (5) social biases are completely eliminated since votes are anonymous and partial results go unseen by participants [38,39].
The second enhancement looked at the various ways to set the number of votes used in CV. Some established methods call for vote counts to be strictly fixed according to a formula, as opposed to others that set the number based on both the alternatives considered and the number of participants. For example, Dennison [40] suggests using a formula called ‘the 1/3 plus one rule’. This method requires that each participant, regardless of the number of participants, receive votes based on the count of items on the list. Therefore, if the list is comprised of 30 items, then each participant is given 11 votes (1/3 × 30 + 1) to cast. Alternatively, Weaver and Farrell [41] recommend a range to set the number of votes—one-third to one-half of the count of items on the list. In this case, a suitable number of votes for each participant considering a 30-item list would range between five and eight votes. Finally, Amrhein [42] proposes a more sophisticated method to define vote numbers in a CV that considers both the number of items and of participants. The method rests on the assumption that an ideal prioritisation is attained when votes are evenly distributed across the full group of issues. It also assumes that more information is better than less (attained by higher vote numbers), but that its value wanes quickly if the process becomes too unwieldy to execute or all items become equally important (meaning no prioritisation). The mathematical representation of the method is N = [(T/2) × T]/P, where T is the number of issues or topics, P is the number of participants, and N is the number of dots needed for each person. In a situation with 30 items, as in the previous examples, and a number of voters equal to the number of active programmes in Italy today (22), it could be estimated about 20 dots per participant. Not surprisingly, the second enhancement to standard CCV arises from Amrhein-based approach. Considering both the number of options and the number of participants as suggested by Amrhein takes full advantage of the innate plasticity and reproducibility of CCV and makes it a top choice for an enhanced version.
As described by Barykin et al. [43], the Amrhein model is software based and its digitisation uses rules to control interactions among stakeholder participants. It is characterised by its self-organisation, scalability, and sustainability. The two latter aspects, as again asserted by Barykin et al. [43], are highlighted by its quality of plasticity, reproducibility, and adaptability to external conditions of the context in order to preserve its features and continue operating in case of changes in the number of stakeholders or in the number of items to be prioritised.
The third improvement to CV was aimed at developing a prioritisation method that was well suited to political interventions, in which participants’ intentions can be highly polarised. In these situations, obtaining an overly homogeneous distribution of options must be balanced against attaining a clear prioritisation that yields a clear and justifiable national strategy. Dennison [40] advises that ‘if you do not get clear break points that show which are the obvious high-priority items, you might come back to the definition of items, or start over with a different number of dots or to give different weight to votes, or start over with a different prioritization technique to emphasize the polarization’. The goal is to nudge voters to express their relative priorities explicitly and clearly and offer relevant votes to their top choice while at the same time reducing the effects of vote spreading and plumping often associated with CV. Vote spreading will surely reduce alternative polarisation and bring about a homogeneous distribution of votes, and plumping will produce a prioritisation that does not reflect a general consensus if a few, but a very cohesive, group of participants vote for their favourite alternative.
Fourth, any improved model would need to explain more of the variability present in the prioritisation. To this end, the strategic needs outlined in Section 4.2 (Needs Assessment) of the current Italian RDPs were sourced as proxies for assessing the capacity of an identified model to estimate the variability among the different need priorities. This section of the RDPs analyses the relationship between priorities and interventions at a regional level. From this basis, the prioritisation at the national level has been envisioned. An aggregation of need priorities from Italian regions for about 30 items has been estimated, and the results have been reported on a 100-point scale. To carry out this comparison test on the ability of voting models to represent the variability between intervention needs, the box-plot tool has been assessed as applicable. Box plots make it easy to compare the distributions produced from different voting configurations by identifying several values, including interquartile range (IQR), line of the median value, dispersion of values below the first quartile and above the third quartile (‘whiskers’), and any outliers as points. The height of the box and length of the whiskers also describe the dispersion of the distribution.
Notwithstanding, the potential for the adverse effects and biases described above underscores the need for any proposed method to meet several criteria, i.e., preserve model expressiveness, prioritise successfully, and promote choice polarisation. Achieving these goals requires traditional value votes to be substituted with weighted-value votes, meaning that while each participant receives the same configuration (number) of votes, they are valued differently [9]. An additional constraint that allows these votes to be used only a priori to the weighted votes/dots (described in the Results). The enhanced procedure produces two beneficial results. It encourages polarisation and simultaneously removes the risk of vote spreading or vote plumping. Moreover, using a generic set of points, as opposed to money, disentangles the perception that can arise when a financial commitment is equated with a priority (demonetisation) [44].
4. Results
In brief, the voting exercise has been conducted in two different rounds, testing different forms of voting in terms of the number of points and their value. The strengths and weaknesses of each model were identified through discussions with participants in the voting process. A software-based vote-counting tool was also trialled during the rounds. After the first round of voting, all of the tested models were rejected as unsatisfactory for carrying out a robust prioritisation process. Consequently, an alternative model was designed to address the deficits of the first four models. The second round of voting was then undertaken to test the suitability of the proposed model.
4.1. The Analysis of Results and Criticism from Round I
The main objective of the first round was to submit to an empirical test of different voting schemes, conducted with National Rural Network (NRN) experts. Eight different voting models that reflected the situations of eight different Italian regions were simulated in this round. Each voter received an identical total vote value (5000 imaginary dots) to spread to three territories from a common list of 44 needs that were classified and sorted according to the specific objectives (SOs) proposed in the EU’s draft regulations [45].
Needs identification typically occurs after the release of EU legislation provisions. In this case, the requirements are still being defined. Still, it is logical to assume that they will be based on the policy briefs and SWOT analysis drafted by the National Rural Network, already transmitted to the European Commission [46]. The process is likely to be akin to the one used by the managing authorities in developing the 2014–2020 RDPs to identify needs, subsequently synthesised and compared with the SWOTs defined from individual policy briefs. Since the needs continue to be discussed by the technical panels of the Ministry and the regional authorities, only the thematic areas within which the needs nest are reported here. The final version will be available in the coming months and will be a progressive object of this research. Environment and climate, rural areas, technical assistance, competitiveness, and knowledge represent four of the themes, while a fifth and transversal area relates to needs identified as representing recovery and reconstruction actions linked to the 2016 central Italy earthquake. To acknowledge the potential for asymmetry due to the highly heterogeneous territorial conformations, agronomic techniques, and productions within the Italian agricultural sector, a proxy scheme was developed for these variations. Specifically, participants were asked to assign their points while referring each requirement to an area (Plains, Hills, and Mountains). This areal distinction prevented regions with distinctive territorial features from being aggregated when considered within a national average by allowing for the same need to differ in scope within a specific territory. Participants were simultaneously asked to indicate the critical points of the different schemes on three dimensions—items on the list, number and value of the dots, and usability of an Excel® spreadsheet as a vote collection tool.
Four voting models (Table 2) were tested in the first round. One was the flat distribution (FD) model, characterised by a huge number of dots and an unconcentrated value composition. The second was the middle distribution (MD), which has a smaller number of dots, with a more balanced distribution and composition of the overall value. The third was the balanced distribution (BD) model; it is intended to represent the average situation in both the number of votes and in the distribution of value in the voting options. Finally, the last was the polar distribution (PD) model, which is more radical than the others and is intended to hyper-polarise vote options.
Table 2.
Voting models used in the first round of tests. FD: flat distribution; MD: middle distribution; BD: balanced distribution; PD: polar distribution.
In an effort to streamline vote counting, a Microsoft® Excel® spreadsheet was used to collect votes from participants during the exercise. This ‘trial run’ allowed this tool to also be assessed.
In Table 3, some indices of statistical variability to estimate the dispersion of the observed statistical distributions have been reported. From these indices, the range of variation, the standard deviation (σ), the coefficient of variation, defined as the ratio of the standard deviation to the mean, and the interquartile range IQR have been appreciated [47,48]. In Figure 2, the respective dot plots have been drawn, while in Table 4, the model’s composition by the number of votes and the resulting composition in terms of values have been represented. In Table 4, the difference between the simple configuration of votes and the configuration weighted by the values attributed to them is underlined.
Table 3.
Indices of statistical variability, to estimate the dispersion of distributions in the models. FD: flat distribution; MD: middle distribution; BD: balanced distribution; PD: polar distribution.
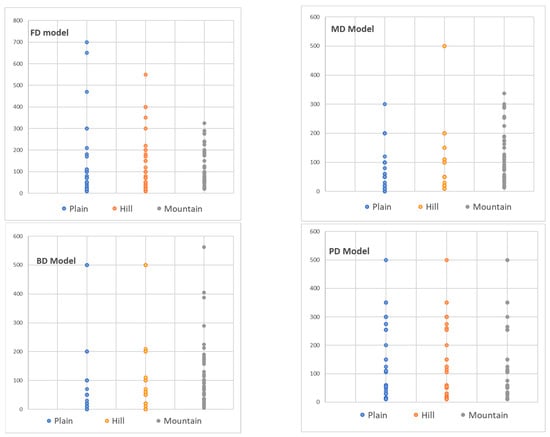
Figure 2.
The dot plots of models’ distributions: FD Model, MD Model, BD Model, and PD Model.
Table 4.
The model’s composition by the number of votes and the resulting composition in terms of values (options). FD: Flat Distribution; MD: Middle Distribution; BD: Balanced Distribution; PD: Polar Distribution.
Feedback from the NRN experts following Round I model testing highlighted the critical issues discussed in the theoretical framework and process requirements outlined in Section 2. Round I testing evaluated the performance of the four vote–count and vote–value models. During the process, the strengths and weaknesses of each model were highlighted. Many of the results were anticipated; however, an unexpected psychological aspect was also revealed.
In general terms, the list of items seemed too large and littered with redundancies, and too much risk paved the way for items to be misunderstood and/or overlapped. In some cases, definitions of needs were simply not clear to participants, increasing the risk of conducting a prioritisation process in which participants are not well informed on the topics, which could lead to flawed decisions [49]. Testers also reported a distortion may have occurred that related to the order in which needs were proposed. Specifically, they observed greater focus and willingness of participants to appreciate the needs revealed earlier, as opposed to those that appeared later in the process. In other words, first impressions matter. As indicated by some authors, the order in which items are presented can heavily affect the voting process [9,37].
In terms of specific model types, participants were highly dissatisfied with those that used large numbers of dots with small values assigned to them, as was true with the most scattered models (FD and MD). Some voters revealed that their goals devolved in the process; at times, they simply found a way to place all the dots and abandoned trying to assign priority. Too many dots with very small values results in a sense of no choice. These behaviours can make a conscious expression of the vote difficult, if not impossible. An expected contrast occurred with the balanced model (BD). Although the BD model was viewed as a better fit, it was also viewed as conservative and inadequate to polarise choice intentions, while it was believed that by eliminating moderate voting values, more polarisation would have resulted. The most polarised model (PD) made evident that concentrating the overall value toward high-value votes forces voters to more clearly express their intended choices. Although this effect is valued in prioritisation, the effect can cause a rise in the potential to neglect priorities that are of less importance but still relevant.
NRN experts noticed nuanced psychology during Round I. They reported that they had approached the procedure as a budget exercise in which they had 5000 units to allocate to future interventions, rather than as a ranking exercise among different needs. As a remedy to the biases often associated with the politics of resource allocation, participants recommended that assigned units should be as detached as possible from monetary values.
Results on the usability of the software-based vote-counting tool were also assessed after Round I. Participant responses indicated that the tool simplified the reading of information from a territorial point-of-view, but that adding a dashboard to display the vote count during the exercise would improve user orientation.
At the conclusion of Round I, all four configurations tested were determined to be less than satisfactory. Each exhibited troublesome aspects that risked their suitability for an optimal prioritisation result in the preparation of a National Strategic Plan. The comparison test, represented by a distribution estimated from current prioritised needs on current RDPs, also confirmed the inadequacy of these four voting models. In addition, this estimated distribution is compared, via box-plot representations (Figure 3) with the distributions produced using the four models (FD, MD, BD, PD) in Round I and also with the model used for Round II. Each distribution is brought back to scale 100 for a homogenous comparison. This comparison highlights how the four models used in Round I are far from the distribution estimated from current prioritised needs on RDPs. These results made clear that a new model needed to be developed that was designed to overcome the inadequacies of the other four and capable of explaining more of the expected prioritisation variability. Therefore, the ‘100 Model’ voting method has been proposed and tested in Round II.
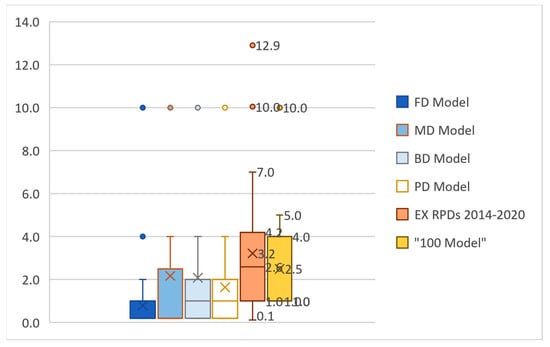
Figure 3.
Comparison, via box plot, of the vote distributions in models FD, MD, BD, and PD, and the estimated national prioritisation estimated over the period 2014–2020 and the 100 Model.
4.2. Arrangements and Voting Shape in Round II
The 100 Model was designed to reduce the number of votes to be cast, shrink the range of values for each vote, and convert all values to the basis of 100. This new form of voting is based on a more relational and less absolute interpretation of the CV mechanism, as in a 100-point vector [44]. It simplifies the process and demonetises voting intentions. In this way, voters perceive an exercise that is less as budgeting and more as estimating relative importance. The 100 Model is constructed from a formula for the number of dots and the needs are randomised, as prescribed by Achimugu et al. [16]. Bias due to repeating the exercise with participants who had already served as testers [9] was avoided by selecting eight new regions. Similarly, new NRN experts were identified to populate the scheme and simulate the behaviour of the regional and autonomous provinces administrations. In this way, all the participants used the 100 Model with equal familiarity.
This new modelling approach immediately demonstrated its value when compared to the others tested. This result is evidenced by comparing the box-plot distributions produced using the 100 Model (Figure 4) and the distribution estimated from the prioritisation process for the current programming period. This comparison shows that employing the new model provides a distribution more closely aligned with the estimated prioritisation distribution. The CCV 100 Model distribution resulted in a more stretched presentation of values, which allows for an empirical presence of natural breaks. A tendency towards polarisation of voting intentions is also highlighted, as shown in Figure 4.
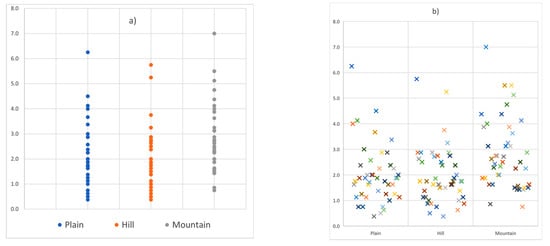
Figure 4.
Distribution of test results using the CCV 100 Model. Requirements distributed by dot plot (a) and unordered box plots (b).
To find confirmation that the model performs better than the others, even if only empirically, additional simulations have been conducted. Following the indication proposed by the ex-ante evaluation of the 2014–2020 RDP from the Piedmont Region, in which needs were distinguished into three classes, the results of the 100 Model test have been grouped into high priority, medium priority, and low priority needs. Table 5 shows the difference between the simple configuration of votes sorted by class and the configuration weighted by the values attributed to them. Based on the results expressed by the technical representatives of the regions, the needs with the highest priority for the ‘plain’ altitude range are related to the efficiency in the use of water resources in the agricultural and agri-food sector, also enhancing the reuse of the resource (Specific Objective 4 of the CAP: Agriculture and climate mitigation), and increasing the profitability of agricultural, agri-food and forestry sector, by supporting the restructuring, innovation and sustainable management of production inputs (Specific Objective 1 of the CAP: Ensuring viable farm income). As regards the hilly areas, the importance of the objective of increasing profitability is confirmed, accompanied by some needs belonging to the Specific Objective 8 of the CAP (Jobs and growth in rural areas), that are logically related to inner and ruralised areas:
Table 5.
The CCV 100 Model composition by the number of votes and the resulting composition in terms of values options in relation to three classes of priority.
- the implementation and strengthening of telematics and digital infrastructure to favour the spread of broadband and ultra-broadband in rural areas;
- the increase in the attractiveness of the territories and support for sustainable tourism;
- the raising of the quality of life in rural areas by improving the quality and accessibility of services to the population and businesses, in order to stop depopulation and support entrepreneurship.
Finally, the improvement of the connectivity of the mountain areas appears to be among the priorities for this altitude range. In fact, the most rated needs are those relating to strengthening the quality and accessibility of infrastructure networks serving agricultural, food, and forestry sectors, with particular reference to roads, logistics and irrigation, and forest management infrastructures (Specific Objective 1); increasing the attractiveness of the area through the development and/or enhancement of their natural, historical-cultural and architectural heritage (Specific Objective 8); the promotion of integrated planning through the improvement/strengthening of governance tools, the participatory approach, bottom-up programming, local development strategies, using multilevel governance models and strengthening the urban/rural relationship (Specific Objective 8). One of the priorities expressed in mountain areas is to favour the conservation and restoration of soil fertility, promoting cultivation techniques with reduced impact, also reducing erosion and compaction (Specific Objective 6: Biodiversity and farmed landscapes).
The second distribution is more appropriate and balanced. Moreover, based on the indications that can be separated, it is possible to confirm that the 100 Model capably represents the prioritised distribution of concrete intervention needs at the territorial level. The distribution of dots, as expected, shows a higher number of items considered to be of low priority. The resulting value composition also confirms this, but with a more precise and weighted assessment.
These first outcomes are very positive indications that the last scheme is adequate for obtaining a clear voting intention with pronounced scaling, as highlighted in the literature. The 100 Model also exhibits an interesting plasticity, which by using the correct number of dots in relation to the number of options and participants, offers valuable application flexibility.
Aside from the quantitative measures of the suitability of the 100 Model to produce clearly expressed and polarised prioritised needs, there are also a number of results that are embedded in the design of the model and deserve enumeration. For example, the 100 Model scheme is advantaged by its orientation as proportional, rather than as a fictional budget allocation. This affords greater expression transparency to voters and a reduced risk of opportunistic behaviours because it is geared towards distributing financial resources. All of these aspects combine to raise confidence in the results of the prioritisation estimates. Nonetheless, some operational issues still need to be addressed and it remains important to find clear declarations of need prioritisation.
As Dennison [40] and Diceman [49] have emphasised, this approach stimulates discussion of each item before voting to limit skewed prioritisations, cynicism, and poor or confusing results that arise when participants are ill informed on the topic and/or process. This kick-off step is even more important if the process is conducted virtually. Although the online option reduces logistics and costs, in addition to opportunistic CV distortions (HiPPO, bandwagon, and split votes), it demands more planning and preparation for participants. Item descriptions and the order in which they are expressed must be clear.
Participants must also receive real-time clarifications if they are doubting how to express their voting intentions. In this sense, various operational arrangements are feasible, such as pre-voting animation, availability of a FAQ service, and/or a back office. The decision as to which path to activate depends on the voting format, be it a simple Excel® spreadsheet or a dedicated online application. The first option, a worksheet to be populated, seems preferable because it is simpler to manage and allows more time for participant reflection. An online application may be more efficient but, during the definitional process, could generate anxiety or lead to hasty vote expression and distort the results. The more important a decision is, the more relevant it is to receive educated votes. Participants need time before and during the voting session to gain vote confidence and ensure that their voting sets aside assumptions and rests on thoughtful reasoning [39].
5. Discussion-Policy Implications
Reforms to CAP have shifted more responsibility to the MSs, as compared to the current EU program period. The legal framework under discussion is expected to provide more flexibility in how national priorities are set and shaped. The direction, main objectives, and intervention list will continue to be determined at the EU level; however, Member States will develop their own NSPs, based on the needs prioritised at their territories and regions [50].
The process of developing the NSP follows different steps, two of which are particularly affected by the research presented in this article. First, a context analysis must be prepared based on an assessment and a clear prioritisation of needs. Even if this analysis could be methodologically sound and prepared mostly in a very technical way by a research institute or a consultancy firm, it must involve stakeholders and allow for feedback. These criteria are especially critical in instances of regionalised MSs for which the process could be conducted through various mechanisms. Second, an ex-ante evaluator is expected to appraise the consistency and the priorities of needs including the procedures used to involve stakeholders [51]. The assessment and prioritisation of needs are the basis for setting up the intervention strategy and for designing the intervention logic of the NSP.
The link established between identified needs and measures selected to address those needs is a key step of the process. Currently, RDPs must conduct detailed needs assessments and select from the most significant and relevant among them. However, an analysis by the European Court of Auditors [52] found that the processes are too formal, tautological, and general. In fact, the audit showed only two plans (La Rioja, Spain, and Campania, Italy) actually presented prioritised needs. According to the Commission, the intervention logic represents the evident link between a problem that has to be faced or an objective to be pursued and the choice and implementation among policy options and actions. The Commission calls for NSPs to exhibit a cohesive logic among the three parts of the plan: national, regional, and sector needs, prioritisation, intervention mix to respond to those needs, targeted inputs and outputs, and expected results [4,6,50,52].
Assuming that the definition of needs is justified [6], consistent, and shared with stakeholders, the process leading to their prioritisation remains an evident critical point. It requires special attention and arrangements to ensure transparency and consistency. The 100 Model does just this. It follows the advice of the literature by being an open process that allows full expression by stakeholders, and it embeds evidence of the process and provides ample flexibility to define an intervention logic for an NSP or for any type of programme cycle (such as a local development strategy). In summary, it is the needs prioritisation exercise to complete the intervention logic and represents a milestone in the policy defining cycle.
The 100 Model exercise aligns with the process used by the Ministry of Agricultural, Food, and Forestry Policies (MIPAAF) to set the strategy for the next CAP in Italy in two ways. First, the exercise is transparent, allowing stakeholders free expression of what is and is not a priority in the national strategy. Second, the scheme allows expansive sharing and participation across regional and autonomous provinces administrations. The impartial method of the model and online design permit adequate intention expression by each participant. Simultaneously, the model allows revisions and corrections to the distortions that others have noted [40,53] with recursive rounds.
The 100 Model approach represents a step forward in an increasingly complex process that will write future NSPs. Tests support the superior ability of the model, relative to other cumulative voting versions, to justify the choices coming out of the process, including why some needs were only partially addressed or not addressed at all in the NSP ([1], article 96 [54]). In this light, Erjavec et al. [55] pose several questions about the plan’s design. This voting approach may answer many of those questions, as it can provide (1) quality of the proposed CAP strategic planning process; (2) rigor of the strategic planning process; (3) clarity of needs and their determination; (4) transparency of criteria for the link between measures, needs, and targets; and (5) evidence of steps to establish a robust intervention logic.
Flexibility in numerous aspects of the method is its hallmark. While the actual number of needs to be ranked remains undefined, the method offers adequate and efficient flexibility for processes of all sizes. Similarly, a streamlined vote submission format, spreadsheet, or online application also provides process flexibility. If accompanied by a factsheet to train respondents on the definition of items, the tool is extremely helpful, especially if these are numerous. This process flexibility will also be important to handle newly imposed NSP delivery model rigidities [55] for setting targets, allocating resources, and constructing a monitoring system. The more a plan can be tailored to specific national and regional needs and conditions, the more the NSP enhances the efficiency of its interventions [55].
The centre point of the model lies in its voting configuration definition, i.e., the number of available votes and their relative values. The analysis in this study highlighted the trade-off that exists between the need to polarise voting intentions and the need to define needs and priorities in a sufficiently flexible way for a range of needs and political actors (regions and autonomous provinces). Without an evidently clear and coherent identification of high-priority items, the process falls short. Enabling transparency, active participation by stakeholders, and respondent freedom to express themselves without distortions, embarrassments, or opportunistic behaviours is necessary to assist with the shift in responsibility to MSs. In this light, any method to prioritise needs should be seen in a positive light and not as a new battleground for budget allocation decisions. Therefore, the ability to detach assigned units from monetary values, such as by using an aseptic 100-scale approach, sounds attractive.
By extension and to take full advantage of this flexibility, one idea is to develop a final configuration of needs that arises from both quantitative and qualitative ranking. A viable hypothesis to explore may be to group all of the needs assessed by the 100 Model by order and level of contribution to the strategy. For example, the ex-ante evaluation of the 2014–2020 Piedmont Region RDP proposes that the needs identified at the end of the context analysis process be placed into three groups—strategic, enabling, and complementary [56].
6. Conclusions
The model, which is fine-tuned from tests of different distributions of values and dots and validated by comparison with the current situation estimated from Italian RDPs, utilises reduced numbers of votes, contracted values for each grade, and values indexed to 100. A test of the model with NRN regional representatives demonstrated that respondents must be educated about the needs on which they are called to express themselves. The research also indicated that it is possible to apply the model theoretically and practically to future NSP needs prioritisations by considering the information at hand. These results suggest that with appropriate adjustments, the model is generalisable to other prioritisation situations.
Another finding by the study was that identification of the value of individual votes requires more attention and adjustment than the definition of the number of votes.
The current limitation of the research is that the model has been tested on the representatives of the regional authorities who deal with the implementation and executive tasks of the Rural Development Programs. However, different indications could arise from the involvement of regional authority political representatives, whose evaluations could differ from the technical-executive representatives. In the current phase, as the Italian Ministry of Agriculture is undergoing a planning phase, it has not been possible to involve the political part, which will instead be administered the model in the coming months, constituting the continuation of the research presented in this article.
This voting model is a very useful tool for the functioning and management of the Partnership Table created in Italy for the next programme period. The theoretical validation of this model allows its application during the next consultative processes of the programming phase of the future CAP in Italy. The fact that the model was tested on a set of needs estimated and collected at the level of a Member State (Italy) does not negate its usefulness for reference in other MSs in the same phase of the prioritisation process. The natural next step in this research will be an evaluation of the field use of the tool at the conclusion of writing the NSP (Step 5 of Figure 1).
Author Contributions
Conceptualisation, A.M., R.C., G.M., and S.N.; formal analysis, R.C., G.M., and F.B.; investigation, R.C., G.M., and F.B.; methodology, A.M., R.C., G.M., F.B., and F.M.; supervision, A.M.; writing—original draft preparation, R.C., F.B., G.M., and F.M.; Writing—review and editing, S.N., A.M., and R.C. All authors have read and agreed to the published version of the manuscript.
Funding
This research received no external funding.
Institutional Review Board Statement
Not applicable.
Informed Consent Statement
Not applicable.
Data Availability Statement
Not applicable.
Acknowledgments
The authors thank the representatives of the regional offices of the Council for Agricultural Research and the Analysis of the Agricultural Economy, for testing the prioritisation models illustrated in the article.
Conflicts of Interest
The authors declare no conflict of interest.
References
- European Commission. Proposal for a Regulation of the European Parliament and of the Council establishing Rules on Support for Strategic Plans to be Drawn Up by Member States under the Common Agricultural Policy (CAP Strategic Plans) and Financed by the European Agricultural Guarantee Fund (EAGF) and by the European Agricultural Fund for Rural Development (EAFRD); COM/2018/392 final—2018/0216 (COD); European Commission: Brussels, Belgium, 2018. [Google Scholar]
- Carey, M. The Common Agricultural Policy’s New Delivery Model Post-2020: National Administration Perspective. EuroChoices 2019, 18, 11–17. [Google Scholar] [CrossRef]
- Massot, A.; Negre, F. Towards the Common Agricultural Policy beyond 2020: Comparing the Reform Package with the Current Regulations, Directorate-General for Internal Polices; European Parliament: Brussels, Belgium, 2018; pp. 1–82. [Google Scholar]
- Matthews, A. Evaluating the Legislative Basis for the New CAP Strategic Plans. Available online: http://capreform.eu/evaluating-the-legislative-basis-for-the-new-cap-strategic-plans/ (accessed on 15 February 2021).
- Metta, M. How Transparent and Inclusive is the Design Process of the National CAP Strategic Plans? Available online: https://www.arc2020.eu/how-transparent-and-inclusive-is-the-design-process-of-the-national-cap-strategic-plans/ (accessed on 19 February 2021).
- Angeli, S.; Cagliero, R.; De Franco, R.; Mazzocchi, G.; Monteleone, A.; Tarangioli, S. La definizione Delle Esigenze nel Piano Strategico Della Pac 2023–2027; Working Document, Rete Rurale Nazionale 2014–2020; Mipaaf: Roma, Italy, 2020; preprint. [Google Scholar]
- ARC. CAP Reform Post 2020: Lost in Ambition? Final Report; ARC: Brussels, Belgium, 2020; pp. 1–72. [Google Scholar]
- Regulation (EU). 2020/2220 of the European Parliament and of the Council of 23 December 2020 Laying Down Certain Transitional Provisions for Support from the European Agricultural Fund for Rural Development (EAFRD) and from the European Agricultural Guarantee Fund (EAGF) in the Years 2021 and 2022 and Amending Regulations (EU) No 1305/2013, (EU) No 1306/2013 and (EU) No 1307/2013 as Regards Resources and Application in the Years 2021 and 2022 and Regulation (EU) No 1308/2013 as Regards Resources and the Distribution of Such Support in Respect of the Years 2021 and 2022; Council of the European Union: Brussels, Belgium, 2020. [Google Scholar]
- Juristo, N.; Vegas, S.; Solari, M.; Abrahão, S.; Ramos, I. A process for managing interaction between experimenters to get useful similar replications. Inf. Softw. Technol. 2013, 55, 215–225. [Google Scholar] [CrossRef]
- Phillips, L.D.; Costa, C.A.B. Transparent prioritisation, budgeting and resource allocation with multi-criteria decision analysis and decision conferencing. Ann. Oper. Res. 2007, 154, 51–68. [Google Scholar] [CrossRef]
- Smaoui, H.; Lepelley, D. Le système de vote par note à trois niveaux: Étude d’un nouveau mode de scrutin. Rev. D’économie Polit. 2013, 123, 827–850. [Google Scholar] [CrossRef]
- Marcatto, F. Dot Voting: Because One Vote Is Not Enough. Available online: https://mindiply.com/blog/post/dot-voting-because-one-vote-is-not-enough (accessed on 15 February 2021).
- Kato, T.; Asa, Y.; Owa, M. Positionality-Weighted Aggregation Methods on Cumulative Voting. arXiv 2020, arXiv:2008.08759v1. Available online: https://arxiv.org/abs/2008.08759v1 (accessed on 19 February 2021).
- Quarfoot, D.; von Kohorn, D.; Slavin, K.; Sutherland, R.; Goldstein, D.; Konar, E. Quadratic voting in the wild: Real people, real votes. Public Choice 2017, 172, 283–303. [Google Scholar] [CrossRef]
- Tufail, H.; Qasim, I.; Faisal Masood, M.; Tanvir, S.; Haider Butt, W. Towards the selection of Optimum Requirements Prioritization Technique: A Comparative Analysis. In Proceedings of the 5th International Conference on Information Management (ICIM 2019), Cambridge, UK, 24–27 March 2019; IEEE Digital Library. pp. 227–231. [Google Scholar] [CrossRef]
- Achimugu, P.; Selamat, A.; Ibrahim, R.; Mahrin, M.N. A systematic literature review of software requirements prioritization research. Inf. Softw. Technol. 2014, 56, 568–585. [Google Scholar] [CrossRef]
- Saaty, T.L. What is the analytic hierarchy process. In Mathematical Models for Decision Support; Mitra, G., Ed.; NATO ASI Series, F48; Springer: Berlin, Germany, 1988; pp. 109–121. [Google Scholar]
- Saaty, T.L.; Vargas, L.G. The analytic network process. In Decision Making with the Analytic Network Process; Springer: Boston, MA, USA, 2013; pp. 1–40. [Google Scholar]
- Karlsson, J.; Wohlin, C.; Regnell, B. An evaluation of methods for prioritizing software requirements. Inf. Softw. Technol. 1998, 39, 939–947. [Google Scholar] [CrossRef]
- Vestola, M. A Comparison of Nine Basic Techniques for Requirements Prioritization; Helsinki University of Technology: Helsinki, Finland, 2010; pp. 1–8. [Google Scholar]
- Perini, A.; Ricca, F.; Susi, A. Tool-supported requirements prioritization: Comparing the AHP and CBRank methods. Inf. Softw. Technol. 2009, 51, 1021–1032. [Google Scholar] [CrossRef]
- Ahl, V. An Experimental Comparison of Five Prioritization Methods—Investigating Ease of Use, Accuracy and Scalability. Master’s Thesis, School of Engineering Blekinge Institute of Technology, Ronneby, Sweden, August 2005. [Google Scholar]
- Leffingwell, D.; Widrig, D. Managing Software Requirements: A Use Case Approach, 2nd ed.; Addison-Wesley: Boston, MA, USA, 2003; p. 540. ISBN 978-0321122476. [Google Scholar]
- Bhagat, S.; Brickley, J.A. Cumulative Voting: The Value of Minority Shareholder Voting Rights. J. Law Econ. 1984, 27, 339–365. [Google Scholar] [CrossRef]
- Cooper, D.; Zillante, A. A comparison of cumulative voting and generalized plurality voting. Public Choice 2010, 150, 363–383. [Google Scholar] [CrossRef]
- Palander, T.; Laukkanen, S. A Vote-Based Computer System for Stand Management Planning. Int. J. For. Eng. 2006, 17, 13–20. [Google Scholar] [CrossRef]
- Hoover, A.; Goldbaum, M.H. Locating the optic nerve in a retinal image using the fuzzy convergence of the blood vessels. IEEE Trans. Med Imaging 2003, 22, 951–958. [Google Scholar] [CrossRef] [PubMed]
- Heikkilä, V.; Jadallah, A.; Rautiainen, K.; Ruhe, G. Rigorous support for flexible planning of product releases—A stakeholder-centric approach and its initial evaluation. In Proceedings of the 43rd Hawaii International Conference on System Sciences, Honolulu, HI, USA, 5–8 January 2010; IEEE Digital Library. pp. 1–10. [Google Scholar]
- Knapp, J.; Zeratsky, J.; Kowitz, B. Sprint: How to Solve Big Problems and Test New Ideas in just Five Days, 1st ed.; Simon and Schuster: New York, NY, USA, 2016; p. 274. ISBN 978-1501121746. [Google Scholar]
- Skowron, P.; Slinko, A.; Szufa, S.; Talmon, N. Participatory Budgeting with Cumulative Votes. arXiv 2020, arXiv:2009.02690v1. Available online: https://arxiv.org/abs/2009.02690 (accessed on 19 February 2021).
- Asch, S.E. Effects of group pressure upon the modification and distortion of judgments. In Groups, Leadership and Men; Guetzkow, H., Ed.; Carnegie Press: Pittsburgh, PA, USA, 1951; pp. 177–190. [Google Scholar]
- Milgram, S. Behavioral Study of obedience. J. Abnorm. Soc. Psychol. 1963, 67, 371–378. [Google Scholar] [CrossRef] [PubMed]
- Kohavi, R.; Henne, R.M.; Sommerfield, D. Practical Guide to Controlled Experiments on the Web: Listen to Your Customers not to the Hippo. In Proceedings of the 13th ACM SIGKDD International conference on Knowledge Discovery and Data Mining, San Jose, CA, USA, 12–15 August 2007; Association for Computing Machinery: New York, NY, USA, 2007; pp. 959–967. [Google Scholar] [CrossRef]
- Cialdini, R.B. Influence: Science and Practice, 1st ed.; Pearson Educations Inc.: London, UK, 1984. [Google Scholar]
- Nadeau, R.; Cloutier, E.; Guay, J.-H. New Evidence about the Existence of a Bandwagon Effect in the Opinion Formation Process. Int. Polit. Sci. Rev. 1993, 14, 203–213. [Google Scholar] [CrossRef]
- Van Erkel, P.F.; Thijssen, P. The first one wins: Distilling the primacy effect. Elect. Stud. 2016, 44, 245–254. [Google Scholar] [CrossRef]
- Svahnberg, M.; Karasira, A. A Study on the Importance of Order in Requirements Prioritisation. In Proceedings of the 3rd International Workshop on Software Product Management (IWSPM 2009), Atlanta, GA, USA, 1 September 2009; IEEE Digital Library. pp. 35–41. [Google Scholar] [CrossRef]
- Marcatto, F. How to Make Better Group Decision with Dot Voting. Available online: https://mindiply.com/blog/post/how-to-make-better-group-decision-with-dot-voting (accessed on 15 February 2021).
- Gibbons, S. Dot Voting: A Simple Decision-Making and Prioritizing Technique. Available online: https://www.nngroup.com/articles/dot-voting/ (accessed on 15 February 2021).
- Dennison, M. Voting with Dots. Thread from a Discussion on the Electronic Discussion on Group Facilitation. Available online: https://www.albany.edu/cpr/gf/resources/Voting_with_dots.html (accessed on 19 February 2021).
- Weaver, R.G.; Farrell, J.D. Managers as Facilitators: A Practical Guide to Getting Work Done in a Changing Workplace; Berrett-Koehler Publishers Inc.: San Francisco, CA, USA, 1997; p. 248. ISBN 978-1576750544. [Google Scholar]
- Amrhein, J. Dot Voting Tips. Michigan State University Extension. Available online: https://www.canr.msu.edu/news/dot-voting-tips (accessed on 15 February 2021).
- Barykin, S.Y.; Kapustina, I.V.; Kirillova, T.V.; Yadykin, V.K.; Konnikov, Y.A. Economics of Digital Ecosystems. J. Open Innov. Technol. Mark. Complex. 2020, 6, 124. [Google Scholar] [CrossRef]
- Chatzipetrou, P.; Angelis, L.; Rovegård, P.; Wohlin, C. Prioritization of Issues and Requirements by Cumulative Voting: A Compositional Data Analysis Framework. In Proceedings of the 36th EUROMICRO Conference on Software Engineering and Advanced Applications (SEAA 2010), Lille, France, 1–3 September 2010; IEEE Digital Library. pp. 361–370. [Google Scholar] [CrossRef]
- Bolli, M.; Cagliero, R.; Cisilino, F.; Cristiano, S.; Licciardo, L. L’analisi SWOT per la costruzione delle strategie regionali e nazionale della PAC post-2020. In Working Document Rete Rurale Nazionale 2014–2020; Mipaaf: Roma, Italy, 2019; p. 54. [Google Scholar]
- European Commission. Commission Recommendations for Italy’s CAP Strategic Plan; SWD(2020) 396 final; European Commission: Brussels, Belgium, 2020. [Google Scholar]
- Everitt, B. The Cambridge Dictionary of Statistics, 1st ed.; Cambridge University Press: Cambridge, UK; New York, NY, USA, 1998; p. 410. ISBN 978-0521766999. [Google Scholar]
- Upton, G.; Cook, I. (Eds.) Understanding Statistics; Oxford University Press: New York, NY, USA; Oxford, UK, 1996; p. 55. ISBN 978-0199143917. [Google Scholar]
- Diceman, J. Dotmocracy Handbook; Version 2.2; CreateSpace Independent Publishing Platform: Scotts Valley, CA, USA, 2010; p. 49. ISBN 978-1451527087. [Google Scholar]
- Erjavec, E.; Lovec, M.; Šumrada, T. New CAP Delivery Model, Old Issues. Intereconomics 2020, 55, 112–119. [Google Scholar]
- Matthews, A. Developing CAP Strategic Plans. Available online: http://capreform.eu/developing-cap-strategic-plans/ (accessed on 15 February 2021).
- European Court of Auditors. Rural Development Programming: Less Complexity and More Focus on Results Needed. Available online: https://www.eca.europa.eu/Lists/ECADocuments/SR17_16/SR_RURAL_DEV_EN.pdf (accessed on 31 March 2021).
- Linstone, H.A.; Turoff, M. (Eds.) The Delphi Method, Techniques and Applications; Addison-Wesley Educational Publishers Inc.: Boston, MA, USA, 2002; p. 621. [Google Scholar]
- European Court of Auditors. Future of the CAP (Briefing Paper). Available online: https://www.eca.europa.eu/Lists/ECADocuments/Briefing_paper_CAP/Briefing_paper_CAP_EN.pdf (accessed on 31 March 2021).
- Erjavec, E.; Lovec, M.; Juvančič, L.; Šumrada, T.; Rac, I. Research for AGRI Committee—The CAP Strategic Plans beyond 2020. In Assessing the Architecture and Governance Issues in Order to Achieve the EU-Wide Objectives; Study Requested by the AGRI Committee; European Parliament, Policy Department for Structural and Cohesion Policies: Brussels, Belgium, 2018; p. 52. [Google Scholar]
- NUVAL Piemonte. Programma di Sviluppo Rurale 2014–2020 della Regione Piemonte. Valutazione ex Ante: Rapporto Finale; Regione: Piemonte, Italy, 2015; p. 168. [Google Scholar]


Publisher’s Note: MDPI stays neutral with regard to jurisdictional claims in published maps and institutional affiliations. |
© 2021 by the authors. Licensee MDPI, Basel, Switzerland. This article is an open access article distributed under the terms and conditions of the Creative Commons Attribution (CC BY) license (https://creativecommons.org/licenses/by/4.0/).