Article

Assessment of Potato Farmland Soil Nutrient Based on MDS-SQI Model in the Loess Plateau

1
College of Life Sciences, Yan’an University, Yan’an 716000, China
2
College of Agricultural Equipment Engineering, Henan University of Science and Technology, Luoyang 471000, China
*
Author to whom correspondence should be addressed.
Sustainability 2021, 13(7), 3957; https://doi.org/10.3390/su13073957
Submission received: 19 February 2021 / Revised: 14 March 2021 / Accepted: 25 March 2021 / Published: 2 April 2021
(This article belongs to the Special Issue Agroforestry and Sustainable Agricultural Production)

Abstract

:
Soil nutrients are essential nutrients provided by soil for plant growth. Most researchers focus on the coupling effect of nutrients with potato yield and quality. There are few studies on the evaluation of soil nutrients in potato fields. The purpose of this study is to investigate the soil nutrients of potato farmland and the soil vertical nutrient distributions, and then to provide a theoretical and experimental basis for the fertilizer management practices for potatoes in Loess Plateau. Eight physical and chemical soil indexes were selected in the study area, and 810 farmland soil samples from the potato agriculture product areas were analyzed in Northern Shaanxi. The paper established the minimum data set (MDS) for the quality diagnosis of the cultivated layer for farmland by principal component analysis (PCA), respectively, and furthermore, analyzed the soil nutrient characteristics of the cultivated layer adopted soil quality index (SQI). The results showed that the MDS on soil quality diagnosis of the cultivated layer for farmland soil included such indicators as the soil organic matter content, soil available potassium content, and soil available phosphorus content. The comprehensive index value of the soil quality was between 0.064 and 0.302. The SPSS average clustering process used to classify SQI was divided into three grades: class I (36.2%) was defined as suitable soil fertility (SQI < 0.122), class II (55.6%) was defined as moderate soil fertility (0.122 < SQI < 0.18), and class III (8.2%) was defined as poor soil fertility (SQI > 0.186). The comprehensive quality of the potato farmland soils was generally low. The proportion of soil nutrients in the SQI composition ranged from large to small as the soil available potassium content = soil available phosphorus content > soil organic matter content, which became the limiting factor of the soil organic matter content in this area. This study revolves around the 0 to 60 cm soil layer; the soil fertility decreased gradually with the soil depth, and had significant differences between the respective soil layers. In order to improve the soil nutrient accumulation and potato yield in potato farmland in northern Shaanxi, it is suggested to increase the fertilization depth (20 to 40 cm) and further study the ratio of nitrogen, phosphorus, and potassium fertilizer.

1. Introduction

Soil is an important natural resource, and soil nutrients are key to contributing to food security, human health, and sustainable development. Soil plays a special role in crop growth and reproduction, such as nutrient storage, nutrient transformation and circulation, rainwater conservation, biological support, stability, and as a buffer of environmental changes [1,2,3]. The core of soil science research is soil fertility, and soil nutrient content is an important indicator of soil fertility [4]. Soil nutrients have the characteristics of flow and migration in soil. Therefore, the analysis of the soil nutrient content and spatial distribution, the classification of soil nutrient levels and the comprehensive evaluation of soil nutrients are the most effective means to develop a scientific and reasonable fertilization program [5,6]. It is also the main measure to reduce the excessive application of fertilizer, improve the utilization efficiency of fertilizer and protect the sustainable development of the environment.
Soil nutrients play an important role in the growth of the plant and any imbalance in soil fertility affects the crop productivity as well as posing severe environmental hazards [7]. In the agricultural ecosystem, human regulation plays a dominant role, and the main source of nutrients is fertilizer application. According to statistics from 2000 to 2015, it is estimated that the quality of arable land in China is poor, and low- and medium-yield farmland occupies 72% of the total arable land area [8]. The soil degradation in the black soil region of northeast China was severe, and agricultural production capacity was lost in some areas [9]. Many researchers have carried out soil nutrient evaluation in order to ensure the soil water supply and fertilizer capacity and prevent blind fertilization [10,11,12]. Soil nutrient assessment is essential to the basic investigation and research of efficient agriculture [13]. Precision agriculture requires a combination of crop yield components and national policies to reasonably regulate the use and dosage of fertilizers input into the farmland ecosystem, which is conducive to meeting the production conditions of marginal effect and achieving the maximum utilization rate of fertilizers [14].
Soil nutrient assessment refers to the monitoring and evaluation of soil properties, soil functions and soil conditions. Soil quality is usually assessed through the measurement of selected soil properties. The evaluation of soil quality is difficult due to the heterogeneity of soil, and the physical, chemical, and biological properties of soil vary greatly in different regions. Thus, to comprehensively assess soil quality, a soil quality index (SQI) that integrated soil properties into an overall index was established and has been used widely. Many researchers have selected multiple soil evaluation indexes such as pH value, salinity, and clay weight [15,16]. Some researchers selected multiple soil evaluation indexes such as pH value, C/N, and soil nematode to establish the minimum data set of soil evaluation [17,18]. Some researchers used soil material indexes such as porosity and three-dimensional aggregate characteristics to evaluate farmland soil quality [19,20]. Some researchers selected soil quality evaluation indexes from three aspects of soil physics, chemistry, and microorganism, and established the microbial community and enzyme activity evaluation system [21,22]. Therefore, it is particularly important to select appropriate evaluation indexes scientifically, and soil indexes that mainly affect crop growth should be considered simultaneously. In addition, soil quality and soil fertility assessments have also been carried out because their selection indexes are similar to the easily confused methods of evaluation, which leads to the tendency to evaluate soil fertility in soil quality assessment.
The limiting factors of soil nutrient vary with land use modes, land types, ecosystems, locations, and soil parent materials [23,24]. Therefore, the selection of appropriate indexes is particularly important for the results of soil assessment. The assessment of soil quality could lead to new methods and practices that could be applied to more sustainable development. The establishment of a minimum data set (MDS) is a convenient process for selecting soil quality indicators and evaluation [25]. The MDS can reduce data redundancy by selecting the most appropriate metric among preselected metrics. In addition, the weight of selected indexes can be generated during the establishment of MDS, which reduces the subjective influence of human factors on soil quality and is conducive to subsequent soil quality evaluation [26]. Many researchers have conducted soil quality assessments based on MDS [27,28,29]. The MDS of soil quality indicators has been used to evaluate the relationship between the indicators and their effects on soil properties and crops [30]. There are many methods to construct the minimum data set, such as the grey correlation method, principal component analysis (PCA) method, and correlation coefficient method, etc. The PCA method has strong objectivity and can ensure the minimum loss of original data information to reflect the impact of indicators on soil quality [31]. The four indicators extracted from the MDS were significantly correlated with the fertility indicators established by all indicators [32]. The MDS can well reflect the regional differences and is suitable for soil nutrient evaluation [25].
The Loess Plateau is one of the most advantageous potato producing areas in China. In recent years, about 50% of the potato yield in northern Shaanxi reached the middle level, and the ratio of high potato yield was less than 6% [33]. The land resources in the Loess Plateau were affected by unreasonable fertilization, which resulted in soil quality degradation and threatened the local ecological security [34]. Research on the soil quality of potato fields in the Loess Plateau has been relatively rare in recent years. There are two problems in previous studies. One is that many studies only use statistical data on the sample scale, and the results are not extended to the whole region. Second, most of the studies focus on regional ecosystems and do not evaluate specific land use types.
The purpose of this study was to evaluate the soil quality of potato cropland on the Loess Plateau, based on soil nutrient indicators from 2017 to 2018. This study attempts to use principal component analysis and correlation analysis to determine the MDS of soil nutrient evaluation in this region, and the fuzzy mathematics membership function method to establish a soil nutrient evaluation index. The results are useful for local potato field scientific fertilization and soil protection.

2. Materials and Methods

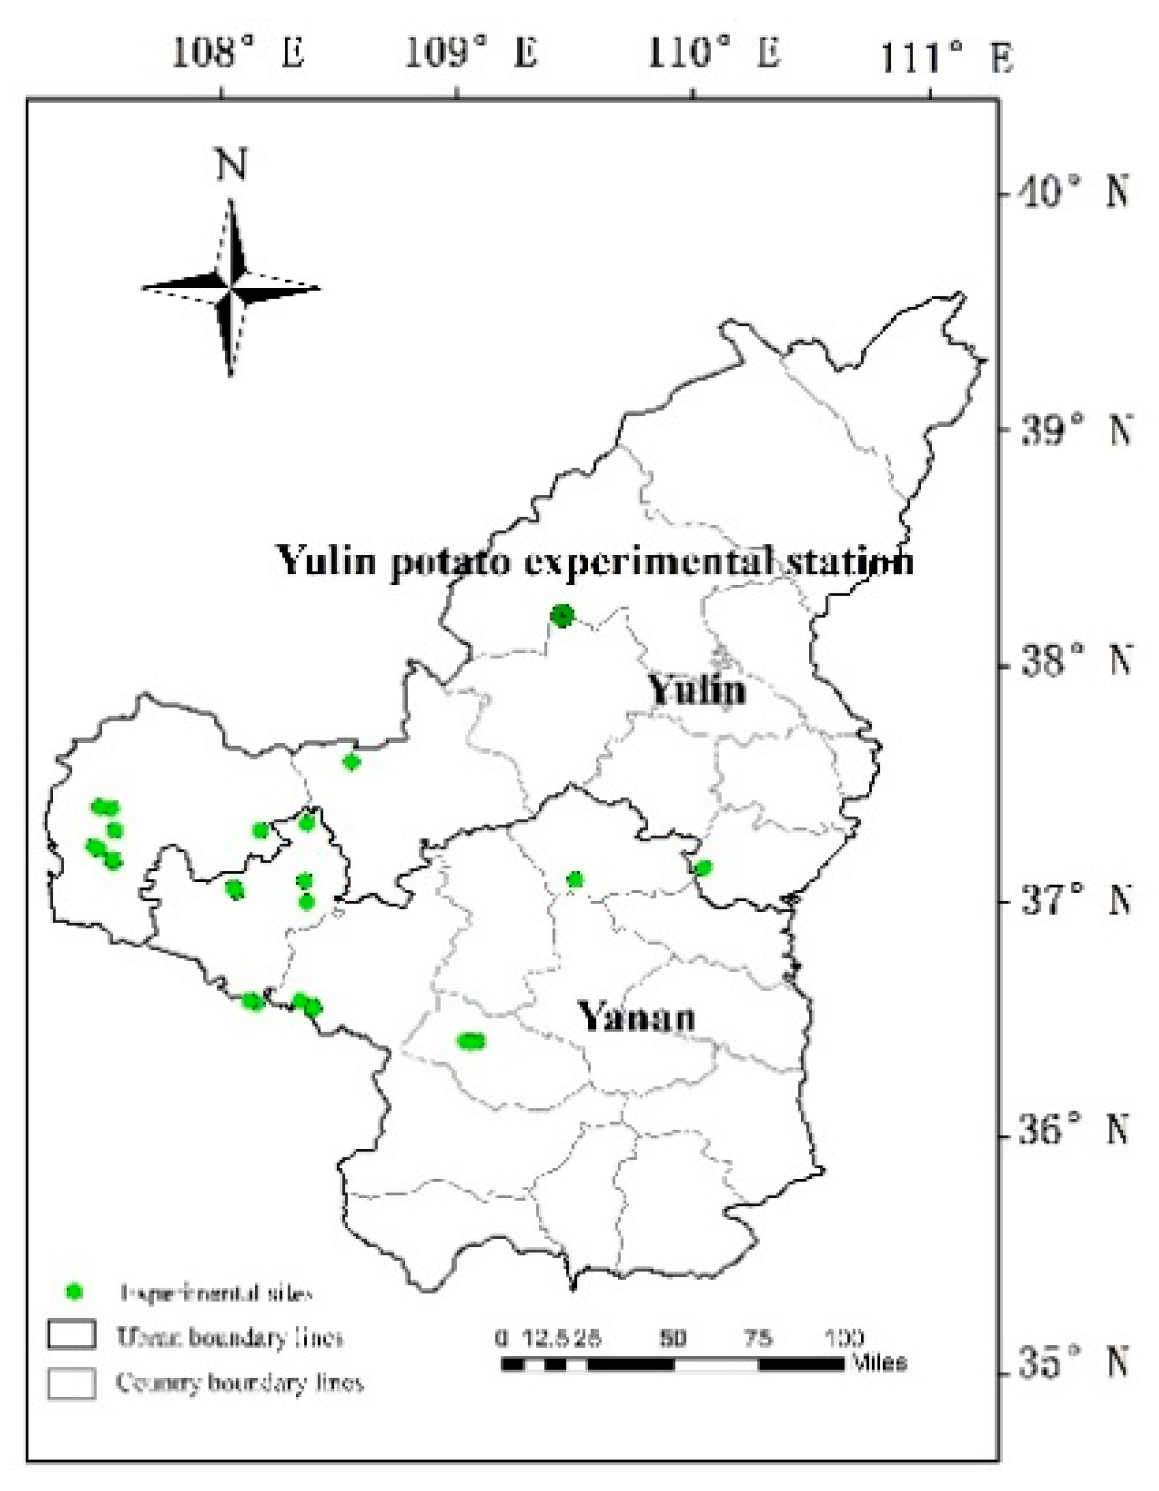
2.1. Site Description and Soil Sampling

The experiments were carried out in 10 counties (36°28′–39°37′ N, 108°21′–109°55′ E, altitude of 762 to 1340 m above sea level) in the Loess Plateau region of China from 2017 to 2018 (Figure 1). The region is a typical hilly landform of the Loess Plateau and belongs to an arid and semi-arid continental monsoon climate. The climate is mild and semiarid, with an annual average temperature of 9 °C, a monthly average maximum temperature of 22 °C (July), and a monthly average minimum temperature of −4.6 °C (January). The average annual sunshine duration of 2200 h exceeds 158 days without frost and the mean annual radiation is 490 KJ/cm2. From 1990 to 2018, the annual average precipitation in this region was 480 mm. The soil type is loess soil, which is classified as Inceptisol according to the USDA soil classification and Cambisol according to the World Reference Database System [21]. The average sand (2.00 to 0.02 mm grain size), silt (0.02 to 0.002 mm), and clay (<0.002 mm) contents in the 0- to 80-cm soil profile was measured with a laser particle size analyzer (Dandong Haoyu Technology Co., Ltd., Dandong, Liaoning, China), and the values were 62%, 25%, and 13%, respectively.

2.2. Sample Collection and Determination Methods

Soil samples should be collected from farmland or test plots with an area greater than 600 m3. Soil cores were collected using an auger with a 25 mm inner diameter. Five sample points were randomly collected from the same test plot at 0- to 60-cm soil depths. The soil temperature ranged from 12.3 to 17.4 °C when we collected the soil samples. The soil samples were air-dried, homogenized, and hand ground to pass through a 2-mm sieve for the determination of soil physical and chemical index. The soil depth from 0 to 60 cm was determined as S, 0 to 20 cm as S1, 20 to 40 cm as S2, and 40 to 60 cm as S3.
The soil organic matter content was determined by the potassium dichromate volumetric method (external heating method) [33]. The soil available potassium was determined by the flame photometry method with NH4OAc extraction [33]. The soil available phosphorus was determined by the molybdenum antimony anti-spectrophotometry method with NaHCO3 extraction [33]. The soil acidity (pH) was measured in an aqueous soil extract in de-ionized water (1:2.5 soil:water) [33]. For the soil electrical conductivity 1:5 soil-to-water ratio solution, 50 g of soil was mixed with 250 g of distilled water, and repeated three times, shaking manually four times every 30 min for 1 min and standing for 4 h to achieve balance. Once the 1:5 soil–water solutions reached equilibrium, the soil’s electrical conductivity was measured by inserting an Accumet 50 m (Fisher Scientific, Hampton, NH, USA) into the solution [35]. The content of soil alkali-hydrolyzable nitrogen was determined by conductance titration; 0.5 g soil samples were distilled with 2 mol L−1 NaOH for 5 h, then treated with 10mol L−1 NaOH for 7 min, and then treated with 40 g L−1 boric acid for NH3, which was absorbed and released by direct steam [36]. The soil water content was determined using the gravimetric method. The soil nitrate N content was measured using a spectrophotometer (UV-2600, Shanghai Hengping Scientific Instrument Co. Ltd., Shanghai, China). First, 0.5 g of fresh soil was transferred to a 100-mL Erlenmeyer flask, and then 50 mL of a 2-mol L−1 potassium chloride solution was added to the Erlenmeyer flask. Next, the mixture was oscillated for 30 min using a shock machine until reaching uniformity. Finally, the solution was filtered, and then 5 mL of the solution was measured using a spectrophotometer at a wavelength of 210 nm [10].

2.3. Establishment of Minimum Data Set MDS

What comes first is to screen soil nutrient indicators, in order to avoid the influence of redundant data and complex multiple correlations of indicators on the constructed soil quality assessment index. Principal component analysis (PCA) was used to reduce dimensionality and representative soil measurement indexes were selected to establish MDS. When performing the principal component analysis, the extract principal components had eigenvalues greater than 1. The index with the same principal component load ≧0.5 is divided into one group. If the load of a soil parameter in two principal components is higher than 0.5 at the same time, the parameter should be merged into the group with a lower correlation with other parameters.
Second, to solve the vector normal, the vector normal of the evaluation index was calculated. The vector normal is the length of the vector normal mode of the index in a multi-dimensional space composed of components. The longer the length, the greater the comprehensive load of the indicator in all principal components, and the greater its ability to interpret comprehensive information. The vector normal is calculated as follows:
N ik = i = 1 k ( u ik 2 · λ k )
In the formula, N ik is the comprehensive load of the i-th index on the first k principal components of the eigenvalue; u ik   is the load of the i-th index on the k-th principal component; λ k is the eigenvalue of the k-th principal component.

2.4. Establishment of Soil Nutrient Evaluation Index

To calculate the soil quality index (SQL) for different data sets [37,38,39], the calculation formula is as follows:
SQL = i = 1 k W i · N i
In the formula, SQI is the soil nutrient evaluation index; Wi is the weight of the i-th index; Ni is the membership of the i-th index. The weight calculation formula is as follows:
W i = M i   M i
M i = i = 1 k ( u ik λ k · θ ik ) i = 1 k θ ik
In the formula, Wi is the weight of the i-th index; θik is the variance percentage of the i-th index on the k-th principal component. The membership degree rising function f(x) calculation formula is as follows:
f ( x ) = { 1.0   x > x 2 0.9 ( x x 1 ) ( x 2 + x 1 ) + 0.1   x 1 < x x 2 0.1   x < x 1
In the formula, x1 is the minimum value of the soil index threshold; x2 is the maximum value of the soil index threshold.

2.5. Data Processing Methods

SPSS 22.0 statistical software and Sigma Plot 14.0 were used for statistical analysis and data plotting, respectively. Tukey’s multiple comparison test was used to detect differences among treatments at the 0.05 significance level. In addition, the relationships among all the parameters (soil nutrient content) were calculated using a bivariate correlation analysis (Pearson correlation coefficient and double-tailed significance test).

3. Results and Analysis

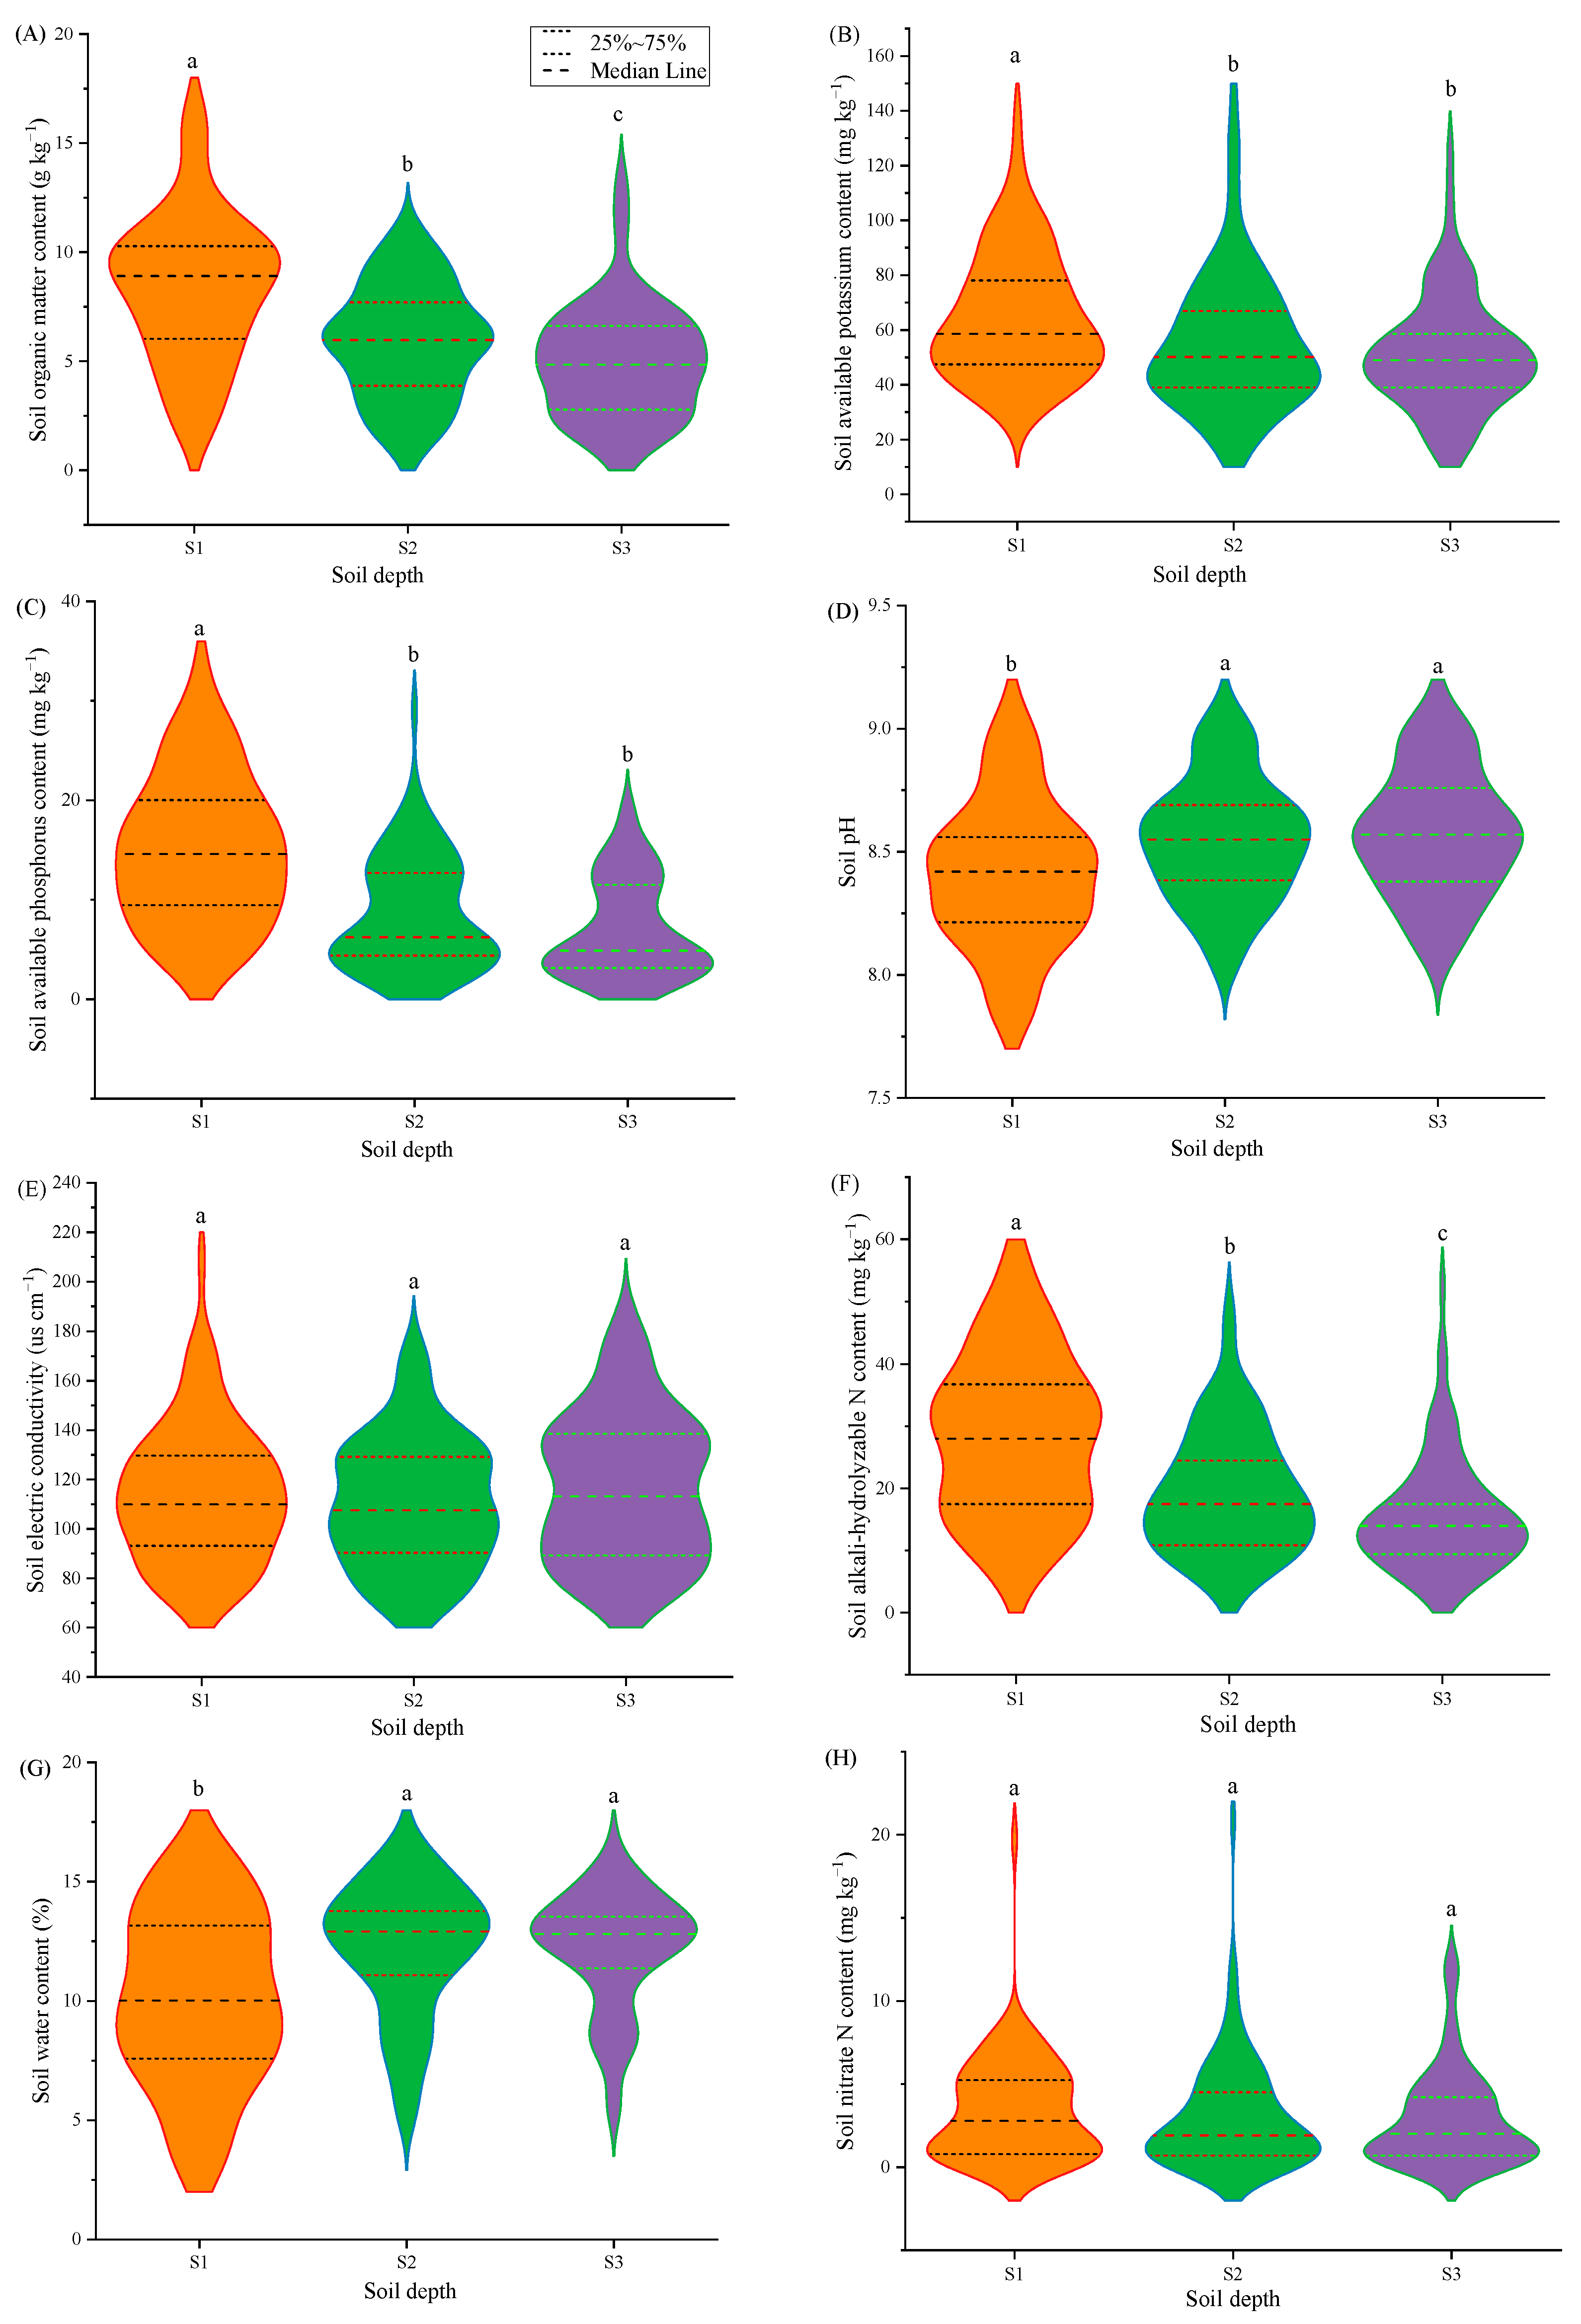
3.1. Soil Physical and Chemical Properties

The soil organic matter content in soil layer S1 was significantly different from that in soil layer S2 and S3, but there was no significant difference between S2 and S3 (Figure 2A). The organic matter content in the soil layer S1 was up to 8.4 g kg−1 on average, which was 30% and 40.7% higher than that in higher than that in S2 and S3, respectively. The available potassium content in soil layer S1 was significantly different from that in soil layer S2 and S3, but there was no significant difference between S2 and S3 (Figure 2B). The available potassium content in soil layer S1 was the highest at 69.1 mg kg−1 on average, which was 19.7% higher than that in S2 and 26% higher than that in S3. The soil available phosphorus content in soil layer S1 was significantly different from that in soil layer S2 and S3, but there was no significant difference between S2 and S3 (Figure 2C). As the depth of the soil layer decreased, the available phosphorus content showed a decreasing trend. The soil available phosphorus content in soil layer S1 was the highest at 16.9 mg kg−1 on average, which was 49.3% and 58.7% higher than that in S2 and S3, respectively. The soil pH in S1 soil layer is significantly different from S2 and S3 (Figure 2D). As the depth of the soil layer decreased, the pH value increased. The average soil pH value of the S3 soil layer was 8.6, which was 1.9% and 0.3% higher than that in S1 and S2, respectively.
There is no significant difference in the electrical conductivity among soil layers (Figure 2E). The soil alkaline hydrolyzable N content in soil layer S1 was significantly different from that in soil layer S2 and S3, and the difference between S2 and S3 was significant (Figure 2F). The soil alkali-hydrolyzable N content decreased with the decrease of soil depth. The soil alkali-hydrolyzable N content in soil layer S1 was the highest at 28.5 mg kg−1 on average, which was 32% and 45.2% higher than that in S2 and S3, respectively. The soil water content in soil layer S1 was significantly different from that in soil layer S2 and S3 (Figure 2G). The soil water content of soil layer S2 (12.18%) and S3 (12.14%) was higher on average, which was 14.4% and 19.1% higher than that of S1. There was no significant difference in the soil nitrate nitrogen content between the soil layers (Figure 2H).

3.2. The Establishment of the Minimum Data Set MDS

Based on the results of principal component analysis (Table 1), the eigenvalues of the first three principal components are greater than 1, and the cumulative contribution rate of the three principal components is 64%.
According to the principal component analysis load matrix (Table 2) and the screening criteria, the final soil organic matter content, soil pH value, soil electric conductivity, and soil alkaline hydrolyzable N content entered PC1, thesoil available potassium content and soil nitrate N content entered PC2, and soil available phosphorus content and soil water content entered PC3.
The vector normal of each indicator is shown in Table 2, and selects the indicator whose vector normal is in the range of 10% of the highest total score in each group. The indicators entering MDS are the soil organic matter content, soil available potassium content, and soil available phosphorus content. Correlation tests between soil indicators were used to screen MDS indicators. Highly correlated indicators with the highest vector normal entered the smallest data set. Low correlations entered the same group of indicators into the MDS. It can be known from the Table 3 that the MDS index has a significant correlation with each soil nutrient index (p < 0.05), which satisfies the comprehensive evaluation of nutrients instead of all soil indicators. Therefore, the indicators that finally entered MDS were the soil organic matter content, soil available potassium content and soil available phosphorus content.

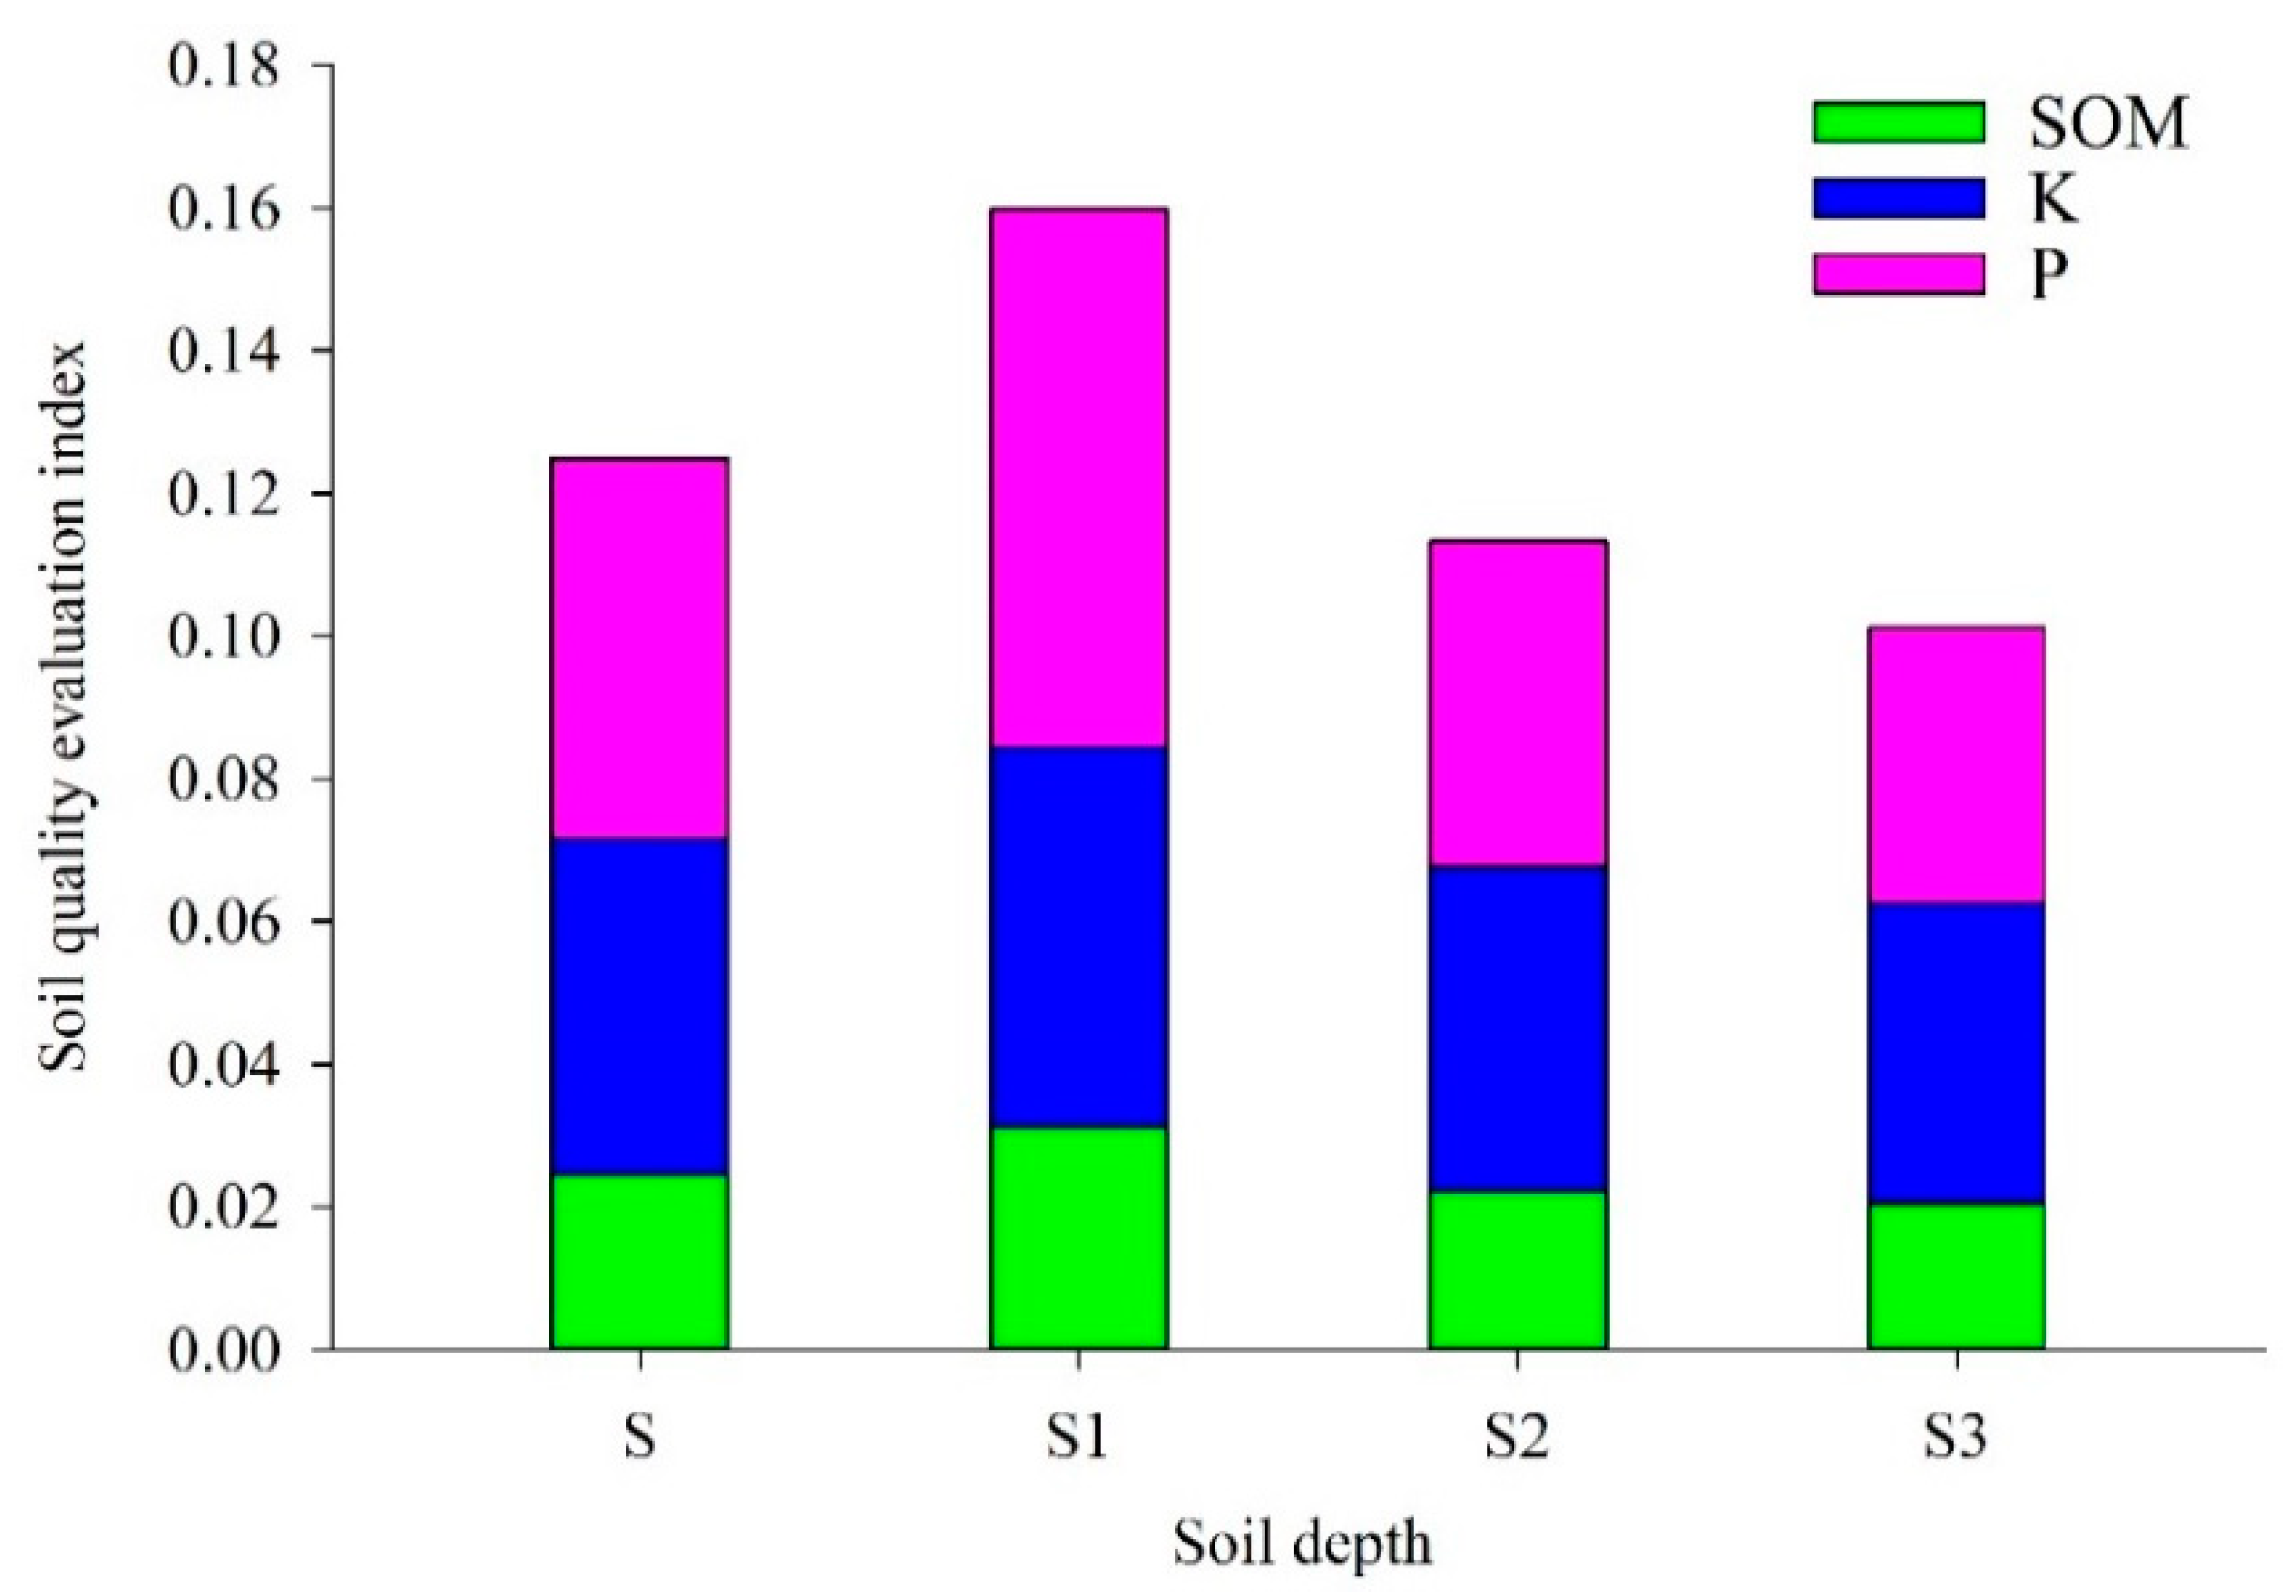
3.3. Comprehensive Evaluation of Nutrients

According to the results of the principal component analysis, the weight of the soil nutrient index of MDS was calculated, and the results were shown in Table 4. The weights of soil indexes mainly included soil organic matter (0.176), soil available potassium (0.164), and soil available phosphorus (0.192). The soil organic matter, available potassium and available phosphorus in this survey all had a positive effect on the growth of potato, which belonged to the ascending membership function. The turning point value of the function curve and the determination of index membership are shown in Table 4.
The soil quality evaluation index (SQI) is shown in Table 5. The SQI of this study ranged from 0.064 to 0.302, which was classified as Grade I (SQI < 0.122), Grade II (0.122 < SQI < 0.186), and Grade III (SQI > 0.186). In this study, the soil nutrient evaluation index showed moderate variation, among which SQI was 8.2% of Grade III, 55.6% of Grade II, and 36.2% of Grade I. As the depth of the soil layer decreases, the SQI shows a downward trend, and the SQI varies significantly between layers. Grade I of SQI in S1 is relatively high, while Grade II is the lowest. The proportion of Grade II in SQI of S2 layer and S3 layer is relatively high, while that of Grade III is relatively low, showing that the proportion of Grade I and II tends to be stable, and the proportion of Grade III tends to 0.

3.4. Evaluation of Nutrients in Different Soil Layers

The cumulative value of the soil nutrient quality evaluation index based on the composition of organic matter, available potassium and available phosphorus is shown in Figure 3. The soil nutrient quality evaluation index is a large proportion of medium-speed potassium and fast-effect phosphorus, and the minimum of organic matter is the main problem of soil nutrient in the area.
With the increase of soil depth, the proportion of organic matter, available potassium and available phosphorus in the evaluation index all decreased. The proportion of soil available phosphorus in layer S1 is the largest, and the proportion of soil available potassium and phosphorus in layer S2 and layer S3 is similar.

4. Discussion

Many researchers use quantitative evaluation and mathematical models to study soil nutrients [40,41,42]. In this study, principal component analysis was used to screen eight soil indicators, and finally soil organic matter, available potassium and available phosphorus and nitrogen were determined as MDS. The cumulative contribution rate of soil indicators in the MDS constructed in this study was 63.98%, and correlation analysis showed that each soil index was significantly correlated with the construction of MDS soil indicators. Soil organic matter, soil available potassium, soil available phosphorus and soil nitrate nitrogen play an important role in constructing the MDS of soil nutrient evaluation [43]. Different factors are selected to participate in the evaluation of soil quality, leading to slightly different key factors in the final evaluation. The soil quality evaluation is sufficient to study specific land functions and land use types.
The SQI range of this survey is 0.064 to 0.302, which is divided into three levels, namely Grade I (SQI < 0.122), Grade II (0.122 < SQI < 0.186), and Grade III (SQI > 0.186). The soil nutrient quality evaluation index of 91.8% in the Loess Plateau was in grade I and grade II, and the soil nutrient evaluation index was poor overall. Some studies have also shown that the Loess Plateau belongs to low quality cultivated land, with large topographic fluctuation, a lack of irrigation conditions, poor soil quality and low soil nutrient content [44,45]. The scope of this study was 0 to 60 cm soil layer, and the SQI showed a downward trend as the soil layer decreased, and there were significant differences in the SQI among different layers. This is similar to the distribution of soil nutrients in farmland by many researchers [46,47]. The proportion of SQI of topsoil S1 in each grade ranged from large to small as Grade I > Grade II > Grade III; SQI varies with the change of region and the range of change is large in this study.
Continuous fertilizer application resulted in the enrichment of soil nutrients in the topsoil, but the soil nutrients were lost due to ammonia volatilization, runoff and leaching, etc., resulting in a great change in the content of soil nutrients in the topsoil [48,49,50]. The SQI of middle soil S2 and lower soil S3 was higher in Grade II and lower in Grade III. With the advance of the growth period, soil nutrients slowly migrate downward, and the amount of nutrients taken away by crops in the middle and lower soils gradually increases, resulting in the decrease of nutrient content in the middle and lower soils. The same study showed that the soil nutrient content in the 0 to 40 cm soil layer of sloping farmland on the Loess Plateau was the highest, and the nutrient content decreased with the increase of profile depth [51].
In the composition of soil nutrient quality index in this study, soil nitrate nitrogen and soil available potassium accounted for a large proportion, while soil organic matter accounted for the smallest proportion, indicating that soil organic matter became the limiting factor of soil nutrient quality in this region. In the past 20 years, soil nutrient observation data in the Loess Plateau region showed that organic matter content was still in a deficient state [52]. Soil organic matter plays an important role in providing nutrients and improving soil fertility. The results showed that the long-term application of organic fertilizer significantly increased the content of soil organic carbon, and the combined application of nitrogen and phosphate fertilizer increased the content of soil available nutrients [53]. Therefore, it is suggested to increase the input of organic matter in this area for a long time to improve and enhance soil fertility.
The reasons for the poor soil nutrient quality are poor soil physical and chemical properties, low input or large nutrient loss. This area is an ecologically fragile area, and concentrated rainfall leads to the coexistence of soil and water loss and nutrient loss. A large number of investigations showed that the traditional fertilization situation in this area was the insufficient application of organic fertilizer, excessive and insufficient input of nitrogen and phosphorus fertilizer, and less applications of potassium fertilizer. This study shows that the soil nutrients in this region are in a state of scarcity, so fertilization measures should be formulated to enhance the soil nutrient content in this region and prevent serious soil degradation caused by planting. The results show that the adjustment of the fertilization depth in Loess Plateau is beneficial to improve the utilization efficiency of fertilizer [54]. In order to improve the effective accumulation of soil nutrients in potato fields, it is suggested to apply deep fertilizer, increase the input of organic fertilizer and reasonable N-P-K application in this area.

5. Conclusions

In this study, the MDS evaluation indexes of soil nutrients in northern Shaanxi were soil organic matter, soil available potassium and soil available phosphorus. The SQI value range was 0.0638 to 0.469, and the overall soil nutrient evaluation index is poor. The proportion of soil nutrient indicators in the SQI was in the order of soil available K = soil available P > soil organic matter, and organic matter has become the limiting factor for soil nutrients in the region. In order to ensure the soil nutrient accumulation and sustainable agricultural development of potato farmland in the Loess Plateau, it is suggested to increase the fertilization depth, especially the potato root layer depth (20 to 40 cm), and further study is needed to determine the optimal ratio of nitrogen, phosphorus and potassium fertilizer.

Author Contributions

Y.X., N.W. and X.N. wrote the paper, X.W. designed the study idea and applied the model to calculated, Y.X., N.W., X.N. and W.J. collected and arranged the whole database, Y.X. and X.W. analyzed and discussed. All the authors revised the manuscript. All authors have read and agreed to the published version of the manuscript.

Funding

This research was funded the National Natural Science Foundation (51669034, 51809224) and Key Scientific Research Program of Education Department of Shaanxi Province (18JS117). The APC was funded by the National Natural Science Foundation (51809224).

Institutional Review Board Statement

Not applicable.

Informed Consent Statement

Not applicable.

Data Availability Statement

The data presented in this study are available on request from the corresponding author.

Acknowledgments

We thank Jia Yun, Huihui Zhang, Tao Guo and Tianmei Li for providing us with experimental field plots and helping us to collect the data.

Conflicts of Interest

The authors declare no conflict of interest.

References

  1. Cowie, A.L.; Penman, T.D.; Gorissen, L.; Winslow, M.D.; Lehmann, J.; Tyrrell, T.D.; Twomlow, S.; Wilkes, A.; Lal, R.; Jones, J.W.; et al. Towards sustainable land management in the drylands: Scientific connections in monitoring and assessing dryland degradation, climate change and biodiversity. Land Degrad. Dev. 2011, 22, 248–260. [Google Scholar] [CrossRef]
  2. Mucina, L.; Wardell-Johnson, G.W. Landscape age and soil fertility, climatic stability, and fire regime predictability: Beyond the OCBIL framework. Plant Soil 2011, 341, 1–23. [Google Scholar] [CrossRef]
  3. Panigrahi, P.; Srivastava, A.K.; Panda, D.K.; Huchche, A.D. Rainwater, soil and nutrients conservation for improving productivity of citrus orchards in a drought prone region. Agric. Water Manag. 2017, 185, 65–77. [Google Scholar] [CrossRef]
  4. Yageta, Y.; Osbahr, H.; Morimoto, Y.; Clark, J. Comparing farmers’ qualitative evaluation of soil fertility with quantitative soil fertility indicators in Kitui County, Kenya. Geoderma 2019, 344, 153–163. [Google Scholar] [CrossRef]
  5. Hengl, T.; Leenaars, J.G.B.; Shepherd, K.D.; Walsh, M.G.; Heuvelink, G.B.M.; Mamo, T.; Tilahun, H.; Berkhout, E.; Cooper, M.; Fegraus, E.; et al. Soil nutrient maps of Sub-Saharan Africa: Assessment of soil nutrient content at 250 m spatial resolution using machine learning. Nutr. Cycl. Agroecosyst. 2017, 109, 77–102. [Google Scholar] [CrossRef] [Green Version]
  6. Zhao, Z.; Liu, G.; Liu, Q.; Huang, C.; Li, H.; Wu, C. Distribution characteristics and seasonal variation of soil nutrients in the Mun River Basin, Thailand. Int. J. Environ. Res. Public Health 2018, 15, 1818. [Google Scholar] [CrossRef] [Green Version]
  7. Wang, X.; Fan, J.; Xing, Y.; Xu, G.; Wang, H.; Deng, J.; Wang, Y.; Zhang, F.; Li, P.; Li, Z. Chapter three-The effects of mulch and nitrogen fertilizer on the soil environment of crop plants. In Advances Agronomy; Sparks, D.L., Ed.; Academic Press: Cambridge, MA, USA, 2019; Volume 153, pp. 121–173. [Google Scholar]
  8. Wang, X. Consumption of cropland with high yield and low irrigation water intensity by urban expansion in China during 2000–2015. Ecol. Indic. 2020, 117, 106644. [Google Scholar] [CrossRef]
  9. Gong, H.; Meng, D.; Li, X.; Zhu, F. Soil degradation and food security coupled with global climate change in northeastern China. Chin. Geogr. Sci. 2013, 23, 562–573. [Google Scholar] [CrossRef] [Green Version]
  10. Wang, X.; Guo, T.; Wang, Y.; Xing, Y.; Wang, Y.; He, X. Exploring the optimization of water and fertilizer management practices for potato production in the sandy loam soils of Northwest China based on PCA. Agric. Water Manag. 2020, 237, 106180. [Google Scholar] [CrossRef]
  11. Wang, H.; Wang, X.; Bi, L.; Wang, Y.; Fan, J.; Zhang, F.; Hou, X.; Cheng, M.; Hu, W.; Wu, L.; et al. Multi-objective optimization of water and fertilizer management for potato production in sandy areas of northern China based on TOPSIS. Field Crops Res. 2019, 240, 55–68. [Google Scholar] [CrossRef]
  12. Grant, C.A.; Peterson, G.A.; Campbell, C.A. Nutrient considerations for diversified cropping systems in the Northern Great Plains. Agron. J. 2002, 94, 186–198. [Google Scholar] [CrossRef]
  13. Techen, A.-K.; Helming, K.; Brüggemann, N.; Veldkamp, E.; Reinhold-Hurek, B.; Lorenz, M.; Bartke, S.; Heinrich, U.; Amelung, W.; Augustin, K.; et al. Chapter Four—Soil research challenges in response to emerging agricultural soil management practices. In Advances in Agronomy; Sparks, D.L., Ed.; Academic Press: Cambridge, MA, USA, 2020; Volume 161, pp. 179–240. [Google Scholar]
  14. Van Evert, F.K.; Gaitán-Cremaschi, D.; Fountas, S.; Kempenaar, C. Can precision agriculture increase the profitability and sustainability of the production of potatoes and olives? Sustainability 2017, 9, 1863. [Google Scholar] [CrossRef] [Green Version]
  15. Wang, F.; Yang, S.; Wei, Y.; Shi, Q.; Ding, J. Characterizing soil salinity at multiple depth using electromagnetic induction and remote sensing data with random forests: A case study in Tarim River Basin of southern Xinjiang, China. Sci. Total Environ. 2021, 754, 142030. [Google Scholar] [CrossRef] [PubMed]
  16. Wu, C.; Liu, G.; Huang, C.; Liu, Q. Soil quality assessment in Yellow River Delta: Establishing a minimum data set and fuzzy logic model. Geoderma 2019, 334, 82–89. [Google Scholar] [CrossRef]
  17. Obriot, F.; Stauffer, M.; Goubard, Y.; Cheviron, N.; Peres, G.; Eden, M.; Revallier, A.; Vieublé-Gonod, L.; Houot, S. Multi-criteria indices to evaluate the effects of repeated organic amendment applications on soil and crop quality. Agric. Ecosyst. Environ. 2016, 232, 165–178. [Google Scholar] [CrossRef]
  18. Paz-Ferreiro, J.; Fu, S. Biological indices for soil quality evaluation: Perspectives and limitations. Land Degrad. Dev. 2016, 27, 14–25. [Google Scholar] [CrossRef]
  19. Feng, Y.; Wang, J.; Liu, T.; Bai, Z.; Reading, L. Using computed tomography images to characterize the effects of soil compaction resulting from large machinery on three-dimensional pore characteristics in an opencast coal mine dump. J. Soils Sediments 2019, 19, 1467–1478. [Google Scholar] [CrossRef]
  20. Behrends Kraemer, F.; Soria, M.A.; Castiglioni, M.G.; Duval, M.; Galantini, J.; Morrás, H. Morpho-structural evaluation of various soils subjected to different use intensity under no-tillage. Soil Tillage Res. 2017, 169, 124–137. [Google Scholar] [CrossRef]
  21. Qu, Q.; Xu, H.; Xue, S.; Liu, G. Stratification ratio of rhizosphere soil microbial index as an indicator of soil microbial activity over conversion of cropland to forest. Catena 2020, 195, 104761. [Google Scholar] [CrossRef]
  22. Zungu, N.S.; Egbewale, S.O.; Olaniran, A.O.; Pérez-Fernández, M.; Magadlela, A. Soil nutrition, microbial composition and associated soil enzyme activities in KwaZulu-Natal grasslands and savannah ecosystems soils. Appl. Soil Ecol. 2020, 155, 103663. [Google Scholar] [CrossRef]
  23. Lisetskii, F.; Stolba, V.F.; Marinina, O. Indicators of agricultural soil genesis under varying conditions of land use, Steppe Crimea. Geoderma 2015, 239–240, 304–316. [Google Scholar] [CrossRef] [Green Version]
  24. Carter, M.R. Soil quality for sustainable land management. Agron. J. 2002, 94, 38–47. [Google Scholar] [CrossRef]
  25. Li, X.; Li, H.; Yang, L.; Ren, Y. Assessment of soil quality of croplands in the corn belt of Northeast China. Sustainability 2018, 10, 248. [Google Scholar] [CrossRef] [Green Version]
  26. Mahajan, G.; Das, B.; Morajkar, S.; Desai, A.; Murgaokar, D.; Kulkarni, R.; Sale, R.; Patel, K. Soil quality assessment of coastal salt-affected acid soils of India. Environ. Sci. Pollut. Res. 2020, 27, 26221–26238. [Google Scholar] [CrossRef]
  27. Choudhury, B.U.; Mandal, S. Indexing soil properties through constructing minimum datasets for soil quality assessment of surface and profile soils of intermontane valley (Barak, North East India). Ecol. Indic. 2021, 123, 107369. [Google Scholar] [CrossRef]
  28. Wang, D.; Bai, J.; Wang, W.; Zhang, G.; Cui, B.; Liu, X.; Li, X. Comprehensive assessment of soil quality for different wetlands in a Chinese delta. Land Degrad. Dev. 2018, 29, 3783–3794. [Google Scholar] [CrossRef]
  29. Karaca, S.; Dengiz, O.; Demirağ Turan, İ.; Özkan, B.; Dedeoğlu, M.; Gülser, F.; Sargin, B.; Demirkaya, S.; Ay, A. An assessment of pasture soils quality based on multi-indicator weighting approaches in semi-arid ecosystem. Ecol. Indic. 2021, 121, 107001. [Google Scholar] [CrossRef]
  30. Armenise, E.; Redmile-Gordon, M.; Stellacci, A.; Ciccarese, A.; Rubino, P. Developing a soil quality index to compare soil fitness for agricultural use under different managements in the Mediterranean environment. Soil Tillage Res. 2013, 130, 91–98. [Google Scholar] [CrossRef]
  31. Yuan, P.; Wang, J.; Li, C.; Xiao, Q.; Liu, Q.; Sun, Z.; Wang, J.; Cao, C. Soil quality indicators of integrated rice-crayfish farming in the Jianghan Plain, China using a minimum data set. Soil Tillage Res. 2020, 204, 104732. [Google Scholar] [CrossRef]
  32. Andrews, S.S.; Karlen, D.L.; Cambardella, C.A. The soil management assessment framework. Soil Sci. Soc. Am. J. 2004, 68, 1945–1962. [Google Scholar] [CrossRef]
  33. Wang, N.; Xing, Y.; Wang, X. Exploring options for improving potato productivity through reducing crop yield gap in Loess Plateau of China based on grey correlation analysis. Sustainability 2019, 11, 5621. [Google Scholar] [CrossRef] [Green Version]
  34. Li, W.; Wang, D.; Liu, S.; Zhu, Y.; Yan, Z. Reclamation of cultivated land reserves in Northeast China: Indigenous ecological insecurity underlying national food security. Int. J. Environ. Res. Public Health 2020, 17, 1211. [Google Scholar] [CrossRef] [Green Version]
  35. Sukweenadhi, J.; Balusamy, S.R.; Kim, Y.J.; Lee, C.H.; Kim, Y.J.; Koh, S.C.; Yang, D.C. A growth-promoting bacteria, Paenibacillus yonginensis DCY84T enhanced salt stress tolerance by activating defense-related systems in Panax ginseng. Front. Plant Sci. 2018, 9, 813. [Google Scholar] [CrossRef] [Green Version]
  36. Bremner, J. Determination of nitrogen in soil by the Kjeldahl method. J. Agric. Sci. 1960, 55, 11–33. [Google Scholar] [CrossRef]
  37. Raiesi, F. A minimum data set and soil quality index to quantify the effect of land use conversion on soil quality and degradation in native rangelands of upland arid and semiarid regions. Ecol. Indic. 2017, 75, 307–320. [Google Scholar] [CrossRef]
  38. Vasu, D.; Tiwari, G.; Sahoo, S.; Dash, B.; Jangir, A.; Sharma, R.P.; Naitam, R.; Tiwary, P.; Karthikeyan, K.; Chandran, P. A minimum data set of soil morphological properties for quantifying soil quality in coastal agroecosystems. Catena 2020, 198, 105042. [Google Scholar] [CrossRef]
  39. Yu, P.; Liu, S.; Zhang, L.; Li, Q.; Zhou, D. Selecting the minimum data set and quantitative soil quality indexing of alkaline soils under different land uses in northeastern China. Sci. Total Environ. 2018, 616, 564–571. [Google Scholar] [CrossRef] [PubMed]
  40. Kwiatkowska-Malina, J. Qualitative and quantitative soil organic matter estimation for sustainable soil management. J. Soils Sediments 2018, 18, 2801–2812. [Google Scholar] [CrossRef] [Green Version]
  41. Abdel-Fattah, M.K.; Mohamed, E.S.; Wagdi, E.M.; Shahin, S.A.; Aldosari, A.A.; Lasaponara, R.; Alnaimy, M.A. Quantitative evaluation of soil quality using Principal Component Analysis: The case study of El-Fayoum depression Egypt. Sustainability 2021, 13, 1824. [Google Scholar] [CrossRef]
  42. Wang, Z.; Wang, G.; Zhang, Y.; Wang, R. Quantification of the effect of soil erosion factors on soil nutrients at a small watershed in the Loess Plateau, Northwest China. J. Soils Sediments 2020, 20, 745–755. [Google Scholar] [CrossRef]
  43. Li, H.; Zhu, N.; Wang, S.; Gao, M.; Xia, L.; Kerr, P.G.; Wu, Y. Dual benefits of long-term ecological agricultural engineering: Mitigation of nutrient losses and improvement of soil quality. S. Total Environ. 2020, 721, 137848. [Google Scholar] [CrossRef] [PubMed]
  44. Ma, J.; Chen, Y.; Wang, H.; Wang, H.; Wu, J.; Su, C.; Xu, C. Newly created farmland should be artificially ameliorated to sustain agricultural production on the Loess Plateau. Land Degrad. Dev. 2020, 31, 2565–2576. [Google Scholar] [CrossRef]
  45. Gong, J.; Chen, L.; Fu, B.; Huang, Y.; Huang, Z.; Peng, H. Effect of land use on soil nutrients in the loess hilly area of the Loess Plateau, China. Land Degrad. Dev. 2006, 17, 453–465. [Google Scholar] [CrossRef]
  46. D’Hose, T.; Cougnon, M.; De Vliegher, A.; Vandecasteele, B.; Viaene, N.; Cornelis, W.; Van Bockstaele, E.; Reheul, D. The positive relationship between soil quality and crop production: A case study on the effect of farm compost application. Appl. Soil Ecol. 2014, 75, 189–198. [Google Scholar] [CrossRef]
  47. Jokela, W.; Posner, J.; Hedtcke, J.; Balser, T.; Read, H. Midwest Cropping System Effects on Soil Properties and on a Soil Quality Index. Agron. J. 2011, 103, 1552–1562. [Google Scholar] [CrossRef]
  48. Rotz, C.A.; Taube, F.; Russelle, M.P.; Oenema, J.; Sanderson, M.A.; Wachendorf, M. Whole-farm perspectives of nutrient flows in grassland agriculture. Crop Sci. 2005, 45, 2139–2159. [Google Scholar] [CrossRef]
  49. Carmo, M.; García-Ruiz, R.; Ferreira, M.I.; Domingos, T. The N-P-K soil nutrient balance of Portuguese cropland in the 1950s: The transition from organic to chemical fertilization. Sci. Rep. 2017, 7, 1–14. [Google Scholar] [CrossRef] [PubMed] [Green Version]
  50. Smith, K.A. Changing views of nitrous oxide emissions from agricultural soil: Key controlling processes and assessment at different spatial scales. Eur. J. Soil Sci. 2017, 68, 137–155. [Google Scholar] [CrossRef]
  51. Tian, H.; Qiao, J.; Zhu, Y.; Jia, X.; Shao, M.A. Vertical distribution of soil available phosphorus and soil available potassium in the critical zone on the Loess Plateau, China. Sci. Rep. 2021, 11, 1–10. [Google Scholar] [CrossRef]
  52. Wang, X.; Wang, G.; Tao Guo, T.; Xing, Y.; Mo, F.; Wang, H.; Fan, J.; Zhang, F. Effects of plastic mulch and nitrogen fertilizer on the soil microbial community, enzymatic activity, and yield performance in a dryland maize cropping system. Eur. J. Soil Sci. 2021, 72, 400–412. [Google Scholar] [CrossRef]
  53. Manna, M.; Swarup, A.; Wanjari, R.; Ravankar, H.; Mishra, B.; Saha, M.; Singh, Y.; Sahi, D.; Sarap, P. Long-term effect of fertilizer and manure application on soil organic carbon storage, soil quality and yield sustainability under sub-humid and semi-arid tropical India. Field Crops Res. 2005, 93, 264–280. [Google Scholar] [CrossRef]
  54. Wang, X.; Wang, N.; Xing, Y.; Yun, J.; Zhang, H. Effects of plastic mulching and basal nitrogen application depth on nitrogen use efficiency and yield in maize. Front. Plant Sci. 2018, 9, 1446. [Google Scholar] [CrossRef] [PubMed]
Figure 1. The map depicts the collection area of soil and plant samples on the Loess Plateau of China. These circles indicate the location of the experiment site. The thick line represents the city boundary and the thin line represents the county boundary.
Sustainability 13 03957 g001
Figure 2. The relationship between soil depth and soil organic matter content (A), soil available potassium content (B), soil available phosphorus content (C), soil pH (D), soil electric conductivity (E), soil alkaline hydrolyzable N content (F), soil water content (G), and soil nitrate N content (H). 0 to 20 cm was determined as S1, 20 to 40 cm was determined as S2, and 40 to 60 cm was determined as S3. The different letters indicate significant differences at p < 0.05.
Sustainability 13 03957 g002
Figure 3. Cumulative histogram of soil quality comprehensive index.
Sustainability 13 03957 g003
Table 1. Eigenvalue and contribution rate in principal components analysis.
ComponentInitial EigenvaluesExtract the Sum of Squares and Load It
TotalVariance (%)Accumulation (%)TotalVariance (%)Accumulation (%)
12.38629.82529.8252.38629.82529.825
21.59119.8949.7151.59119.8949.715
31.14214.26963.9841.14214.26963.984
Table 2. Principal component loading matrix and calculated vector normal.
IndicatorPrincipal ComponentVector Normal
PC1PC2PC3
SOM0.8540.067−0.0691.324
K0.3620.673−0.1611.031
P0.480−0.0210.6851.042
pH−0.5560.4920.2261.087
EC0.532−0.292−0.0150.901
SAN0.8110.1180.0961.266
SWC0.1910.546−0.6020.988
SNN−0.0880.7030.4681.027
Note: SOM, soil organic matter content; K, soil available potassium content; P, soil available phosphorus content; EC, soil electric conductivity; SAN, soil alkaline hydrolyzable N content; SWC, soil water content; SNN, soil nitrate N content.
Table 3. Correlation coefficient between matrix among soil fertility indicators.
IndicatorsSOMKPpHECSANSWCSNN
SOM1
K0.322 **1
P0.278 **0.0691
pH−0.355 **0.034−0.178 **1
EC0.403 **−0.060.112−0.210 **1
SAN0.601 **0.254 **0.346 **−0.312 **0.292 **1
SWC0.158 *0.300 **−0.139 *0.014−0.0180.142 *1
SNN−0.0510.213 **0.1110.365 **−0.1110.0390.1121
Note: ** Significant correlation at level 0.01 (both sides); * Significant correlation at level 0.05 (both sides); SOM, soil organic matter content; K, soil available potassium content; P, soil available phosphorus content; EC, soil electric conductivity; SAN, soil alkaline hydrolyzable N content; SWC, soil water content; SNN, soil nitrate N content.
Table 4. Communality and weight of soil quality indicators in the MDS.
MDSCommon Factor VarianceWeightinessTurning PointMembership Function
X1X2
SOM0.2600.176640Distribution curve of upper ring type
K0.2420.16420200
P0.2830.192340
Note: SOM, soil organic matter content; K, soil available potassium content; P, soil available phosphorus content.
Table 5. Classification of scores for comprehensive evaluation of soil nutrients.
Soil depthSQI RangeabilitySQI MeanSQI Standard DeviationSQI Coefficient of VariationThe Proportion of Different Soil Fertility
IIIIII
SQI < 0.1220.122 < SQI < 0.186SQI > 0.186
S0.064–0.3020.1250.04334.8%0.3620.5560.082
S10.083–0.2810.160 a0.04527.9%0.6050.1730.222
S20.069–0.3020.113 b0.03430.0%0.2590.7160.025
S30.064–0.1610.101 c0.02524.8%0.2220.7780.000
Note: Significant differences in lowercase letters (p < 0.05).
Publisher’s Note: MDPI stays neutral with regard to jurisdictional claims in published maps and institutional affiliations.

