1. Introduction
China’s marine economy had experienced significant development over the past 20 years. Its gross ocean product (GOP) increased at an average annual rate of 6.7% in the last five years, accounting for nearly 10% of the GDP in 2019 [
1]. However, the rapid industrial expansion has brought in resources misallocation and marine pollution. The Ocean Development Report of China (2014) showed the growth rate of China’s marine economy had entered a transition from rapid to moderate, as it encountered unwieldy industry structures and low transformation rates in innovation and technological achievement [
2]. “Blue Growth Agenda” highlights the need to “harness the untapped potential of Europe’s oceans, seas and coasts for jobs and growth.” [
3]. Realizing the need to create not just a prosperously but more importantly sustainable marine economy, the Chinese government had taken many steps to promote the transformation of its marine industry. Efforts had been made to assist the transfer of marine industries through a series of favorable policies in terms of talents, funds, finance, taxes, and services as well as encourage marine companies to develop environmental-friendly facilities [
4]. In 2011, the 12th Five-Year (2011–2015) Plan was announced and specified “marine industry structure optimization” and “strengthening comprehensive marine management” as key points. Furthermore, in 2012, the 18th National Congress of the Communist Party of China set forth a nationally strategic aimed of building an ocean power through putting emphasis on developing marine economy and reinforced the concept of “ecological civilization”. (The “ecological civilization” concept first appeared in 2007, in a report to the 17th National People’s Congress. At the Third Plenary Session of the 18th Central Committee in 2014, Xi stressed that China would implement “ecological civilization” reforms that are made to reconcile contradictions between economic development and the environment.)
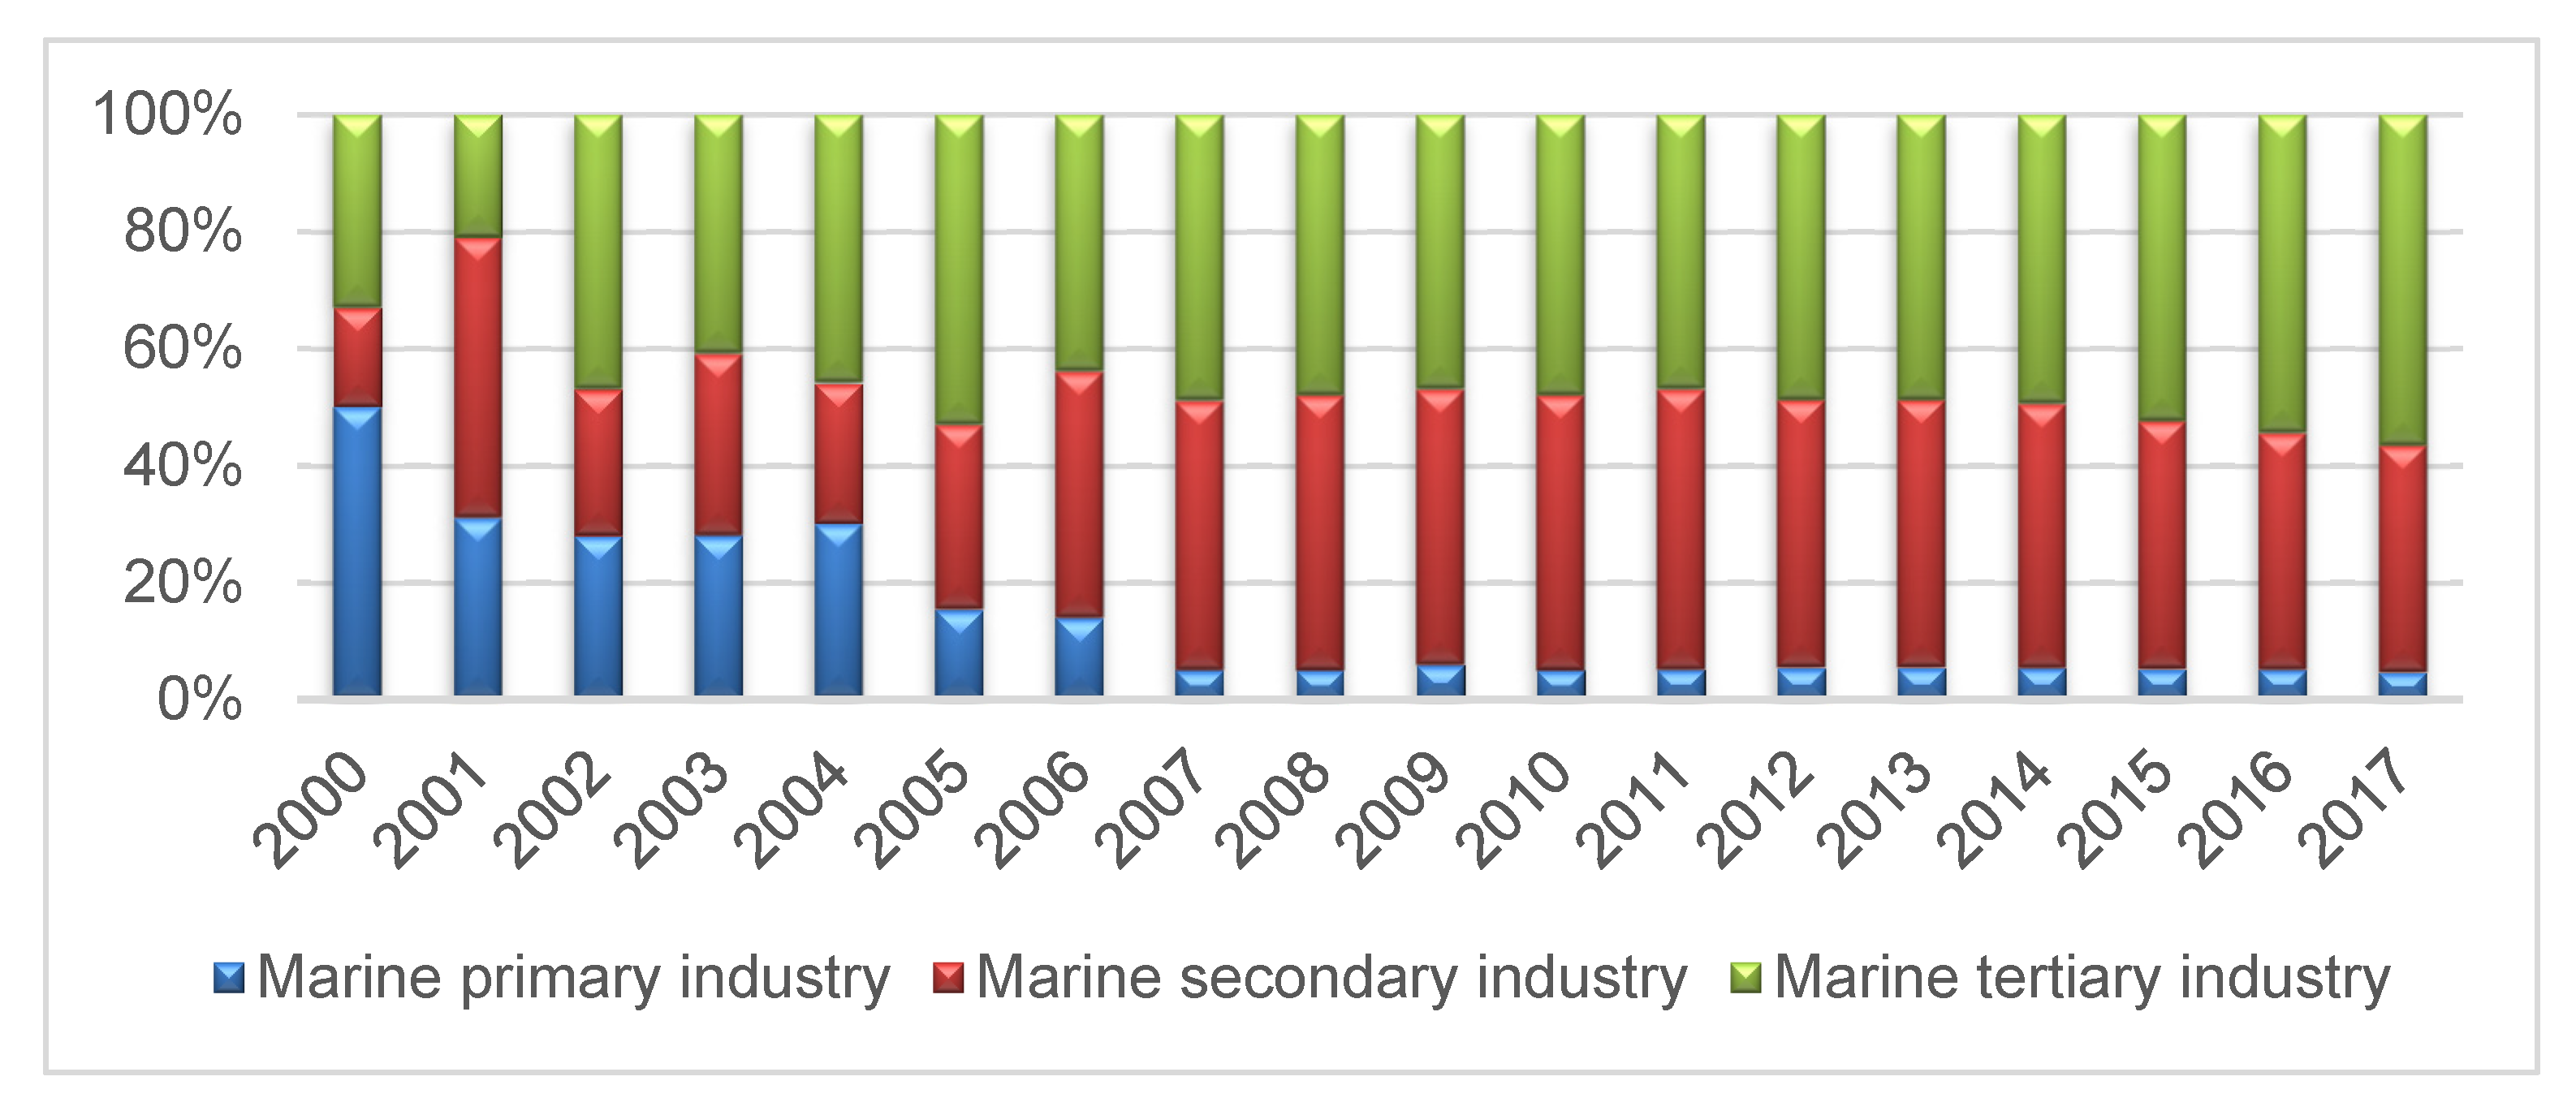
With these important development strategies, China’s marine economy was gradually shifting towards improvement in quality and efficiency. The restructuring process in marine industry is evident with the primary industry dropping from 50.43% to 4.6% and in the meantime the share of the secondary and tertiary industries rising from 16.78% to 38.8% and 32.79% to 56.6%, respectively from 2000 to 2017 (See
Figure 1). The added value of marine tertiary industry in China had surpassed that of secondary industry and showed the highest contribution to marine economy [
5]. It is well known that the industrial structure upgrading is crucial to economic efficiency with two contrary effects, “structural bonus hypothesis” and “cost disease hypothesis”. Does the above statistics illustrate the positive interaction between China’s marine industrial structure and the marine economic efficiency? Recently, the “Development Plan for the Blue Economic Rim” (this is the first national development strategy approved in the first year of the 12th Five-Year Plan, and the first regional development strategy with marine economy as the theme in China [
6]) of the Bohai Economic Rim, the “822” Action Plan (the “822” Action Plan for Zhejiang Marine Economic Development refers to supporting the development of eight modern marine industries, cultivating, and constructing marine industrial bases, and implementing major marine economic construction projects [
7]) for marine economic development in Zhejiang province and the development plan for Marine Science and Technology Talents in Jiangsu province were put forward successively. (The development plan for Marine Science and Technology innovation during the 13th Five-Year Plan period has clarified the development ideas, development objectives, key technological development directions, key tasks and safeguard measures for Marine Science and Technology innovation [
8].) Have these regional coordinated development policies brought positive demonstration effect to the surrounding areas? This paper seeks empirical evidences to provide an answer to the above questions by looking into China’s marine industry. To depict the dynamic relationship between marine industrial structure upgrading and marine economy efficiency, this paper calculated marine economic efficiency with undesired output and introduced the Spatial Durbin Model (SDM) to illustrate the spatial spillover effect. Finally, several policy implications were detected.
The remainder of the paper is organized as follows:
Section 2 reviews the related literature.
Section 3 introduces the measurement of MISU (marine industrial structure upgrading) where marine economy sustainable development is calculated. The empirical results are given and discussed in
Section 4 and
Section 5. The final section concludes the paper with policy implications.
2. Literature Review
The industrial structure upgrading refers to the process of production factors such as capital, labor, land, and technology flow from the production sectors or links of industrial chains with low value-added, poor efficiency, and high consumption, such as industries of overcapacity and high pollution, to those with high value-added, high efficiency, and low consumption, such as advanced manufacturing industry and high-end producer services [
9]. The industrial structure upgrading was proven to be the main force to drive less developed economies to developed economies [
10,
11]. Baumol (1967) and Hartwig (2016) pointed the industrial structure adjustment might brought out “cost disease”. Namely, when the industrial structure was adjusted, the rendered resources flowed to the tertiary industry sector, without considering its relatively backward efficiency, and brought in the decline of economic efficiency, known as “cost disease hypothesis” [
12,
13]. However, Peneder (2003) and Jin (2012) challenged this viewpoint by structural bonus hypothesis. They commented that the input factors flowing from low efficiency sectors or low efficiency growth rate sectors to high efficiency sectors or high efficiency growth rate sectors can promote the whole efficiency of the society [
14,
15].
Over the past 40 years, a substantial body of literature has been seeking the justification of these two hypotheses in various countries and industries; however, no definite conclusion has been drawn. Zhao (2018) examined the sources of economic growth and the nature of industrial structure change in China over the past decade, with a comparison to those in Russia. The results showed that structural change had not been conducive to economic efficiency [
16]. Aldrighi (2013) used the shift share method to study the relationship between Brazilian economic growth and structural adjustment. They found that the “structural bonus” was obvious in economic growth [
17], although many scholars argued this shift was not universal [
13]. Other studies have reported that economy efficiency was either unaffected or enhanced by industrial structure upgrading [
18]. De Vries et al. (2012) analyzed the impact of industrial restructuring on economy efficiency in Brazil since 1980 and found there was no structural bonus [
19]. Havlik (2015) took European countries as example and found the effect of industrial structure upgrading on economic growth was ambiguous as the industrial sectors was different [
20]. Padilla (2017) used data from Mexico over the past 30 years to study the relationship between structural changes and efficiency growth and found that industrial structure adjustment would restrain the economy efficiency improvement [
18].
This controversial issue about industrial structure upgrading and economy efficiency has also obtained great academic interests in China facing the dilemma between “steady growth” and “structural adjustment”. Empirical researches on it have flourished in recent years aiming to offer policy support in its new normal economic development. Research samples are usually collected from manufacturing industry [
21,
22], service industry [
23], and so on. Similar with the previous studies, no consensus has been reached. Several researches tried to identify the explicit links for the two opinions. For them, the rationalization of industry structure and the elevation of industry structure are typical index variables representing industry structure upgrading. (The rationalization of industry structure refers to the effective allocation of resources among industries, and the elevation of industry structure refers to the service orientation of economy structure [
24].) The former one was proved to have a significant “U-shaped” relationship with economy efficiency, meanwhile the latter one had an inverted U-shaped relationship [
25,
26]. The structure bonus was closely bound up with economy efficiency, capital, income gap, etc. [
27,
28].
A handful of studies attempting to identify the spillover effect of industry structure on economy efficiency from the macro point of view [
29]. Most of the research confirmed industry structure upgrading and agglomeration were vital elements to the spillover effect of regional economy but failed to reveal the formation mechanism [
30,
31,
32]. In the empirical analysis, spatial lag model (SLM), spatial error model (SEM) and spatial Durbin model (SDM) gradually took place of ordinary least square model to analyze the spillover effect, as they could effectively solve the spatial distance bias by maximum likelihood estimate [
33,
34].
The above plenty empirical literature mainly focuses on the land regional economy, but fewer evidence has been presented in the context of marine economy efficiency. The limited research had been formed on the “structural bonus hypothesis”, using data from coastal areas, such as Liaoning, Hebei, etc. [
35,
36]. Very few articles mentioned the possible spatial differences of marine economy efficiency. Yan et al. (2015) found the regions with strong competitiveness in marine industry structure did little to promote marine economic development for neighboring regions [
37]. However, Ma and Zhang (2017) argued the rationalization of industry structure could wider the gaps of China’s regional marine economic performance [
38].
The review of literature has identified a clear gap in the existing research, i.e., the validity of structural bonus hypothesis and cost disease hypothesis in China’s marine sustainable economy, and the details of it. In order to describe the dynamic relationship between marine industrial structure upgrading and marine economy efficiency, this paper uses DEA method with undesired output to value the marine economy efficiency and introduces the spatial Durbin model (SDM) to illustrate the spatial spillover effect. Finally, several policy implications are detected.
3. Data and Methodology
3.1. Data
The marine industry structure refers to the internal components and proportional relationship among various marine industries. The MISU aims to rationally allocate production factors in the development of marine industry, and to achieve a dynamic transformation of the high-knowledge, high-tech, and high-value-added of the marine industry structure [
39]. According to Clark’s law, this paper introduced the inter-industry ratio coefficient to measure marine industry structure, and the formulas are set as follows:
where
represents the output value of the marine secondary industry;
represents the output value of the marine tertiary industry;
represents the gross ocean product.
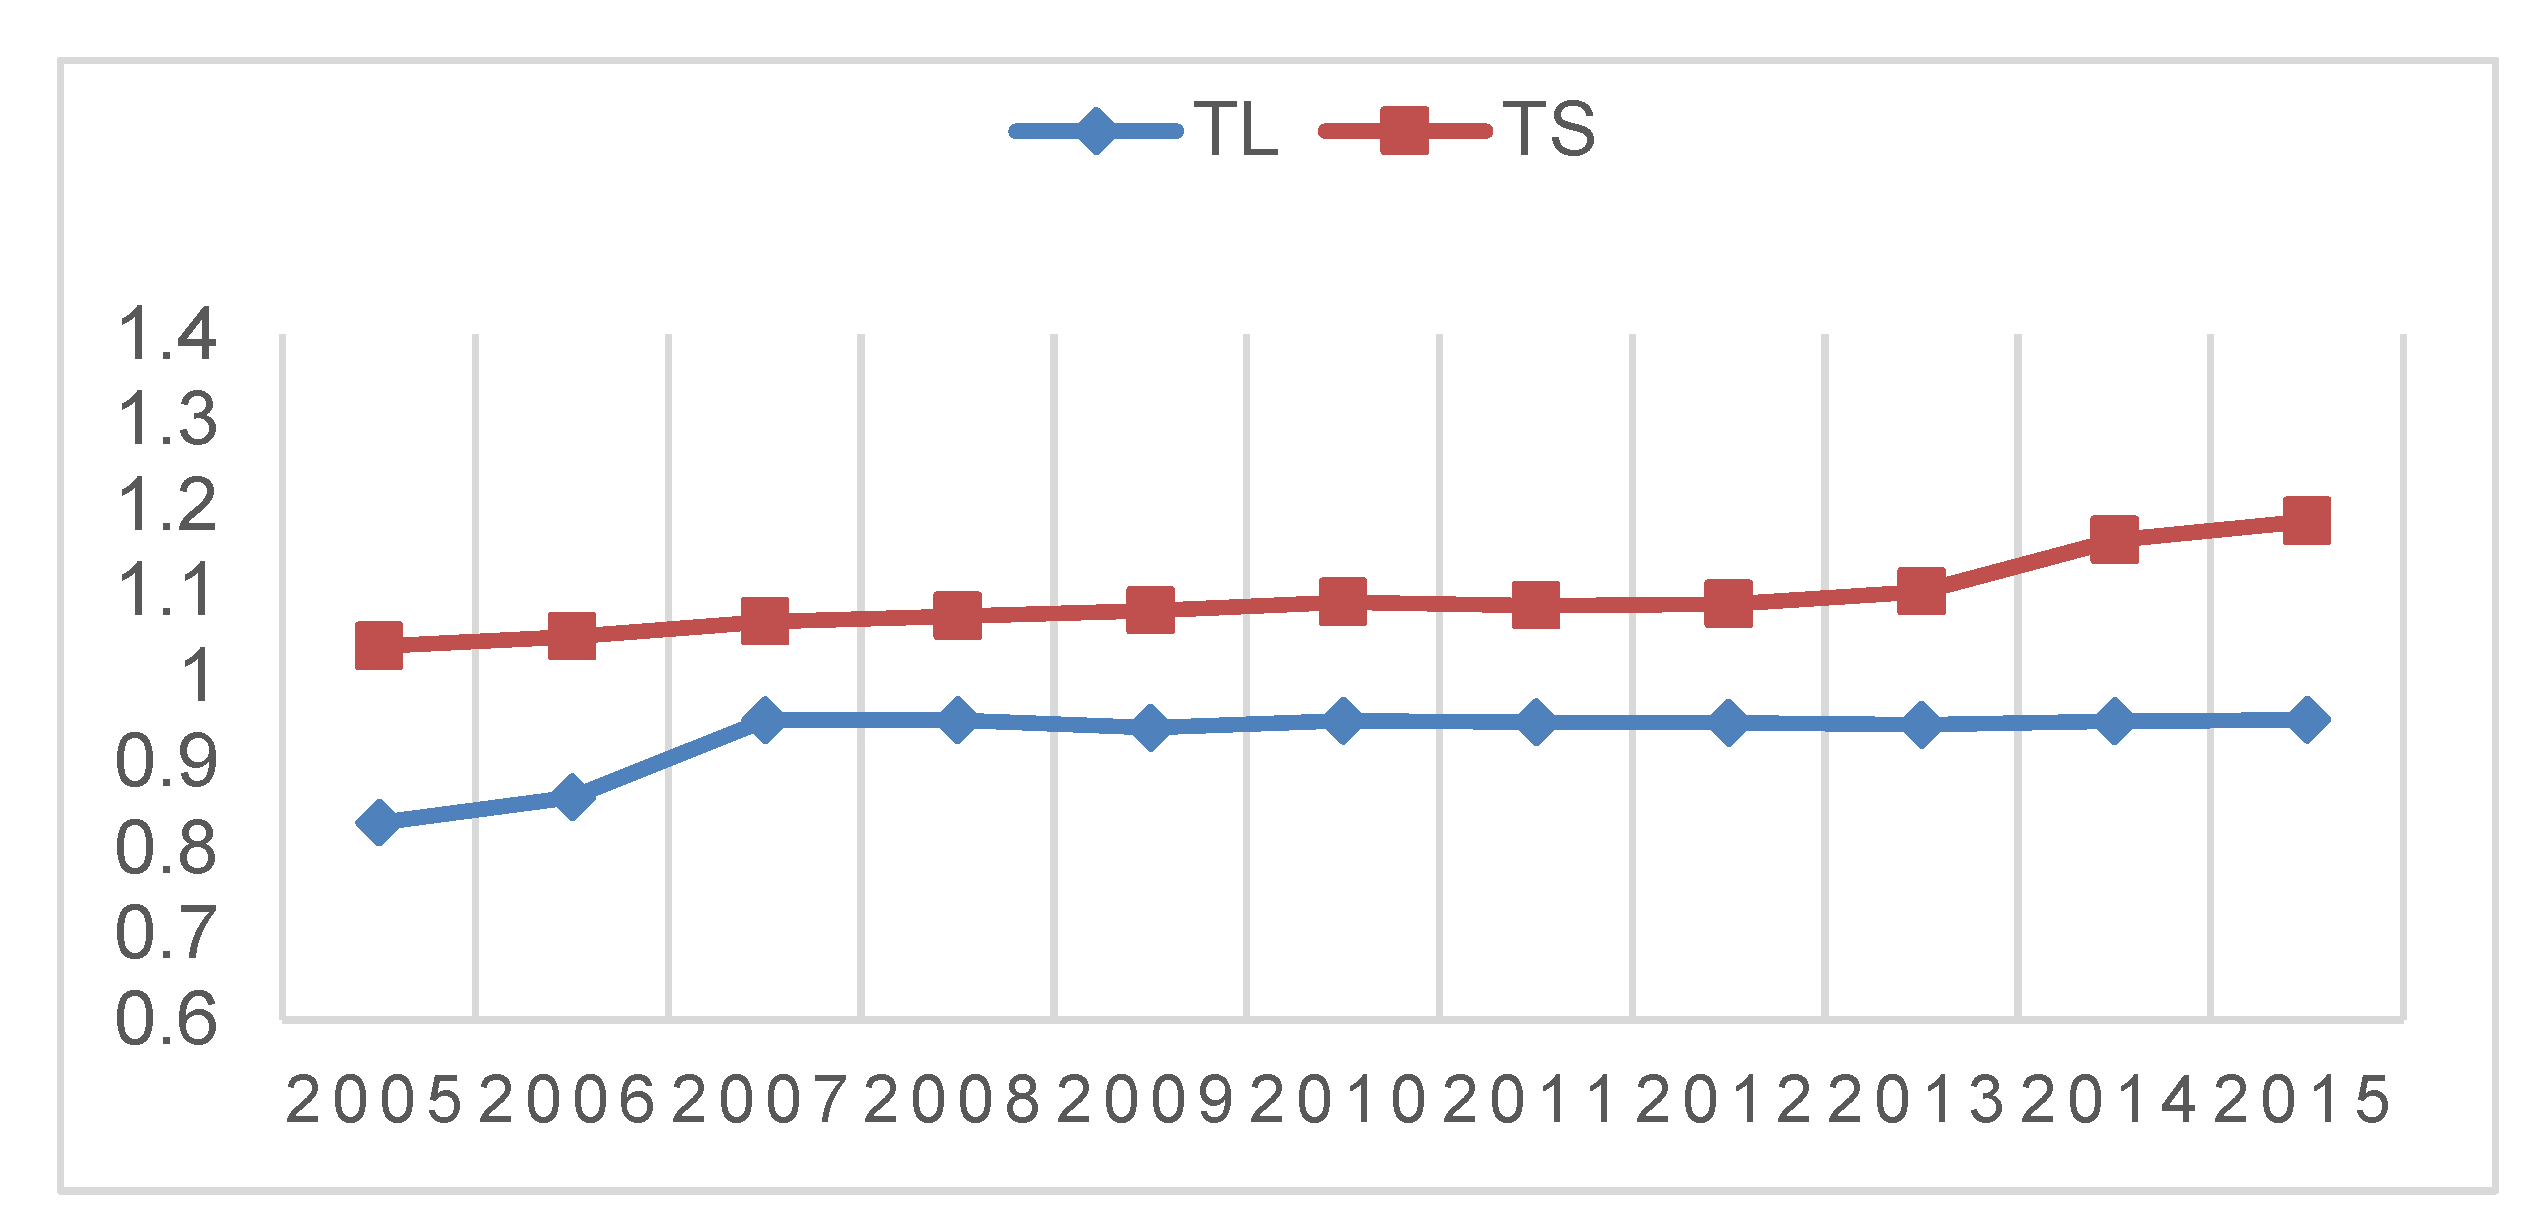
Figure 2 illustrates the elevation and rationalization of the marine industry have been growing for the last decade. (All the data are obtained from the China Marine Statistical Yearbook and the State Oceanic Administration for the 11 coastal provinces and cities in China from 2005 to 2015.)
To select the spatial measurement model, we set the weight of neighboring provinces (or municipalities) as zero, and the weight of nonadjacent provinces (or municipalities) as one. The following control variables are also included:
Economic foundation: we use Ln (GDP) and Ln
2 (GDP) to illustrate the economic growth, which determines the efficiency improvement [
40].
Urbanization: Urbanization is helpful for narrowing the income gap and releasing the spatial spillover effect of economic development [
41,
42]. This paper set the ratio of urban population and total population to measure the urbanization rate.
Institutions: Institutions is a deep-seated factor affecting the ecological environment, which is vital to marine sustainable economy [
43,
44]. This paper uses the regional sewage charges (REG) and the per capita educational time (PET) to reflect environmental regulation and environmental awareness, respectively.
Foreign capital: Foreign capital (FDI) is treated as an important constituent of economic efficiency increasing [
45,
46].
Marine economic efficiency refers to an economic state where marine resources are optimally allocated to serve each individual or entity in the best way while minimizing waste and inefficiency [
47,
48]. Its traditional input–output index usually contains labor, land, capital, and gross value of industrial output. Recently, the introduction of undesired outputs has been widely proved to be more scientific and feasible in measuring sustainable growth of marine economy [
49]. The input–output index used to calculate marine economic efficiency is set in
Table 1. (According to the GDP conversion index announced by the National Bureau of Statistics of China (2018), the fixed investment amount is based on 2005 as the base period for constant price processing to eliminate price factors.
3.2. Methodology
In order to solve the data limitations in traditional DEA model, the super-efficiency slacks-based measure model (the super-efficiency SBM model) was newly proposed to avoid the deviation brought by the difference in dimension and the choice of angles. The new model can solve such a problem as ordering and differentiation among decision making units (DMUs) [
52,
53]. Several studies had verified the advantages of this model in analyzing marine economic efficiency [
54,
55,
56]. This paper adopts a super-efficiency SBM model to measure the marine economic efficiency denoted by
. The specific model is set as follows:
There are m decision making units (DMUs), each of which consists of m input (), desired output () and undesired output (). The relaxation moduli of them are expressed by , , . is a constant vector, and is the weight vector. The objective function is strictly decreasing, given . DMU is valid when and only when 1 (, , ), and it will be invalid when (at least one of , , does not equal 0).
The basic models of spatial lag model (SLM), spatial error model (SEM) and spatial Durbin model (SDM) are as follows:
where
is the dependent variable, representing marine economic efficiency;
is an exogenous variable matrix of n*k; W is a spatial weight matrix of n*n;
and
are special auto-regression coefficient and special auto-correlation coefficient, representing the influence direction and degree of the observations of the adjacent area to the local observation, respectively.
Changes of independent variables not only affect the dependent variables in one region, but also affect the independent variables in other regions. This total effect is subdivided into direct and indirect effects. The direct effects represent the average impact of the dependent variable on one region, and the indirect effects represent the average impact of the dependent variable on other regions. The specific calculation method is as follows:
for which
,
,
is an n-order identity matrix. The converting matrix form is
The partial derivative measures the average effect of the change of on the observations of in one region. The direct effect is calculated by the average value of the diagonal elements in the numerical matrix . The partial derivative measures the average effect of the change of on the observations of y in other regions. The indirect effect is measured by the average value of the diagonal elements in the non-numerical matrix
4. Results
The results in
Table 2 show that the Moran’s I index—which is usually used to test whether economic variables have spatial interaction effects, and can effectively reduce analysis errors [
57,
58]—is significant at the confidence level of 10% and indicates that there exists spatial autocorrelation between marine industrial structure upgrading and marine economic efficiency.
Table 3 shows the spatial Durbin model has the best fitting effect. Based on the Wald test and the LR test, if both null hypotheses (
and
) are rejected, the spatial Durbin model is selected, otherwise should be the spatial lag and spatial error model. In addition, the spatial Durbin model with double fixed effects was selected as the final model according to the results of Wald test, LR test, and Hausmann test. China’s marine industry structure upgrading affects marine economic efficiency negatively, where the elevation of marine industry structure plays a major role. The significant test further indicates local marine industrial structure upgrading has negative spillover effect on marine economic efficiency for adjacent areas. In particular, economic foundation, environmental awareness and urbanization respectively illustrated positive influence and negative influence on marine economic efficiency both for local areas and neighboring areas. This is in consistent with the research on landing territory [
59]. In addition, foreign direct investment (FDI) and environmental regulation intensity (REG) both failed to pass the significant test.
As China is in the period of deep adjustment and transformation for the marine industry structure upgrading over 2005–2015, a large amount of resources is invested in tertiary industry. Due to the immature internal structure system and operational processes, this adjustment brings in a negative impact on the efficiency of the marine economy, and the cost disease hypothesis is verified.
With continuous adjustment and optimization of the marine industry structure, emerging industries will gradually replace traditional resource-dependent industries. We introduce the spillover effect to identify where the cost burden brought about by the upgrading of industrial structure can be transformed into a cost dividend. Considering the regional characteristics of marine industry policy and the similarity of social and economic status in neighboring regions, the spillover effect was tested by China’s coastal economic Rims [
60].
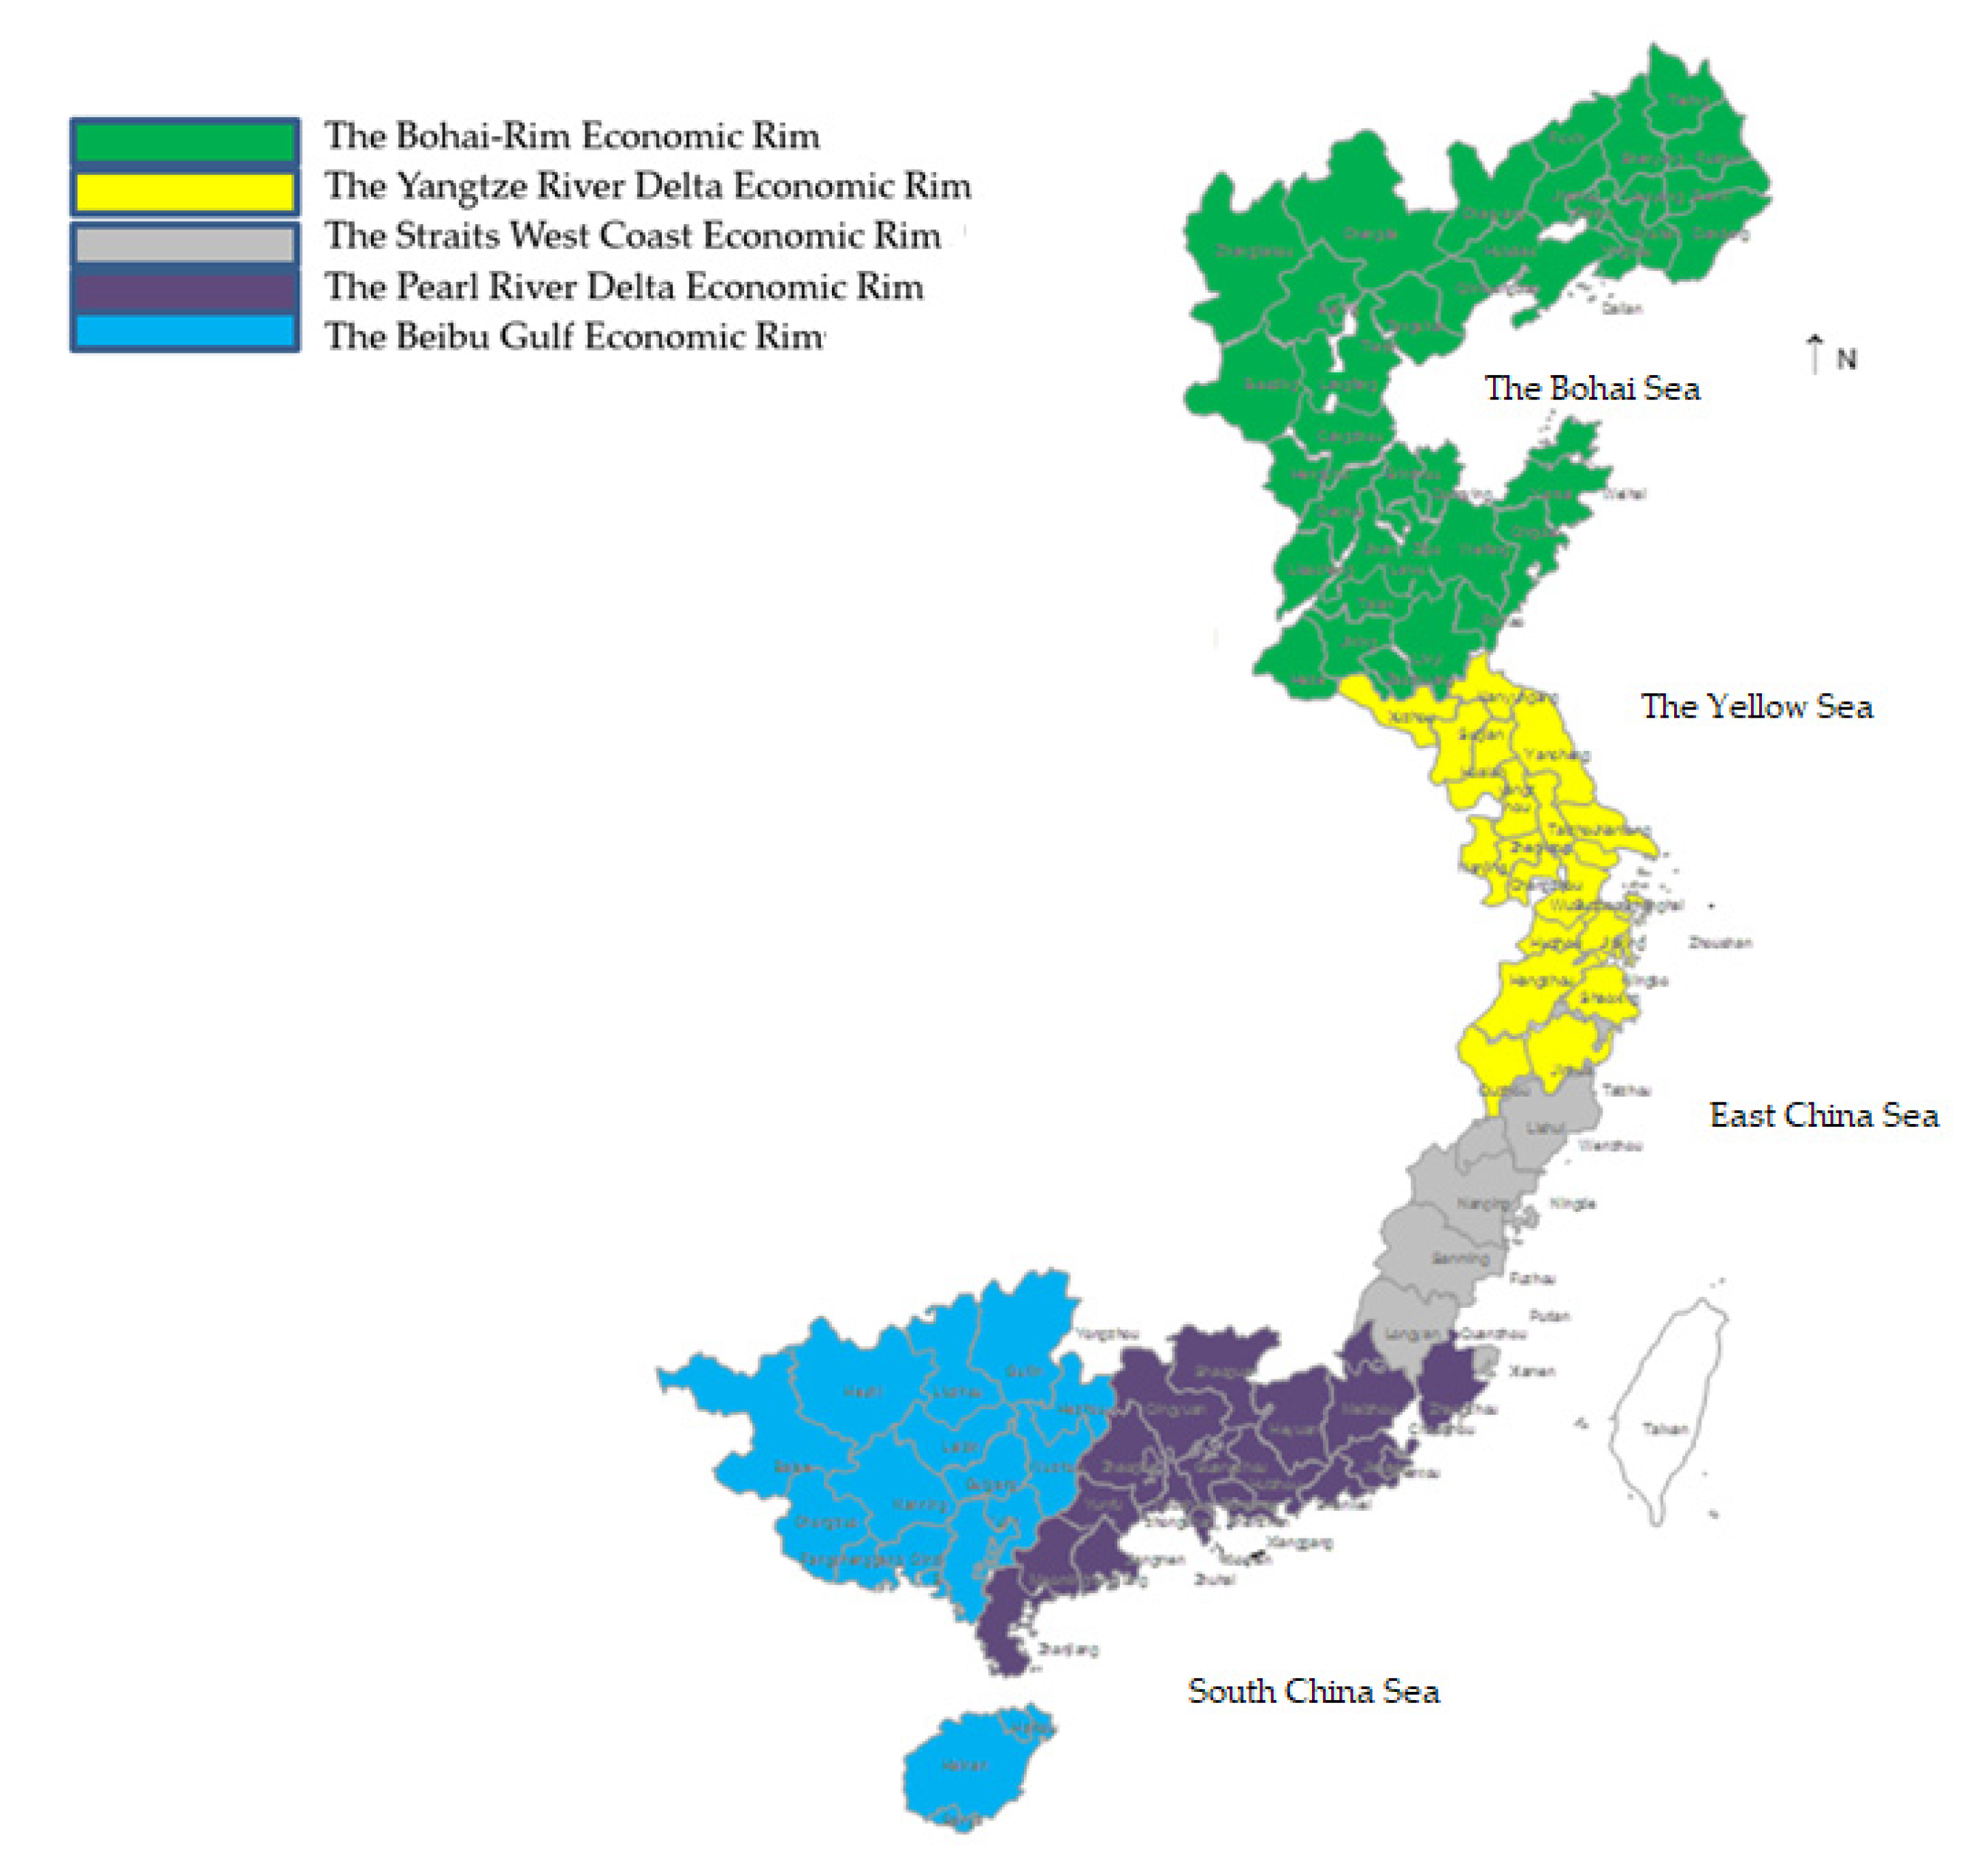
Figure A1 (See
Appendix A) shows the location of the five coastal economic Rims.
5. Discussion
Table 4 shows the decomposition results of the spatial spillover effect. The spillover effects of the MISU and marine economic efficiency have agglomeration effect in China’s coastal areas. For the Bohai Economic Rim and the Yangtze River Delta Economic Rim, the positive direct and indirect effects contributed to positive total impact, and the elevation of marine industrial structures had more powerful influences. For the Straits West Coast Economic Rim and the Beibu Gulf Economic Rim, the total impact of marine industrial structure upgrading on marine economic efficiency was negative, with rather subtle appearance of the direct and indirect effects.
These findings backed up the feasibility and effectiveness of the cooperation mechanisms in the Bohai Economic Rim and the Yangtze River Delta Economic Rim. Benefited from the strategic full-scale development principles, these coastal areas learned from each other and made full use of the optimization and upgrading of the marine industry structure to realize jointly development. These policies also expanded the scale of the marine service industry and speeded up the formation of pillar industries such as marine fisheries, marine transportation, marine oil and gas, coastal tourism, marine shipbuilding, and marine biomedicine, then promoted the shifting of marine economy development pattern from resource-dependent to technology-driven. In reality, the Yangtze River Delta Economic Rim has superior marine resource endowments, abundant marine science and technology resources, and a complete marine industry chain. Supported by national development strategies and policies, marine industrial transformation is at the forefront of the country. It has changed from relying solely on resource-consuming industries to high-tech industries and marine service industries, while traditional marine industries with high resource consumption and high pollution levels have gradually shifted from extensive development to intensive benefits. In the Bohai Economic Rim, with the support of superior location conditions and government policies, coastal tourism, marine transportation, and other industries have been developed rapidly. The marine engineering construction industry, electric seawater industry and other marine emerging industries have maintained strong growth momentum, and the marine industry sector has become more diversified. For these regions, structural bonus hypothesis had already replaced cost disease hypothesis.
However, it has been verified that most of the main marine industries for the Straits West Coast Economic Rim and the Beibu Gulf Economic Rim are high resource-dependent, such as marine transportation, coastal tourism, and marine fishery. The un-rational layout of industry structure exacerbates the deterioration of the ecological environment and does little to promote the sustainable development of marine economy. So cost disease hypothesis still exists in these regions.
The brief discussion here shows it is vital to realize the coordinated development between the marine industrial structure upgrading and the marine economic efficiency. It is advised China’s coastal areas to focus on developing competitive marine industries and give priority to emerging marine ecological industries to rectify the development mode characterized by high material consumption, high emission, and low output. For provinces (or municipalities) that have negative spillover effects, breaking through the dilemma between the marine industrial structure upgrading and the deterioration of marine economic efficiency, establishing a long-term mechanism for inter-regional development of marine sustainable economy and improvements of ecological environment should be the key point of policy design. Although the Straits West Coast Economic Rim and the Beibu Gulf Economic Rim are rich in marine resources, their development and utilization efficiency are still weak. These regions should focus on enhancing the coordination capabilities and correlation of factor endowments and industrial structures, such as deeply exploiting “strait economy”, “gulf economy”, and “island economy”—these refer to the type of regional economy based on island resources, surrounding marine resources and their geographical location.
It is suggested that for provinces (or municipalities) with positive spillover effects, the regional synergy strategy of the marine industry development policy is scientific and effective, which can become a powerful guarantee for the construction of marine ecological civilization. Based on the current coordinated state of MISU and marine economic efficiency, they are recommended to increase investment on perfecting the eco-environmental protection mechanism. For instance, some typical environment friendly marine industries, such as marine biological industries, marine new energy industries, deserve more policy support as multi-faceted funding and favorable taxation.
6. Conclusions
China’s marine economic efficiency is generally inhibited by the continuous evolution of the marine industry structure. This conclusion strongly supports the cost disease hypothesis. The upgrading of the marine industry structure has a benign spillover effect on regional marine economic efficiency in the Bohai Economic Rim and the Yangtze River Delta Economic Rim but shows negative spillover relationships in the Straits West Coast Economic Rim and the Beibu Gulf Economic Rim. Therefore, the findings also verify the feasibility and effectiveness of the regional cooperation policies in the Bohai Economic Rim and the Yangtze River Delta Economic Rim.
Furthermore, this cost disease hypothesis is ubiquitous. With the development of the regional marine economy, the cost disease hypothesis may shift to structural bonus hypothesis.
Author Contributions
Writing—original draft, H.Z.; Writing—review & editing, X.L.; Completed the modification of the model and analysis of the paper, Y.X.; Supervision, H.M. All authors have read and agreed to the published version of the manuscript.
Funding
This research was funded by the National Natural Science Foundation of China, grant number 71503238; the Doctoral Fund of Ministry of Education of China, grant number 2017M621044; the Social Science Project of Shandong Province, grant number 19CZKJ25; the Qingdao Scientific and Social Planning Project, grant number QDSKL2001003.
Institutional Review Board Statement
Not applicable.
Informed Consent Statement
Not applicable.
Data Availability Statement
The data presented in this study are available on request from the corresponding author.
Conflicts of Interest
The authors declare no conflict of interests.
Appendix A
Figure A1.
Five Economic Circles.
Figure A1.
Five Economic Circles.
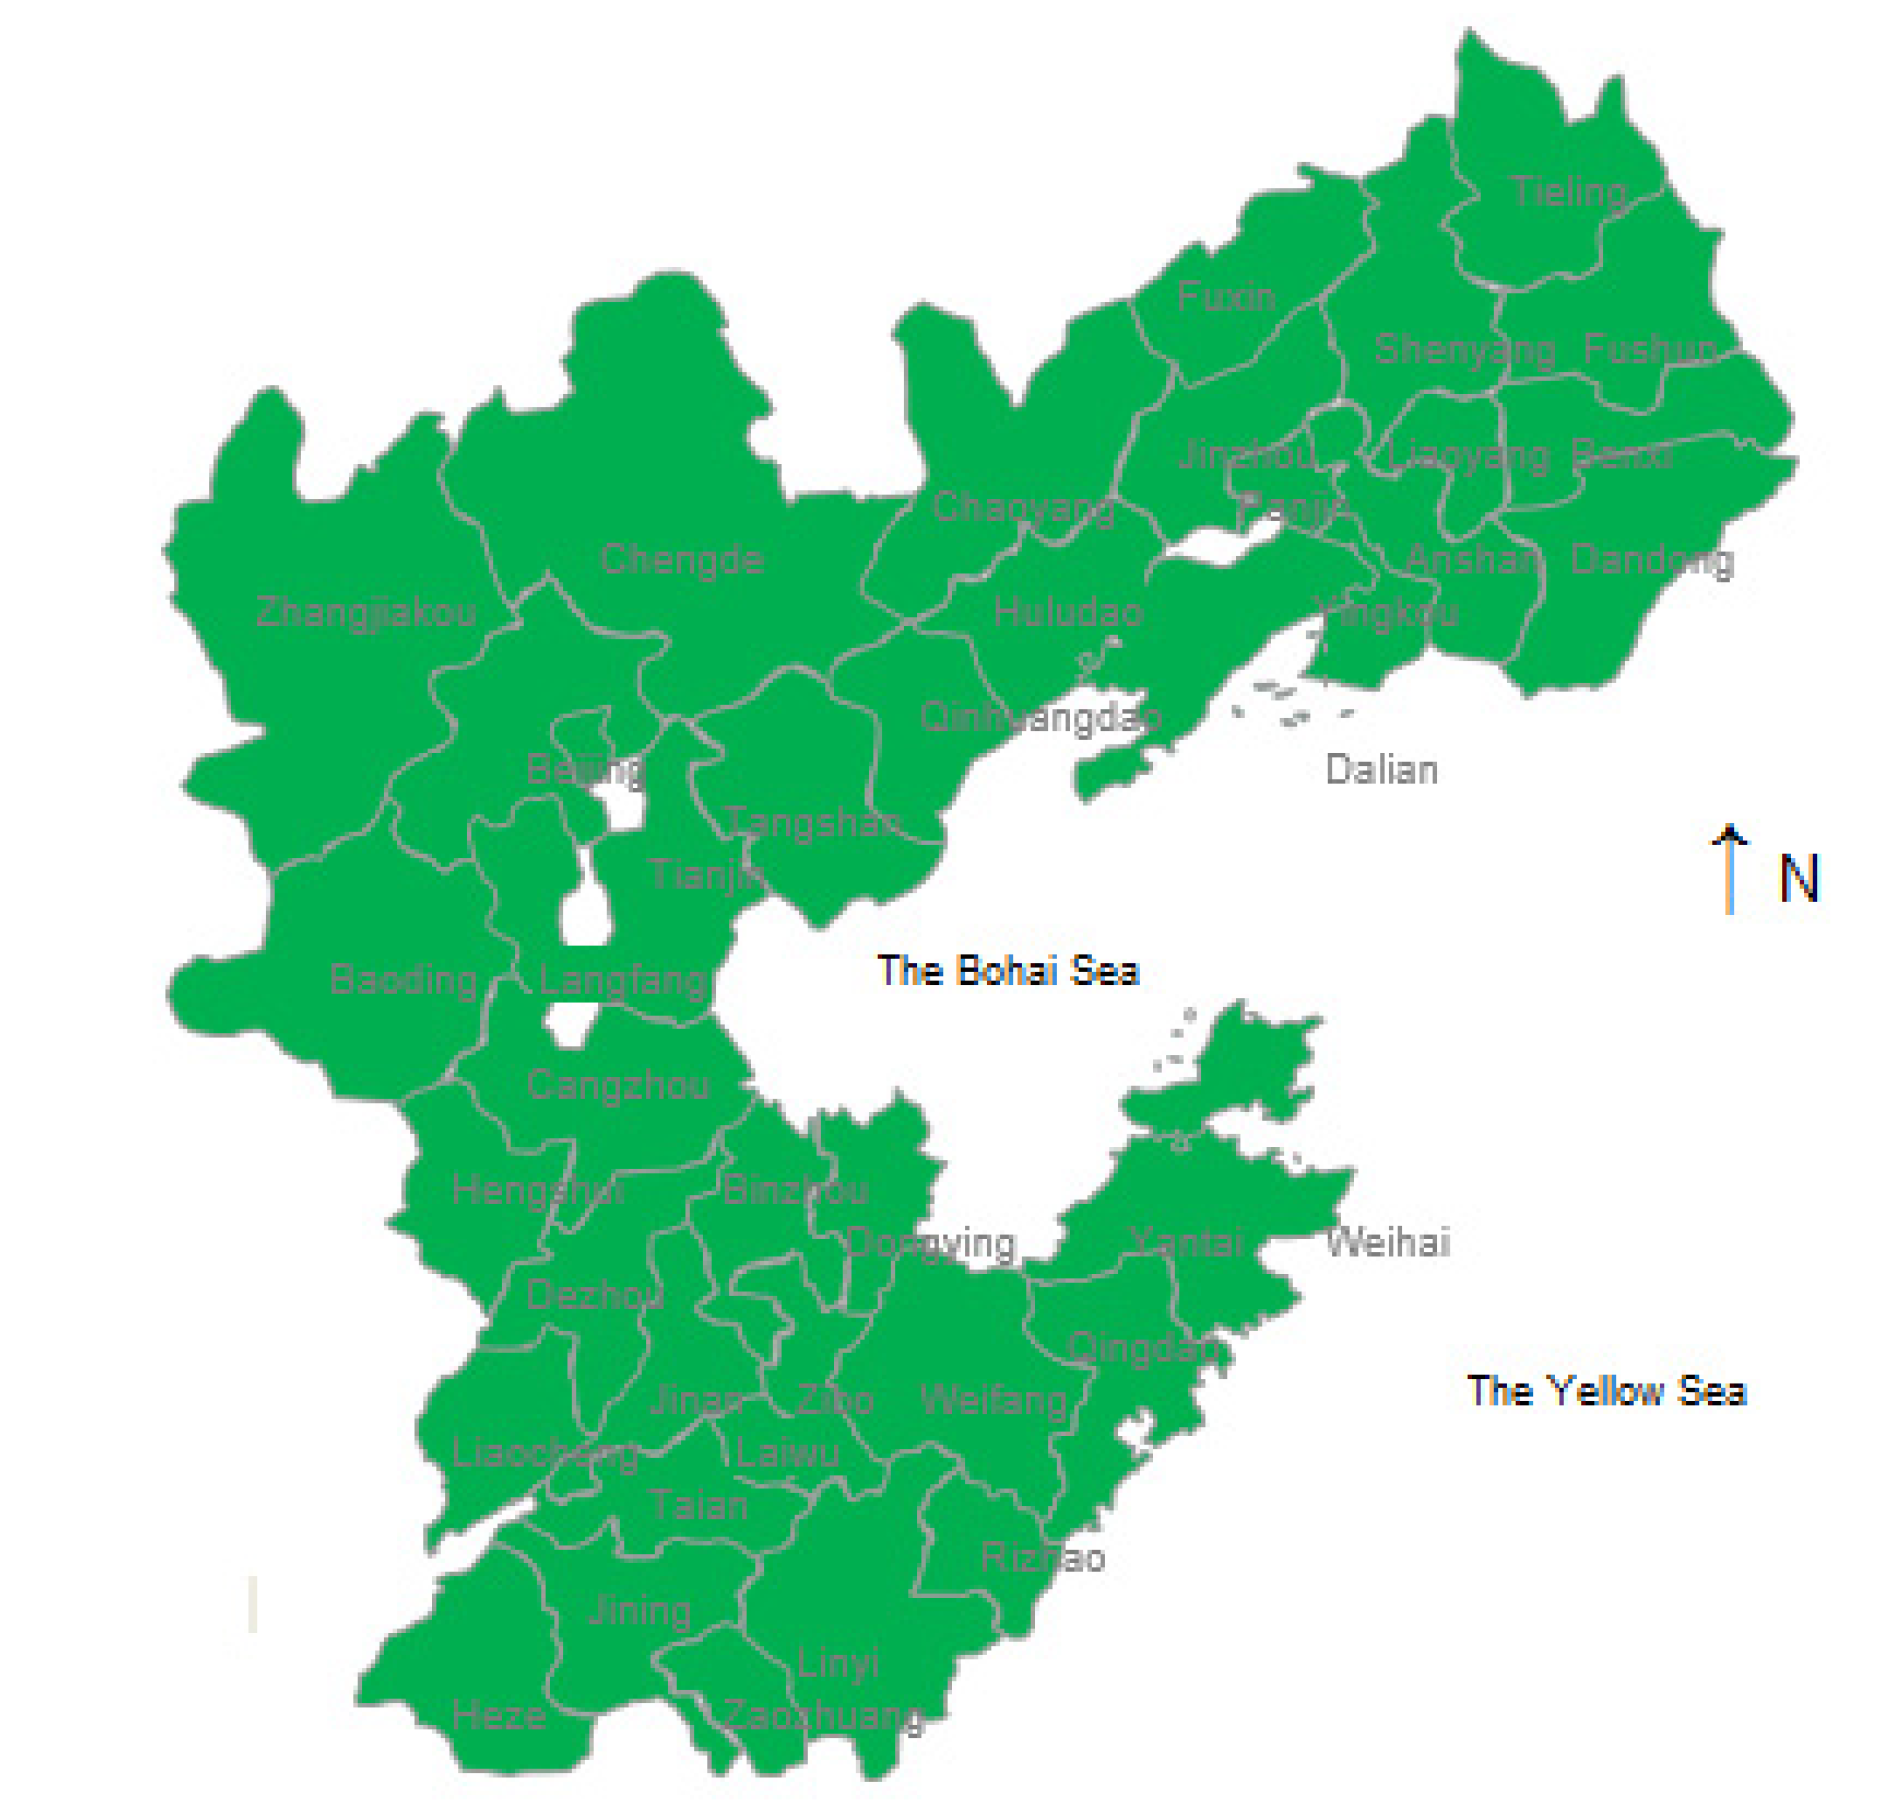
Figure A2.

The Bohai-Rim Economic Rim.
Figure A2.

The Bohai-Rim Economic Rim.
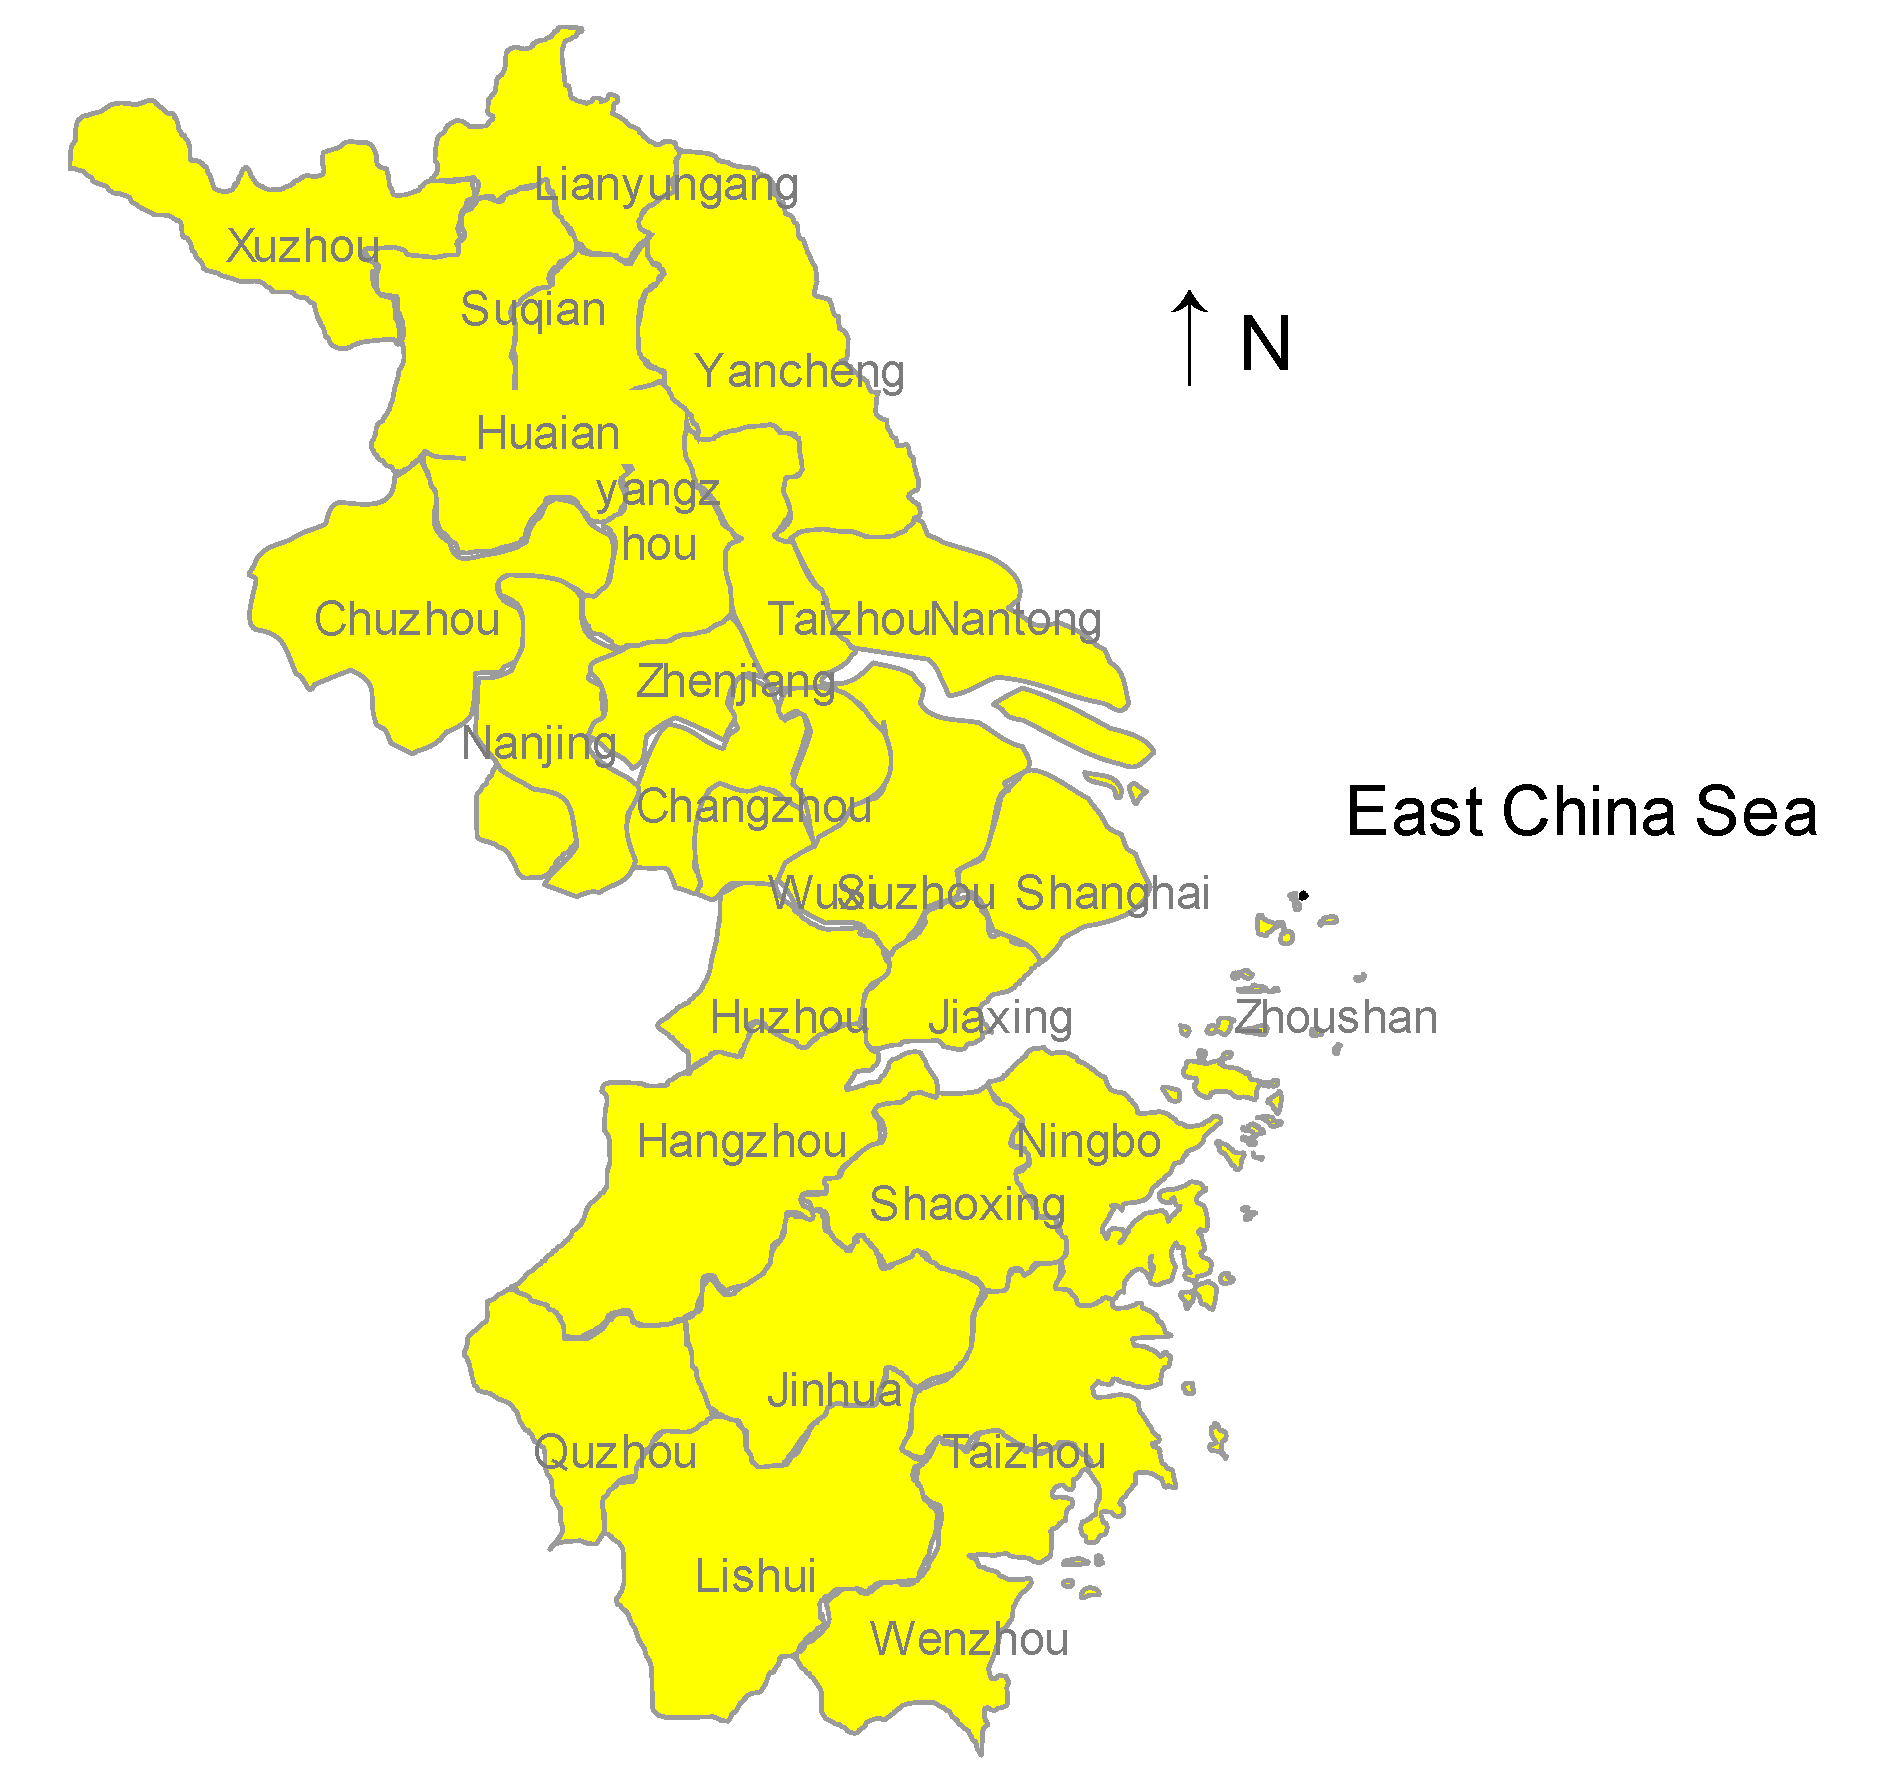
Figure A3.

The Yangtze River Delta Economic Rim.
Figure A3.

The Yangtze River Delta Economic Rim.
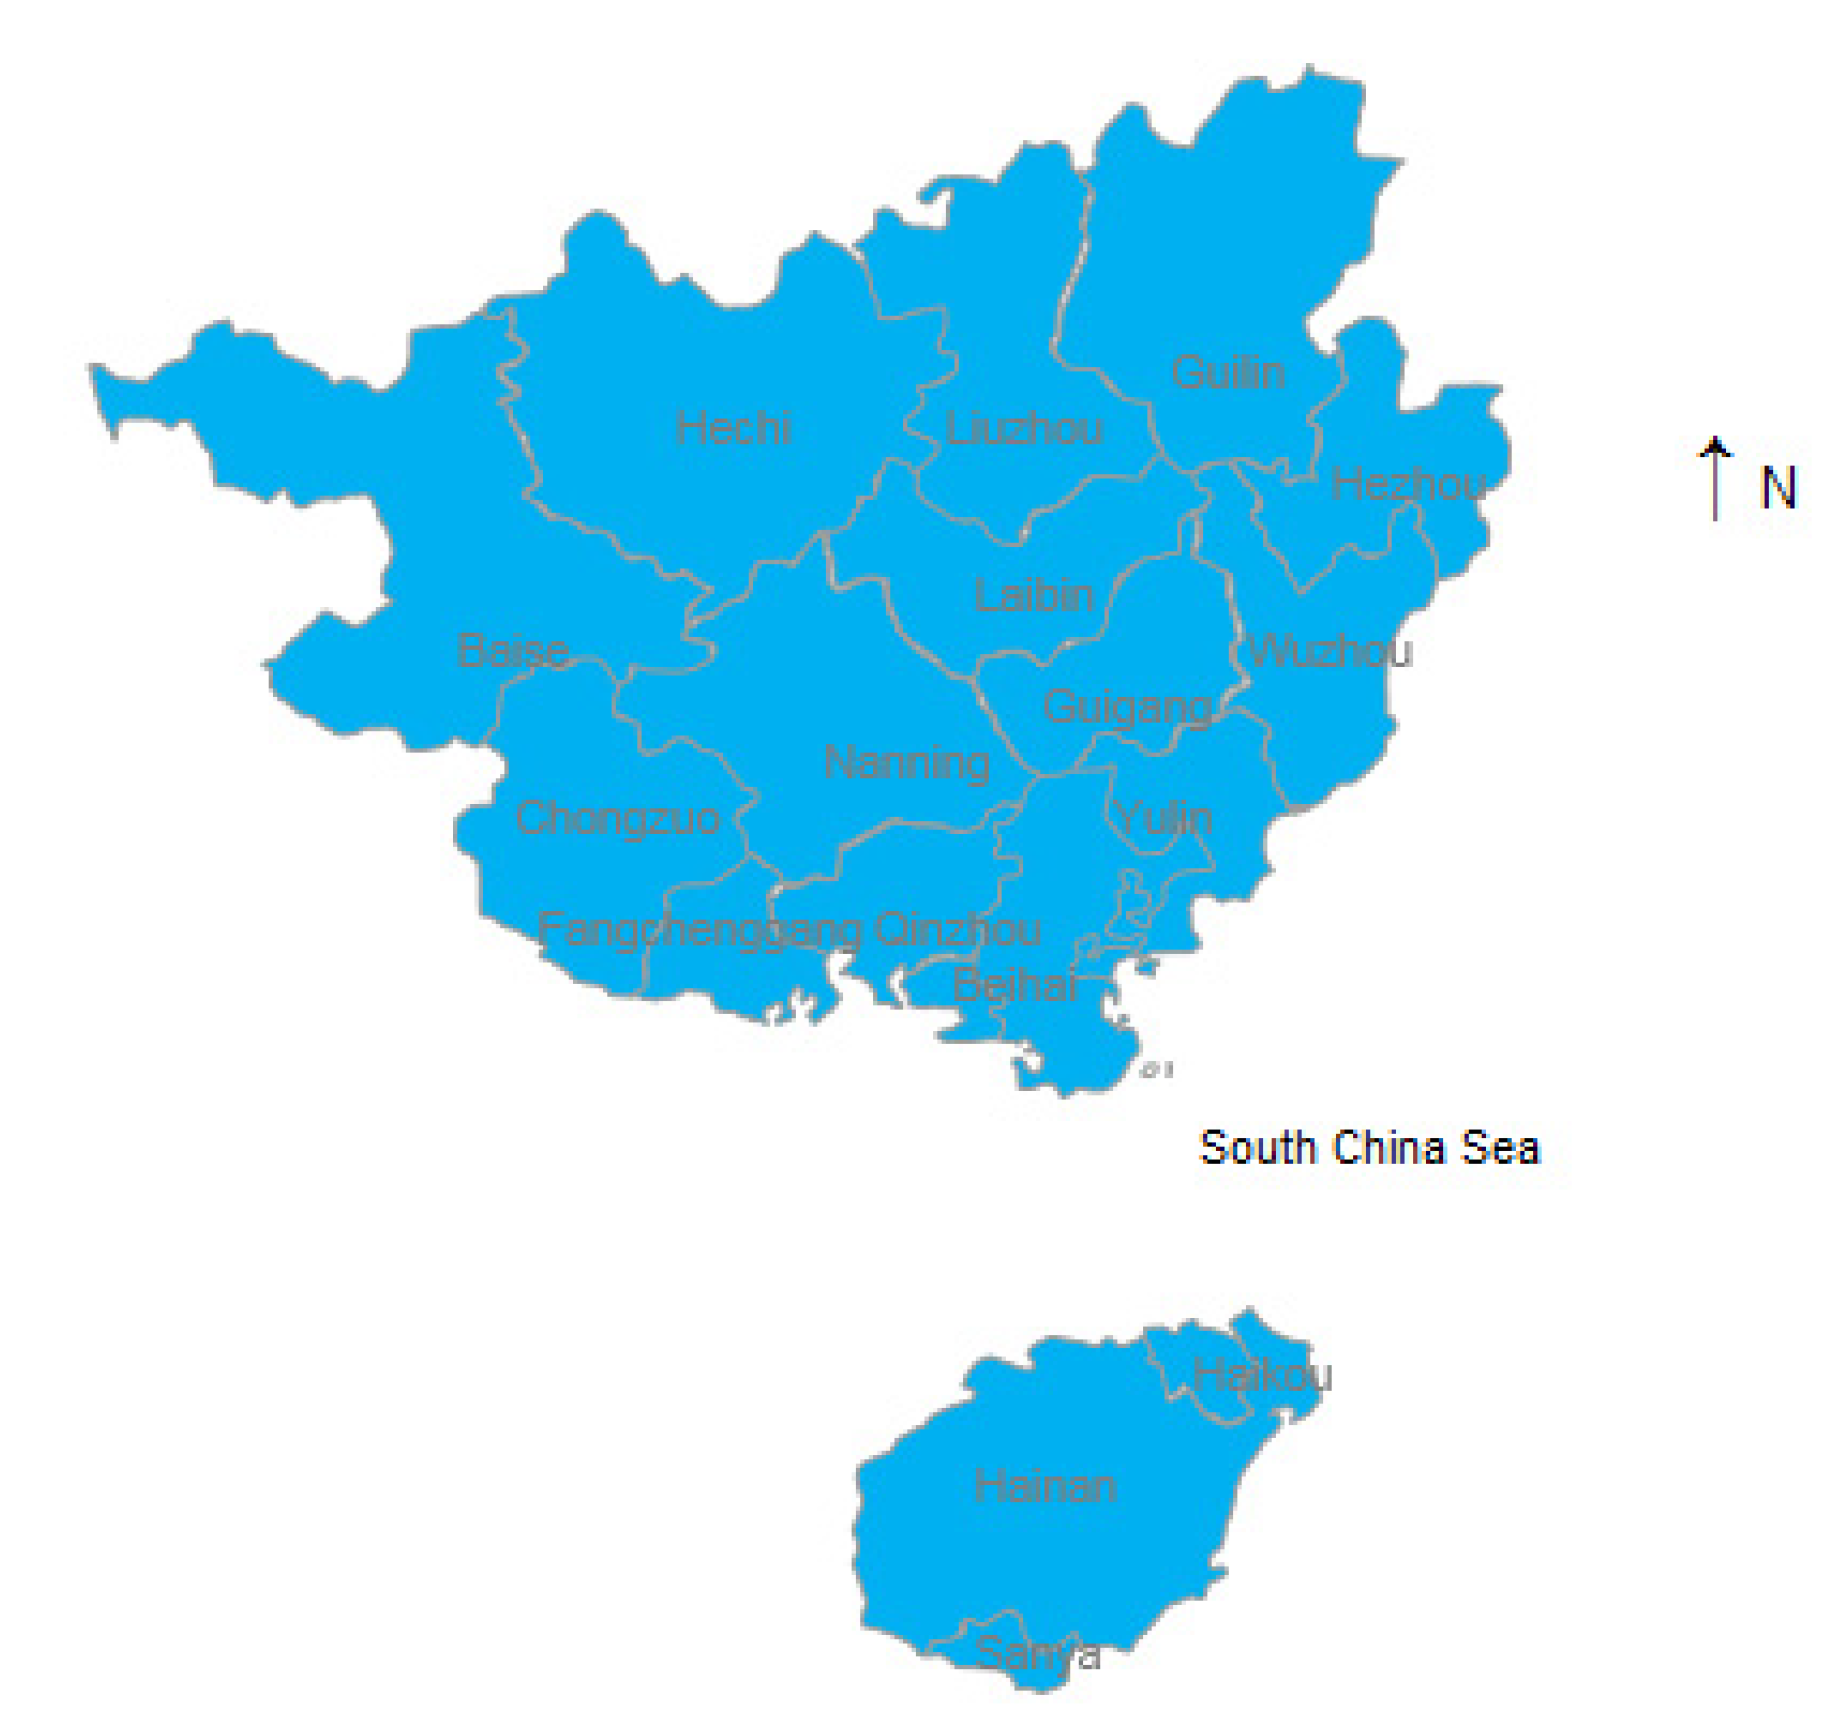
Figure A4.

The Beibu Gulf Economic Rim.
Figure A4.

The Beibu Gulf Economic Rim.
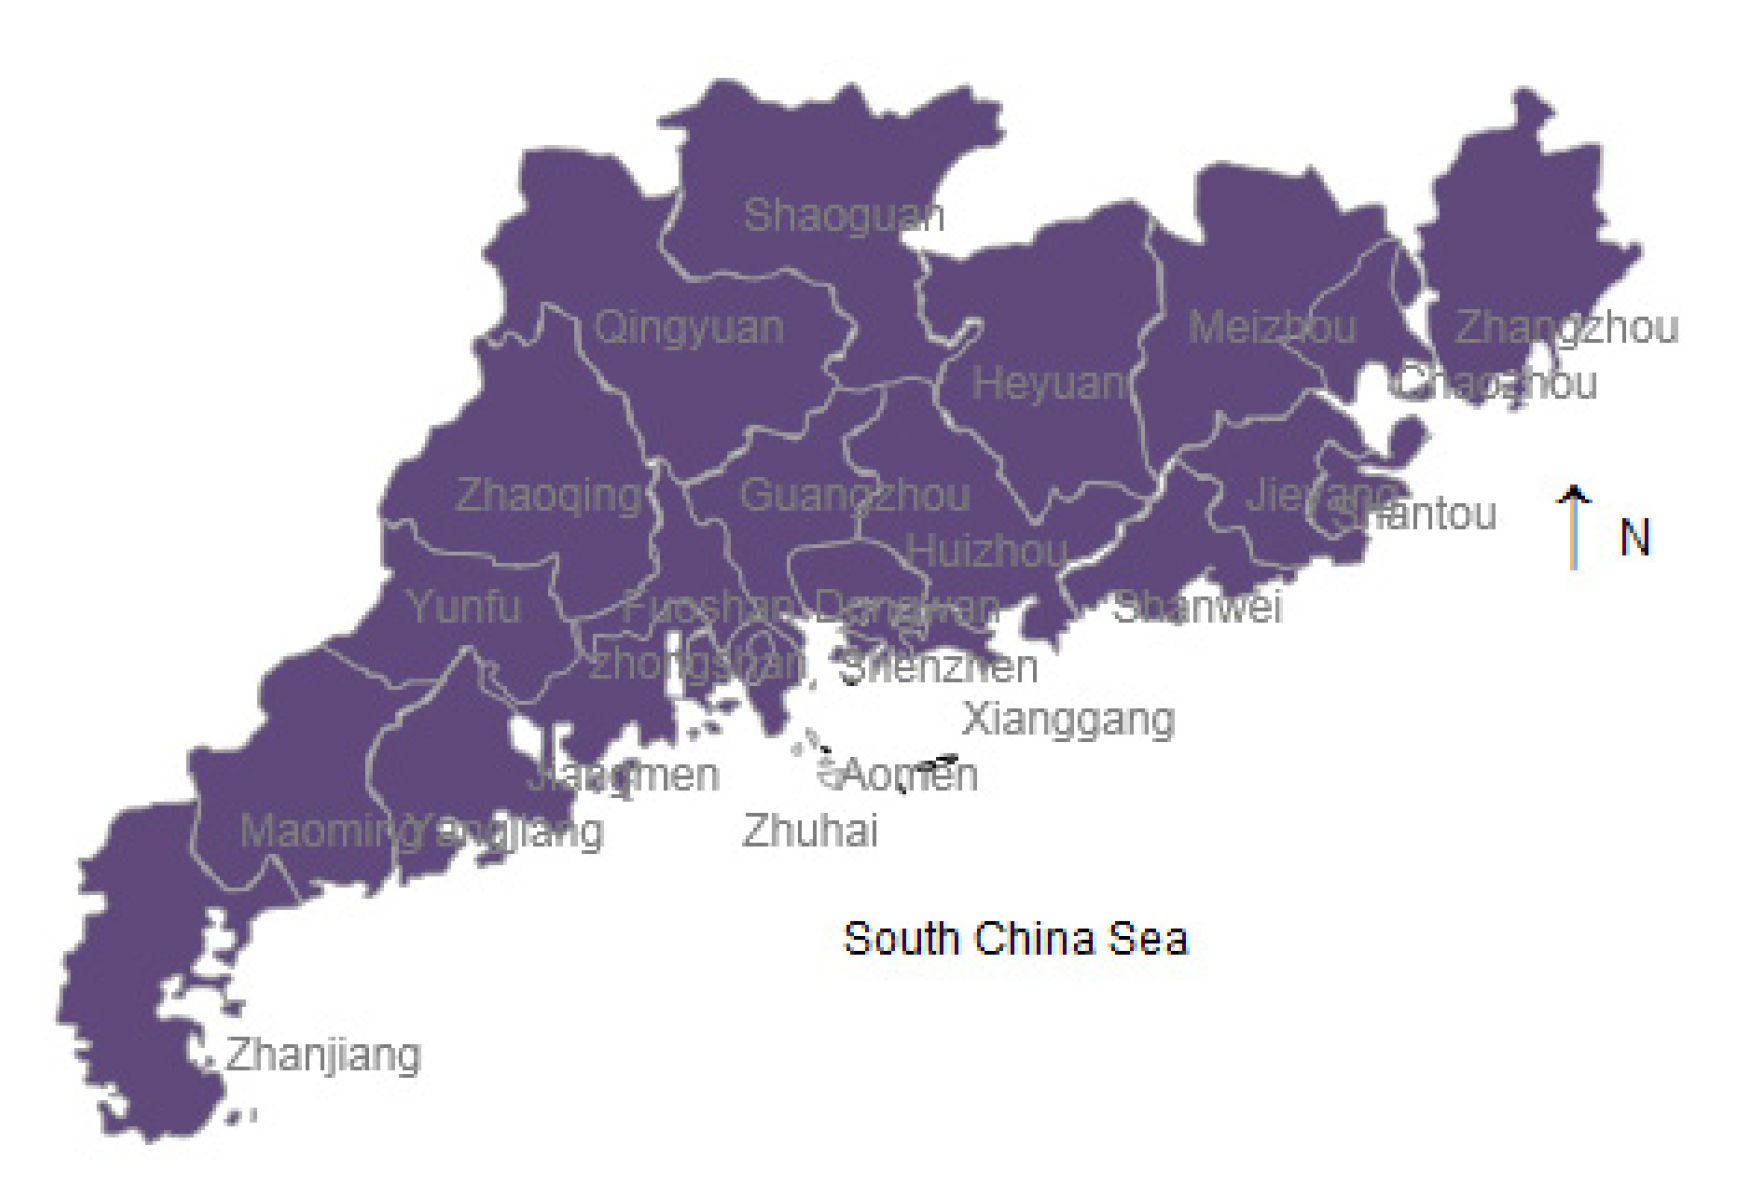
Figure A5.

The Pearl River Delta Economic Rim.
Figure A5.

The Pearl River Delta Economic Rim.
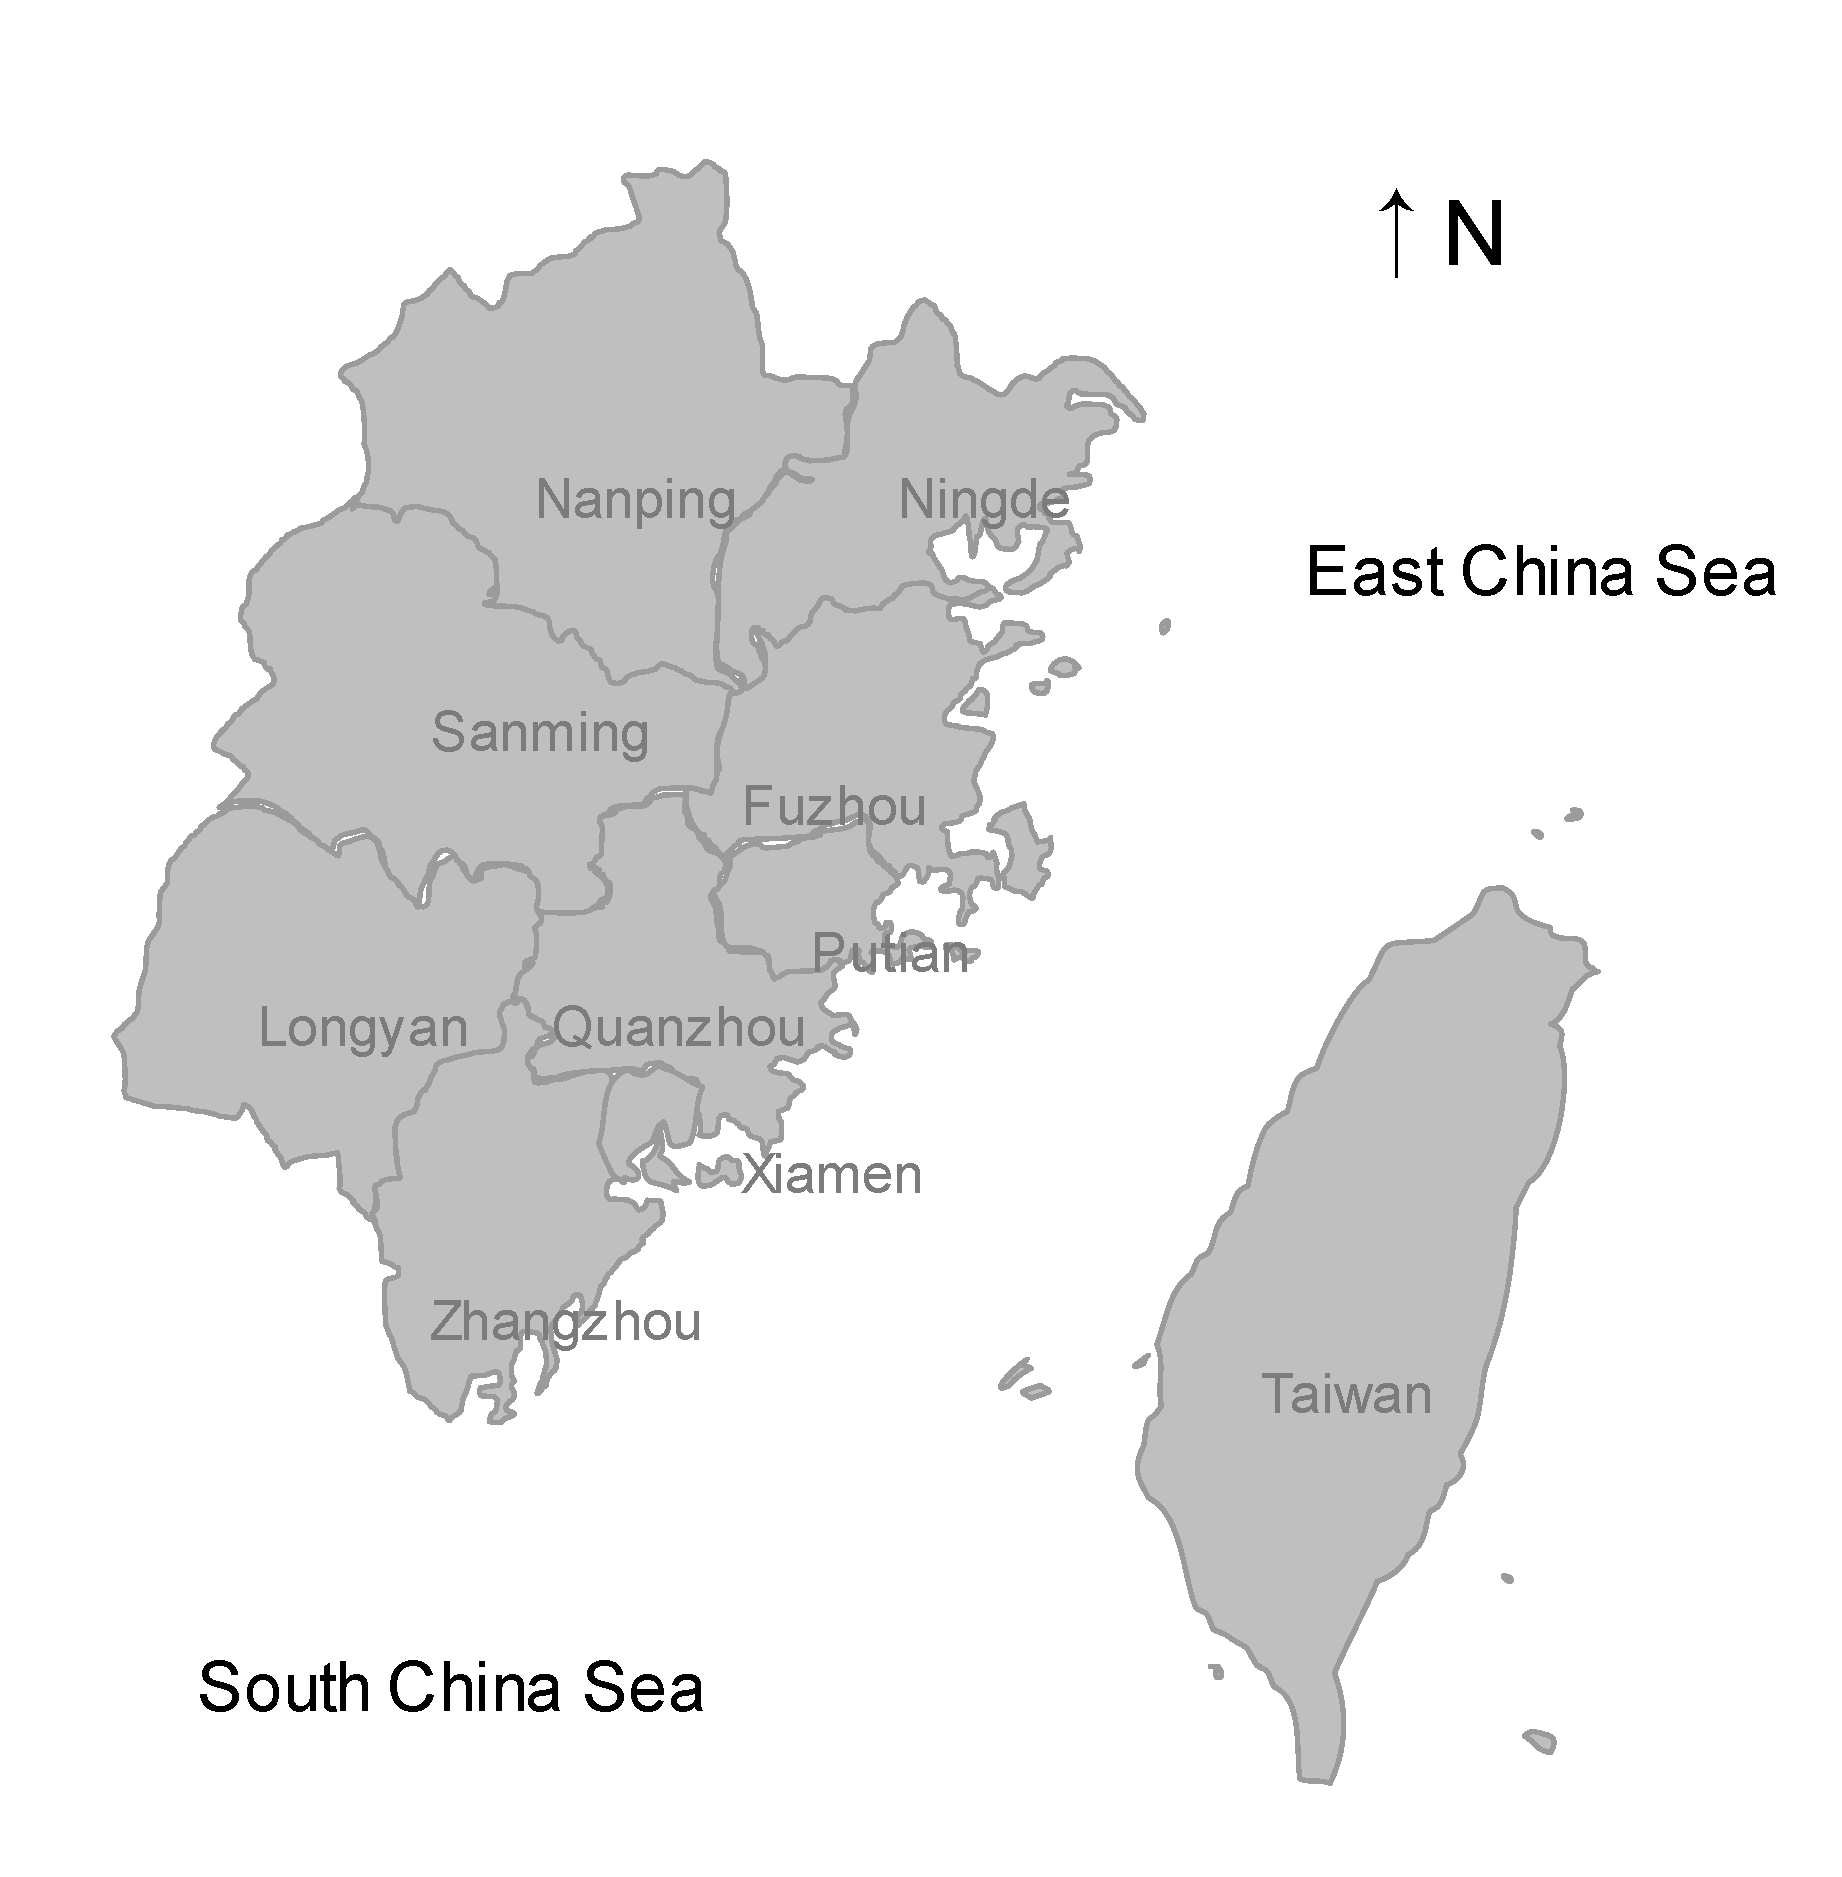
Figure A6.

The Straits West Coast Economic Rim.
Figure A6.

The Straits West Coast Economic Rim.
References
- SBCME (Statistical Bulletin of China’s Marine Economy). 2019. Available online: http://gi.mnr.gov.cn/202005/t20200509_2511614.html (accessed on 9 May 2020).
- MNRPRC (Ministry of Natural Resources of the People’s Republic of China). 2014. Available online: http://www.mnr.gov.cn/sj/tjgb/201807/P020180704391904509168.pdf (accessed on 22 July 2015).
- European Commission. Blue Growth: Opportunities for Marine and Maritime Sustainable Growth; European Commission: Brussels, Belgium, 2012. [Google Scholar]
- Zheng, H.; Mou, H.; Zhao, X. Evaluating the demand for aquaculture insurance: An investigation of fish farmers’ willingness to pay in central coastal areas in China. Mar. Policy 2018, 96, 152. [Google Scholar] [CrossRef]
- SBCME (Statistical Bulletin of China’s Marine Economy). 2019. Available online: http://gi.mnr.gov.cn/201904/t20190411_2404774.html (accessed on 11 April 2019).
- CPGPRC (The Central People’s Government of the People’s Republic of China). The Construction of Shandong Peninsula Blue Economic Zone has Officially Become a National Strategy. 2011. Available online: http://www.gov.cn/jrzg/2011-01/07/content_1779792.htm (accessed on 7 January 2011).
- The People’s Government of Zhejiang Province. Notice of the General Office of Zhejiang Provincial People’s Government on Printing and Distributing the “822” Action Plan for Zhejiang Marine Economic Development (2013–2017). 2013. Available online: http://www.zj.gov.cn/art/2013/7/31/art_12461_94589.html (accessed on 31 July 2013).
- The People’s Government of Jiangsu Province. Notice of the General Office of Jiangsu Provincial Government on Printing and Distributing the “13th Five-Year” Marine Economic Development Plan of Jiangsu Province. 2017. Available online: http://www.jiangsu.gov.cn/art/2017/3/3/art_46479_2557621.html (accessed on 3 March 2017).
- DRC (Development Research Center of the State Council). Promoting the Optimization and Upgrading of Industrial Structure, People’s daily. 2014. Available online: http://www.chinadaily.com.cn/m/drc/2014-05/23/content_17537042.htm (accessed on 23 May 2014).
- Chenery, H.B. Patterns of industrial growth. Am. Econ. Rev. 1960, 50, 624. [Google Scholar]
- Shin, I. Income inequality and economic growth. Econ. Model. 2012, 29, 2049. [Google Scholar] [CrossRef]
- Baumol, W.J. Macroeconomics of unbalanced growth: The anatomy of urban crisis. Am. Econ. Rev. 1967, 57, 415. [Google Scholar]
- Hartwig, J. Testing the Baumol-Nordhaus model with EuKlem data. Rev. Income Wealth 2016, 57, 471. [Google Scholar] [CrossRef]
- Peneder, M. Industrial structure and aggregate growth. Struct. Chang. Econ. Dyn. 2003, 14, 427. [Google Scholar] [CrossRef]
- Jin, K. Industrial structure and capital flows. Am. Econ. Rev. 2012, 102, 2011. [Google Scholar] [CrossRef]
- Zhao, J.; Tang, J. Industrial structure change and economic growth: A China-Russia comparison. China Econ. Rev. 2018, 47, 219. [Google Scholar] [CrossRef]
- Aldrighi, D.; Colistete, R.P. Industrial Growth and Structural Change: Brail in a Long-Run Perspective; Working Papers; University of São Paulo (FEA-USP): São Paulo, Brazil, 2013. [Google Scholar]
- Padilla-Pérez, R.; Villarreal, F.G. Structural change and productivity growth in Mexico. Struct. Chang. Econ. Dyn. 2017, 41, 53. [Google Scholar] [CrossRef]
- De Vries, G.J.; Erumban, A.A.; Timmer, M.P. Deconstructing the BRICs: Structural transformation and aggregate productivity growth. J. Comp. Econ. 2012, 40, 211. [Google Scholar] [CrossRef]
- Havlik, P. Patterns of structural change in the new EU member states. Wiiw Res. Rep. 2015, 6, 133. [Google Scholar] [CrossRef]
- Li, J.; Gao, Y. Empirical measurement of the impact of changes in trade structure on China’s economic growth. J. Commer. Econ. 2019, 17, 131. [Google Scholar]
- Liu, Y.; Liu, Q. Interactive analysis of Shanghai’s information industry structure and economic growth. Technol. Innov. Manag. 2019, 40, 766. [Google Scholar]
- Gan, C.; Zheng, R.; Yu, D. The influence of China’s industrial structure changes on economic growth and fluctuations. Econ. Res. 2011, 46, 4. [Google Scholar]
- Han, Y.; Huang, L.; Wang, X. Does industrial structure upgrading improve eco-efficiency? J. Quant. Tech. Econ. 2016, 33, 40. [Google Scholar]
- Jin, T.; Chen, J. Can inter-governmental transfer payments improve the rationalization of industrial structure? An empirical test based on provincial panel data from 1994 to 2011. Financ. Econ. 2013, 10, 79. [Google Scholar]
- Li, C.; He, J. Non-linear effects of industrial structure upgrading on economic growth and unemployment. Stat. Decis. 2018, 34, 150. [Google Scholar]
- Zhang, G.; Wang, Z. Measurement and decision of structural dividend in county economic growth: An empirical analysis based on panel data of 1820 counties in China. Econ. Theory Econ. Manag. 2014, 6, 102. [Google Scholar]
- Li, X.; Liu, G.; Wang, M. Is the rising proportion of tertiary industry cost disease or structure bonus? Stat. Res. 2016, 33, 46. [Google Scholar]
- Xu, Q.; Fang, S.; Ma, L. New urbanization, upgrading of industrial structure and China’s economic growth—Empirical research based on spatial spillover and threshold effect. Syst. Eng. Theory Pract. 2019, 39, 1407. [Google Scholar]
- Kato, H. The importance of government commitment in attracting firms: A dynamic analysis of tax competition in an agglomeration economy. Eur. Econ. Rev. 2015, 74, 57. [Google Scholar] [CrossRef]
- Tao, C.; Zhou, X. A study of nonlinear association and spillover effect of technology innovation and industrial structure upgrading under element agglomeration. Contemp. Financ. Econ. 2016, 1, 12. [Google Scholar]
- Sun, Y. An empirical study of the interactive relationship among industrial structure, economic growth and urbanization. J. Chang. Univ. 2016, 21, 15. [Google Scholar]
- Anselin, L.; Baltagi, B. A Companion to Theoretical Econometrics; Blackwell Scientific: Oxford, UK, 2001. [Google Scholar]
- Qu, X.; Lee, L. Estimating a spatial autoregressive model with an endogenous spatial weight matrix. Econometrics 2015, 184, 209. [Google Scholar] [CrossRef]
- Yu, M.; Zhao, F. An empirical study on the relations between optimization and upgrading of China’s marine industrial structure and marine economy. Mar. Econ. 2015, 5, 15. [Google Scholar]
- Wang, B.; Han, L. Impacts of marine industrial structure changes on marine economic growth for 11 coastal provinces in China. Resour. Sci. 2017, 39, 1182. [Google Scholar]
- Yan, X.; Yan, L.; Yao, X.; Liao, M. The marine industrial competitiveness of blue economic regions in China. Mar. Policy 2015, 62, 153. [Google Scholar] [CrossRef]
- Ma, X.; Zhang, F. Temporal-spatial differences research on the influence of marine industrial. Reg. Econ. Rev. 2017, 5, 94. [Google Scholar]
- CPGPRC (The Central People’s Government of the People’s Republic of China). Outline of the National Plan for the Development of Marine Economy. 2003. Available online: http://www.gov.cn/gongbao/content/2003/content_62156.htm (accessed on 9 May 2003).
- Che, M.; Deng, X.; Chen, B. Rationalization and improvements of industrial structure and economic. J. Manag. 2019, 32, 12. [Google Scholar]
- Zhang, Y.; Chen, B. Industrial structure, spatial spillover and urban-rural income gap: Partial differential effect decomposition based on spatial Durbin model. Inq. Econ. Issues 2018, 9, 62. [Google Scholar]
- Wang, G.; Wu, M. Analysis of spatial spillover effect of urbanization on economic efficiency. J. Commer. Econ. 2019, 23, 187. [Google Scholar]
- Chen, Z. Eco-efficiency, urbanization and spillover effects—Based on spatial panel Durbin model. Manag. Rev. 2016, 28, 66. [Google Scholar]
- Jiang, Y. Analysis on the development strategy of marine high-tech industry in Bohai economic circle-taking Shandong province as an example. Reform. Strategy 2018, 34, 123. [Google Scholar]
- Zhao, W.; Yu, J. Trade openness, FDI and China’s industrial economic growth pattern: Empirical analysis based on data of 30 industrial sectors. Econ. Res. J. 2012, 8, 18. [Google Scholar]
- Chen, D.; Peng, M.; Liu, R. Research on the impact of FDI and environmental regulations on the upgrade of industrial structure. Jianghan Acad. 2019, 38, 84. [Google Scholar]
- Charnes, A.; Cooper, W.; Rhodes, E. Measuring the efficiency of decision-making units. Welf. Econ. 1920, 2, 429. [Google Scholar]
- Sarkis, J.; Cordeiro, J.J. Ecological modernization in the electrical utility industry: An application of a bads-goods DEA model of ecological and technical efficiency. Eur. J. Oper. Res. 2012, 219, 386. [Google Scholar] [CrossRef]
- Han, Z.; Wu, A.; Peng, F.; Sun, J.; Xia, K. Eco-efficiency in the Bohai Rim Area based on undesirable outputs and threshold regression model. Prog. Geogr. 2018, 37, 255. [Google Scholar]
- Ren, W.; Ji, J.; Chen, L.; Zhang, Y. Evaluation of China’s marine economic efficiency under environmental constraints—An empirical analysis of China’s eleven coastal regions. J. Clean. Prod. 2018, 184, 806. [Google Scholar] [CrossRef]
- Wang, C.; Wu, J.; Zhang, B. Environmental regulation, emissions and productivity: Evidence from Chinese COD-emitting manufacturers. J. Environ. Econ. Manag. 2018, 92, 54. [Google Scholar] [CrossRef]
- Tone, K. Dealing with undesirable outputs in DEA: A Slacks-Based Measure (SBM) approach. Res. Rep. 2003, 5, 44. [Google Scholar]
- Lesage, J.; Pace, R.K. Introduction to Spatial Econometrics; Boca Raton Chapman & Hall/CRC Press: Boca Raton, FL, USA, 2009. [Google Scholar]
- Gai, M.; Zhu, J.; Sun, C.; Sun, K. Spatio-temporal evolution and influencing factors of marine economic efficiency in coastalareas of China. Resour. Sci. 2018, 40, 1966. [Google Scholar]
- Zheng, H.; Zhang, J.; Zhan, X.; Mu, H. Exploring the affecting mechanism between environmental regulation and economic efficiency: New evidence from China’s coastal areas. Ocean Coast. Manag. 2020, 189, 105148. [Google Scholar] [CrossRef]
- Wang, Z.; Zang, M.; Wang, Y. Temporal and spatial evolution of the economic efficiency of China’s marine threeindustries and its influencing factors. Econ. Geogr. 2020, 11, 121. [Google Scholar]
- Puskarova, P. Assessing the magnitude of globalization-induced technology flows in expanded Eu-sample: A multi-channel approach. Procedia Econ. Financ. 2015, 20, 544. [Google Scholar] [CrossRef]
- Li, J.; Zhao, L. The empirical analyses between financial agglomeration, productivity growth and urban-rural income gap-base on dynamic spatial panel model. Chin. J. Manag. Sci. 2018, 26, 34. [Google Scholar]
- Luo, N.; Li, J.; Luo, F. Empirical analysis on the relationship between the China urbanization and regional Eco-efficiency. Chin. J. Popul. Resour. Environ. 2013, 23, 53. [Google Scholar]
- MNRPRC (Ministry of Natural Resources of the People’s Republic of China). The Statistics Bulletin of China’s Marine Economy. 2017. Available online: http://gc.mnr.gov.cn/201806/t20180619_1798495.html (accessed on 19 June 2018).
| Publisher’s Note: MDPI stays neutral with regard to jurisdictional claims in published maps and institutional affiliations. |
© 2021 by the authors. Licensee MDPI, Basel, Switzerland. This article is an open access article distributed under the terms and conditions of the Creative Commons Attribution (CC BY) license (https://creativecommons.org/licenses/by/4.0/).


 The Bohai-Rim Economic Rim.
 The Yangtze River Delta Economic Rim.
 The Beibu Gulf Economic Rim.
 The Pearl River Delta Economic Rim.
 The Straits West Coast Economic Rim.


