Abstract
When considering the sustainability of production processes, research studies usually emphasise environmental impacts and do not adequately address economic and social impacts. Toy production is no exception when it comes to assessing sustainability. Previous research on toys has focused solely on assessing environmental aspects and neglected social and economic aspects. This paper presents a sustainability assessment of a toy using environmental life cycle assessment, life cycle costing, and social life cycle assessment. We conducted an inventory analysis and sustainability impact assessment of the toy to identify the hotspots of the system. The main environmental impacts are eutrophication, followed by terrestrial eco-toxicity, acidification, and global warming. The life cycle costing approach examined the economic aspect of the proposed design options for toys, while the social assessment of the alternative designs revealed social impacts along the product life cycle. In addition, different options based on the principles of the circular economy were analysed and proposed in terms of substitution of materials and shortening of transport distances for the toy studied.
1. Introduction
Existing environmental challenges leading to natural resource depletion, material scarcity, and increased pollution have driven consumption and production processes worldwide towards more sustainable strategies [1]. These sustainable strategies have changed the goals of companies, with companies becoming more aware of their environmental impacts [2]. In the past, production processes focused more on increasing economic efficiency and growth [3], but recently there has been a transition towards cleaner and more sustainable processes that emphasise social and environmental aspects [4]. Thus, incorporating sustainability principles into products and production processes has several positive economic impacts and improves environmental and social performance [5]. The Environmental Protection Agency (EPA) also points out that a large and growing number of manufacturing companies derive significant financial and environmental benefits from sustainable business practices [6].
The growing demand for sustainable consumption and production has encouraged cleaner production practices [7], which was later introduced via the circular economy (CE) concept. CE has emerged as an effective means of balancing the dimensions of sustainability [8] and is seen as a potential for adding value while generating positive social and environmental impacts [9]. CE has been comprehensively defined as an economic system that replaces the “end-of-life” concept with reduction, reuse, recycling, and recovery of materials in production/distribution and consumption processes, intending to achieve sustainable development [10].
Factors that support businesses’ transformation towards a cleaner, sustainable production, and more recently CE, include consumers, who are educated and sensitised to environmental and social challenges and demand more sustainable services and products [11]. These promote a rethinking of all the impacts of services and products throughout their life cycle [12], considering all three sustainability aspects. An assessment of sustainable products, including toys, is of utmost importance. Parents, as important consumers in the toy industry, want sustainable products for their children. There are suggestions that the toy’s price, environmental impact, and the raw materials’ origin should be seen as the essential attributes when buying a toy [13].
Sustainability assessment is comprehensively presented in various sectors for products, services and processes [14], such as building and construction engineering [15], the food industry [16] or agriculture [17]. A study about energy supply in Turkey highlighted the importance of holistic sustainability evaluations and the trade-offs between environmental, economic and social aspects based on a range of indicators [18]. There also exist several tools for sustainability assessment, for example, the Urban Development Sustainability Assessment Model (UD-SAM), the Product Sustainability Index (ProdSI), and the life cycle sustainability assessment [19].
Inspired by the United Nations Environment Program (UNEP) and the Society for Environmental Toxicology and Chemistry (SETAC) UNEP/SETAC guidelines in 2009 [20], the Social Life Cycle Assessment (S-LCA) is receiving increasing attention. Over the past decade since the publication of the original S-LCA guidelines, the field of S-LCA has matured and established itself as a method. Therefore, updated guidelines have been developed to provide additional information for conducting the S-LCA assessment [21]. The new guidelines also include support for measuring and evaluating progress against the UN Sustainable Development Goals (SDGs) [22].
S-LCA is concerned with the current and potential social impacts of processes, products, and services within their life cycle [23]. The overall increase in S-LCA publications in the last decade has been triggered by social responsibility governance documents and frameworks [20,22,24,25,26]. S-LCA collects, evaluates, analyses, and communicates information about social conditions and impacts associated with changes in the lives of workers, consumers, society, and other key stakeholders related to the product life cycle. S-LCA helps decision-makers select alternatives with the most favourable social impacts [27]. S-LCA provides decision-makers with important information about the lives of workers, consumers, society, and other key stakeholders related to the life cycle. Based on S-LCA results, it is easier to consider alternatives with the most favourable social consequences.
The life cycle costing (LCC) approach was first used by the US Department of Defence in the 1960s [28]. Since then, interest in estimating the optimal budget allocation by calculating the costs associated with the entire life cycle of a project, product, service, or investment has greatly increased. LCC provides valuable results for decision-making at critical points in different product life cycle stages [29]. Based on LCC analysis, environmental impacts can be determined in value-added throughout the product life cycle [30]. In addition to the conventional LCC, a purely economic dimension, a social dimension with associated environmental costs, has also been developed to provide a fully monetised life cycle sustainability assessment [31]. Since existing LCC calculation methods did not match the actual definition of LCC, a matrix-based approach in LCA was applied to LCC [32].
However, in reviewing the scientific literature, we have perceived a lack of holistic sustainability assessments, especially considering toys. The available studies primarily focus on the environmental aspect of sustainability, while economic and social perspectives are neglected [33]. Neglecting some aspects poses a challenge as all three sustainability elements are interrelated and significantly influence each stage of the life cycle of a product, process, or service [34]. A literature review in the Web of Science database reveals few studies on evaluating toys under different sustainability aspects. Choi et al. [35] analysed the toy train’s environmental impact, while Muñoz et al. [36] evaluated the toy teddy bear. Besides, Wilkinson and Lamb [37] investigated the impact of toys on safety and chemical risks, which was also a research topic of Landrigan et al. [38] and Becker et al. [39]. Shin & Colwill [40] assessed the design and manufacturing perspective of toys by presenting an integrated tool that provides a framework for incorporating social benefits into sustainable product design. However, we did not perceive a sustainability assessment of a toy.
Some authors argue that the life cycle sustainability assessment (LCSA) can be considered the best approach to assessing all three sustainability aspects [41]. This approach combines the three related assessment methods, namely environmental life cycle assessment (E-LCA), life cycle costing (LCC) to assess the economic aspect, and social life cycle assessment (S-LCA) [42]. Since the first attempts to evaluate E-LCA, this method has evolved significantly and matured. LCC is a concrete application in the field of economic aspects of product design, abandoning the traditional approach of only reducing production costs and shifting to a systematic evaluation that provides insight into a more comprehensive assessment. Considering only the long-term benefits of E-LCA and LCC would not be sufficient for the overall sustainability assessment. A full sustainability assessment needs to include the S-LCA to assess social relations’ impact on material and stakeholder activities.
Our work extends the work of the previous authors by conducting a sustainability assessment of the monkey toy using E-LCA, LCC and S-LCA. Therefore, the study represents an attempt to improve the understanding of a selected toy’s sustainability impacts, processes, and refinement opportunities. Based on the results obtained, we have suggested improvements that use circular economy principles for production and material options that have a positive impact on the performance of the toy. Our study helps manufacturers to rethink their resources and production processes, making truly sustainable toy products for children.
2. Methodology
In this paper, a life cycle sustainability assessment (LCSA) is used to integrate the three aspects of sustainable development (economic, environmental, social), as shown in Figure 1. The simple equation can represent LCSA: LCSA = E-LCA + LCC + S-LCA, which integrates the environmental LCA (E-LCA), life cycle costing (LCC) and social LCA (S-LCA). The E-LCA can be a suitable starting point for updating and developing an integrated methodology that combines three sustainability aspects [42]. The E-LCA method has shown that quantification is possible, and this advantage should be maintained when adding economic and social aspects to an integrated LCSA.
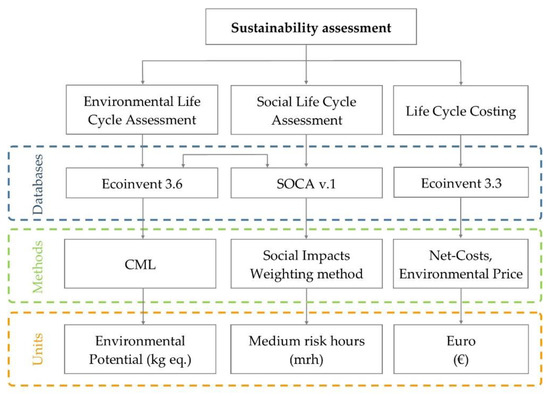
Figure 1.
The methodology used in this work for the sustainability assessment of design options.
Environmental life cycle assessment (E-LCA) is the most widely used method for assessing potential environmental impacts over their life cycle [43]. It is an environmental assessment method that analyses the impact of a product system and activities on the environment. Our study followed the ISO standards 14040 [43] and 14044 [44] and four well-known LCA phases, which include goal and scope definition, inventory analysis (LCI), impact assessment (LCIA), and interpretation of results.
Social life cycle assessment (S-LCA) is a method for assessing, analysing, and communicating information about the social and socio-economic aspects of products and their potential positive and negative impacts along their life cycle [20]. The S-LCA method has not yet been formalised in an international standard, so it follows the steps proposed for the E-LCA in ISO 14040 [23,45]. However, a guideline for assessing potential positive and negative impacts along the product life cycle has been produced by UNEP-SETAC and is the most followed by authors conducting social accounting [20,21].
The LCC method estimates the cost of a product over its entire life cycle. The LCC is the sum of the cost for each activity in the product life cycle [32]. Often industries and larger companies have developed their LCC approach with selected cost categories and valuation methods [31]. The value created by a process is the difference between the costs expended and the selling price obtained. Although traditionally used more to support investment decisions, some authors [32,46] have proposed and used this approach for environmental LCC.
To perform a full sustainability assessment of the toy, a complete E-LCA, S-LCA and LCC are applied. As shown in Figure 1, the methodology includes all three sustainability pillars but without the intention of integrating the results of each sustainability pillar into a single value, e.g., a sustainability index. In this way, decision-makers’ information remains available to value decisions, depending on societal preferences, corporate policy, or individual preferences.
3. A Case Study
For a case study, we took a monkey toy manufactured by Avantus in Maribor, Slovenia, a small company whose mission is to employ people with disabilities due to illness, disability, social exclusion, or functional limitations. In order to perform a sustainability assessment, we applied the methods E-LCA, S-LCA and LCC.
3.1. Functional Unit
In this study, the functional unit is considered as 1 item of monkey toy for the entertainment of children aged 0–3 years (Figure 2.). The same functional unit was used for all three sustainability aspects. We selected the functional unit based on two previous studies by Muñoz et al. [36] and Choi et al. [35], in which the authors also identified a toy as a functional unit. The toy measures 68 cm and weighs 205 g and is made of socks (cotton and viscose fibres) and filled with rice and a synthetic filler sewn with a thread.
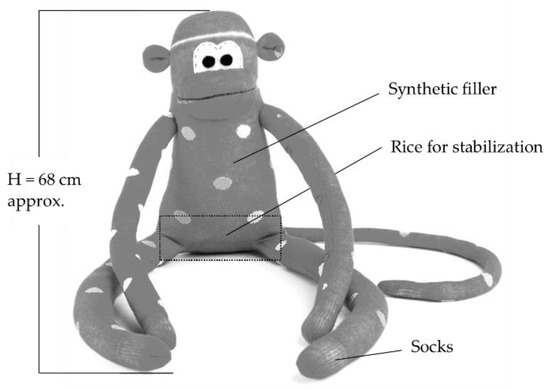
Figure 2.
A monkey toy studied.
3.2. Goal and Scope of the Study
The goal of this study is to conduct a sustainability assessment of the monkey toy by extending the work of previous authors who have conducted environmental assessments in the toy sector. The study aims to provide additional information on the toy’s life cycle’s environmental, economic, and social impacts.
3.3. System Boundaries
The most commonly used boundary system for LCA is “cradle to grave”, including raw material procurement, manufacturing, transportation, operation, maintenance, recycling, and disposal [47]. Our study considers a “cradle to gate” approach, i.e., a partial product life cycle, due to the data gaps within the use and end-of-life phases. Thus, our system includes material extraction, material processing, material transport and production processes. We also considered the one-way transport from the production sites to the Avantus company, see Figure 3. The system boundary excludes the energy required to assemble the monkey, as the company’s employees perform it manually.
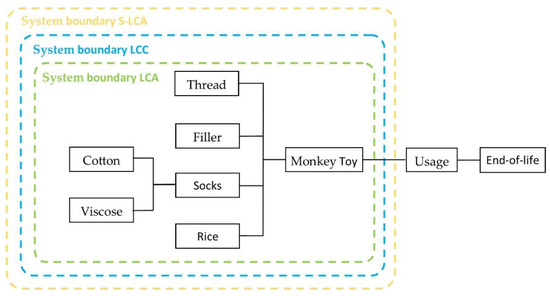
Figure 3.
System boundary.
3.4. Data Acquisition and Inventory
We obtained primary data on the production of the monkey toy from the companies involved in the production processes, as described below:
- Information about the monkey toy and materials, including all costs.
- Information about the production processes.
- Information about the transport routes and all material suppliers.
- Information about the vehicle and fuel type, with fuel consumption calculated using average data.
Table 1 presents the weighted material used for the monkey toy. We also calculated the materials fractions: 70% synthetic filler (fleece), which is the largest proportion, followed by 15% cotton, 12% rice, and 3% viscose fibres. The thread was excluded from the analysis as it represents less than 0.1%. Thus, we applied cut-off criteria to control for the elimination of insignificant system inputs. Typically, less than 1% (mass, energy, or environmental relevance) of the total system is chosen as the cut-off factor. Secondary data for transportation fuel and synthetic filler production and vehicle and fuel type data were obtained from the Ecoinvent database v.3.6. Furthermore, we investigated the logistic processes considering the transport distances. Supplementary to Table 2, we provide further details:

Table 1.
Life cycle inventory analysis of the toy.

Table 2.
Factors for assigning six levels of risk to social indicators.
- The synthetic filler is produced in Slovenia and transported by diesel vehicles.
- The socks are also produced in Slovenia, but the cotton is supplied and transported from Turkey.
- Viscose is delivered and transported from Slovenia.
- Rice originates from northern Italy and is also transported to Slovenia.
We have assumed that all the material is transported directly to the production company, without intermediaries (retailers) involved in the sales and transport process.
3.5. Impacts Assessment
CML method was used to identify quantitative life cycle indicators for environmental impact assessment [48]. Seven impact categories were selected in our study. These impact categories were assessed and normalised using the normalisation factors for Europe 25 + 3 [49], as the production of monkey toys takes place in Slovenia. The LCA software package GaBi Professional [50] and the Ecoinvent database v.3.6 [51] was used for the E-LCA. S-LCA models were developed in OpenLCA using the SOCA V.1 database and “Social Impact Weighting method” developed by Green Delta [52]. LCC was assessed using the Ecoinvent 3.3 database with integrated prices of material flows.
3.5.1. Environmental Life Cycle Assessment
A variety of methods are available for conducting the E-LCA study. The method CML 2001 [48] is used to identify quantitative life cycle-based indicators for measuring and monitoring environmental impacts. CML 2001 is one of the most commonly used methods for conducting the study LCA [53] that limits quantitative modelling to the early stages of the cause-effect chain to limit uncertainties. Results are grouped into mid-point categories according to common mechanisms or generally accepted groupings.
As suggested by [54], a selection of impact categories should be comprehensive, relevant, and associated with the observed system. However, a selection of impact categories has not been explicitly specified [55]. Following the review by Vidergar et al. [56], we used the seven most commonly used impact categories within CML in our study. Furthermore, we normalised the obtained results with the normalisation factors for Europe 25 + 3 [49] since the monkey toy production is located in Slovenia. Klöpffer & Grahl [55] suggest that normalisation factors should be approximated by geographical system boundaries, as normalised factors do not exist for Slovenia.
Seven environmental impact categories are considered in this study, including:
- Abiotic depletion potential (ADP),
- Acidification potential (AP),
- Eutrophication potential (EP),
- Global warming potential (GWP),
- Ozone depletion potential (ODP),
- Photochemical ozone creation potential (POCP),
- Terrestrial eco-toxicity potential (TETP).
3.5.2. Social Life Cycle Assessment of Toy Production
For the social assessment, the SOCA database [57] was used with the OpenLCA software. The SOCA database is an add-on for the Ecoinvent v.3.3 database [51] and provides transparent and comprehensive information for conducting social life cycle assessments (S-LCA). Similar to the UNEP-SETAC framework [20,21], the SOCA database covers four stakeholder categories: local community, value chain actors, workers, and society. The structure of the social indicators assessed is based on the structure of the UNEP-SETAC framework. All proposed indicators from the SOCA database were included in this case study, with 37 indicators covering 17 subcategories and four stakeholder categories (Table 3).

Table 3.
Defined stakeholder categories, subcategories and selected social indicators used in the case study.
Social impact categories included Local Community (access to material resources, safe and healthy living conditions, migration, respect for Indigenous rights, local employment) with 13 indicators. Two subcategories covered the assessment of value chain actors (fair competition and corruption) with two indicators. Special attention was paid to workers, for which eight subcategories were used (child labour, health, and safety (workers), forced labour, fair salary, discrimination, freedom of association and collective bargaining, social benefits, legal issues and working time). Impact on society was assessed using four indicators within two subcategories (contribution to economic development and health and safety (society)). While some issues related to workers have been extensively studied, the stakeholder category “workers” receives the most attention in S-LCA studies [58]. On the other hand, consumers have not received much research attention, likely due to the difficulty in assessing the use phase [59]. As a result, the use phase is also not included in the SOCA database and was not considered in our study.
The SOCA database provided data for the social impact assessment using an ordinal risk scale with six different risk levels, as some indicators are measured in different units (percentage, absolute values, etc.) and need to be converted to the same unit of measurement. Each risk level is associated with medium risks (medium risk corresponds to a factor of 1 and the other risk levels have a specific factor assigned to them), as shown in Table 2. A so-called activity variable quantified the risks. Activity variables are applied as working hours for all indicators, including those not related to working conditions. Working hours express how long work has to be done to produce a € output of the selected process (h/EUR output for each process). The total social impact over the life cycle is calculated by aggregating the scaled social risks of all involved processes along the life cycle (product system): scaled by price (inputs), the number of working hours and characterisation factors from the S-LCA “Social Impact Weighting method” [57]. Finally, the results are expressed in medium risk hours (all impacts associated with medium risk). Since the results are expressed in medium risk hours, it is straightforward to combine them into the final result.
In our case, the most challenging phase of the study was the definition of the indicators. It is often challenging to design social indicators so that they are not subjective and at the same time measurable and data are available. Therefore, we used the social indicators proposed by GreenDelta [57], which are presented in Table 3.
3.5.3. Life Cycle Costing of Toy Production
In our case, we used the OpenLCA software with the integrated life cycle costing feature. The cost of process data sets is a starting point for the cost model and LCC calculation in OpenLCA. In the process editor, costs can be entered for each exchange, i.e., for each input and output of a process. Revenues can be modelled as negative costs, and cost items can be further detailed.
Life cycle costing (LCC) was used to investigate the economic aspect of a monkey toy, which includes all system boundary costs. Although Florindo et al. [60] propose a comprehensive evaluation of raw material extraction, production, distribution, operation, maintenance and disposal, our study is limited to the defined system boundaries. The LCC is based on the production cost of the materials required for the installation phase and the transportation cost within the system boundary. In this work, the LCC was implemented using the OpenLCA tool. Life cycle costs were modelled as properties of exchanges, i.e., inputs and outputs of processes. Costs can be positive or negative, with negative costs representing value-added. The implementation of value-added follows current proposals [32,46]. The price data come from the case studied company and from the Ecoinvent 3.6 database.
We used the following information and data sets for the LCC:
- The production cost of rice: Rice is produced in Italy. We considered the production cost of Italian rice based on the production price data for 1 ha of traditional Italian rice, including the cost of irrigation water. The data were taken from a study by Hassen et al. [61], who investigated the production prices and value of Italian rice, as the cost of rice production could not be acquired from the company. Data on the amount of Italian rice cultivation per ha in kg was obtained from a study by Ferrero [62]. For the transport of rice from Italy to Slovenia, we considered a truck 16–32 t.
- The production cost of filler: This is per 1 kg of filler, where the company delivers two bales of filler (22.99 kg) in one shipment. We have considered transport costs for a 3.5-ton vehicle with a loading capacity of 1.5 tons.
- The production cost of socks: Socks are produced from Turkish cotton and viscose, i.e., the production cost per 1 kg of Turkish cotton was taken from the reference of Yılmaz & Gül [63], as we cannot obtain the data from the company. The cotton is transported by a lorry 16–32 t. Since we could not collect data for viscose production cost, an estimation was used by following the market trends for viscose [46].
- Transport costs: Due to the lack of data from the toy manufacturer, we calculated the transport costs for each component by using the data from Ecoinvent V.3.6 for the process “transport, freight, lorry, EURO5 | cut-off, U” for the use of 3 truck types: the size class 16–32 t, 7.5–16 t and 3.5–7.5 t trucks. The transport data sets refer to the entire transport life cycle, i.e., construction, operation, maintenance and end-of-life of vehicles and road infrastructure. Fuel consumption and emissions refer to average European journeys.
3.6. Sustainability Evaluation of Improvement Options, Using Circular Economy Principles
Different options based on the principles of the circular economy have been analysed and proposed in relation to the material used. The monkey toy already represents the reuse of waste material from sock production, made from waste socks.
Since the filler represents 68.3% of the mass of the monkey toy, we address an improvement option by replacing a synthetic filler with natural fibres. Therefore, we investigated the possibility of replacing a synthetic filler with wood wool, labelled as option A, and assessed the environmental impact using existing databases (Ecoinvent, GaBi). In the study of the different scenarios, we considered all relevant process steps along the supply chain. The inventory is mainly based on industry data and complemented by secondary data.
In the baseline design, the toy is filled with rice to ensure its stability. Such a design is not in line with sustainable design approaches, as the material is primarily intended for human nutrition. For this reason, we proposed to replace rice with cherry pits as a waste product from cherry production. In 2019, 2161 tons of cherries were grown in extensive orchards in Slovenia. The pits as natural waste can be usefully used as stability filler for the designed toy. Therefore, the use of wood wool and rice replacement with cherry pits was investigated (option B).
Regarding transportation, we considered another improvement option. As the material for sock production is delivered from Turkey (2145 km), other countries produce the cotton (e.g., Greece) with a shorter delivery distance (965 km), which would affect the environmental impact. Therefore, a design that includes wood wool filler, cherry pits and a shorter delivery distance was evaluated (option C).
4. Results of the Life Cycle Sustainability Assessment
We have gathered and explained results obtained under this section, using E-LCA, LCC and S-LCA for the observed system of monkey toy production.
4.1. Results of the E-LCA
4.1.1. E-LCA of the Baseline Design
We have introduced the E-LCA results for the entire system of the baseline toy design in Figure 4. The most critical potential consequences emerged from global warming (GWP), followed by acidification (AP), terrestrial eco-toxicity (TETP), eutrophication (EP) and photochemical ozone creation (POCP). Less significant impacts are abiotic depletion (ADP elements) and ozone layer depletion potential (ODP).
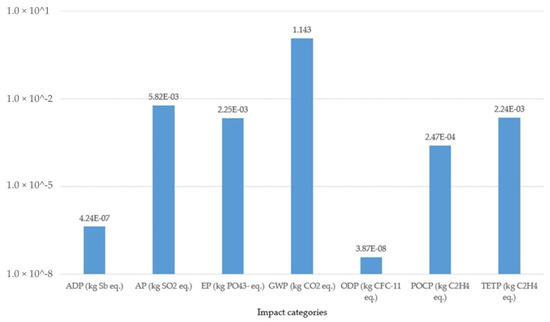
Figure 4.
Environmental impacts of the monkey toy from cradle to gate.
We have also represented normalised environmental impacts (Figure 5), using the normalisation factors for Europe 25 + 3 [49]. When normalised, the most significant environmental impacts of the monkey toy at the European reference region are EP, followed by TETP, AP and GWP.
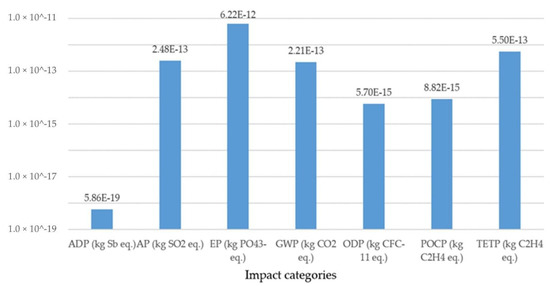
Figure 5.
Normalised environmental impacts of the monkey toy.
To identify the system’s hot spots regarding the environmental impacts, we have calculated relative contributions of the toy’s specific materials and parameters, see Figure 6. The fleece production for filler and socks production are the main factors contributing to the overall environmental impacts. Rice production has a lower contribution to all environmental impact categories considered. For example, fleece production contributes 76% of the GWP category’s results, while socks production contributes 21% and rice production 2%. Thus, the rise production and transport processes contribute less to the overall environmental impacts.

Figure 6.
Relative fractions (in %) of production processes to the overall environmental impacts.
4.1.2. Results of the E-LCA of Improvement Options Compared to the Baseline Design
We have included four environmental impacts in the additional evaluations, which emerged by the E-LCA results as critical: GWP, EP, TETP, AP. For Option A, replacing the filler with natural fibres reduces the carbon footprint by 32.1 % (Figure 7) compared to the baseline design. When using hemp filler and replacing rice with cherry pits (Option B), the toy’s carbon footprint is reduced by 3.8 % compared to Option A. The shorter transport distance (Option C) resulted in an additional 0.5% reduction in carbon footprint than option B (Figure 7).
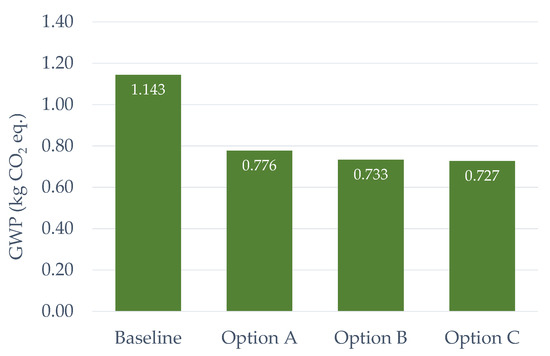
Figure 7.
Global warming potential of compared improvement options.
Evaluated options to the eutrophication potential in Figure 8 show the most significant baseline design score. Alternative options have a lower potential of 64.2% for Option A, 71.5% for Option B and 72.0% for Option C compared to the baseline design.
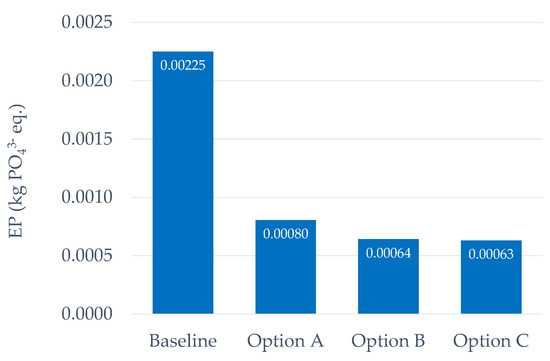
Figure 8.
Eutrophication potential of compared improvement options.
We have also evaluated design options in terms of acidification potential. The impact on acidification potential (kg SO2 eq.) is most remarkable for the baseline design. In contrast, all other design options provide lower acidification values (a 42.6% reduction for option A, a 44.6% reduction for option B, and a 44.9% reduction for option C), as shown in Figure 9.

Figure 9.
Acidification potential of compared improvement options.
The terrestrial eco-toxicity potential (TETP) results reflect how pollutants affect land-dependent organisms and their environment [64]. The results in Figure 10 show the highest terrestrial eco-toxicity potential for the baseline option, corresponding to 2.29 × 10⁻³ kg 1,4-DB eq. per toy. The lowest value is achieved by alternative option C, followed by options B and A. All improvement options show a reduction in terrestrial eco-toxicity potential of 50.9% for option A, 51.0% for option B and 51.9% for option C.
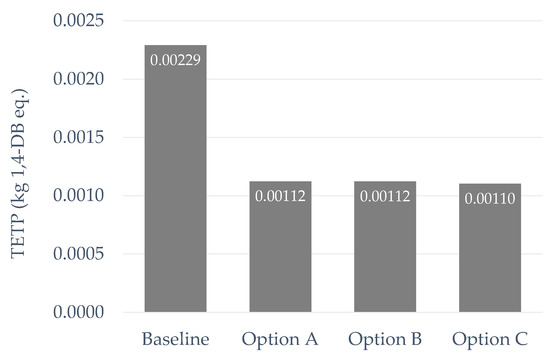
Figure 10.
Terrestrial eco-toxicity potential of compared improvement options.
Table 4 presents summary results for selected categories of environmental impacts for the circular design options. The results show that design option C is the most appropriate option for reducing environmental impacts, followed by options B and A, which also show encouraging results. The E-LCA of the proposed alternative design options for the monkey toy indicates that the option with hemp filler, cherry pits and shorter delivery distance is the most environmentally friendly among the evaluated design options.

Table 4.
Environmental impacts of proposed design alternatives.
4.2. Results of the S-LCA of Baseline Design and Improvement Options
This section presents the results of the social impact assessment of monkey toy production. The overall results of S-LCA show that the baseline design has the highest overall mid-risk hours for all indicators. In the group of indicators reflecting aspects of the local community, the highest impact is attributed to safe and healthy living conditions, followed by migration and access to material resources. In the group of value chain actors, corruption represents the most considerable contribution to mid-risk hours. In the workers’ category, the most significant contributor is worker health and safety. A holistic analysis of the indicators of fair salary, and freedom of association and collective bargaining leads us to conclude that it will be necessary for governments and interested parties to determine policies that, instead of widening the gap of inequality, fomenting conflict and delinquency, promote the development and welfare of workers through a wage distribution that is in line with inflation and the cost of living. From the perspective of society, the most prevalent indicator is the contribution to economic development. In Table 5, we have presented summary indicators for the S-LCA of our case study.

Table 5.
S-LCA of alternative design options (med risk hours).
Figure 11 shows the contribution to social indicators for specific groups of indicators (local community, value chain actors, workers and society). The data were obtained from the SOCA database to select the risk level according to the parameters from the OpenLCA software used.
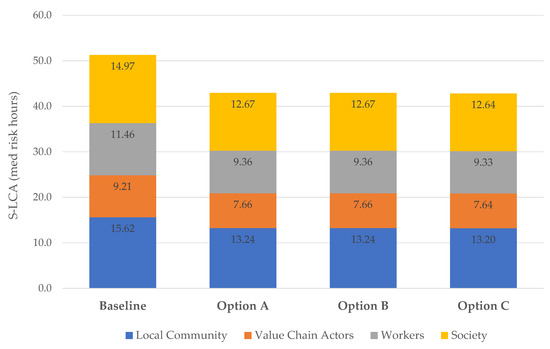
Figure 11.
Social life cycle assessment (S-LCA) of evaluated improvement options, expressed in med risk hours.
4.3. Results of the LCC of Baseline Design and Improvement Options
Italian rice production cost was estimated to 0.31 €/kg or 0.0078 € per 25 g. Rice transportation costs for one monkey unit for a 624 km transport distance is 4.48 × 10⁻⁴ €. The stuffing production costs amount to 1.6 €/kg or 0.23 € per monkey unit (142 g). The transport costs of a 240 km transport distance per 142 g filler correspond to 3.45 × 10⁻³ €. The production costs for Turkish cotton amount to 0.383 €/kg or 0.012 € per monkey toy unit (30.4 g of cotton). The transport of 1 t cotton costs 0.1044 €/km, meaning transportation costs for a 2145 km transport distance are 1.87 × 10⁻³ € per monkey toy unit. For this material, the Avantus company pays nothing because these socks are waste material from other production processes. Thus, the production cost for cotton production was excluded from the LCC analysis.
It is cheaper for the sock production company to deliver wasted socks from the production processes to Avantus for free than to pay disposal costs. Due to a lack of data, we could not determine the cost of viscose production. However, an estimate was made by following market trends for viscose and estimating production costs at 3.43 €/kg or 0.026 € per monkey toy unit (7.6 g viscose) [65]. Transporting 1 t of viscose was estimated at 0.03945 €/km, which means that the transport cost for a 238 km transport distance per monkey unit (7.6 g) is 7.14 × 10⁻⁵ €. Also, the viscose does not represent a cost for Avantus as it is part of the socks. Therefore, the production costs for viscose production were excluded from the LCC analysis. The results of LCC for the baseline design of one monkey toy unit are presented in Table 6.

Table 6.
Life cycle costing results for the baseline design of one monkey toy unit.
The studied case of toy production was evaluated in terms of cost from the manufacturer’s perspective located in Slovenia. The LCC of upstream processes carried out by different producers, such as material production or transport, were included in the assessment, which allows for a consideration of the whole supply chain. The given monetary values, expressed in EUR, were calculated per functional unit.
Figure 12 shows the LCC of design alternatives A, B, and C compared to the baseline design. The cost for each life cycle phase is summed up in a cumulative contribution. Considering the maximum mass, the cost of fleece production for baseline design was expected to be the highest. When the fleece filler was replaced with wood wool, the LCC costs were significantly reduced for all options. The lowest cost among the options studied was achieved by Option C, although the differences between all the designed options were minor.
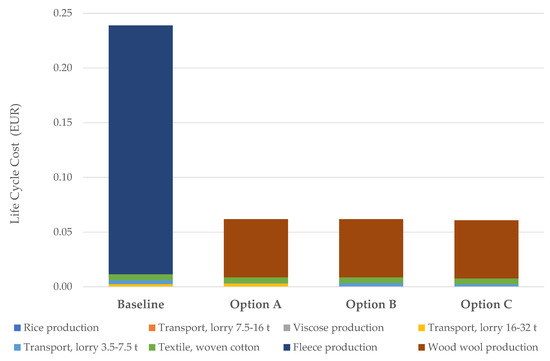
Figure 12.
Life cycle costing (LCC) for evaluated improvement options (EUR).
5. Discussion
In this study, we conducted a life cycle sustainability assessment for the monkey toy. Regarding the environmental impact of the toy, we found that the eutrophication potential is the most critical, followed by terrestrial eco-toxicity, acidification potential and global warming. Regarding the relative contributions of the different materials and transport in the production phase, our results confirm those of Muñoz et al. [36], where a few components were responsible for about 90% of the total impact on the system. The filler and sock production represents a significant environmental impact in all impact categories, considering the results. The environmental impact of the monkey toy can be decreased, as suggested by Sousa-Zomer et al. [8]. Based on the circular economy principles, the proposed improvement options show a significant reduction in environmental impact, especially in eutrophication potential, which is a significant concern in our case study. Gusmerotti et al. [66] suggest that replacing synthetic fibres with natural fibres reduces the environmental impact of component production.
Regarding the production cost of the monkey toy, there is a large gap between the company’s material price and the cost of the individual materials, such as rice and filler, which are considered an economic hotspot. The filler is the most expensive component. The use of natural materials proposed in the improvement options would also improve the financial outlook as they are mostly waste materials from other processes. However, we must mention that we could not obtain the cost of cherry pits in Slovenia. Cotton and viscose are considered components that are purchased for free because they are present in the socks. However, the costs are incurred in the production and transportation phases. Moreover, the total cost of cotton is 0.025 € per monkey toy, although the cost does not affect the company and does not represent an economic hotspot. Our evaluations, considering the costs and the entire value chain, indicated that option C would be the best solution with the lowest cost if we consider circular economy principles and the reuse of natural materials (e.g., wood wool and cherry pits).
The social aspect of the monkey toy is important because we can gain additional insights related to sustainability. Selected S-LCA indicators show high social responsibility of the company and the monkey toy production and are above the average in Slovenia. Furthermore, the social impact of the monkey toy has several impacts both in the production phase and in the wider environment, and no social issues were perceived. The data for the implementation of S-LCA were taken from the SOCA database. Although this is one of the best databases for social impact assessment, it is essential to realise that the analysis results represent a generic result with average means for the risk. Higher quality data and results would be obtained using data for entire life cycle processes, which is almost impossible due to inaccessible data.
Our results suggest that processes and products require a sustainability assessment that provides a holistic aspect, and the integration of circular economy principles is beneficial. Bond et al. [67] also point out the importance of a rigorous sustainability assessment to identify and select the best alternative option. Furthermore, Ali and Puppim de Oliveira [68] suggest that a shift to a circular economy needs to explore and understand an integrated framework based on empirical evidence to achieve sustainability. The results suggest that environmental and social risks are widespread and overlapping in toy production, considering empirical evidence. The paper proves added value when all three aspects of sustainable development are considered. While the cost assessment of a case-studied product is still one of the most critical design criteria, a more comprehensive insight into the production system becomes necessary. The toy case study aims to contribute to the further development of the complete LCSA approach that does not neglect any of the aspects of the sustainability pillars. The most important result of this study is the methodological contribution to the application of S-LCA and LCC in a real case study of toy production. Besides, most studies do not include the calculation of environmental costs, which is a unique feature of this study.
This study is based on a comprehensive assessment of social, environmental and economic aspects guided by the circular economy concept. The study shows that all aspects of sustainability can be improved by (re)designing the product, as shown in the toy case study. The difference between alternative designs regarding all aspects considered (environmental, social and economic) is slight. The most significant improvement in sustainability would be achieved by replacing a synthetic filler with wood wool. It is recommended that the case studied company prioritise this action. In the baseline design, rice is used as a supporting filler. Since the rice is primarily for human consumption, it is recommended that the company replace it with the proposed design using cherry pit waste. If the recommendations are followed, it will also contribute to the ethical awareness of the company.
In our case, trade-offs between sustainability aspects were not observed as the proposed toy design shows favourable results in all three evaluated sustainability aspects. However, trade-offs often occur in the implementation of LCSA. Numerous studies address this issue to develop tools to overcome such a problem [69,70]. There are still dilemmas in designing and evaluating sustainability in terms of trade-offs between sustainability aspects [71,72,73]. The integration of E-LCA, S-LCA and LCC methods in LCSA is associated with some research gaps. This study aims not to remove ambiguities and doubts about the LCSA method, as this research area is vast and needs to be addressed holistically in future work. As future case studies in LCSA are conducted, more information will become available to understand better the methodological trade-offs involved in conducting a comprehensive LCSA analysis [23].
6. Conclusions
This study represents a comprehensive sustainability assessment for the case of a monkey toy by disclosing information about all the three sustainability dimensions and revealing hotspots. Considering the results obtained, we can perceive that the most appealed are environmental issues, which circular economy principles can substantially improve. Simultaneously, social indicators showed a reduced impact in terms of mid-risk hours. Economic indicators can also be improved by, for example, using waste material (cherry pits) instead of synthetic filler, which the company receives for free. Furthermore, the toy itself supports sustainability on a local level when thinking about employment, the involvement of local companies and the associated short transport distances.
The novelty and added value of this paper provide a sustainability assessment and elaboration attempt for a toy. Thus, our study enriches current knowledge and research on the sustainability of toys, production processes and design, and offers new perspectives on hotspots and improvement opportunities. Also, we see the benefits of this study in terms of toy design (selection of materials) and consideration of circular economy principles (e.g., reuse, recycling of materials). This paper also offers opportunities for benchmarking toys and suggestions for greater corporate social responsibility.
We should also address some restrains of the study. A first limitation relates to the entire life cycle approach considering the use and end-of-life phases, which we omitted from the study due to the unavailability of data for our case study. The Avantus company does not collect information after the toy is sold. Another limitation relates to the company and country-specific case and cannot be generalised to the production processes of other toy manufacturers but could be used for benchmarking purposes. Some E-LCA and LCC data were taken from the Ecoinvent database, and data for S-LCA were taken from SOCA databases. Although these are consistent, trustworthy, and reliable databases, some data might still be uncertain, and this obstacle should be considered when drawing conclusions from LCSA analysis. Future studies should focus on the entire life cycle and foster a company to collect the necessary data from the use and end-of-life activities and deepen the social-related indicators. However, quantitative social indicators are still a challenge. The analysis results are helpful in making decisions about the design, evaluation and benchmarking of toys and similar products.
Author Contributions
Conceptualisation, R.K.L. and V.O.; methodology, R.K.L., V.O. and D.K.; software, R.K.L., V.O., and D.K.; validation, D.K. and R.K.L.; investigation, R.K.L., V.O. and D.K.; data curation, V.O., D.K. and R.K.L.; writing—original draft preparation, R.K.L. and V.O.; writing—review and editing, R.K.L. and D.K.; visualisation, V.O. and D.K.; supervision, R.K.L.; project administration, R.K.L. All authors have read and agreed to the published version of the manuscript.
Funding
Authors would like to acknowledge financial support from the Ministry of Education, Science and Sport of Republic of Slovenia and European Regional Development Fund for project No. 5441-2/2018. Rebeka Kovačič Lukman was supported by the Slovenian Research Agency (Grant No. P1-0403).
Institutional Review Board Statement
Not applicable.
Informed Consent Statement
Not applicable.
Data Availability Statement
No new data were created or analyzed in this study. Data sharing is not applicable to this article.
Acknowledgments
Authors would also like to thank Matjan Cojhter (Avantus CEO) for supporting the research work and providing available data.
Conflicts of Interest
The authors declare no conflict of interest.
Abbreviations
| ADP | Abiotic depletion potential |
| AP | Acidification potential |
| CE | Circular economy |
| CML | Centre of environmental science |
| E-LCA | Environmental life cycle assessment |
| EP | Eutrophication potential |
| ETP | Ecotoxicity potential |
| FAETP | Freshwater aquatic eco-toxicity potential |
| FU | Functional unit |
| GWP | Global warming potential |
| HT | Human toxicity |
| ISO | International Organization for Standardization |
| LCA | Life cycle assessment |
| LCC | Life cycle costing |
| LCSA | Life cycle sustainability assessment |
| MAETP | Marine aquatic eco-toxicity potential |
| OLDP | Ozone layer depletion potential |
| POCP | Photochemical ozone creation potential |
| S-LCA | Social life cycle assessment |
| TETP | Terrestrial eco-toxicity potential |
References
- Jegatheesan, V.; Liow, J.; Shu, L.; Kim, S.; Visvanathan, C. The need for global coordination in sustainable development. J. Clean. Prod. 2009, 17, 637–643. [Google Scholar] [CrossRef]
- Hens, L.; Block, C.; Cabello-Eras, J.; Sagastume-Gutierez, A.; Garcia-Lorenzo, D.; Chamorro, C.; Mendoza, K.H.; Haeseldonckx, D.; Vandecasteele, C. On the evolution of “Cleaner Production” as a concept and a practice. J. Clean. Prod. 2018, 172, 3323–3333. [Google Scholar] [CrossRef]
- Gbededo, M.A.; Liyanage, K. Identification and alignment of the social aspects of sustainable manufacturing with the theory of motivation. Sustainability 2018, 10, 852. [Google Scholar] [CrossRef]
- Almeida, C.; Agostinho, F.; Huisingh, D.; Giannetti, B. Cleaner Production towards a sustainable transition. J. Clean. Prod. 2017, 142, 1–7. [Google Scholar] [CrossRef]
- Pusavec, F.; Krajnik, P.; Kopac, J. Transitioning to sustainable production—Part I: Application on machining technologies. J. Clean. Prod. 2010, 18, 174–184. [Google Scholar] [CrossRef]
- National Research Council. Sustainability and the US EPA; National Academies Press: Washington, DC, USA, 2011; pp. 1–150. [Google Scholar]
- Sáez-Martínez, F.J.; Lefebvre, G.; Hernández, J.J.; Clark, J.H. Drivers of sustainable cleaner production and sustainable energy options. J. Clean. Prod. 2016, 138, 1–7. [Google Scholar] [CrossRef]
- Sousa-Zomer, T.T.; Magalhães, L.; Zancul, E.; Campos, L.M.; Cauchick-Miguel, P.A. Cleaner production as an antecedent for circular economy paradigm shift at the micro-level: Evidence from a home appliance manufacturer. J. Clean. Prod. 2018, 185, 740–748. [Google Scholar] [CrossRef]
- Pla-Julián, I.; Guevara, S. Is circular economy the key to transitioning towards sustainable development? Challenges from the perspective of care ethics. Futures 2019, 105, 67–77. [Google Scholar] [CrossRef]
- Saidani, M.; Yannou, B.; Leroy, Y.; Cluzel, F.; Kendall, A. A taxonomy of circular economy indicators. J. Clean. Prod. 2019, 207, 542–559. [Google Scholar] [CrossRef]
- Saricam, C.; Erdumlu, N.; Silan, A.; Dogan, B.L.; Sonmezcan, G. Determination of consumer awareness about sustainable fashion. In 17th World Textile Conference Autex 2017—Shaping the Future of Textiles; IOP Publishing: Bristol, UK, 2017; Volume 254. [Google Scholar] [CrossRef]
- Ma, J.; Harstvedt, J.D.; Dunaway, D.; Bian, L.; Jaradat, R. An exploratory investigation of additively manufactured product life cycle sustainability assessment. J. Clean. Prod. 2018, 192, 55–70. [Google Scholar] [CrossRef]
- Scherer, C.; Emberger-Klein, A.; Menrad, K. Biogenic product alternatives for children: Consumer preferences for a set of sand toys made of bio-based plastic. Sustain. Prod. Consum. 2017, 10, 1–14. [Google Scholar] [CrossRef]
- Jankalová, M.; Jankal, R. Sustainability assessment according to the selected business excellence models. Sustainability 2018, 10, 3784. [Google Scholar] [CrossRef]
- Kamali, M.; Hewage, K.; Milani, A.S. Life cycle sustainability performance assessment framework for residential modular buildings: Aggregated sustainability indices. Build. Environ. 2018, 138, 21–41. [Google Scholar] [CrossRef]
- Peano, C.; Tecco, N.; Dansero, E.; Girgenti, V.; Sottile, F. Evaluating the sustainability in complex agri-food systems: The SAEMETH framework. Sustainability 2015, 7, 6721–6741. [Google Scholar] [CrossRef]
- Mili, S.; Martínez-Vega, J. Accounting for regional heterogeneity of agricultural sustainability in Spain. Sustainability 2019, 11, 299. [Google Scholar] [CrossRef]
- Atilgan, B.; Azapagic, A. An integrated life cycle sustainability assessment of electricity generation in Turkey. Energy Policy 2016, 93, 168–186. [Google Scholar] [CrossRef]
- Saad, M.H.; Nazzal, M.A.; Darras, B.M. A general framework for sustainability assessment of manufacturing processes. Ecol. Indic. 2019, 97, 211–224. [Google Scholar] [CrossRef]
- UNEP-SETAC. Guidelines for Social Life Cycle Assessment of Products, Social and Socio-Economic LCA Guidelines Complementing Environmental LCA and Life Cycle Costing, Contributing to the Full Assessment of Goods and Services within the Context of Sustainable Development; UNEP—United Nations Environment Programme and SETAC—Society of Environmental Toxicology and Chemistry: Brussels, Belgium, 2009. [Google Scholar]
- UNEP. Guidelines for Social Life Cycle Assessment of Products and Organizations; United Nations Environment Programme: Nairobi, Kenya, 2020. [Google Scholar]
- UN. Sustainable Development Goals. Available online: https://sdgs.un.org/goals (accessed on 20 January 2020).
- Fauzi, R.T.; Lavoie, P.; Sorelli, L.; Heidari, M.D.; Amor, B. Exploring the current challenges and opportunities of life cycle sustainability assessment. Sustainability 2019, 11, 636. [Google Scholar] [CrossRef]
- GRI. G4 Sustainability Reporting Guidelines: Reporting Principles and Standard Disclosure; Global Reporting Initiative: Amsterdam, The Netherlands, 2013. [Google Scholar]
- SAI. Social Accountability International. Available online: http://www.sa-intl.org (accessed on 23 February 2021).
- ISO. ISO 26000: Guidance on Social Responsibility. Available online: www.iso.org (accessed on 23 February 2021).
- Norris, C.B.; Norris, G.A.; Aulisio, D. Efficient assessment of social hotspots in the supply chains of 100 product categories using the social hotspots database. Sustainability 2014, 6, 6973–6984. [Google Scholar] [CrossRef]
- Ilinitch, A.Y.; Soderstrom, N.S.; Thomas, T.E. Measuring corporate environmental performance. J. Account. Public Policy 1998, 17, 383–408. [Google Scholar] [CrossRef]
- Gadiesh, O.; Gilbert, J.L. Profit pools: A fresh look at strategy. Harv. Bus. Rev. 1998, 76, 139–148. [Google Scholar]
- Clift, R.; Wright, L. Relationships between environmental impacts and added value along the supply chain. Technol. Forecast. Soc. Chang. 2000, 65, 281–295. [Google Scholar] [CrossRef]
- Hunkeler, D.; Lichtenvort, K.; Rebitzer, G. Environmental Life Cycle Costing, 1st ed.; CRC Press: Boca Raton, FL, USA, 2008. [Google Scholar]
- Moreau, V.; Weidema, B.P. The computational structure of environmental life cycle costing. Int. J. Life Cycle Assess. 2015, 20, 1359–1363. [Google Scholar] [CrossRef]
- Gbededo, M.A.; Liyanage, K.; Garza-Reyes, J.A. Towards a life cycle sustainability analysis: A systematic review of approaches to sustainable manufacturing. J. Clean. Prod. 2018, 184, 1002–1015. [Google Scholar] [CrossRef]
- Jawahir, I.S.; Dillon, O.W.; Rouch, K.E.; Joshi, K.J.; Venkatachalam, A.; Jaafar, I.H. Total life-cycle considerations in product design for sustainability: A framework for comprehensive evaluation. In Proceedings of the 10th International Research/Expert Conference Trends in the Development of Machinery and Associated Technology TMT 2006, Barcelona-Lloret de Mar, Spain, 11–15 September 2006. [Google Scholar]
- Choi, A.; Kaebernick, H.; Lai, W. Manufacturing processes modelling for environmental impact assessment. J. Mater. Process. Technol. 1997, 70, 231–238. [Google Scholar] [CrossRef]
- Muñoz, I.; Gazulla, C.; Bala, A.; Puig, R.; Fullana, P. LCA and ecodesign in the toy industry: Case study of a teddy bear incorporating electric and electronic components. Int. J. Life Cycle Assess. 2009, 14, 64–72. [Google Scholar] [CrossRef]
- Wilkinson, C.F.; Lamb, J.C. The potential health effects of phthalate esters in children’s toys: A review and risk assessment. Regul. Toxicol. Pharmacol. 1999, 30, 140–155. [Google Scholar] [CrossRef] [PubMed]
- Landrigan, P.J.; A Kimmel, C.; Correa, A.; Eskenazi, B. Children’s health and the environment: Public health issues and challenges for risk assessment. Environ. Health Perspect. 2004, 112, 257–265. [Google Scholar] [CrossRef] [PubMed]
- Becker, M.; Edwards, S.; Massey, R.I. Toxic chemicals in toys and children’s products: Limitations of current responses and recommendations for government and industry. Environ. Sci. Technol. 2010, 44, 7986–7991. [Google Scholar] [CrossRef]
- Shin, K.L.F.; Colwill, J. An integrated tool to support sustainable toy design and manufacture. Prod. Manuf. Res. 2017, 5, 191–209. [Google Scholar] [CrossRef]
- Zamagni, A. Life cycle sustainability assessment. Int. J. Life Cycle Assess. 2012, 17, 373–376. [Google Scholar] [CrossRef]
- Kloepffer, W. Life cycle sustainability assessment of products. Int. J. Life Cycle Assess. 2008, 13, 89–95. [Google Scholar] [CrossRef]
- International Organization for Standardization. Environmental Management: Life Cycle Assessment; Principles and Framework; ISO: Geneva, Switzerland, 2006. [Google Scholar]
- International Organization for Standardization. Environmental Management: Life Cycle Assessment: Requirements and Regulations; ISO: Geneva, Switzerland, 2006. [Google Scholar]
- Liu, S.; Qian, S. Evaluation of social life-cycle performance of buildings: Theoretical framework and impact assessment approach. J. Clean. Prod. 2019, 213, 792–807. [Google Scholar] [CrossRef]
- Heijungs, R.; Settanni, E.; Guinée, J. Toward a computational structure for life cycle sustainability analysis: Unifying LCA and LCC. Int. J. Life Cycle Assess. 2012, 18, 1722–1733. [Google Scholar] [CrossRef]
- Bhatt, A.; Bradford, A.; Abbassi, B.E. Cradle-to-grave life cycle assessment (LCA) of low-impact-development (LID) technologies in Southern Ontario. J. Environ. Manag. 2019, 231, 98–109. [Google Scholar] [CrossRef] [PubMed]
- Guinée, J.B.; Heijungs, R.; Huppes, G.; Kleijn, R.; De Koning, A.; van Oers, L.; Wegener Sleeswijk, A.; Suh, S.; Udo de Haes, H.A.; de Bruijn, H.; et al. Life Cycle Assessment; An Operational Guide to the ISO standards; Part 1 and 2: Scientific Background; Ministry of Housing, Spatial Planning and Environment (VROM) and Centre of Environmental Science (CML): Den Haag and Leiden, The Netherlands, 2001. [Google Scholar]
- Sleeswijk, A.W.; van Oers, L.F.; Guinée, J.B.; Struijs, J.; Huijbregts, M.A. Normalisation in product life cycle assessment: An LCA of the global and European economic systems in the year 2000. Sci. Total. Environ. 2008, 390, 227–240. [Google Scholar] [CrossRef]
- Thinkstep. CML 2001. Available online: http://www.gabi-software.com/support/gabi/gabi-lcia-documentation/cml-2001/ (accessed on 13 April 2019).
- Ecoinvent 2019; Technoparkstrasse 1: Zurich, Switzerland, 2019.
- GreenDelta. openLCA V1.10.3; GreenDelta: Berlin, Germany, 2020. [Google Scholar]
- iPoint-Systems. Life Cycle Impact Assessment—Which Are the LCIA Indicator Sets Most Widely Used by Practitioners? Available online: https://www.ipoint-systems.com/blog/lcia-indicator/ (accessed on 3 October 2020).
- Stranddorf, H.K.; Hoffmann, L.; Schmidt, A. Impact Categories, Normalisation and Weighting in LCA. Update on Selected EDIP97-Data; Danish Ministry of the Environment, Environmental Protection Agency: Odense, Denmark, 2005. [Google Scholar]
- Klöpffer, W.; Grahl, B. Life Cycle Assessment (LCA): A Guide to Best Practice; Wiley-VCH: Weinheim, Germany, 2014. [Google Scholar]
- Vidergar, P.; Perc, M.; Kovačič Lukman, R. A survey of the life cycle assessment of food supply chains. J. Clean. Prod. 2021, 286. [Google Scholar] [CrossRef]
- Greendelta. Soca v.1 Add-On—Adding Social Impact Information to Ecoinvent. Description of Methodology to Map Social Impact Information from PSILCA v.1 to Ecoinvent v. 3.3. Available online: https://nexus.openlca.org/database/soca (accessed on 5 January 2021).
- Di Cesare, S.; Silveri, F.; Sala, S.; Petti, L. Positive impacts in social life cycle assessment: State of the art and the way forward. Int. J. Life Cycle Assess. 2018, 23, 406–421. [Google Scholar] [CrossRef]
- Jørgensen, A.; Le Bocq, A.; Nazarkina, L.; Hauschild, M. Methodologies for social life cycle assessment. Int. J. Life Cycle Assess. 2007, 13, 96–103. [Google Scholar] [CrossRef]
- Florindo, T.J.; Florindo, G.I.B.D.M.; Talamini, E.; Da Costa, J.S.; Ruviaro, C.F. Carbon footprint and life cycle costing of beef cattle in the Brazilian Midwest. J. Clean. Prod. 2017, 147, 119–129. [Google Scholar] [CrossRef]
- Ben Hassen, M.; Monaco, F.; Facchi, A.; Romani, M.; Valè, G.; Sali, G. Economic performance of traditional and modern rice varieties under different water management systems. Sustainability 2017, 9, 347. [Google Scholar] [CrossRef]
- Ferrero, A. Ecological and economic sustainability of rice cultivation in Europe and the Mediterranean region. In Proceedings of the 1st Asia Workshop on Sustainable Resource Management and Policy Options for Rice Ecosystems (SUMAPOL 2005), Hangzhou, China, 11–14 May 2005. [Google Scholar]
- Yılmaz, Ș.G.; Gül, M. Evaluation of cotton production costs and profitability level in agricultural farms: The case of Antalya province. Ziraat Fakültesi Dergisi, Mustafa Kemal Üniversitesi 2015, 20, 27–41. [Google Scholar]
- Fairbrother, A.; Hope, B. Encyclopedia of Toxicology, 2nd ed.; Wexler, P., Ed.; Elsevier Ireland Limited: Limerick, Ireland, 2005. [Google Scholar]
- Fibre2Fashion. Viscose Filament Yarn Market Report and Price Trend, VFY Highlights from 21 December 2020–1 January 2021. Available online: https://www.fibre2fashion.com/market-intelligence/textile-market-watch/viscose-filament-yarn-price-trends-industry-reports/13/ (accessed on 22 March 2021).
- Gusmerotti, N.M.; Testa, F.; Corsini, F.; Pretner, G.; Iraldo, F. Drivers and approaches to the circular economy in manufacturing firms. J. Clean. Prod. 2019, 230, 314–327. [Google Scholar] [CrossRef]
- Bond, A.; Morrison-Saunders, A.N.; Pope, J. Sustainability assessment: The state of the art. Impact Assess. Proj. Apprais. 2012, 30, 53–62. [Google Scholar] [CrossRef]
- Ali, S.H.; Oliveira, J.A.P.D. Pollution and economic development: An empirical research review. Environ. Res. Lett. 2018, 13, 123003. [Google Scholar] [CrossRef]
- Kravchenko, M.; Pigosso, D.C.A.; McAloone, T.C. Developing a tool to support decisions in sustainability-related trade-off situations: Understanding needs and criteria. In Proceedings of the Design Society: DESIGN Conference; Cambridge University Press: Cambridge, UK, 2020. [Google Scholar]
- Ma, X.; Jiang, Q. How to balance the trade-off between economic development and climate change? Sustainability 2019, 11, 1638. [Google Scholar] [CrossRef]
- Prendeville, S.M.; O’Connor, F.; Bocken, N.M.; Bakker, C. Uncovering ecodesign dilemmas: A path to business model innovation. J. Clean. Prod. 2017, 143, 1327–1339. [Google Scholar] [CrossRef]
- Björklund, M.; Forslund, H. Challenges Addressed by Swedish third-party logistics providers conducting sustainable logistics business cases. Sustainability 2019, 11, 2654. [Google Scholar] [CrossRef]
- Humpenöder, F.; Popp, A.; Bodirsky, B.L.; Weindl, I.; Biewald, A.; Lotze-Campen, H.; Dietrich, J.P.; Klein, D.; Kreidenweis, U.; Müller, C.; et al. Large-scale bioenergy production: How to resolve sustainability trade-offs? Environ. Res. Lett. 2017, 13, 024011. [Google Scholar] [CrossRef]
Publisher’s Note: MDPI stays neutral with regard to jurisdictional claims in published maps and institutional affiliations. |
© 2021 by the authors. Licensee MDPI, Basel, Switzerland. This article is an open access article distributed under the terms and conditions of the Creative Commons Attribution (CC BY) license (https://creativecommons.org/licenses/by/4.0/).