
Cross-Country Potentials and Advantages in Trade in Fish and Seafood Products in the RCEP Member States


Abstract
1. Introduction
2. Materials and Methods
2.1. Countries, Products, and Data
2.2. Study Flow Algorithm
2.3. Trade Potential
2.4. Comparative Advantage
2.5. Relative Trade Advantage
2.6. Overwriting Advantages
2.7. Matching Advantages and Potentials
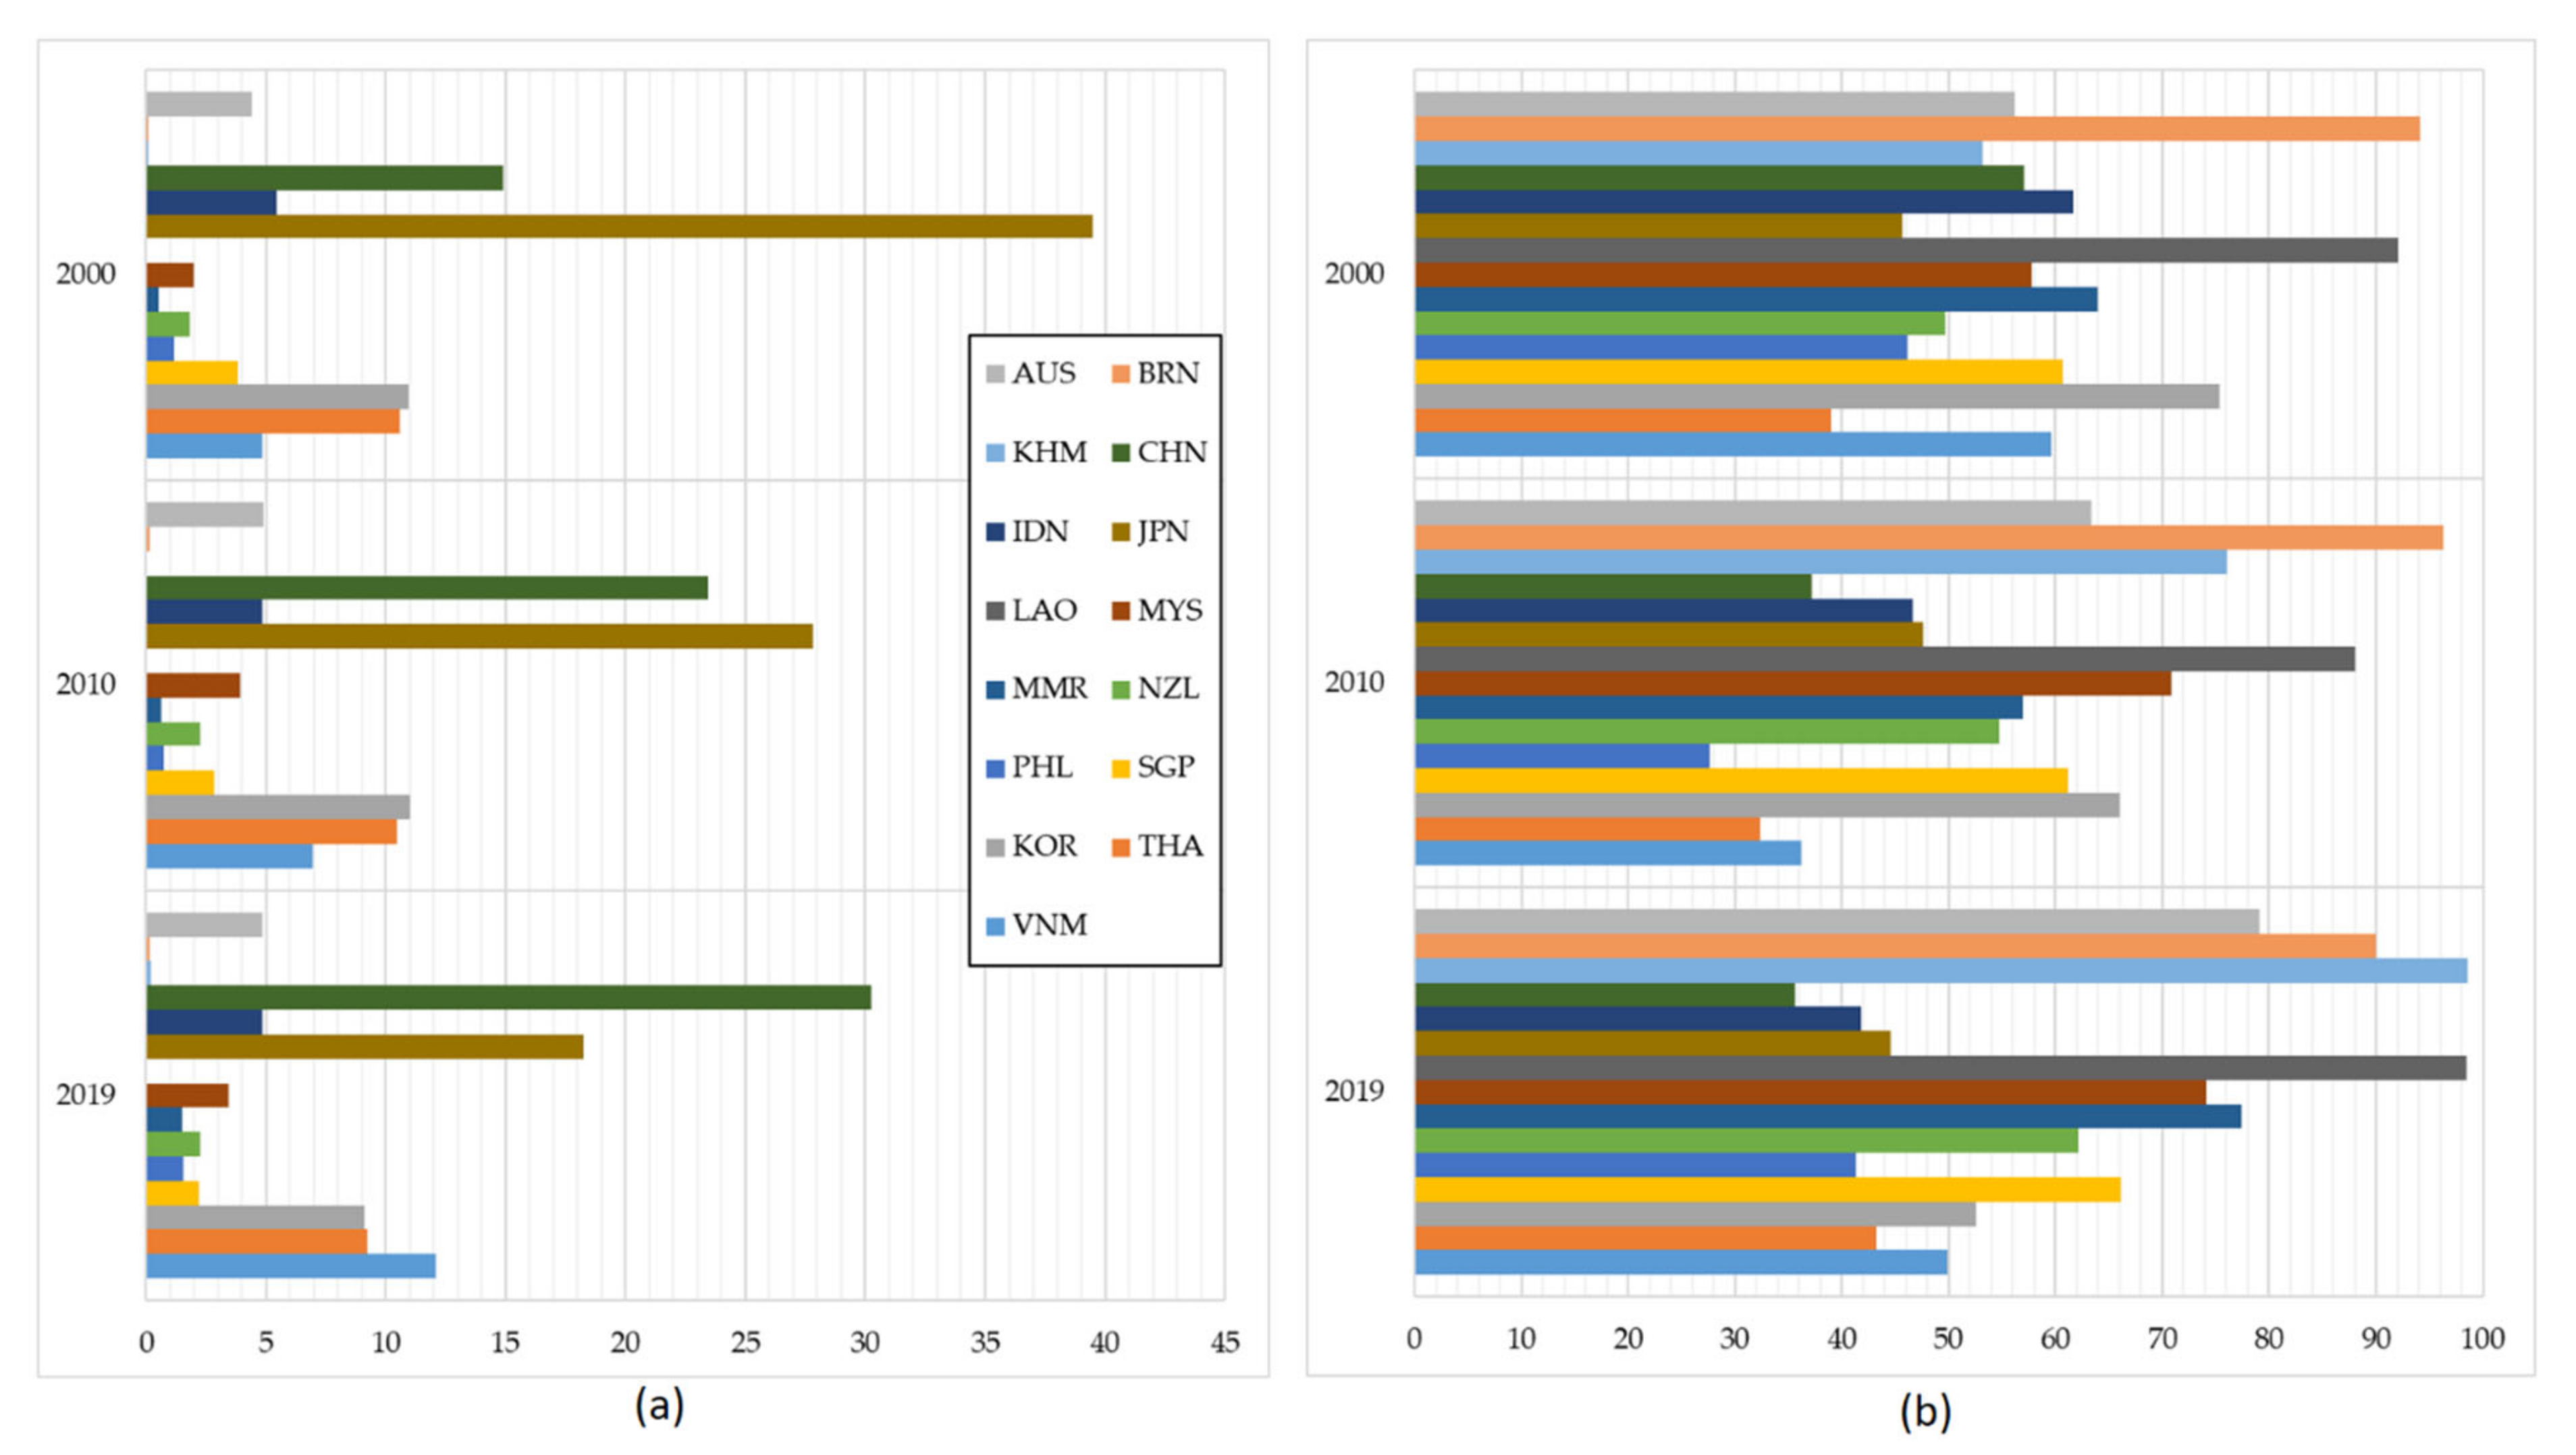
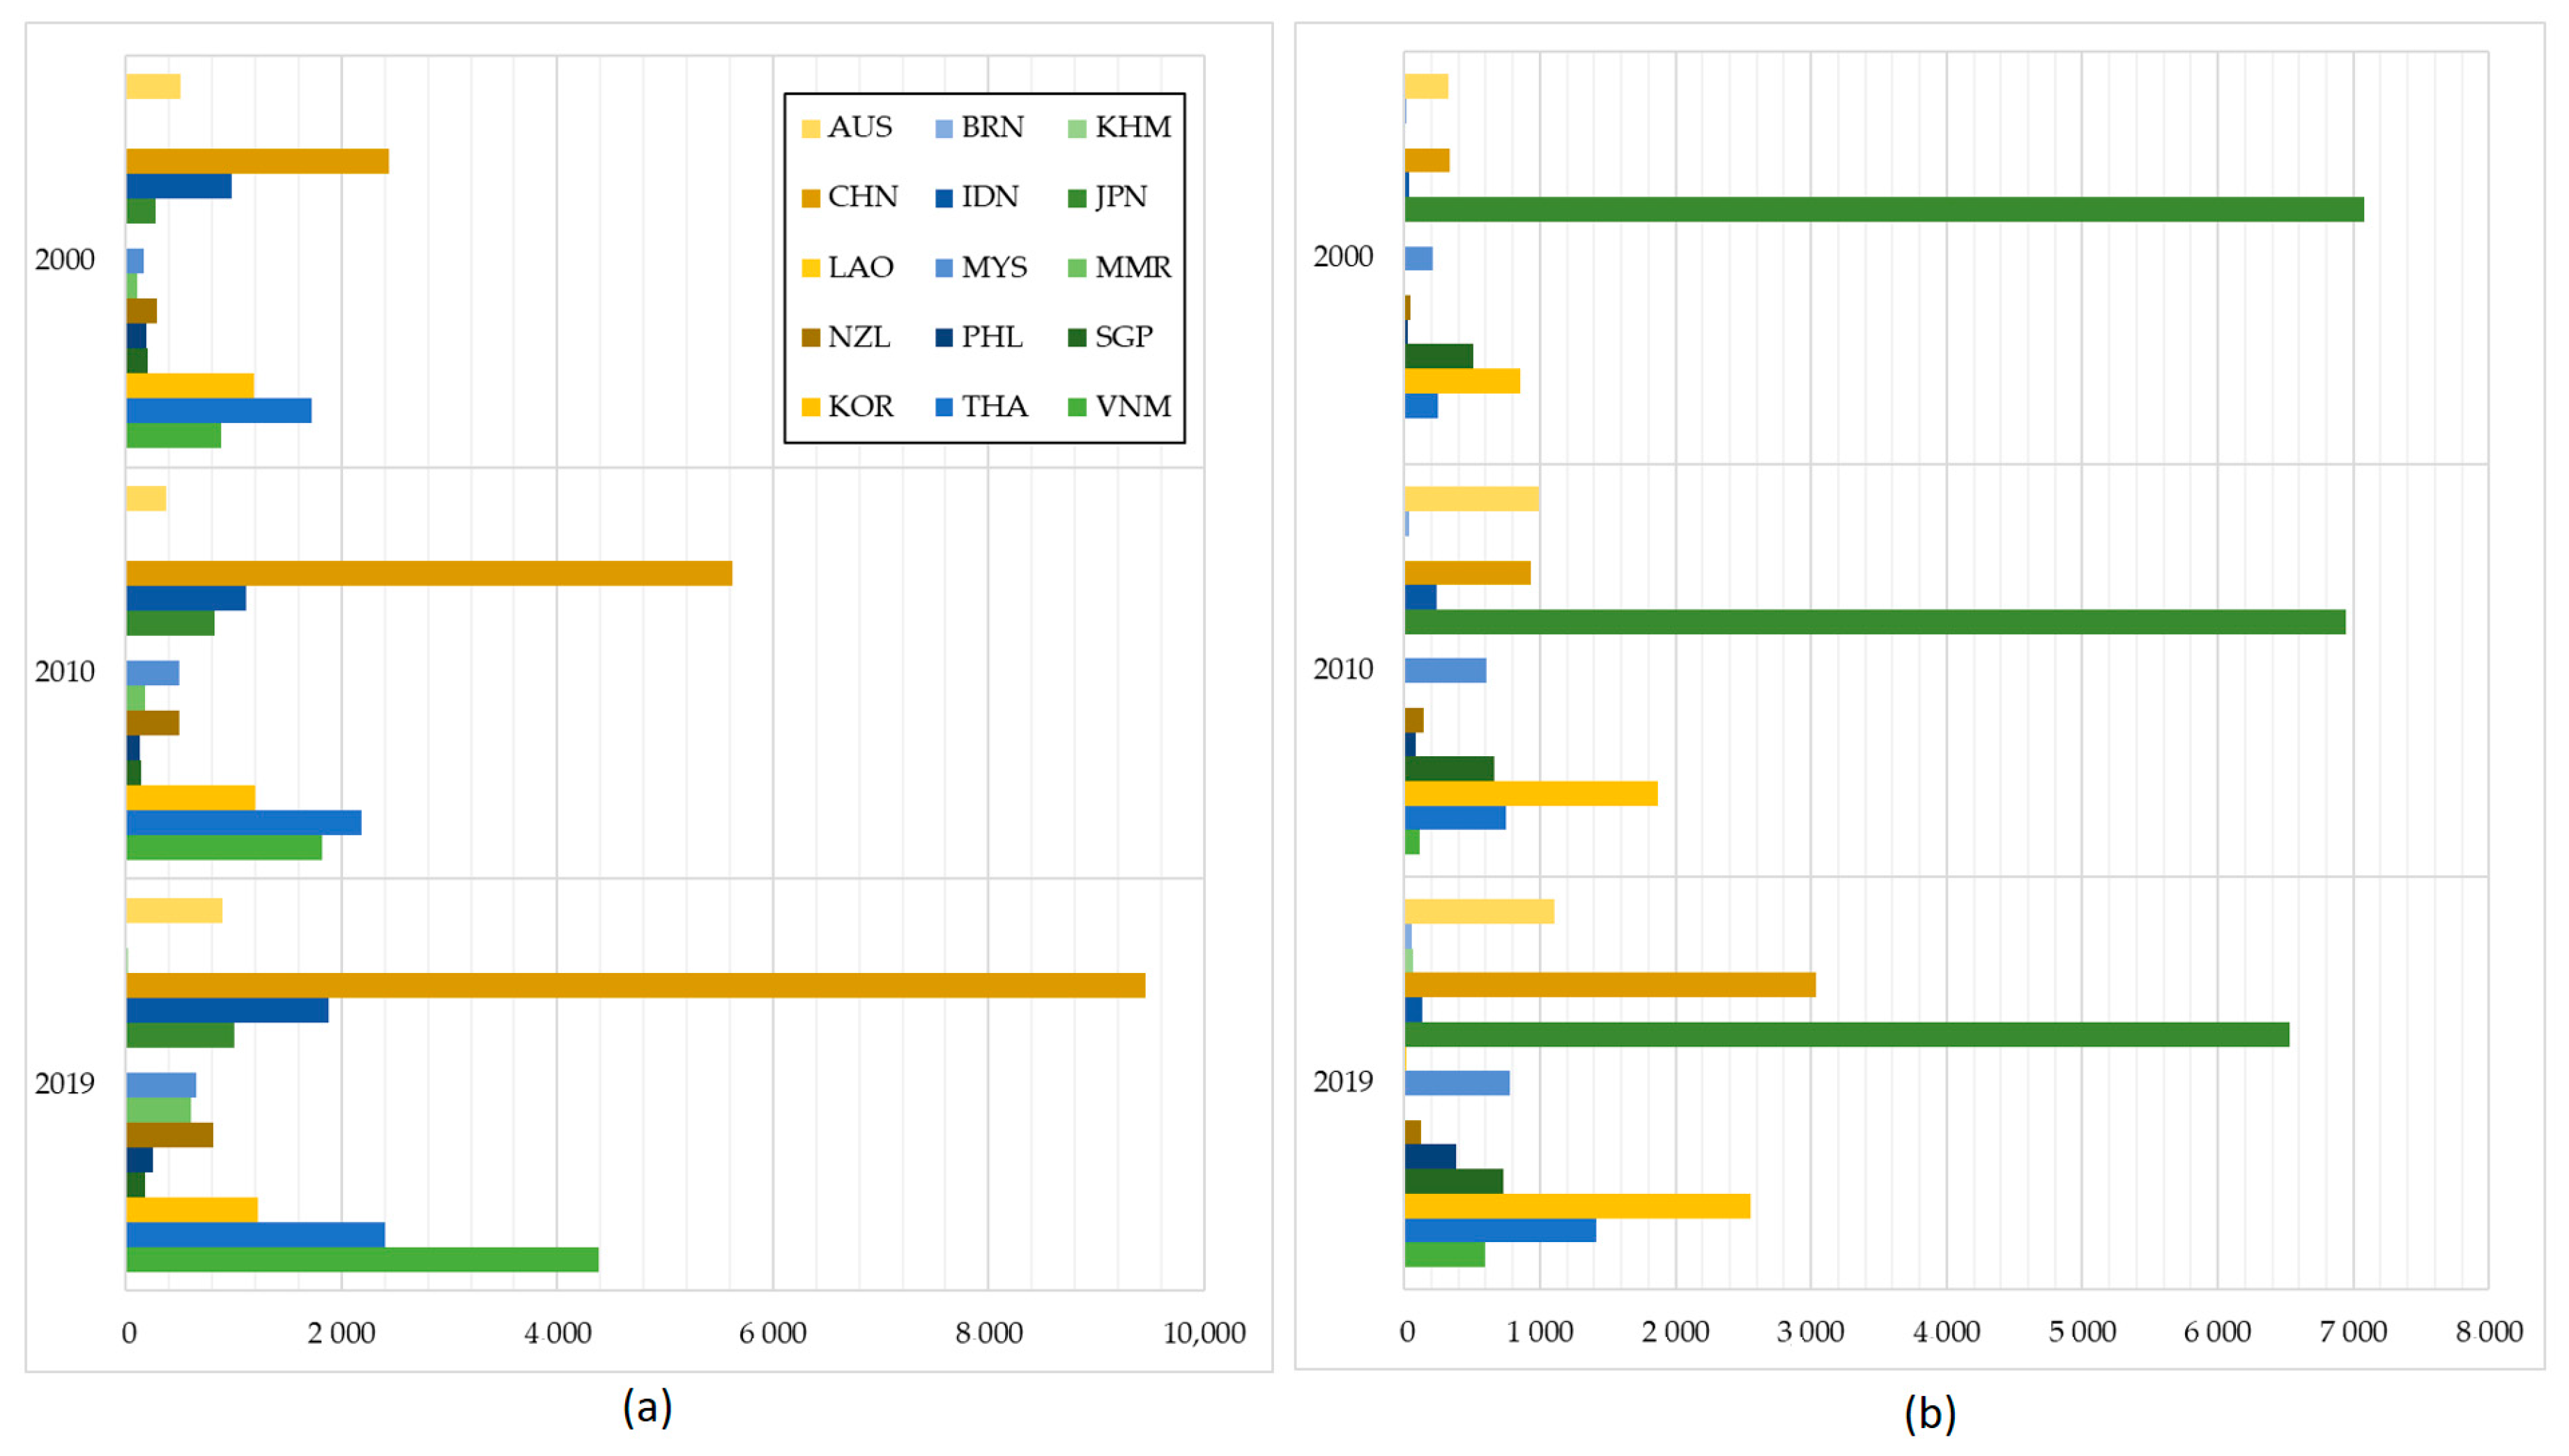
3. Results
3.1. Actual and Potential Trade
3.2. Three Types of Advantages
3.3. Advantages and Potentials
4. Discussion
4.1. Optimization of Trade Potentials and Advantages
- Advantageous destinations/products: high trade potential + strong, or average, or weak advantage; trade potential above average + strong, or average, or weak advantage.
- Disadvantageous destinations/products: trade potential above average + disadvantage; trade potential below average + weak advantage or disadvantage; low trade potential + weak advantage or disadvantage.
- Neutral destinations/products: high trade potential + disadvantage; trade potential below average + strong or average advantage; low trade potential + strong or average advantage.
- Major traders have made good use of their potentials and advantages in trade with other countries of the region, as well as between themselves. There are untapped advantages in trade in high-priced fishery products with smaller economies (bivalves and fresh and frozen fish (p2) and prepared and preserved fishery products (p5) (further discussed in Section 4.2).
- Countries that specialize in fishery obtain the strongest advantages in trade with higher-income RCEP economies to the extent that they have become overdependent on Chinese, Japanese, and Korean markets. Group 2 economies can gain from the diversification of the intra-RCEP trade by increasing exports of fresh, chilled, and frozen fish (p2) and crustaceans, mollusks, and aquatic invertebrates (p4) all over the region (further discussed in Section 4.3).
- Countries that make a minor contribution to the intra-RCEP trade in fish possess weaker advantages compared to both Group 1 and Group 2 traders. There is room to expand trade with the smallest RCEP member states, as well as to increase supplies of processed fishery products to higher-income economies (further discussed in Section 4.4).
- Smallest traders obtain the weakest advantages, while the fishery sector plays a crucial role in the economic development of and social stability in the poor rural and coastal communities. For these countries, the mismatches between high untapped trade potentials and disadvantages or weak competitive advantages are particularly common (further discussed in Section 4.5).
4.2. Major Traders: China, Japan, South Korea
4.3. High Specialization in Fish and Seafood Trade: Myanmar, Thailand, Vietnam
4.4. Second-Tier Traders: Australia, Indonesia, Malaysia, New Zealand, Singapore
4.5. Small Traders: Brunei Darussalam, Cambodia, Lao PDR, Philippines
5. Conclusions
- Group 1: major fish traders (China, Japan, and South Korea) have made good use of their potentials and advantages in trade with other countries of the region, as well as between themselves. Still, there are advantages in trade in high-priced fishery products with Group 3 countries (bivalves and fresh and frozen fish (p2) from China and South Korea to Australia and Singapore and prepared and preserved fishery products (p5) from Japan to Australia and New Zealand) and Group 4 economies (all four categories of fishery products to Brunei Darussalam, Cambodia, Lao PDR, and Philippines).
- Group 2: Myanmar, Thailand, and Vietnam have the RCEP’s highest share of fishery products in trade turnover and enjoy the strongest advantages in trade with higher-income Group 1 countries. Group 2 countries can further gain from the intra-RCEP trade by increasing exports of fresh, chilled, and frozen fish (p2) and crustaceans, mollusks, and aquatic invertebrates (p4) all over the region. However, we underline a growing dependence of Group 2 countries on Chinese, Japanese, and Korean markets which could transform into a threat to food security for the former: by exporting higher-value fishery products to more developed economies, Group 2 countries import lower-priced seafood products of lower nutritional value and quality for domestic consumption.
- Group 3: Australia, Indonesia, Malaysia, New Zealand, and Singapore have a low contribution to the intra-RCEP trade in fish and possess weaker advantages in trade with both Group 1 and Group 2 countries. For them, the most promising trading destinations are smaller Group 4 economies, such as Brunei Darussalam, Cambodia, Lao PDR, and Philippines. Also, there is a potential to increase supplies of high-quality fishery products from Australia and New Zealand to Group 1 countries.
- Group 4: the RCEP’s smallest traders (Brunei Darussalam, Cambodia, Lao PDR, and Philippines) are the least advantageous countries in the region in terms of fish trade. At the same time, the fishery sector plays a crucial role in supporting livelihood, providing employment, and ensuring food security in the poor rural and coastal communities. For Group 4 countries, we recorded the highest frequency of mismatches between high untapped trade potentials and disadvantages or weak competitive advantages. Still, our findings show an opportunity to increase exports of chilled and frozen fish (p2) from Philippines and Cambodia to Australia, Singapore, and Thailand, crustaceans and mollusks (p4) from Brunei Darussalam to Australia, Japan, and South Korea, and fresh fish (p2) from Lao PDR to other Group 4 countries.
Author Contributions
Funding
Institutional Review Board Statement
Informed Consent Statement
Data Availability Statement
Conflicts of Interest
Appendix A

| Countries | AUS | BRN | KHM | CHN | IDN | JPN | LAO | MYS | MMR | NZL | PHL | SGP | KOR | THA | VNM | RCEP |
|---|---|---|---|---|---|---|---|---|---|---|---|---|---|---|---|---|
| AUS | 0.011 * | 0.009 * | 0.614 ** | 0.348 * | 0.805 ** | 0.002 * | 0.109 * | 1.736 *** | 1.544 *** | 0.031 * | 0.069 * | 0.014 * | 0.512 * | 5.054 *** | 0.411 * | |
| BRN | 0.432 * | 0.004 * | 1.291 *** | 0.325 * | 0.212 * | 0.001 * | 15.987 **** | 0.273 * | 0.248 * | 0.168 * | 3.961 *** | 0.074 * | 1.063 ** | 0.640 ** | 1.541 *** | |
| KHM | 0.110 * | 0.001 * | 0.675 ** | 0.005 * | 0.236 * | 0.004 * | 0.014 * | 0.001 * | 0.029 * | 0.002 * | 0.077 * | 0.128 * | 3.718 *** | 1.711 *** | 0.380 * | |
| CHN | 0.385 * | 0.053 * | 0.202 * | 11.905 **** | 1.202 *** | 0.346 * | 1.965 *** | 5.878 *** | 2.387 *** | 2.263 *** | 0.334 * | 2.373 *** | 1.066 ** | 1.899 *** | 1.318 *** | |
| IDN | 0.046 * | 0.010 * | 0.001 * | 0.249 * | 1.213 *** | 0.004 * | 0.180 * | 0.169 * | 0.015 * | 0.068 * | 0.182 * | 0.037 * | 0.125 * | 0.706 ** | 0.240 * | |
| JPN | 0.419 * | 0.011 * | 0.078 * | 6.321 *** | 6.364 *** | 0.077 * | 0.156 * | 11.029 **** | 1.363 *** | 1.570 *** | 0.078 * | 1.542 *** | 2.124 *** | 8.214 **** | 1.920 *** | |
| LAO | 0.157 * | 0.001 * | 0.415 * | 15.418 **** | 0.433 * | 6.527 *** | 0.037 * | 0.001 * | 1.350 *** | 0.001 * | 0.109 * | 0.983 ** | 14.498 **** | 13.462 **** | 7.564 *** | |
| MYS | 0.168 * | 0.220 * | 0.005 * | 0.634 ** | 1.293 *** | 0.261 * | 0.001 * | 5.353 *** | 0.081 * | 0.039 * | 0.380 * | 0.087 * | 0.395 * | 0.663 ** | 0.363 * | |
| MMR | 0.028 * | 0.003 * | 0.001 * | 0.412 * | 0.011 * | 0.228 * | 0.001 * | 0.108 * | 0.001 * | 0.001 * | 0.107 * | 0.012 * | 0.397 * | 0.022 * | 0.127 * | |
| NZL | 0.460 * | 0.011 * | 0.008 * | 0.638 ** | 0.015 * | 0.276 * | 0.005 * | 0.018 * | 0.016 * | 0.024 * | 0.036 * | 0.088 * | 0.107 * | 0.083 * | 0.175 * | |
| PHL | 0.015 * | 0.005 * | 0.001 * | 0.458 * | 0.070 * | 1.830 *** | 0.001 * | 0.018 * | 0.008 * | 0.022 * | 0.086 * | 0.169 * | 0.060 * | 0.200 * | 0.195 * | |
| SGP | 0.304 * | 0.301 * | 0.023 * | 0.939 ** | 0.847 ** | 0.510 * | 0.003 * | 1.462 *** | 5.020 *** | 0.167 * | 0.132 * | 0.116 * | 0.566 ** | 0.731 ** | 0.560 ** | |
| KOR | 0.010 * | 0.003 * | 0.046 * | 1.350 *** | 0.393 * | 2.038 *** | 0.010 * | 0.058 * | 0.585 ** | 0.743 ** | 0.288 * | 0.025 * | 0.281 * | 2.845 *** | 0.629 ** | |
| THA | 0.477 * | 0.049 * | 4.263 *** | 0.331 * | 1.393 *** | 1.683 *** | 12.342 **** | 0.219 * | 11.340 **** | 0.605 ** | 0.256 * | 0.144 * | 0.133 * | 1.426 *** | 0.526 * | |
| VNM | 0.194 * | 0.035 * | 1.659 *** | 0.549 ** | 0.285 * | 0.804 ** | 0.201 * | 0.115 * | 0.572 ** | 0.128 * | 0.459 * | 0.154 * | 0.306 * | 0.174 * | 0.375 * |
| Countries | AUS | BRN | KHM | CHN | IDN | JPN | LAO | MYS | MMR | NZL | PHL | SGP | KOR | THA | VNM | RCEP |
|---|---|---|---|---|---|---|---|---|---|---|---|---|---|---|---|---|
| AUS | 0.005 * | 0.013 * | 0.202 * | 0.227 * | 4.123 *** | 0.001 * | 0.025 * | 1.759 *** | 3.707 *** | 0.008 * | 0.024 * | 0.010 * | 0.061 * | 0.426 ** | 0.302 * | |
| BRN | 0.253 * | 0.011 * | 1.488 *** | 0.544 ** | 0.283 * | 0.001 * | 26.079 **** | 0.106 * | 0.445 ** | 0.040 * | 5.688 *** | 0.019 * | 0.465 ** | 1.488 *** | 2.033 *** | |
| KHM | 0.017 * | 0.002 * | 0.199 * | 0.005 * | 0.178 * | 0.024 * | 0.022 * | 0.001 * | 0.001 * | 0.001 * | 0.157 * | 0.015 * | 2.422 *** | 1.187 *** | 0.221 * | |
| CHN | 0.179 * | 0.039 * | 0.148 * | 26.435 **** | 1.059 *** | 0.004 * | 0.489 ** | 3.359 *** | 2.920 *** | 3.265 *** | 0.172 * | 2.705 *** | 0.357 ** | 1.285 *** | 1.057 *** | |
| IDN | 0.079 * | 0.013 * | 0.003 * | 0.321 * | 0.498 ** | 0.012 * | 0.234 * | 0.111 * | 0.031 * | 0.069 * | 0.435 ** | 0.054 * | 0.175 * | 0.430 ** | 0.234 * | |
| JPN | 0.862 *** | 0.014 * | 0.154 * | 2.497 *** | 2.655 *** | 0.001 * | 0.087 * | 1.729 *** | 6.033 *** | 0.853 *** | 0.126 * | 1.616 *** | 0.875 *** | 1.773 *** | 1.236 *** | |
| LAO | 0.001 * | 0.001 * | 0.839 *** | 0.280 * | 0.224 * | 0.007 * | 0.017 * | 0.001 * | 0.001 * | 0.001 * | 0.040 * | 0.226 * | 12.857 *** | 6.706 *** | 2.562 *** | |
| MYS | 0.051 * | 0.131 * | 0.018 * | 0.802 *** | 1.407 *** | 0.311 * | 0.001 * | 5.070 *** | 0.133 * | 0.012 * | 0.543 ** | 0.035 * | 0.888 *** | 0.504 ** | 0.467 ** | |
| MMR | 0.030 * | 0.004 * | 0.001 * | 0.477 ** | 0.003 * | 0.027 * | 0.001 * | 0.127 * | 0.001 * | 0.001 * | 0.137 * | 0.013 * | 0.618 ** | 0.003 * | 0.121 * | |
| NZL | 1.099 *** | 0.013 * | 0.001 * | 0.350 * | 0.013 * | 0.430 ** | 0.001 * | 0.012 * | 0.009 * | 0.020 * | 0.017 * | 0.078 * | 0.037 * | 0.041 * | 0.170 * | |
| PHL | 0.010 * | 0.001 * | 0.001 * | 1.030 *** | 0.128 * | 2.460 *** | 0.001 * | 0.013 * | 0.004 * | 0.058 * | 0.062 * | 0.150 * | 0.108 * | 0.468 ** | 0.302 * | |
| SGP | 0.105 * | 0.303 * | 0.095 * | 0.390 ** | 0.855 *** | 0.689 ** | 0.002 * | 0.772 *** | 5.063 *** | 0.112 * | 0.057 * | 0.133 * | 0.335 * | 0.647 ** | 0.425 ** | |
| KOR | 0.017 * | 0.001 * | 0.014 * | 1.849 *** | 0.308 * | 1.965 *** | 0.011 * | 0.014 * | 0.452 ** | 7.597 *** | 0.133 * | 0.041 * | 0.195 * | 1.109 *** | 0.690 ** | |
| THA | 0.053 * | 0.006 * | 2.024 *** | 0.415 ** | 1.680 *** | 3.064 *** | 8.999 *** | 0.172 * | 29.242 **** | 0.362 ** | 0.240 * | 0.102 * | 0.325 * | 0.710 ** | 0.562 ** | |
| VNM | 0.311 * | 0.073 * | 6.005 *** | 0.503 ** | 0.190 * | 0.479 ** | 0.285 * | 0.129 * | 0.046 * | 0.146 * | 0.485 ** | 0.246 * | 0.187 * | 0.126 * | 0.277 * |
| Countries | AUS | BRN | KHM | CHN | IDN | JPN | LAO | MYS | MMR | NZL | PHL | SGP | KOR | THA | VNM | RCEP |
|---|---|---|---|---|---|---|---|---|---|---|---|---|---|---|---|---|
| AUS | 0.002 * | 0.727 ** | 0.514 * | 0.138 * | 1.830 *** | 0.001 * | 0.298 * | 0.076 * | 1.696 *** | 4.387 *** | 0.432 * | 0.309 * | 0.324 * | 0.394 * | 0.502 * | |
| BRN | 0.826 ** | 0.001 * | 1.657 *** | 0.370 * | 0.014 * | 0.001 * | 4.130 *** | 0.001 * | 0.333 * | 0.296 * | 12.457 *** | 0.044 * | 6.922 *** | 1.072 *** | 2.009 *** | |
| KHM | 0.124 * | 0.001 * | 0.008 * | 0.006 * | 0.002 * | 0.001 * | 0.001 * | 0.001 * | 0.001 * | 0.001 * | 0.042 * | 0.009 * | 5.865 *** | 0.099 * | 0.107 * | |
| CHN | 0.036 * | 0.016 * | 0.001 * | 0.346 * | 5.812 *** | 0.001 * | 0.056 * | 2.074 *** | 0.047 * | 3.133 *** | 0.221 * | 2.036 *** | 0.683 ** | 9.833 *** | 1.735 *** | |
| IDN | 0.024 * | 0.001 * | 0.048 * | 0.161 * | 3.680 *** | 0.001 * | 0.164 * | 1.299 *** | 0.189 * | 0.264 * | 0.244 * | 0.145 * | 0.613 ** | 2.639 *** | 0.600 ** | |
| JPN | 0.361 * | 0.001 * | 0.001 * | 15.052 **** | 2.231 *** | 0.001 * | 0.011 * | 1.990 *** | 0.958 ** | 2.437 *** | 0.417 * | 1.255 *** | 3.446 *** | 1.083 *** | 2.566 *** | |
| LAO | 0.001 * | 0.001 * | 0.001 * | 10.305 *** | 0.002 * | 0.001 * | 0.150 * | 0.001 * | 0.001 * | 0.001 * | 2.962 *** | 4.005 *** | 23.813 **** | 27.800 **** | 4.931 *** | |
| MYS | 0.099 * | 0.063 * | 0.001 * | 0.100 * | 0.893 ** | 0.039 * | 0.001 * | 12.883 *** | 0.059 * | 3.525 *** | 0.551 * | 0.012 * | 3.094 *** | 2.515 *** | 0.645 ** | |
| MMR | 0.018 * | 0.001 * | 0.001 * | 0.828 ** | 0.050 * | 0.028 * | 0.001 * | 0.349 * | 0.002 * | 0.004 * | 0.045 * | 0.035 * | 0.813 ** | 0.162 * | 0.185 * | |
| NZL | 0.754 ** | 0.005 * | 0.001 * | 0.063 * | 0.034 * | 0.490 * | 0.001 * | 0.027 * | 0.009 * | 1.652 *** | 0.182 * | 0.122 * | 0.018 * | 0.024 * | 0.162 * | |
| PHL | 0.042 * | 0.001 * | 0.001 * | 0.020 * | 0.002 * | 4.318 *** | 0.001 * | 0.003 * | 0.001 * | 0.379 * | 0.028 * | 0.080 * | 0.018 * | 0.008 * | 0.145 * | |
| SGP | 0.094 * | 0.238 * | 0.205 * | 0.743 ** | 1.078 *** | 0.254 * | 0.030 * | 0.642 ** | 4.198 *** | 0.595 ** | 2.025 *** | 0.081 * | 0.599 ** | 3.265 *** | 0.581 ** | |
| KOR | 0.106 * | 0.001 * | 0.050 * | 2.442 *** | 0.365 * | 1.940 *** | 0.024 * | 0.006 * | 0.024 * | 0.443 * | 7.719 *** | 0.092 * | 0.178 * | 4.210 *** | 0.737 ** | |
| THA | 0.103 * | 0.008 * | 19.065 **** | 0.677 ** | 0.523 * | 0.351 * | 3.584 *** | 0.869 ** | 2.447 *** | 0.044 * | 0.850 ** | 0.064 * | 0.047 * | 2.696 *** | 0.338 * | |
| VNM | 0.089 * | 0.002 * | 0.962 ** | 12.246 *** | 0.224 * | 0.321 * | 0.146 * | 0.180 * | 1.959 *** | 0.031 * | 0.105 * | 0.208 * | 0.776 ** | 0.734 ** | 0.517 * |
| Countries | AUS | BRN | KHM | CHN | IDN | JPN | LAO | MYS | MMR | NZL | PHL | SGP | KOR | THA | VNM | RCEP |
|---|---|---|---|---|---|---|---|---|---|---|---|---|---|---|---|---|
| AUS | 0.035 * | 0.008 * | 0.602 ** | 1.015 *** | 0.518 ** | 0.032 * | 0.152 * | 3.736 *** | 0.795 *** | 0.011 * | 0.105 * | 0.005 * | 0.416 ** | 3.029 *** | 0.453 ** | |
| BRN | 0.581 ** | 0.001 * | 0.833 *** | 0.094 * | 0.126 * | 0.001 * | 6.235 *** | 0.393 ** | 0.053 * | 0.002 * | 1.768 *** | 0.036 * | 0.112 * | 0.100 * | 0.718 ** | |
| KHM | 0.009 * | 0.001 * | 0.822 *** | 0.003 * | 0.088 * | 0.001 * | 0.002 * | 0.001 * | 0.009 * | 0.003 * | 0.024 * | 0.302 * | 1.326 *** | 0.917 *** | 0.234 * | |
| CHN | 0.527 ** | 0.088 * | 0.318 * | 4.117 *** | 0.688 ** | 0.001 * | 3.720 *** | 9.745 **** | 3.430 *** | 1.569 *** | 0.240 * | 1.411 *** | 2.892 *** | 1.138 *** | 1.178 *** | |
| IDN | 0.041 * | 0.009 * | 0.002 * | 0.229 * | 2.082 *** | 0.035 * | 0.110 * | 0.373 ** | 0.012 * | 0.048 * | 0.113 * | 0.025 * | 0.074 * | 1.958 *** | 0.305 * | |
| JPN | 0.564 ** | 0.018 * | 0.066 * | 7.300 *** | 9.266 **** | 0.002 * | 0.317 * | 6.537 *** | 0.540 ** | 2.935 *** | 0.032 * | 1.177 *** | 2.580 *** | 6.257 *** | 2.339 *** | |
| LAO | 0.728 ** | 0.001 * | 0.001 * | 0.253 * | 1.544 *** | 0.027 * | 0.129 * | 0.001 * | 6.468 *** | 0.001 * | 0.088 * | 0.510 ** | 7.513 *** | 2.398 *** | 2.282 *** | |
| MYS | 0.126 * | 0.155 * | 0.002 * | 0.662 ** | 2.120 *** | 0.344 * | 0.006 * | 13.747 **** | 0.082 * | 0.060 * | 0.322 * | 0.141 * | 0.182 * | 1.564 *** | 0.349 * | |
| MMR | 0.029 * | 0.005 * | 0.001 * | 0.265 * | 0.061 * | 0.669 *** | 0.001 * | 0.073 * | 0.002 * | 0.001 * | 0.090 * | 0.008 * | 0.216 * | 0.060 * | 0.142 * | |
| NZL | 0.223 * | 0.008 * | 0.005 * | 1.490 *** | 0.034 * | 0.152 * | 0.092 * | 0.022 * | 0.044 * | 0.018 * | 0.022 * | 0.117 * | 0.084 * | 0.127 * | 0.186 * | |
| PHL | 0.001 * | 0.001 * | 0.001 * | 0.269 * | 0.065 * | 1.507 *** | 0.001 * | 0.010 * | 0.019 * | 0.010 * | 0.071 * | 0.252 * | 0.013 * | 0.142 * | 0.169 * | |
| SGP | 0.580 ** | 0.267 * | 0.019 * | 1.320 *** | 1.759 *** | 0.485 ** | 0.003 * | 3.809 *** | 14.516 **** | 0.137 * | 0.308 * | 0.120 * | 0.600 ** | 1.189 *** | 0.884 *** | |
| KOR | 0.006 * | 0.005 * | 0.209 * | 2.259 *** | 1.003 *** | 1.937 *** | 0.015 * | 0.143 * | 1.707 *** | 0.594 ** | 0.590 ** | 0.018 * | 0.546 ** | 4.448 *** | 0.864 *** | |
| THA | 0.226 * | 0.010 * | 2.002 *** | 0.252 * | 0.914 *** | 1.652 *** | 9.901 **** | 0.113 * | 8.471 **** | 0.225 * | 0.064 * | 0.126 * | 0.125 * | 4.758 *** | 0.421 ** | |
| VNM | 0.192 * | 0.004 * | 1.885 *** | 0.768 *** | 1.401 *** | 0.937 *** | 0.172 * | 0.114 * | 2.591 *** | 0.188 * | 0.464 ** | 0.171 * | 0.477 ** | 0.378 ** | 0.559 ** |
| Countries | AUS | BRN | KHM | CHN | IDN | JPN | LAO | MYS | MMR | NZL | PHL | SGP | KOR | THA | VNM | RCEP |
|---|---|---|---|---|---|---|---|---|---|---|---|---|---|---|---|---|
| AUS | 0.001 * | 0.004 * | 2.037 *** | 0.477 * | 0.129 * | 0.001 * | 0.401 * | 0.881 ** | 0.689 * | 0.452 * | 0.170 * | 0.039 * | 2.128 *** | 4.882 *** | 0.804 ** | |
| BRN | 0.370 * | 0.001 * | 6.316 *** | 2.371 *** | 1.035 ** | 0.001 * | 11.624 *** | 0.041 * | 1.716 *** | 5.052 *** | 23.316 **** | 1.494 *** | 25.890 **** | 1.135 ** | 5.718 *** | |
| KHM | 0.076 * | 0.001 * | 3.283 *** | 0.013 * | 1.381 ** | 0.001 * | 0.058 * | 0.001 * | 0.272 * | 0.004 * | 0.124 * | 0.157 * | 21.141 **** | 15.099 **** | 2.131 *** | |
| CHN | 0.429 * | 0.052 * | 0.181 * | 11.573 *** | 2.178 *** | 0.513 * | 2.281 *** | 2.039 *** | 1.249 ** | 1.487 *** | 0.709 * | 4.746 *** | 22.828 **** | 1.921 *** | 2.123 *** | |
| IDN | 0.095 * | 0.006 * | 0.001 * | 0.144 * | 1.790 *** | 0.001 * | 0.156 * | 0.009 * | 0.004 * | 0.126 * | 0.074 * | 0.024 * | 0.204 * | 0.301 * | 0.201 * | |
| JPN | 0.296 * | 0.001 * | 0.063 * | 4.562 *** | 6.713 *** | 0.104 * | 0.106 * | 1.188 ** | 0.156 * | 9.392 *** | 0.266 * | 2.128 *** | 9.827 *** | 6.499 *** | 2.950 *** | |
| LAO | 0.016 * | 0.001 * | 0.009 * | 8.437 *** | 0.001 * | 22.280 **** | 0.001 * | 0.001 * | 0.001 * | 0.001 * | 0.165 * | 6.692 *** | 15.970 **** | 5.681 *** | 4.232 *** | |
| MYS | 0.529 * | 0.664 * | 0.003 * | 0.441 * | 0.483 * | 0.060 * | 0.001 * | 0.752 ** | 0.046 * | 0.468 * | 0.549 * | 0.032 * | 0.395 * | 1.033 ** | 0.297 * | |
| MMR | 0.019 * | 0.001 * | 0.001 * | 1.381 ** | 0.003 * | 0.037 * | 0.001 * | 0.022 * | 0.002 * | 0.004 * | 0.027 * | 0.015 * | 0.654 * | 0.013 * | 0.106 * | |
| NZL | 0.527 * | 0.012 * | 0.011 * | 0.854 ** | 0.009 * | 0.065 * | 0.001 * | 0.033 * | 0.011 * | 0.048 * | 0.155 * | 0.072 * | 0.393 * | 0.352 * | 0.237 * | |
| PHL | 0.060 * | 0.021 * | 0.001 * | 0.117 * | 0.019 * | 1.397 ** | 0.001 * | 0.054 * | 0.008 * | 0.005 * | 0.198 * | 0.045 * | 0.110 * | 0.058 * | 0.131 * | |
| SGP | 0.598 * | 0.354 * | 0.006 * | 1.768 *** | 0.844 ** | 0.334 * | 0.002 * | 2.148 *** | 0.311 * | 0.360 * | 1.131 ** | 0.091 * | 1.049 ** | 4.157 *** | 0.831 ** | |
| KOR | 0.023 * | 0.008 * | 0.009 * | 1.249 ** | 0.352 * | 2.772 *** | 0.009 * | 0.046 * | 0.224 * | 0.198 * | 2.088 *** | 0.018 * | 0.377 * | 13.277 *** | 0.584 * | |
| THA | 1.319 ** | 0.225 * | 10.005 *** | 0.602 * | 0.856 ** | 1.379 ** | 14.550 **** | 0.684 * | 1.650 *** | 1.642 *** | 3.850 *** | 0.216 * | 0.156 * | 7.778 *** | 0.909 ** | |
| VNM | 0.142 * | 0.001 * | 1.094 ** | 0.087 * | 0.020 * | 1.236 ** | 0.188 * | 0.053 * | 0.093 * | 0.078 * | 0.091 * | 0.057 * | 0.447 * | 0.294 * | 0.334 * |
Appendix B
| Countries | AUS | BRN | KHM | CHN | IDN | JPN | LAO | MYS | MMR | NZL | PHL | SGP | KOR | THA | VNM | RCEP |
|---|---|---|---|---|---|---|---|---|---|---|---|---|---|---|---|---|
| AUS RCA | 0.266 | 0.079 | 0.255 | 0.139 | 0.769 | 0.048 | 0.211 | 0.069 | 0.137 | 0.050 | 0.633 | 0.013 | 0.232 | 7.513 * | 0.475 | |
| AUS RTA | 0.222 ** | −0.287 | −0.300 | −1.043 | 0.656 ** | 0.048 ** | −0.719 | −60.380 | −3.317 | −0.690 | 0.552 ** | −0.088 | −4.120 | 2.419 ** | −0.642 | |
| AUS LI | −0.006 | −0.008 | 1.734 *** | −1.793 | 19.942 *** | 0.001 *** | −2.301 | −0.565 | −8.080 | −0.142 | 2.369 *** | −0.187 | −14.847 | 3.884 *** | −0.035 | |
| BRN RCA | 0.045 | 0.001 | 0.180 | 0.005 | 0.004 | 0.001 | 0.184 | 0.001 | 0.001 | 0.013 | 0.037 | 0.002 | 0.022 | 0.034 | 0.022 | |
| BRN RTA | −0.611 | −0.347 | −0.107 | −0.823 | −0.121 | 0.001 ** | −4.204 | −75.809 | −6.337 | −3.721 | −1.320 | −0.086 | −1.558 | −13.116 | −1.816 | |
| BRN LI | 1.773 *** | −0.001 | 2.681 *** | 0.011 *** | 0.657 *** | 0.001 *** | −3.680 | −0.135 | −0.109 | −0.061 | −1.244 | 0.132 *** | 0.087 *** | −0.110 | −0.954 | |
| KHM RCA | 1.437 * | 0.219 | 0.473 | 0.005 | 0.121 | 1.016 * | 0.086 | 0.001 | 0.001 | 0.017 | 0.121 | 0.850 | 1.132 * | 0.163 | 0.406 | |
| KHM RTA | 1.355 ** | 0.219 ** | 0.339 ** | −0.009 | −0.436 | 1.016 ** | 0.061 ** | −0.029 | −7.637 | −0.095 | 0.096 ** | 0.806 ** | 0.470 ** | −0.766 | −0.010 | |
| KNM LI | 3.130 *** | 0.022 *** | 3.118 *** | −0.036 | 0.900 *** | 0.101 *** | 0.211 *** | 0.001 *** | −0.250 | −0.006 | 1.356 *** | 3.019 *** | −0.818 | −10.747 | −0.131 | |
| CHN RCA | 0.622 | 0.157 | 0.102 | 0.485 | 2.686 * | 0.169 | 1.305 * | 0.011 | 0.797 | 1.585 * | 0.419 | 1.779 * | 1.732 * | 0.258 | 1.546 * | |
| CHN RTA | 0.406 ** | −0.094 | −0.486 | −0.523 | 2.497 ** | 0.168 ** | 1.205 ** | −1.409 | −4.174 | 1.419 ** | 0.379 ** | 1.668 ** | 1.155 ** | −0.426 | 1.259 ** | |
| CHN LI | −1.616 | −0.010 | −0.032 | −3.275 | 9.018 *** | 0.006 *** | 0.816 *** | −0.743 | −4.650 | 0.636 | 0.453 *** | 2.862 *** | −1.439 | −2.027 | 1.367 *** | |
| IDN RCA | 1.002 * | 0.385 | 0.009 | 1.107 * | 3.101 * | 0.354 | 1.008 * | 0.031 | 0.265 | 0.199 | 0.666 | 0.468 | 2.143 * | 3.640 * | 1.578 * | |
| IDN RTA | 0.873 ** | 0.380 ** | 0.004 ** | 0.688 ** | 2.986 ** | 0.354 ** | 0.695 ** | −1.667 | 0.096 ** | −0.221 | 0.604 ** | 0.417 ** | 2.028 ** | 3.308 ** | 1.381 ** | |
| IDN LI | −0.059 | 0.001 *** | 0.001 *** | −7.391 | 8.093 *** | 0.001 *** | −1.143 | −0.111 | −0.089 | −0.166 | −0.295 | 0.198 *** | 0.510 *** | 0.451 *** | 0.589 *** | |
| JPN RCA | 0.081 | 0.106 | 0.539 | 0.222 | 0.089 | 0.461 | 0.090 | 0.014 | 0.730 | 0.128 | 0.121 | 0.300 | 0.463 | 0.938 | 0.255 | |
| JPN RTA | −0.858 | 0.098 ** | 0.396 ** | −2.102 | −3.909 | 0.461 ** | −0.332 | −13.809 | −5.005 | −2.247 | −0.134 | −2.715 | −6.437 | −8.200 | −2.477 | |
| JPN LI | −0.423 | 0.003 *** | 0.026 *** | −0.750 | −1.694 | 0.008 *** | 0.143 *** | −0.161 | 0.075 *** | −0.108 | 0.606 *** | 1.950 *** | 0.371 *** | −0.044 | −1.004 | |
| LAO RCA | 0.001 | 0.001 | 0.001 | 0.001 | 0.001 | 0.001 | 0.006 | 0.001 | 0.001 | 0.001 | 0.001 | 0.073 | 0.003 | 0.002 | 0.003 | |
| LAO RTA | −0.071 | 0.001 ** | −1.409 | −0.168 | −0.658 | −0.788 | −0.017 | 0.001 ** | −13.476 | 0.001 ** | −0.018 | 0.018 ** | −0.226 | −0.351 | −0.232 | |
| LAO LI | −0.001 | 0.004 *** | −0.005 | −0.134 | −0.005 | −0.133 | 0.017 *** | 0.004 *** | −0.024 | 0.004 | 0.002 *** | 0.494 *** | −0.157 | −0.067 | −2.593 | |
| MYS RCA | 0.772 | 1.017 * | 0.023 | 0.217 | 0.350 | 0.359 | 0.016 | 0.033 | 0.276 | 0.084 | 0.371 | 0.413 | 0.282 | 1.204 * | 0.376 | |
| MYS RTA | 0.521 ** | 0.897 ** | −0.075 | −0.692 | −1.836 | 0.229 ** | 0.001 ** | −21.596 | −1.088 | −0.048 | 0.310 ** | 0.339 ** | −1.337 | −1.028 | −0.350 | |
| MYS LI | 5.573 *** | 0.632 *** | 0.001 *** | −9.846 | −8.487 | 6.587 *** | 0.001 *** | −2.672 | −0.305 | 0.087 | 11.729 *** | 2.988 *** | −6.825 | 0.537 *** | −0.082 | |
| MMR RCA | 48.069 * | 18.029 * | 0.001 | 4.324 * | 2.160 * | 11.568 * | 0.001 | 14.540 * | 5.629 * | 0.222 | 8.312 * | 1.837 * | 3.477 * | 5.800 * | 5.199 * | |
| MMR RTA | 48.027 ** | 18.029 ** | 0.001 ** | 4.256 ** | 2.102 ** | 11.542 ** | 0.001 ** | 14.524 ** | 5.070 ** | 0.220 ** | 8.294 ** | 1.833 ** | 3.054 ** | 5.763 ** | 5.104 ** | |
| MMR LI | 0.088 *** | 0.001 *** | 0.001 *** | 0.100 *** | −0.078 | 0.603 *** | 0.001 *** | 0.324 *** | −0.035 | 0.001 *** | 0.189 *** | 0.036 *** | −1.245 | 0.017 *** | 3.037 *** | |
| NZL RCA | 2.704 * | 4.757 * | 5.828 * | 4.092 * | 0.137 | 4.232 * | 2.864 * | 1.107 * | 0.273 | 0.557 | 2.955 * | 1.981 * | 3.429 * | 1.464 * | 3.069 * | |
| NZL RTA | 2.521 ** | 4.756 ** | 5.828 ** | 3.425 ** | −0.170 | 3.763 ** | 2.864 ** | 0.799 ** | −4.164 | −0.454 | 2.904 ** | −0.439 | −1.063 | −4.174 | 2.298 ** | |
| NZL LI | 6.753 *** | 0.019 *** | 0.011 *** | 4.937 *** | −0.261 | 3.675 *** | 0.001 *** | −0.276 | −0.012 | −0.025 | 0.864 *** | −4.494 | −8.634 | −2.558 | 1.480 *** | |
| PHL RCA | 0.558 | 2.069 * | 0.068 | 0.365 | 0.351 | 1.288 * | 0.001 | 0.124 | 0.047 | 0.988 | 0.330 | 0.872 | 0.452 | 0.815 | 0.734 | |
| PHL RTA | 0.521 ** | 2.061 ** | 0.051 ** | −0.493 | 0.038 ** | 1.072 ** | 0.001 ** | 0.065 ** | −0.187 | 0.350 ** | 0.256 ** | 0.639 ** | 0.375 ** | −2.073 | 0.315 ** | |
| PHL LI | 0.537 *** | 0.035 *** | 0.002 *** | −16.625 | −2.160 | 24.538 *** | 0.001 *** | 0.073 *** | −0.012 | −0.645 | 2.097 *** | 1.631 *** | 1.315 *** | −10.787 | 0.281 *** | |
| SGP RCA | 0.054 | 0.774 | 0.019 | 0.031 | 0.050 | 0.171 | 0.027 | 0.109 | 0.026 | 0.040 | 0.075 | 0.058 | 0.075 | 0.200 | 0.083 | |
| SGP RTA | −0.808 | 0.727 ** | −0.103 | −0.354 | −0.738 | −0.011 | 0.027 ** | −0.299 | −9.499 | −3.654 | −0.217 | −0.010 | −0.789 | −3.429 | −0.416 | |
| SGP LI | −0.371 | 1.526 *** | 0.035 *** | −3.400 | −1.842 | 3.584 *** | 0.003 *** | 2.747 *** | −1.315 | −0.875 | 0.504 | 1.141 *** | −1.580 | −0.157 | −0.324 | |
| KOR RCA | 0.081 | 0.055 | 0.043 | 0.198 | 0.054 | 2.406 * | 0.042 | 0.069 | 0.017 | 4.006 * | 0.172 | 0.059 | 1.641 * | 0.217 | 0.552 | |
| KOR RTA | 0.058 ** | 0.051 ** | −0.992 | −1.620 | −0.521 | 2.029 ** | −0.034 | −0.332 | −1.519 | 2.162 ** | −0.787 | −0.045 | −2.122 | −7.556 | −0.698 | |
| KOR LI | 0.179 *** | 0.002 *** | −0.016 | −17.179 | −1.050 | 25.013 *** | 0.001 *** | −0.517 | −0.083 | 1.325 *** | −0.123 | 0.181 *** | 0.891 *** | −8.624 | −0.774 | |
| THA RCA | 3.999 * | 1.265 * | 0.594 | 0.713 | 0.082 | 6.291 * | 0.186 | 0.826 | 0.503 | 3.745 * | 0.110 | 0.775 | 3.387 * | 1.062 * | 2.198 * | |
| THA RTA | 3.753 ** | 1.247 ** | −0.871 | −0.174 | −4.023 | 5.701 ** | 0.183 ** | 0.438 ** | −2.273 | −0.797 | −1.361 | 0.716 ** | 1.404 ** | −4.814 | 1.101 ** | |
| THA LI | 5.231 *** | 0.024 *** | 0.160 *** | −6.225 | −8.260 | 18.165 *** | 0.092 *** | 0.066 *** | −2.531 | −0.173 | −1.234 | 1.303 *** | −2.518 | −4.100 | 1.626 *** | |
| VNM RCA | 4.480 * | 6.424 * | 0.788 | 2.796 * | 0.297 | 9.211 * | 0.272 | 2.054 * | 0.094 | 5.225 * | 2.295 * | 3.110 * | 6.881 * | 5.257 * | 4.756 * | |
| VNM RTA | 4.129 ** | 6.402 ** | 0.639 ** | 2.621 ** | −1.573 | 8.620 ** | 0.272 ** | 1.819 ** | −4.412 | 3.787 ** | 1.460 ** | 2.969 ** | 6.688 ** | 4.899 ** | 4.442 ** | |
| VNM LI | 0.5648 *** | 0.005 *** | 0.059 *** | −0.529 | −2.473 | 2.797 *** | 0.006 *** | −0.140 | −0.241 | −0.212 | −0.084 | 0.022 *** | 0.706 *** | −0.480 | 3.093 *** |
| Countries | AUS | BRN | KHM | CHN | IDN | JPN | LAO | MYS | MMR | NZL | PHL | SGP | KOR | THA | VNM | RCEP |
|---|---|---|---|---|---|---|---|---|---|---|---|---|---|---|---|---|
| AUS RCA | 0.565 | 0.001 | 0.102 | 0.298 | 1.288 * | 0.001 | 0.075 | 0.137 | 0.092 | 0.102 | 0.140 | 0.027 | 0.272 | 0.528 | 0.428 | |
| AUS RTA | 0.563 ** | −0.264 | −0.057 | −0.885 | 1.262 ** | 0.001 ** | −0.096 | −71.917 | −6.223 | −0.139 | 0.068 ** | 0.007 ** | −0.040 | −4.230 | −0.293 | |
| AUS LI | 0.017 *** | −0.011 | 0.782 *** | −2.514 | 39.766 *** | 0.001 *** | −0.610 | −1.084 | −25.558 | 0.021 *** | 0.237 *** | 0.254 *** | −0.819 | −10.483 | −0.488 | |
| BRN RCA | 0.001 | 0.001 | 0.194 | 0.013 | 0.002 | 0.001 | 0.289 | 0.001 | 0.002 | 0.004 | 0.013 | 0.001 | 0.055 | 0.056 | 0.023 | |
| BRN RTA | −1.070 | −0.946 | −0.129 | −1.258 | −0.234 | 0.001 ** | −5.506 | −29.054 | −11.115 | −0.862 | −2.010 | −0.029 | −0.355 | −29.901 | −2.396 | |
| BRN LI | −0.071 | −0.002 | 2.239 *** | 0.206 *** | 0.229 *** | 0.001 *** | −1.878 | −0.029 | −0.100 | −0.007 | −1.430 | −0.003 | 1.003 *** | −0.160 | −1.492 | |
| KHM RCA | 0.242 | 0.614 | 0.293 | 0.015 | 0.202 | 2.830 * | 0.212 | 0.001 | 0.001 | 0.047 | 0.294 | 0.103 | 1.554 * | 0.020 | 0.404 | |
| KHM RTA | 0.234 ** | 0.613 ** | 0.272 ** | 0.001 ** | 0.046 ** | 2.828 ** | 0.204 ** | −0.078 | 0.001 ** | 0.009 ** | 0.275 ** | 0.096 ** | 1.397 ** | −0.667 | 0.223 ** | |
| KNM LI | 0.750 *** | 0.085 *** | 3.888 *** | −0.121 | 4.074 *** | 0.401 *** | 0.869 *** | −0.002 | 0.001 *** | 0.019 *** | 4.908 *** | 0.465 *** | 15.697 *** | −31.034 | 0.401 *** | |
| CHN RCA | 0.146 | 0.148 | 0.023 | 0.983 | 2.286 * | 0.001 | 0.887 | 0.008 | 0.374 | 2.714 * | 0.213 | 2.212 * | 1.718 * | 0.322 | 1.500 * | |
| CHN RTA | 0.028 ** | −0.131 | −0.261 | 0.051 ** | 2.004 ** | −0.001 | 0.799 ** | −0.991 | −4.816 | 2.522 ** | 0.169 ** | 2.076 ** | 1.279 ** | −0.855 | 1.183 ** | |
| CHN LI | −1.102 | −0.011 | −0.018 | −2.335 | 6.065 *** | 0.001 *** | 0.551 *** | −0.526 | −4.940 | 1.651 *** | 0.168 *** | 4.568 *** | −0.444 | −3.631 | 1.231 *** | |
| IDN RCA | 0.987 | 0.637 | 0.010 | 1.285 * | 1.879 * | 0.478 | 1.909 * | 0.064 | 0.247 | 0.472 | 1.305 * | 0.685 | 4.344 * | 4.672 * | 1.635 * | |
| IDN RTA | 0.717 ** | 0.623 ** | −0.005 | 0.430 ** | 1.619 ** | 0.475 ** | 1.499 ** | −0.956 | −0.129 | −0.267 | 1.263 ** | 0.604 ** | 4.284 ** | 4.237 ** | 1.292 ** | |
| IDN LI | −0.291 | 0.001 *** | 0.001 *** | −13.194 | 5.443 *** | 0.001 *** | 0.345 *** | −0.053 | −0.179 | −0.071 | 2.421 *** | 0.725 *** | 3.544 *** | 1.308 *** | 1.029 *** | |
| JPN RCA | 0.011 | 0.280 | 0.209 | 0.316 | 0.215 | 0.001 | 0.164 | 0.013 | 1.663 * | 0.333 | 0.092 | 0.625 | 1.164 * | 1.589 * | 0.463 | |
| JPN RTA | −1.576 | 0.273 ** | −0.041 | −1.305 | −2.510 | 0.001 ** | −0.083 | −2.555 | −10.881 | −2.141 | −0.594 | −4.553 | −1.958 | −0.773 | −1.682 | |
| JPN LI | −2.710 | 0.008 *** | 0.004 *** | −2.321 | −2.421 | 0.001 *** | 0.343 *** | −0.068 | −0.692 | −0.195 | 0.239 *** | 0.706 *** | 4.978 *** | 2.130 *** | −0.927 | |
| LAO RCA | 0.001 | 0.001 | 0.001 | 0.002 | 0.001 | 0.001 | 0.016 | 0.001 | 0.001 | 0.001 | 0.001 | 0.001 | 0.006 | 0.001 | 0.004 | |
| LAO RTA | −0.001 | −0.001 | −3.815 | −0.001 | −0.457 | −0.001 | 0.015 * | −0.001 | −0.005 | −0.001 | −0.009 | −0.035 | −0.115 | −0.249 | −0.101 | |
| LAO LI | 0.023 *** | 0.023 *** | −0.133 | 0.801 *** | −0.018 | 0.023 *** | 0.097 *** | 0.023 *** | 0.024 *** | 0.023 *** | 0.016 *** | −0.018 | 0.094 *** | −0.978 | −0.128 | |
| MYS RCA | 0.129 | 0.871 | 0.009 | 0.169 | 0.512 | 0.178 | 0.001 | 0.046 | 0.100 | 0.088 | 0.322 | 0.041 | 0.367 | 0.760 | 0.258 | |
| MYS RTA | −0.032 | 0.716 ** | −0.232 | −0.600 | −3.975 | −0.098 | −0.040 | −24.123 | −1.966 | 0.051 ** | 0.254 ** | −0.066 | −1.944 | −3.055 | −0.759 | |
| MYS LI | 0.948 *** | 0.617 *** | −0.005 | −2.320 | −8.340 | 2.696 *** | 0.001 *** | −1.641 | −0.387 | 0.327 *** | 11.845 *** | 0.063 *** | −3.072 | −0.729 | −0.610 | |
| MMR RCA | 70.785 * | 30.964 * | 0.001 | 6.487 * | 0.660 | 2.243 * | 0.001 | 22.844 * | 1.167 * | 0.198 | 14.080 * | 2.623 * | 6.463 * | 1.470 * | 7.068 * | |
| MMR RTA | 70.740 ** | 30.957 ** | −0.001 | 6.357 ** | 0.547 ** | 2.221 ** | 0.001 ** | 22.833 ** | 0.565 ** | 0.196 ** | 14.051 ** | 2.622 ** | 6.115 ** | 1.391 ** | 6.955 ** | |
| MMR LI | 0.087 *** | 0.001 *** | −0.001 | −0.341 | −0.137 | 0.038 *** | 0.001 *** | 0.354 *** | −0.030 | 0.001 *** | 0.194 *** | 0.039 *** | −0.166 | −0.041 | 4.338 *** | |
| NZL RCA | 5.074 * | 7.588 * | 0.001 | 4.383 * | 0.313 | 9.225 * | 0.004 | 1.516 * | 0.352 | 1.269 * | 1.378 * | 1.917 * | 5.425 * | 3.340 * | 4.761 * | |
| NZL RTA | 4.919 ** | 7.585 ** | 0.001 ** | 4.101 ** | −0.029 | 8.289 ** | 0.004 ** | 1.439 ** | −0.751 | 0.938 ** | 1.302 ** | −2.314 | 5.004 ** | 1.622 ** | 4.200 ** | |
| NZL LI | 4.894 *** | 0.010 *** | 0.001 *** | 2.405 *** | −0.237 | 1.120 *** | 0.001 *** | 0.065 *** | −0.002 | 0.078 *** | −0.004 | −7.693 | −0.162 | −0.475 | 2.173 *** | |
| PHL RCA | 0.243 | 0.365 | 0.017 | 0.542 | 0.692 | 1.219 * | 0.001 | 0.018 | 0.001 | 0.309 | 0.112 | 0.117 | 0.816 | 0.785 | 0.667 | |
| PHL RTA | 0.176 ** | 0.350 ** | −0.026 | −1.157 | −0.064 | 0.645 ** | 0.001 ** | −0.070 | −0.169 | −1.136 | −0.040 | −0.455 | 0.763 ** | −5.745 | −0.237 | |
| PHL LI | 0.211 *** | 0.006 *** | 0.001 *** | −11.312 | −1.833 | 23.816 *** | 0.001 *** | −0.238 | −0.004 | −0.747 | 0.156 *** | −3.004 | 3.909 *** | −10.959 | −0.692 | |
| SGP RCA | 0.045 | 1.060 * | 0.016 | 0.047 | 0.035 | 0.431 | 0.010 | 0.093 | 0.038 | 0.063 | 0.111 | 0.121 | 0.147 | 0.258 | 0.117 | |
| SGP RTA | −0.321 | 1.041 ** | −0.279 | −0.138 | −1.249 | 0.262 ** | 0.009 ** | −0.248 | −11.097 | −1.596 | 0.029 ** | 0.045 ** | −0.413 | −4.210 | −0.331 | |
| SGP LI | −0.007 | 1.862 *** | −0.018 | −0.653 | −9.225 | 9.764 *** | 0.001 *** | −0.285 | −2.199 | −0.437 | 1.236 *** | 2.237 *** | 0.173 *** | −2.450 | −0.497 | |
| KOR RCA | 0.036 | 0.023 | 0.007 | 0.298 | 0.088 | 4.168 * | 0.028 | 0.078 | 0.001 | 7.482 * | 0.357 | 0.064 | 4.388 * | 0.473 | 0.983 | |
| KOR RTA | −0.016 | 0.022 ** | −0.126 | −2.296 | −0.688 | 3.406 ** | 0.026 ** | −0.005 | −1.463 | 5.660 ** | −0.138 | −0.148 | 3.308 ** | −3.369 | −0.469 | |
| KOR LI | −0.091 | 0.001 *** | −0.002 | −25.921 | −1.341 | 22.389 *** | 0.001 *** | −0.004 | −0.075 | 1.566 *** | 0.315 *** | −0.079 | 5.751 *** | −2.509 | −0.505 | |
| THA RCA | 0.238 | 0.070 | 0.159 | 0.583 | 0.028 | 3.410 * | 0.083 | 0.864 | 0.136 | 0.066 | 0.052 | 0.472 | 0.950 | 0.709 | 1.080 * | |
| THA RTA | −0.130 | 0.022 ** | −1.879 | −0.600 | −9.141 | 1.973 ** | 0.079 ** | 0.302 ** | −5.069 | −7.563 | −3.418 | 0.331 ** | −4.224 | −7.631 | −1.054 | |
| THA LI | 0.410 *** | −0.001 | 0.054 *** | −1.682 | −10.427 | 20.763 *** | 0.091 *** | 2.387 *** | −2.782 | −0.790 | −1.664 | 1.771 *** | −5.782 | −2.347 | −0.846 | |
| VNM RCA | 4.313 * | 17.490 * | 0.580 | 2.847 * | 0.392 | 4.454 * | 0.165 | 3.525 * | 0.097 | 1.644 * | 5.407 * | 4.310 * | 3.413 * | 7.437 * | 3.594 * | |
| VNM RTA | 3.850 ** | 17.457 ** | 0.568 ** | 2.544 ** | −1.768 | 3.090 ** | 0.164 ** | 3.428 ** | −0.073 | −1.944 | 4.009 ** | 4.150 ** | 2.938 ** | 7.049 ** | 3.050 ** | |
| VNM LI | 1.739 *** | 0.045 *** | 0.183 *** | 0.668 *** | −3.082 | −1.445 | 0.009 *** | 1.329 *** | −0.007 | −0.724 | 0.940 *** | 1.152 *** | −2.170 | 1.364 *** | 2.974 *** |
| Countries | AUS | BRN | KHM | CHN | IDN | JPN | LAO | MYS | MMR | NZL | PHL | SGP | KOR | THA | VNM | RCEP |
|---|---|---|---|---|---|---|---|---|---|---|---|---|---|---|---|---|
| AUS RCA | 0.417 | 0.001 | 0.003 | 0.037 | 0.142 | 0.001 | 0.048 | 0.001 | 0.090 | 0.331 | 0.367 | 0.004 | 0.047 | 0.074 | 0.069 | |
| AUS RTA | 0.415 ** | −10.065 | −0.239 | −0.446 | −0.162 | 0.001 ** | −0.615 | −7.777 | −2.471 | −7.678 | 0.142 ** | −0.685 | −0.589 | −1.594 | −0.533 | |
| AUS LI | 0.059 *** | −0.370 | −4.414 | −0.656 | 16.458 *** | 0.002 *** | −2.128 | −0.098 | −6.323 | −1.127 | 6.704 *** | −2.917 | −2.367 | −2.824 | −0.498 | |
| BRN RCA | 0.001 | 0.001 | 0.112 | 0.001 | 0.001 | 0.001 | 0.070 | 0.001 | 0.001 | 0.415 | 0.135 | 0.001 | 0.030 | 0.095 | 0.016 | |
| BRN RTA | −4.264 | 0.001 ** | −0.449 | −1.213 | −0.017 | 0.001 ** | −18.800 | 0.001 ** | −10.253 | −3.979 | −3.567 | −0.084 | −12.083 | −23.473 | −7.019 | |
| BRN LI | −0.032 | 0.013 *** | 0.811 *** | −0.007 | −0.001 | 0.013 *** | −1.904 | 0.013 *** | −0.005 | 0.319 *** | 0.528 *** | 0.011 *** | 0.037 *** | 0.204 *** | −5.291 | |
| KHM RCA | 5.047 * | 0.001 | 0.061 | 0.001 | 0.001 | 0.001 | 0.002 | 0.001 | 0.001 | 0.001 | 0.188 | 0.030 | 6.915 * | 0.124 | 1.249 * | |
| KHM RTA | 4.989 ** | 0.001 ** | 0.060 ** | −0.109 | −0.037 | 0.001 ** | 0.001 ** | 0.001 ** | −0.334 | −0.093 | 0.104 ** | −0.063 | 6.719 ** | −0.127 | 1.131 ** | |
| KNM LI | 3.141 *** | 0.004 *** | 0.224 *** | −0.863 | −0.265 | 0.007 *** | −0.008 | 0.004 *** | −0.027 | −0.032 | −1.587 | −1.022 | 10.835 *** | −10.411 | 1.038 *** | |
| CHN RCA | 0.025 | 0.091 | 0.001 | 0.015 | 2.899 * | 0.001 | 0.198 | 0.001 | 0.021 | 0.237 | 0.234 | 3.514 * | 0.324 | 0.084 | 1.598 * | |
| CHN RTA | 0.014 ** | −0.315 | 0.001 ** | −1.226 | 2.781 ** | 0.001 ** | 0.196 ** | −1.636 | −0.052 | −0.396 | −0.790 | 3.488 ** | 0.009 ** | −4.377 | 1.235 ** | |
| CHN LI | −0.053 | −0.012 | 0.001 *** | −2.941 | 9.786 *** | 0.001 *** | 0.176 *** | −0.544 | −0.042 | −1.098 | −2.617 | 8.151 *** | −0.853 | −9.954 | 1.284 *** | |
| IDN RCA | 0.162 | 0.068 | 0.068 | 0.773 | 9.172 * | 0.002 | 0.825 | 0.008 | 1.955 * | 0.053 | 1.230 * | 1.631 * | 0.599 | 1.795 * | 3.228 * | |
| IDN RTA | 0.105 ** | 0.067 ** | 0.066 ** | 0.734 ** | 9.110 ** | 0.002 ** | −2.448 | −4.036 | 1.540 ** | −0.128 | 0.783 ** | 1.272 ** | −2.724 | −4.529 | 2.376 ** | |
| IDN LI | −0.021 | 0.001 *** | 0.002 *** | 0.705 *** | 16.567 *** | 0.001 *** | −5.780 | −0.816 | −0.009 | −0.016 | −1.661 | 0.447 *** | −6.374 | −3.043 | 2.501 *** | |
| JPN RCA | 0.008 | 0.001 | 0.001 | 0.036 | 0.015 | 0.001 | 0.009 | 0.001 | 0.007 | 0.008 | 0.194 | 0.090 | 0.047 | 0.060 | 0.055 | |
| JPN RTA | −0.291 | 0.001 ** | 0.001 ** | −2.380 | −2.860 | 0.001 ** | 0.007 ** | −7.367 | −3.797 | −0.498 | 0.106 ** | −0.537 | −4.849 | −1.218 | −1.807 | |
| JPN LI | −0.112 | 0.001 *** | 0.001 *** | −3.372 | −1.075 | 0.001 *** | 0.089 *** | −0.074 | −0.166 | −0.023 | 2.757 *** | 2.688 *** | −0.812 | 0.100 *** | −0.506 | |
| LAO RCA | 0.001 | 0.001 | 0.001 | 0.002 | 0.001 | 0.001 | 0.001 | 0.001 | 0.001 | 0.001 | 0.001 | 0.001 | 0.001 | 0.001 | 0.001 | |
| LAO RTA | −0.001 | −0.001 | −0.001 | −0.041 | −0.002 | −0.001 | −0.072 | −0.001 | −0.001 | −0.001 | −0.271 | −0.258 | −0.453 | −0.457 | −0.349 | |
| LAO LI | 0.021 *** | 0.021 *** | 0.021 *** | 0.687 *** | 0.021 *** | 0.021 *** | 0.020 *** | 0.021 *** | 0.021 *** | 0.021 *** | 0.009 *** | 0.005 *** | −0.799 | −0.089 | −0.227 | |
| MYS RCA | 0.368 | 0.793 | 0.001 | 0.025 | 2.468 * | 0.012 | 0.055 | 0.079 | 0.085 | 0.518 | 0.439 | 0.053 | 0.148 | 0.461 | 0.340 | |
| MYS RTA | 0.315 ** | 0.790 ** | 0.001 ** | −0.231 | 1.557 ** | −0.122 | 0.054 ** | −15.318 | −0.659 | 0.298 ** | 0.337 ** | 0.034 ** | −15.913 | −8.028 | −1.928 | |
| MYS LI | 2.536 *** | 0.436 *** | 0.001 *** | −0.531 | 14.735 *** | −0.181 | 0.001 *** | −4.655 | −0.002 | 1.540 *** | 12.526 *** | 0.352 *** | −23.972 | −2.784 | −1.493 | |
| MMR RCA | 27.568 * | 0.001 | 0.001 | 15.839 * | 26.461 * | 3.984 * | 0.001 | 91.153 * | 0.001 | 0.192 | 8.813 * | 12.630 * | 4.410 * | 14.639 * | 12.305 * | |
| MMR RTA | 27.502 ** | 0.001 ** | 0.001 ** | 15.198 ** | 26.455 ** | 3.983 ** | 0.001 ** | 91.056 ** | −1.848 | 0.190 ** | 8.783 ** | 12.628 ** | 4.235 ** | 14.528 ** | 12.026 ** | |
| MMR LI | 0.018 *** | 0.001 *** | 0.001 *** | −1.095 | 0.059 *** | 0.073 *** | 0.001 *** | 0.654 *** | −0.031 | 0.001 *** | 0.048 *** | 0.093 *** | 0.165 *** | 0.014 *** | 10.400 *** | |
| NZL RCA | 1.267 * | 4.660 * | 0.001 | 0.060 | 0.201 | 2.275 * | 0.001 | 0.531 | 0.709 | 0.023 | 4.523 * | 1.200 * | 0.103 | 0.089 | 1.051 * | |
| NZL RTA | 1.110 ** | 4.658 ** | 0.001 ** | −0.328 | −1.890 | 2.013 ** | 0.001 ** | 0.201 ** | 0.693 ** | −43.206 | 4.391 ** | −0.074 | −0.443 | −1.158 | 0.491 ** | |
| NZL LI | 11.179 *** | 0.063 *** | 0.001 *** | −5.018 | −3.085 | 8.914 *** | 0.001 *** | −0.502 | 0.019 *** | −11.234 | 4.602 *** | −2.249 | −1.753 | −0.936 | 0.306 *** | |
| PHL RCA | 2.275 * | 0.001 | 0.001 | 0.087 | 0.100 | 3.063 * | 0.001 | 0.031 | 0.001 | 26.555 * | 0.155 | 1.119 * | 0.197 | 0.024 | 1.333 * | |
| PHL RTA | 2.133 ** | 0.001 ** | 0.001 ** | 0.032 ** | 0.094 ** | 3.023 ** | 0.001 ** | 0.005 ** | 0.001 ** | 26.504 ** | −0.006 | 1.105 ** | 0.169 ** | −0.045 | 1.279 ** | |
| PHL LI | −0.214 | 0.001 *** | 0.001 *** | −1.153 | −0.036 | 3.591 *** | 0.001 *** | −0.180 | 0.001 *** | 0.223 *** | −1.979 | 0.213 *** | −0.215 | −0.250 | 1.037 *** | |
| SGP RCA | 0.078 | 1.461 * | 0.031 | 0.328 | 0.217 | 0.232 | 0.234 | 0.234 | 0.082 | 0.064 | 0.590 | 0.094 | 0.367 | 0.168 | 0.251 | |
| SGP RTA | −0.597 | 1.181 ** | −0.217 | −0.331 | −3.550 | −0.349 | 0.233 ** | −0.606 | −20.678 | −9.317 | −0.230 | −0.203 | −1.395 | −14.608 | −1.112 | |
| SGP LI | 0.232 *** | 1.285 *** | 0.020 *** | 6.633 *** | −5.718 | 0.372 *** | 0.013 *** | 2.313 *** | −1.392 | −1.196 | 3.109 *** | 0.186 *** | 0.673 *** | −6.529 | −0.855 | |
| KOR RCA | 0.353 | 0.001 | 0.045 | 0.057 | 0.257 | 0.713 | 0.124 | 0.033 | 0.048 | 0.866 | 0.066 | 0.163 | 0.091 | 0.026 | 0.179 | |
| KOR RTA | 0.344 ** | 0.001 ** | 0.028 ** | −1.953 | −1.783 | 0.349 ** | 0.122 ** | 0.031 ** | 0.046 ** | −0.996 | −2.727 | −0.076 | −1.774 | −9.189 | −1.244 | |
| KOR LI | 2.516 *** | 0.001 *** | 0.018 *** | −12.806 | −0.865 | 17.073 *** | 0.010 *** | 0.205 *** | 0.024 *** | 0.582 *** | −0.724 | 1.910 *** | −0.523 | −7.419 | −0.997 | |
| THA RCA | 0.319 | 0.440 | 0.082 | 1.732 * | 1.358 * | 1.809 * | 0.141 | 5.367 * | 0.050 | 0.218 | 0.007 | 0.600 | 1.310 * | 0.502 | 1.528 * | |
| THA RTA | 0.082 ** | 0.412 ** | −13.901 | 1.553 ** | −0.396 | 1.664 ** | 0.140 ** | 5.358 ** | −1.636 | 0.114 ** | −0.708 | 0.513 ** | 1.022 ** | −6.549 | 1.021 ** | |
| THA LI | −0.111 | 0.002 *** | −2.631 | 3.471 *** | −3.000 | 3.973 *** | 0.060 *** | 8.537 *** | −2.162 | 0.009 *** | −0.831 | 0.684 *** | −0.113 | −7.890 | 0.933 *** | |
| VNM RCA | 0.722 | 0.890 | 0.107 | 6.972 * | 3.605 * | 5.925 * | 0.186 | 6.276 * | 2.144 * | 0.630 | 0.058 | 6.700 * | 9.120 * | 4.448 * | 5.660 * | |
| VNM RTA | 0.596 ** | 0.888 ** | 0.105 ** | 6.940 ** | 3.447 ** | 5.296 ** | 0.184 ** | 6.217 ** | −14.721 | 0.430 ** | 0.056 ** | 6.336 ** | 8.998 ** | 4.163 ** | 5.461 ** | |
| VNM LI | −0.030 | 0.001 *** | 0.004 *** | 1.602 *** | 0.012 *** | −0.953 | 0.001 *** | 0.259 *** | −0.503 | −0.020 | 0.002 *** | −0.373 | 0.371 *** | −0.373 | 4.005 *** |
| Countries | AUS | BRN | KHM | CHN | IDN | JPN | LAO | MYS | MMR | NZL | PHL | SGP | KOR | THA | VNM | RCEP |
|---|---|---|---|---|---|---|---|---|---|---|---|---|---|---|---|---|
| AUS RCA | 0.157 | 0.099 | 0.306 | 0.090 | 0.843 | 0.138 | 0.446 | 0.056 | 0.121 | 0.017 | 0.945 | 0.010 | 0.368 | 18.382 * | 0.700 | |
| AUS RTA | 0.024 ** | −0.038 | −0.703 | −1.067 | 0.639 ** | 0.136 ** | −0.660 | −71.383 | −1.518 | −0.093 | 0.905 ** | −0.043 | −2.225 | 12.915 ** | −0.356 | |
| AUS LI | −0.043 | −0.002 | −8.403 | −2.209 | 14.479 *** | 0.002 *** | −2.901 | −0.738 | −4.143 | −0.019 | 2.655 *** | −0.114 | −9.413 | 10.850 *** | −0.299 | |
| BRN RCA | 0.136 | 0.001 | 0.322 | 0.001 | 0.009 | 0.001 | 0.196 | 0.001 | 0.001 | 0.001 | 0.082 | 0.007 | 0.001 | 0.035 | 0.040 | |
| BRN RTA | −0.383 | 0.001 ** | 0.084 ** | −0.473 | −0.010 | 0.001 ** | −3.317 | −20.362 | −2.510 | −0.099 | −0.979 | −0.013 | −0.341 | −3.410 | −1.351 | |
| BRN LI | 6.368 *** | 0.001 *** | 5.600 *** | −0.240 | 2.031 *** | 0.001 *** | −10.442 | −1.004 | −0.131 | −0.006 | −2.478 | 0.547 *** | −0.260 | 0.015 *** | −0.956 | |
| KHM RCA | 0.104 | 0.001 | 0.982 | 0.001 | 0.145 | 0.001 | 0.002 | 0.001 | 0.001 | 0.001 | 0.034 | 2.445 * | 1.034 * | 0.168 | 0.499 | |
| KHM RTA | −0.015 | 0.001 ** | 0.868 ** | −0.011 | 0.072 ** | 0.001 ** | −0.009 | 0.001 ** | −2.960 | −0.228 | 0.018 ** | 2.428 ** | 0.746 ** | −0.450 | 0.268 ** | |
| KNM LI | 0.177 *** | 0.001 *** | 8.219 *** | −0.074 | 2.631 *** | 0.001 *** | −0.048 | 0.001 *** | −0.249 | −0.079 | 0.163 *** | 10.453 *** | −1.681 | −19.511 | 0.195 *** | |
| CHN RCA | 0.760 | 0.147 | 0.004 | 0.102 | 1.377 * | 0.001 | 1.458 * | 0.004 | 0.824 | 1.321 * | 0.295 | 1.751 * | 2.056 * | 0.185 | 1.129 * | |
| CHN RTA | 0.525 ** | −0.289 | −1.316 | −1.660 | 1.141 ** | 0.001 ** | 1.295 ** | −2.733 | −6.057 | 1.183 ** | 0.268 ** | 1.595 ** | 1.150 ** | −0.249 | 0.742 ** | |
| CHN LI | −0.922 | −0.017 | −0.101 | −6.742 | 7.349 *** | 0.001 *** | 2.130 *** | −1.508 | −6.698 | 1.409 *** | 0.738 *** | 6.627 *** | −1.205 | −1.059 | 0.604 *** | |
| IDN RCA | 0.842 | 0.277 | 0.008 | 1.742 * | 5.449 * | 0.554 | 0.676 | 0.010 | 0.260 | 0.052 | 0.415 | 0.462 | 0.666 | 5.556 * | 2.234 * | |
| IDN RTA | 0.758 ** | 0.275 ** | 0.007 ** | 1.621 ** | 5.416 ** | 0.552 ** | 0.586 ** | −2.284 | 0.183 ** | −0.246 | 0.393 ** | 0.427 ** | 0.641 ** | 5.339 ** | 2.167 ** | |
| IDN LI | −0.209 | 0.001 *** | 0.001 *** | −1.558 | 2.893 *** | 0.001 *** | −0.367 | −0.123 | −0.035 | −0.144 | −0.274 | −0.106 | −0.063 | −0.016 | 1.882 *** | |
| JPN RCA | 0.156 | 0.009 | 0.080 | 0.272 | 0.020 | 0.002 | 0.026 | 0.025 | 0.286 | 0.006 | 0.074 | 0.174 | 0.086 | 0.941 | 0.199 | |
| JPN RTA | −0.795 | −0.006 | −0.077 | −1.079 | −6.419 | 0.002 ** | −0.945 | −37.887 | −2.116 | −2.678 | 0.071 ** | −1.837 | −6.582 | −15.885 | −2.495 | |
| JPN LI | −0.021 | −0.001 | 0.003 *** | 4.594 *** | −2.637 | 0.001 *** | −0.252 | −0.379 | 0.052 *** | −0.403 | 0.426 *** | 1.320 *** | −1.660 | −1.043 | −2.007 | |
| LAO RCA | 0.001 | 0.001 | 0.001 | 0.001 | 0.001 | 0.001 | 0.001 | 0.001 | 0.001 | 0.001 | 0.001 | 0.029 | 0.003 | 0.001 | 0.002 | |
| LAO RTA | −0.212 | −0.001 | −0.001 | −0.002 | −1.515 | −0.002 | −0.069 | −0.001 | −41.659 | −0.001 | −0.009 | 0.010 ** | −0.038 | −0.039 | −0.043 | |
| LAO LI | −0.165 | 0.001 *** | 0.001 *** | −0.057 | −0.351 | −0.006 | −0.017 | 0.001 *** | −1.470 | 0.001 *** | −0.019 | 0.985 *** | 1.064 *** | 0.034 *** | −0.087 | |
| MYS RCA | 0.895 | 0.540 | 0.009 | 0.403 | 0.099 | 0.828 | 0.045 | 0.031 | 0.319 | 0.046 | 0.440 | 1.109 * | 0.311 | 2.593 * | 0.600 | |
| MYS RTA | 0.430 ** | 0.382 ** | 0.007 ** | −1.054 | −1.237 | 0.763 ** | 0.040 ** | −29.987 | −0.906 | −0.087 | 0.372 ** | 1.035 ** | −0.301 | 0.998 ** | −0.098 | |
| MYS LI | 3.344 *** | 0.201 *** | 0.001 *** | −19.627 | −6.727 | 11.289 *** | 0.001 *** | −3.955 | −0.355 | −0.128 | 8.552 *** | 5.401 *** | −1.690 | 3.694 *** | −0.105 | |
| MMR RCA | 63.104 * | 20.466 * | 0.001 | 3.998 * | 4.051 * | 31.988 * | 0.001 | 12.877 * | 10.742 * | 0.137 | 9.130 * | 1.615 * | 2.787 * | 14.463 * | 6.651 * | |
| MMR RTA | 63.052 ** | 20.403 ** | 0.001 ** | 3.970 ** | 4.049 ** | 31.971 ** | 0.001 ** | 12.861 ** | 9.780 ** | 0.135 ** | 9.125 ** | 1.611 ** | 2.524 ** | 14.462 ** | 6.598 ** | |
| MMR LI | 0.032 *** | 0.001 *** | 0.001 *** | 0.019 *** | 0.008 *** | 0.592 *** | 0.001 *** | 0.081 *** | −0.048 | 0.001 *** | 0.093 *** | 0.006 *** | −0.822 | 0.038 *** | 5.883 *** | |
| NZL RCA | 1.266 * | 2.472 * | 1.831 * | 5.453 * | 0.061 | 2.186 * | 8.633 * | 1.063 * | 0.394 | 0.275 | 1.589 * | 2.521 * | 3.262 * | 0.744 | 2.602 * | |
| NZL RTA | 1.102 ** | 2.468 ** | 1.829 ** | 4.498 ** | −0.240 | 1.956 ** | 8.629 ** | 0.677 ** | −6.554 | 0.266 ** | 1.580 ** | 0.181 ** | 0.784 ** | −9.697 | 1.859 ** | |
| NZL LI | 2.992 *** | 0.012 *** | 0.004 *** | 8.824 *** | −0.306 | 2.647 *** | 0.006 *** | −0.451 | −0.020 | 0.085 *** | 0.655 *** | −4.141 | −4.713 | −5.595 | 1.436 *** | |
| PHL RCA | 0.050 | 0.087 | 0.111 | 0.427 | 0.239 | 1.719 * | 0.001 | 0.125 | 0.004 | 0.003 | 0.441 | 2.244 * | 0.154 | 1.389 * | 1.011 * | |
| PHL RTA | 0.039 ** | 0.085 ** | 0.110 ** | −0.194 | 0.176 ** | 1.709 ** | 0.001 ** | 0.108 ** | −0.369 | −0.331 | 0.424 ** | 2.178 ** | 0.134 ** | −0.095 | 0.798 ** | |
| PHL LI | −0.014 | 0.001 *** | 0.002 *** | −17.394 | −0.524 | 18.725 *** | 0.001 *** | 0.085 *** | −0.028 | −0.524 | 1.689 *** | 4.902 *** | 0.072 *** | −6.991 | 0.504 *** | |
| SGP RCA | 0.032 | 0.506 | 0.014 | 0.016 | 0.017 | 0.030 | 0.006 | 0.100 | 0.013 | 0.007 | 0.028 | 0.011 | 0.020 | 0.150 | 0.045 | |
| SGP RTA | −0.966 | 0.404 ** | −0.018 | −0.301 | −0.576 | −0.136 | 0.005 ** | −0.368 | −15.430 | −2.030 | −0.431 | −0.054 | −0.552 | −3.098 | −0.420 | |
| SGP LI | −0.488 | 1.280 *** | 0.044 *** | −2.015 | −1.486 | −0.036 | 0.001 *** | 5.072 *** | −1.686 | −0.395 | −0.213 | 0.048 *** | −1.092 | 0.967 *** | −0.328 | |
| KOR RCA | 0.046 | 0.003 | 0.014 | 0.187 | 0.035 | 1.606 * | 0.016 | 0.070 | 0.001 | 3.765 * | 0.086 | 0.059 | 0.163 | 0.104 | 0.372 | |
| KOR RTA | 0.035 ** | −0.009 | −3.028 | −1.751 | −0.451 | 1.380 ** | 0.015 ** | −0.975 | −2.572 | 3.214 ** | −1.155 | 0.035 ** | −6.714 | −13.726 | −1.183 | |
| KOR LI | 0.149 *** | −0.002 | −0.041 | −7.959 | −0.529 | 21.548 *** | 0.001 *** | −0.959 | −0.093 | 1.883 *** | −0.219 | 0.384 *** | −3.339 | −10.821 | −0.846 | |
| THA RCA | 2.027 * | 0.198 | 0.232 | 0.892 | 0.019 | 6.235 * | 0.034 | 0.266 | 0.093 | 1.451 * | 0.008 | 0.650 | 5.930 * | 2.128 * | 2.120 * | |
| THA RTA | 1.715 ** | 0.196 ** | −1.133 | 0.130 ** | −0.898 | 6.097 ** | 0.029 ** | −0.147 | −2.040 | −0.916 | −0.196 | 0.640 ** | 5.727 ** | −2.709 | 1.565 ** | |
| THA LI | 1.381 *** | 0.003 *** | −0.174 | −8.240 | −2.585 | 16.011 *** | 0.010 *** | −1.823 | −2.944 | −0.432 | −0.252 | 0.855 *** | 2.463 *** | −4.273 | 0.983 *** | |
| VNM RCA | 4.033 * | 0.433 | 0.441 | 4.687 * | 0.176 | 15.592 * | 0.044 | 1.576 * | 0.008 | 8.564 * | 1.062 * | 3.065 * | 12.019 * | 4.625 * | 7.258 * | |
| VNM RTA | 3.492 ** | 0.401 ** | 0.248 ** | 4.538 ** | −3.110 | 15.375 ** | 0.042 ** | 1.004 ** | −12.277 | 8.206 ** | 0.221 ** | 2.900 ** | 11.977 ** | 4.112 ** | 6.959 ** | |
| VNM LI | −0.034 | −0.001 | −0.013 | 0.025 *** | −2.998 | 3.731 *** | 0.001 *** | −0.709 | −0.450 | 0.002 *** | −0.188 | −0.172 | 1.763 *** | −0.957 | 4.296 *** |
| Countries | AUS | BRN | KHM | CHN | IDN | JPN | LAO | MYS | MMR | NZL | PHL | SGP | KOR | THA | VNM | RCEP |
|---|---|---|---|---|---|---|---|---|---|---|---|---|---|---|---|---|
| AUS RCA | 0.011 | 0.148 | 0.404 | 0.007 | 0.091 | 0.007 | 0.120 | 0.006 | 0.214 | 0.003 | 0.903 | 0.001 | 0.043 | 4.245 * | 0.305 | |
| AUS RTA | 0.009 ** | −0.163 | −0.158 | −1.232 | −0.019 | 0.006 ** | −1.568 | −36.428 | −1.717 | −1.720 | 0.774 ** | −0.229 | −11.397 | −1.014 | −1.392 | |
| AUS LI | 0.001 *** | 0.001 *** | 13.833 *** | −1.063 | 2.332 *** | 0.001 *** | −2.071 | −0.158 | −0.927 | −0.207 | 3.961 *** | −0.348 | −18.825 | 3.473 *** | −0.994 | |
| BRN RCA | 0.001 | 0.001 | 0.005 | 0.001 | 0.001 | 0.001 | 0.049 | 0.001 | 0.001 | 0.009 | 0.008 | 0.001 | 0.004 | 0.001 | 0.002 | |
| BRN RTA | −0.133 | 0.001 ** | −0.277 | −0.647 | −0.108 | 0.001 ** | −2.907 | −1.154 | −4.423 | −11.214 | −0.742 | −0.237 | −3.906 | −2.465 | −1.376 | |
| BRN LI | 0.057 *** | 0.001 *** | 0.071 *** | −0.018 | −0.010 | 0.001 *** | 0.076 *** | 0.001 *** | −0.016 | −0.028 | −0.017 | −0.014 | −0.090 | −0.011 | −1.053 | |
| KHM RCA | 0.281 | 0.001 | 0.144 | 0.001 | 0.001 | 0.021 | 0.034 | 0.001 | 0.001 | 0.001 | 0.001 | 0.005 | 0.284 | 0.336 | 0.133 | |
| KHM RTA | 0.146 ** | 0.001 ** | −0.159 | −0.014 | −1.603 | 0.020 ** | −0.031 | 0.001 ** | −22.524 | −0.076 | −0.037 | −0.111 | −1.432 | −1.261 | −0.791 | |
| KNM LI | 0.397 *** | 0.001 *** | 0.560 *** | −0.003 | −0.347 | 0.001 *** | 0.054 *** | 0.001 *** | −0.071 | −0.001 | −0.021 | −0.027 | −1.384 | 0.842 *** | −0.504 | |
| CHN RCA | 1.095 * | 0.183 | 0.318 | 0.345 | 4.661 * | 0.583 | 1.728 * | 0.023 | 1.346 * | 0.600 | 0.827 | 1.145 * | 1.487 * | 0.275 | 2.076 * | |
| CHN RTA | 0.771 ** | 0.177 ** | 0.128 ** | 0.076 ** | 4.635 ** | 0.579 ** | 1.678 ** | −0.471 | −1.487 | 0.454 ** | 0.822 ** | 1.113 ** | 1.083 ** | 0.098 ** | 1.938 ** | |
| CHN LI | −2.918 | 0.001 *** | −0.001 | −0.830 | 7.610 *** | 0.007 *** | 0.341 *** | −0.243 | −2.495 | −0.275 | 0.398 *** | 0.456 *** | −1.605 | −0.447 | 1.553 *** | |
| IDN RCA | 1.267 * | 0.218 | 0.006 | 0.185 | 1.458 * | 0.001 | 0.294 | 0.016 | 0.165 | 0.041 | 0.123 | 0.118 | 1.241 * | 0.317 | 0.631 | |
| IDN RTA | 1.261 ** | 0.216 ** | 0.005 ** | −0.037 | 1.431 ** | 0.001 ** | −0.012 | 0.015 ** | 0.163 ** | −0.127 | 0.010 ** | 0.100 ** | 1.102 ** | 0.251 ** | 0.501 ** | |
| IDN LI | 2.213 *** | 0.008 *** | 0.001 *** | −10.143 | 15.923 *** | 0.001 *** | −3.642 | 0.003 *** | 0.029 *** | −0.162 | −5.152 | 0.237 *** | 0.620 *** | 0.065 *** | 0.472 *** | |
| JPN RCA | 0.089 | 0.010 | 1.510 * | 0.062 | 0.020 | 1.589 * | 0.078 | 0.005 | 0.143 | 0.023 | 0.205 | 0.058 | 0.060 | 0.199 | 0.078 | |
| JPN RTA | −0.065 | 0.009 ** | 1.509 ** | −4.190 | −2.941 | 1.586 ** | 0.019 ** | −1.756 | −0.884 | −1.976 | 0.201 ** | −1.479 | −11.857 | −9.289 | −3.461 | |
| JPN LI | 0.252 *** | 0.001 *** | 0.067 *** | −1.072 | −0.248 | 0.025 *** | 0.240 *** | −0.004 | 0.055 *** | −0.023 | 0.961 *** | 0.449 *** | −0.636 | −0.066 | −2.495 | |
| LAO RCA | 0.001 | 0.001 | 0.001 | 0.001 | 0.001 | 0.001 | 0.001 | 0.001 | 0.001 | 0.001 | 0.001 | 0.218 | 0.001 | 0.004 | 0.003 | |
| LAO RTA | −0.007 | −0.001 | −0.031 | −0.562 | −0.001 | −2.655 | −0.001 | −0.001 | −0.001 | −0.001 | −0.026 | 0.107 ** | −0.557 | −0.812 | −0.596 | |
| LAO LI | −0.001 | −0.001 | −0.001 | −0.137 | −0.001 | −0.070 | −0.001 | −0.001 | −0.001 | −0.001 | −0.001 | 0.582 *** | −0.442 | 0.067 *** | −0.604 | |
| MYS RCA | 1.453 * | 1.762 * | 0.057 | 0.077 | 0.278 | 0.071 | 0.001 | 0.017 | 0.460 | 0.091 | 0.349 | 0.100 | 0.155 | 0.217 | 0.270 | |
| MYS RTA | 1.318 ** | 1.720 ** | 0.027 ** | −0.435 | −0.043 | 0.050 ** | 0.001 ** | −3.577 | −0.215 | −0.154 | 0.305 ** | 0.066 ** | −1.064 | −0.470 | −0.060 | |
| MYS LI | 15.993 *** | 1.590 *** | 0.018 *** | −16.830 | −0.725 | 1.745 *** | 0.001 *** | −0.997 | 0.040 *** | −0.444 | 15.568 *** | 0.763 *** | −14.773 | −1.948 | −0.106 | |
| MMR RCA | 4.423 * | 0.001 | 0.001 | 1.158 * | 0.001 | 0.258 | 0.001 | 0.394 | 5.702 * | 0.352 | 0.231 | 0.302 | 0.515 | 0.547 | 0.695 | |
| MMR RTA | 4.397 ** | 0.001 ** | 0.001 ** | 1.149 ** | −0.053 | 0.217 ** | 0.001 ** | 0.375 ** | 5.692 ** | 0.345 ** | 0.214 ** | 0.295 ** | −0.186 | 0.526 ** | 0.583 ** | |
| MMR LI | 0.423 *** | 0.001 *** | 0.001 *** | 13.706 *** | −0.501 | 0.068 *** | 0.001 *** | 0.262 *** | 0.042 *** | 0.039 *** | −0.408 | 0.292 *** | −14.048 | 0.126 *** | 0.735 *** | |
| NZL RCA | 1.537 * | 3.892 * | 18.029 * | 2.482 * | 0.002 | 0.572 | 0.001 | 0.696 | 0.004 | 0.043 | 6.343 * | 1.501 * | 1.413 * | 0.081 | 1.673 * | |
| NZL RTA | 1.298 ** | 3.881 ** | 17.884 ** | 1.639 ** | −0.189 | 0.410 ** | 0.001 ** | 0.188 ** | −6.019 | −1.022 | 6.283 ** | 1.184 ** | −10.492 | −5.367 | 0.601 ** | |
| NZL LI | 11.266 *** | 0.044 *** | 0.099 *** | 10.380 *** | −0.210 | 1.407 *** | 0.001 *** | −0.525 | −0.021 | −0.163 | 5.970 *** | 1.849 *** | −27.116 | −2.981 | 0.583 *** | |
| PHL RCA | 1.398 * | 6.646 * | 0.064 | 0.096 | 0.078 | 0.745 | 0.001 | 0.258 | 0.156 | 1.013 * | 0.483 | 0.214 | 0.366 | 0.253 | 0.452 | |
| PHL RTA | 1.374 ** | 6.637 ** | 0.061 ** | −0.016 | 0.026 ** | 0.740 ** | 0.001 ** | 0.190 ** | −0.016 | 1.012 ** | 0.450 ** | 0.209 ** | 0.194 ** | 0.221 ** | 0.395 ** | |
| PHL LI | 1.018 *** | 0.088 *** | 0.002 *** | −8.970 | −1.481 | 13.159 *** | 0.001 *** | −1.058 | −0.030 | 0.103 *** | 1.960 *** | 0.711 *** | −5.302 | −0.199 | 0.499 *** | |
| SGP RCA | 0.087 | 0.677 | 0.028 | 0.006 | 0.095 | 0.007 | 0.055 | 0.128 | 0.022 | 0.049 | 0.047 | 0.032 | 0.026 | 0.189 | 0.070 | |
| SGP RTA | −1.248 | 0.668 ** | 0.026 ** | −0.690 | −0.162 | −0.190 | 0.053 ** | −0.278 | −0.551 | −7.720 | −0.302 | −0.018 | −1.492 | −2.323 | −0.490 | |
| SGP LI | 0.226 *** | 1.294 *** | 0.072 *** | −7.230 | 4.343 *** | −1.242 | 0.007 *** | 5.537 *** | 0.033 *** | −1.395 | 0.138 *** | 0.613 *** | −3.839 | 1.443 *** | −0.394 | |
| KOR RCA | 0.156 | 0.158 | 0.120 | 0.097 | 0.017 | 1.280 * | 0.085 | 0.060 | 0.056 | 0.238 | 0.050 | 0.044 | 0.065 | 0.045 | 0.254 | |
| KOR RTA | 0.155 ** | 0.152 ** | 0.112 ** | −0.621 | −0.340 | 1.215 ** | −0.174 | −0.050 | −0.511 | −3.045 | −1.092 | −0.005 | −3.706 | −5.920 | −0.403 | |
| KOR LI | 1.019 *** | 0.016 *** | 0.043 *** | −9.718 | −1.273 | 31.011 *** | 0.004 *** | −0.006 | −0.033 | −1.196 | −1.032 | 0.395 *** | −5.598 | −13.632 | −0.357 | |
| THA RCA | 11.172 * | 4.023 * | 1.582 * | 0.590 | 0.125 | 10.248 * | 0.491 | 1.075 * | 1.460 * | 11.174 * | 0.306 | 1.304 * | 3.639 * | 0.318 | 3.717 * | |
| THA RTA | 11.149 ** | 4.001 ** | 1.278 ** | −0.097 | −1.296 | 10.192 ** | 0.488 ** | 0.913 ** | 0.942 ** | 7.881 ** | −0.104 | 1.294 ** | 3.587 ** | −3.587 | 3.287 ** | |
| THA LI | 3.694 *** | 0.021 *** | 0.192 *** | −6.599 | −2.923 | 9.090 *** | 0.058 *** | −0.155 | −0.358 | −0.152 | −0.315 | 0.552 *** | 0.500 *** | −3.603 | 2.840 *** | |
| VNM RCA | 5.483 * | 0.090 | 1.493 * | 0.250 | 0.066 | 8.018 * | 0.671 | 0.468 | 0.034 | 6.165 * | 0.042 | 1.410 * | 5.101 * | 3.357 * | 3.254 * | |
| VNM RTA | 5.469 ** | 0.084 ** | 1.217 ** | 0.201 ** | 0.028 ** | 7.979 ** | 0.665 ** | 0.420 ** | −0.802 | 6.057 ** | −0.127 | 1.329 ** | 5.090 ** | 3.200 ** | 3.203 ** | |
| VNM LI | 0.439 *** | 0.001 *** | −0.053 | −1.392 | −0.083 | 1.875 *** | 0.006 *** | −0.139 | −0.076 | 0.031 *** | −0.118 | −0.375 | 0.638 *** | −0.752 | 2.981 *** |
Appendix C
| Countries | AUS | BRN | KHM | CHN | IDN | JPN | LAO | MYS | MMR | NZL | PHL | SGP | KOR | THA | VNM | RCEP |
|---|---|---|---|---|---|---|---|---|---|---|---|---|---|---|---|---|
| AUS | A | D | W | D | S | A | D | D | D | W | A | A | D | D | D | |
| BRN | D | D | W | W | W | A | D | D | D | D | D | D | W | D | D | |
| KHM | A | A | A | W | A | S | A | D | A | A | A | A | S | D | A | |
| CHN | W | D | D | W | S | W | A | D | D | S | A | S | A | D | S | |
| IDN | W | A | W | A | S | A | S | D | D | D | S | A | S | S | S | |
| JPN | D | A | W | D | D | A | W | D | W | D | W | W | W | W | D | |
| LAO | W | W | D | W | D | W | A | W | W | W | W | D | W | D | D | |
| MYS | W | A | D | D | D | W | W | D | D | A | A | W | D | D | D | |
| MMR | S | S | D | W | W | S | A | S | W | A | S | S | W | W | S | |
| NZL | S | S | A | S | D | S | S | S | D | S | W | W | W | W | S | |
| PHL | A | S | W | D | D | S | A | D | D | D | W | D | A | D | D | |
| SGP | D | S | D | D | D | A | A | D | D | D | A | A | W | W | W | |
| KOR | D | A | D | D | D | S | A | D | D | S | W | D | S | D | D | |
| THA | W | W | W | D | D | S | A | A | D | D | D | A | D | D | W | |
| VNM | S | S | A | S | D | W | A | S | D | W | S | S | W | S | S |
| Countries | AUS | BRN | KHM | CHN | IDN | JPN | LAO | MYS | MMR | NZL | PHL | SGP | KOR | THA | VNM | RCEP |
|---|---|---|---|---|---|---|---|---|---|---|---|---|---|---|---|---|
| AUS | A | D | D | D | W | A | D | D | D | D | A | D | D | D | D | |
| BRN | D | A | W | D | D | A | D | A | D | W | W | W | W | W | D | |
| KHM | S | A | A | D | D | A | W | A | D | D | W | D | S | D | S | |
| CHN | W | D | A | D | S | A | A | D | D | D | D | S | W | D | S | |
| IDN | W | A | A | A | S | A | D | D | W | D | W | S | D | W | S | |
| JPN | D | A | A | D | D | A | A | D | D | D | A | W | D | W | D | |
| LAO | W | W | W | W | W | W | W | W | W | W | W | W | D | D | D | |
| MYS | A | A | A | D | S | D | A | D | D | A | A | A | D | D | D | |
| MMR | S | A | A | W | S | S | A | S | D | A | S | S | S | S | S | |
| NZL | S | S | A | D | D | S | A | W | A | D | S | W | D | D | S | |
| PHL | W | A | A | W | W | S | A | W | A | S | D | S | W | D | S | |
| SGP | W | S | W | W | D | W | A | W | D | D | W | W | W | D | D | |
| KOR | A | A | A | D | D | A | A | A | A | W | D | W | D | D | D | |
| THA | W | A | D | S | W | S | A | S | D | A | D | A | W | D | S | |
| VNM | W | A | A | S | S | W | A | S | W | W | A | W | S | W | S |
| Countries | AUS | BRN | KHM | CHN | IDN | JPN | LAO | MYS | MMR | NZL | PHL | SGP | KOR | THA | VNM | RCEP |
|---|---|---|---|---|---|---|---|---|---|---|---|---|---|---|---|---|
| AUS | W | D | D | D | A | A | D | D | D | D | A | D | D | S | D | |
| BRN | W | A | A | D | W | A | D | D | D | D | D | W | D | W | D | |
| KHM | W | A | A | D | A | A | D | A | D | D | A | S | W | D | A | |
| CHN | W | D | D | D | S | A | S | D | D | S | A | S | W | D | S | |
| IDN | W | A | A | W | S | A | W | D | W | D | W | W | W | W | S | |
| JPN | D | D | W | W | D | A | D | D | W | D | A | W | D | D | D | |
| LAO | D | W | W | D | D | D | D | W | D | W | D | A | W | W | D | |
| MYS | A | A | A | D | D | A | A | D | D | D | A | S | D | S | D | |
| MMR | S | S | A | S | S | S | A | S | W | A | S | S | W | S | S | |
| NZL | S | S | S | S | D | S | S | W | D | A | S | W | W | D | S | |
| PHL | W | A | A | D | W | S | A | A | D | D | A | S | A | W | S | |
| SGP | D | A | W | D | D | D | A | W | D | D | D | W | D | W | D | |
| KOR | A | D | D | D | D | S | A | D | D | S | D | A | D | D | D | |
| THA | S | A | D | W | D | S | A | D | D | W | D | A | S | W | S | |
| VNM | W | W | W | S | D | S | A | W | D | S | W | W | S | W | S |
| Countries | AUS | BRN | KHM | CHN | IDN | JPN | LAO | MYS | MMR | NZL | PHL | SGP | KOR | THA | VNM | RCEP |
|---|---|---|---|---|---|---|---|---|---|---|---|---|---|---|---|---|
| AUS | A | W | W | D | W | A | D | D | D | D | A | D | D | W | D | |
| BRN | W | A | W | D | D | A | W | W | D | D | D | D | D | D | D | |
| KHM | A | A | W | D | D | A | W | A | D | D | D | D | D | W | D | |
| CHN | W | A | W | W | S | A | S | D | W | W | A | S | W | W | S | |
| IDN | S | A | A | D | S | A | D | A | A | D | W | A | S | A | A | |
| JPN | W | A | S | D | D | S | A | D | W | D | A | W | D | D | D | |
| LAO | D | D | D | D | D | D | D | D | D | D | D | A | D | W | D | |
| MYS | S | S | A | D | D | A | A | D | W | D | A | A | D | D | D | |
| MMR | S | A | A | S | D | A | A | A | S | A | W | A | D | A | A | |
| NZL | S | S | S | S | D | A | A | W | D | D | S | S | W | D | S | |
| PHL | S | S | A | D | W | A | A | W | D | S | A | A | W | W | A | |
| SGP | W | A | A | D | W | D | A | W | W | D | W | W | D | W | D | |
| KOR | A | A | A | D | D | S | W | D | D | D | D | W | D | D | D | |
| THA | S | S | S | D | D | S | A | W | W | W | D | S | S | D | S | |
| VNM | S | A | W | W | W | S | A | W | D | S | D | W | S | W | S |
References
- Pedroza-Gutiérrez, C.; Hernández, J. Social Networks and Supply Chain Management in Fish Trade. Sage Open 2020, 10. [Google Scholar] [CrossRef]
- Garcia, S.M.; Rosenberg, A.A. Food Security and Marine Capture Fisheries: Characteristics, Trends, Drivers and Future Perspectives. Philos. Trans. R. Soc. B Biol. Sci. 2010, 365, 2869–2880. [Google Scholar] [CrossRef] [PubMed]
- Kittinger, J.; Teneva, L.; Koike, H.; Stamoulis, K.; Kittinger, D.; Oleson, K.; Conkin, E.; Gomes, M.; Wilcox, B.; Friedlander, A. From Reef to Table: Social and Ecological Factors Affecting Coral Reef Fisheries, Artisanal Seafood Supply Chains, and Seafood Security. PLoS ONE 2015, 10, e0123856. [Google Scholar] [CrossRef] [PubMed]
- Allison, E.; Perry, A.; Badjeck, M.C.; Neil Adger, W.; Brown, K.; Conway, D.; Halls, A.; Pilling, G.; Reynolds, J.; Andrew, N.; et al. Vulnerability of National Economies to the Impacts of Climate Change on Fisheries. Fish Fish. 2009, 10, 173–196. [Google Scholar] [CrossRef]
- Yegorov, Y. Sustainable Development of Oil Production in the Arctic Shelf and Evolution of Fish Stock. In Handbook of Research on International Collaboration, Economic Development, and Sustainability in the Arctic; Erokhin, V., Gao, T., Zhang, X., Eds.; IGI Global: Hershey, PA, USA, 2019; pp. 451–469. [Google Scholar] [CrossRef]
- Fox, M.; Mitchell, M.; Dean, M.; Elliott, C.; Campbell, K. The Seafood Supply Chain from a Fraudulent Perspective. Food Secur. 2018, 10, 939–963. [Google Scholar] [CrossRef]
- Shehata, H.R.; Bourque, D.; Steinke, D.; Chen, S.; Hanner, R. Survey of Mislabelling across Finfish Supply Chain Reveals Mislabelling both outside and within Canada. Food Res. Int. 2019, 121, 723–729. [Google Scholar] [CrossRef]
- Kumar, R.; Kumar, R.R.; Stauvermann, P.J.; Arora, P. Effect of Fisheries Subsidies Negotiations on Fish Production and Interest Rate. J. Risk Financ. Manag. 2020, 13, 297. [Google Scholar] [CrossRef]
- Erokhin, V.; Gao, T. Handbook of Research on Globalized Agricultural Trade and New Challenges for Food Security; IGI Global: Hershey, PA, USA, 2020. [Google Scholar] [CrossRef]
- Food and Agriculture Organization. How Is COVID-19 Affecting the Fisheries and Aquaculture Food Systems; Food and Agriculture Organization of the United Nations: Rome, Italy, 2020. [Google Scholar]
- Bailey, M.; Bush, S.R.; Miller, A.; Kochen, M. The Role of Traceability in Transforming Seafood Governance in the Global South. Curr. Opin. Environ. Sustain. 2016, 18, 25–32. [Google Scholar] [CrossRef]
- Food and Agriculture Organization. The State of World Fisheries and Aquaculture 2020; Food and Agriculture Organization of the United Nations: Rome, Italy, 2020. [Google Scholar]
- Kanaga, V.; Radhakrishnan, K.; Kumar, S.R.; Karthy, A.; Vijayarahavan, V. Influencing Variable Effect on Fish Trade a View with Liberalization and WTO Regime. Indian J. Econ. Dev. 2017, 13, 693–700. [Google Scholar] [CrossRef]
- Shamsuzzaman, M.M.; Mozumder, M.M.H.; Mitu, S.J.; Ahamad, A.F.; Bhyuian, S.M. The Economic Contribution of Fish and Fish Trade in Bangladesh. Aquac. Fish. 2020, 5, 174–181. [Google Scholar] [CrossRef]
- Devadason, E.S.; Mubarik, S. ASEAN and the EU: An Assessment of Interregional Trade Potentials. Int. Econ. Econ. Policy 2020, 17, 705–726. [Google Scholar] [CrossRef]
- Nielsen, M. Modelling Fish Trade Liberalisation: Does Fish Trade Liberalisation Result in Welfare Gains or Losses? Mar. Policy 2009, 33, 1–7. [Google Scholar] [CrossRef]
- Ruland, J. ASEAN and the European Union: A Bumpy Inter-Regional Relationship; University of Bonn: Bonn, Germany, 2001. [Google Scholar]
- Katada, S.N.; Solis, M. Cross Regional Trade Agreements: Understanding Permeated Regionalism in East Asia; Springer: Heidelberg, Germany, 2008. [Google Scholar] [CrossRef]
- Mansfield, E.D.; Pevehouse, J.C.W. The Expansion of Preferential Trading Arrangements. Int. Stud. Q. 2013, 57, 592–604. [Google Scholar] [CrossRef]
- Bano, S.; Takahashi, Y.; Scrimgeour, F. ASEAN-New Zealand Trade Relations and Trade Potential: Evidence and Analysis. J. Econ. Integr. 2013, 28, 144–182. [Google Scholar] [CrossRef]
- Regional Comprehensive Economic Partnership. About Regional Comprehensive Economic Partnership (RCEP). Available online: https://rcepsec.org/about/ (accessed on 31 January 2021).
- Erokhin, V. Regional Comprehensive Economic Partnership: A Review of Major Parameters of the Trade Alliance. Mark. Logist. 2020, 32, 23–34. [Google Scholar]
- Regional Comprehensive Economic Partnership. ASEAN Hits Historic Milestone with Signing of RCEP. Available online: https://rcepsec.org/2020/11/26/asean-hits-historic-milestone-with-signing-of-rcep/ (accessed on 31 January 2021).
- Chan, C.Y.; Tran, N.; Dao, C.D.; Sulser, T.B.; Phillips, M.J.; Batka, M.; Wiebe, K.; Preston, N. Fish to 2050 in the ASEAN Region; WorldFish: Penang, Malaysia; International Food Policy Research Institute: Washington, DC, USA, 2017. [Google Scholar]
- Barlow, C.; Baran, E.; Halls, A.S.; Kshatriya, M. How Much of the Mekong Fish Catch Is at Risk from Mainstream Dam Development? Catch Cult. 2008, 14, 16–21. [Google Scholar]
- Dugan, P.J.; Barlow, C.; Agostinho, A.A.; Baran, E.; Cada, G.F.; Chen, D.; Cowx, I.G.; Ferguson, J.W.; Jutagate, T.; Mallen-Cooper, M.; et al. Fish Migration, Dams, and Loss of Ecosystem Services in the Mekong Basin. Ambio 2010, 39, 344–348. [Google Scholar] [CrossRef] [PubMed]
- Ziv, G.; Baran, E.; Nam, S.; Rodriguez-Iturbe, I.; Levin, S.A. Trading-off Fish Biodiversity, Food Security, and Hydropower in the Mekong River Basin. PNAS 2012, 109, 5609–5614. [Google Scholar] [CrossRef] [PubMed]
- Béné, C. Small-Scale Fisheries: Assessing Their Contribution to Rural Livelihoods in Developing Countries; Food and Agriculture Organization of the United Nations: Rome, Italy, 2006. [Google Scholar]
- Teh, L.; Pauly, D. Who Brings in the Fish? The Relative Contribution of Small-Scale and Industrial Fisheries to Food Security in Southeast Asia. Front. Mar. Sci. 2018, 5, 44. [Google Scholar] [CrossRef]
- Pomeroy, R.; Nguyen, K.; Thong, H. Small-Scale Marine Fisheries Policy in Vietnam. Mar. Policy 2009, 33, 419–428. [Google Scholar] [CrossRef]
- Ali, M.; Yongtong, M.; Oad, S.; Shah, S.B.H.; Kalhoro, M.A.; Kalhoro, M.T.; Lahbar, G.M. A Comparative Analysis on Expansion of Pakistan Fisheries Trade: World and China. Indian J. Geo Mar. Sci. 2020, 49, 1643–1650. [Google Scholar]
- Needham, S.; Funge-Smith, S. The Consumption of Fish and Fish Products in the Asia-Pacific Region Based on Household Surveys; FAO Regional Office for Asia and the Pacific: Bangkok, Thailand, 2014. [Google Scholar]
- Tveteras, S.; Asche, F. International Fish Trade and Exchange Rates: An Application to the Trade with Salmon and Fishmeal. Appl. Econ. 2008, 40, 1745–1755. [Google Scholar] [CrossRef]
- Erokhin, V. Establishing Food Security and Alternatives to International Trade in Emerging Economies; IGI Global: Hershey, PA, USA, 2018. [Google Scholar] [CrossRef]
- Einarsson, Á.; Óladóttir, Á.D. Fisheries and Aquaculture: The Food Security of the Future; Elsevier: Amsterdam, The Netherlands, 2020. [Google Scholar]
- United Nations. Sustainable Development Goal 2: End Hunger, Achieve Food Security and Improved Nutrition and Promote Sustainable Agriculture. Available online: https://sdgs.un.org/goals/goal2 (accessed on 31 January 2021).
- Honniball, A. Unilateral Trade Measures and the Importance of Defining IUU Fishing: Lessons from the 2019 USA “Concerns” with China as a Fishing Flag State. J. Territ. Marit. Stud. 2020, 7, 7–26. [Google Scholar] [CrossRef]
- United Nations. Sustainable Development Goal 14: Conserve and Sustainably Use the Oceans, Seas and Marine Resources for Sustainable Development. Available online: https://sdgs.un.org/goals/goal14 (accessed on 31 January 2021).
- Tall, A. Identifying Policy Synergies on Aid for Trade, Fisheries, and Food Security; International Centre for Trade and Sustainable Development: Geneva, Switzerland, 2015. [Google Scholar]
- Latif, B.; Noor, S.M.; Sumardi, J.; Irwansyah, I. Sustainable Development and Sea Protection: Trade on Fish and Fishery Product. IOP Conf. Ser. Earth Environ. Sci. 2019, 343, 012069. [Google Scholar] [CrossRef]
- Bellmann, C.; Tipping, A.; Sumaila, R.U. Global Trade in Fish and Fishery Products: An Overview. Mar. Policy 2016, 69, 181–188. [Google Scholar] [CrossRef]
- Southeast Asian Fisheries Development Center. Fishery Statistical Bulletin of Southeast Asia 2018; Southeast Asian Fisheries Development Center: Bangkok, Thailand, 2020. [Google Scholar]
- Delgado, C.; Wada, N.; Rosegrant, M.; Meijer, S.; Ahmed, M. Fish to 2020: Supply and Demand in Changing Global Markets; International Food Policy Research Institute: Washington, DC, USA, 2003. [Google Scholar]
- Mossler, M. State of World Fisheries and Aquaculture 2020. Available online: https://sustainablefisheries-uw.org/fao-state-of-world-fisheries-2020/ (accessed on 30 January 2021).
- United Nations Conference on Trade and Development. Data Center. Available online: https://unctadstat.unctad.org/EN/ (accessed on 24 January 2021).
- Campling, L. Tariff Escalation and Preferences in International Fish Production and Trade; International Centre for Trade and Sustainable Development: Geneva, Switzerland, 2015. [Google Scholar]
- Park, D.; Park, I.; Estrada, G.E.B. Is the ASEAN-Korea Free Trade Area (AKFTA) an Optimal Free Trade Area; Asian Development Bank: Manila, Philippines, 2008. [Google Scholar]
- Prabhakar, A.C.; Kaur, G.; Erokhin, V. Regional Trade and Development Strategies in the Era of Globalization; IGI Global: Hershey, PA, USA, 2020. [Google Scholar] [CrossRef]
- Yue, C.S. The ASEAN Free Trade Area. Pac. Rev. 1998, 11, 213–232. [Google Scholar] [CrossRef]
- Erokhin, V. Global Perspectives on Trade Integration and Economies in Transition; IGI Global: Hershey, PA, USA, 2016. [Google Scholar] [CrossRef]
- Menon, J. Transitional Economies in Free Trade Areas: Lao PDR in the ASEAN Free Trade Area. J. Asia Pac. Econ. 1999, 4, 340–364. [Google Scholar] [CrossRef]
- Mukherji, I.N. The Bangkok Agreement: A Negative List Approach to Trade Liberalization in Asia and the Pacific. In Proceedings of the 19th Session of the Standing Committee of the Bangkok Agreement, Bangkok, Thailand, 27–28 October 2003; The Economic and Social Commission for Asia and the Pacific: Bangkok, Thailand, 2003. [Google Scholar]
- Mukherji, I.N. Asia-Pacific Trade Agreement: Implications of Exchange of Trade Preferences for Member and Prospective Member Countries. Asia Pac. Trade Invest. Rev. 2007, 3, 87–144. [Google Scholar]
- Bano, S. ASEAN-New Zealand Trade Relations and Trade Potential; University of Waikato: Hamilton, New Zealand, 2010. [Google Scholar]
- Kaur, N.; Sarin, V. Trade Potential of India and ASEAN Nations. Mukt Shabd J. 2020, 9, 307–314. [Google Scholar]
- Qayyum, U.; Nigar, N. An Empirical Analysis of Pakistan’s Agriculture Trade with China: Complementarity or Competition; Pakistan Institute of Development Economics: Islamabad, Pakistan, 2020. [Google Scholar]
- Devadason, E.S.; Chandran Govindaraju, V.G.R. Unlocking the Trade Potential in China-ASEAN Relations: The China-Vietnam Context. Southeast Asian Econ. 2020, 36, 380–399. [Google Scholar] [CrossRef]
- Abedini, J.; Péridy, N. The Emergence of Iran in the World Car Industry: An Estimation of its Export Potential. World Econ. 2009, 32, 790–818. [Google Scholar] [CrossRef]
- Sharma, S.C.; Chua, S.Y. ASEAN: Economic Integration and Intra-Regional Trade. Appl. Econ. Lett. 2000, 7, 165–169. [Google Scholar] [CrossRef]
- Roberts, B. A Gravity Study of the Proposed China-ASEAN Free Trade Area. Int. Trade J. 2004, 18, 335–353. [Google Scholar] [CrossRef]
- Ibitoye, O. Assessment of the Potential Level of Food Trade in the ECOWAS Region. J. Econ. Trade 2020, 5, 35–51. [Google Scholar]
- Helmers, C.; Pasteels, J.-M. Assessing Bilateral Trade Potential at the Commodity Level: An Operational Approach; International Trade Center: Geneva, Switzerland, 2006. [Google Scholar]
- Li, W.; Li, C. The Empirical Study on Potential of Bilateral Trade between China and Kenya in the Context “The Belt and Road”. Theor. Econ. Lett. 2020, 10, 119–130. [Google Scholar] [CrossRef][Green Version]
- Kapuya, T.; Chinembiri, E.; Kalaba, M. Identifying Strategic Markets for South Africa’s Citrus Exports. Agrekon 2014, 53, 124–158. [Google Scholar] [CrossRef][Green Version]
- Kaur, S.; Khorana, S.; Kaur, M. Is There Any Potential in Service Trade of South Asia? Foreign Trade Rev. 2020, 55, 402–417. [Google Scholar] [CrossRef]
- Sanidas, E.; Shin, Y. Comparison of Revealed Comparative Advantage Indices with Application to Trade Tendencies of East Asian Countries; Seoul National University: Seoul, Korea, 2010. [Google Scholar]
- Svatos, M.; Smutka, L.; Miffek, O. Competitiveness of Agrarian Trade of EU-15 Countries in Comparison with New EU Member States. Agric. Econ. Zemed. Ekon. 2010, 56, 569–582. [Google Scholar] [CrossRef]
- Balassa, B. Trade Liberalization and Revealed Comparative Advantage. Manch. Sch. Econ. Soc. Sci. 1965, 33, 99–123. [Google Scholar] [CrossRef]
- Wardani, M.A.; Mulatsih, S.; Rindayati, W. Competitiveness and Factors Affecting Indonesian Food Industry’s Export to Regional Comprehensive Economic Partnership. Etikonomi 2018, 17, 185–198. [Google Scholar] [CrossRef]
- Hoang, V.V. Investigating the Agricultural Competitiveness of ASEAN Countries. J. Econ. Stud. 2020, 47, 307–332. [Google Scholar] [CrossRef]
- Nguyen, D.P.; Vo, X.V. Determinants of Bilateral Trade: Evidence from ASEAN+3. Asian Pac. Econ. Lit. 2017, 31, 115–122. [Google Scholar] [CrossRef]
- Luo, X.; Han, Y.; Li, Z. Comparing Quantitative Analysis on Revealed Comparative Advantages of Aquatic Products Trade of China and ASEAN Based on 21st Century Maritime Silk Road. IOP Conf. Ser. Earth Environ. Sci. 2017, 94, 012032. [Google Scholar] [CrossRef]
- Tampubolon, J. RCA Analysis with Selected Products to Enhance Prediction Power of Competitiveness. J. Ekon. Dan Studi Pembang. 2019, 11, 143–157. [Google Scholar] [CrossRef]
- Lee, S.M. Revealed Comparative Advantage of Selected ASEAN Countries’ Crustacean Export to Japan. IOP Conf. Ser. Earth Environ. Sci. 2020, 414, 012010. [Google Scholar] [CrossRef]
- Kwak, S.Y.; Kim, M.J. A Study on the Analysis of International Trade Competitiveness between Korea and Vietnam. Int. Commer. Inf. Rev. 2018, 20, 49–74. [Google Scholar] [CrossRef]
- Kuldilok, K.S.; Dawson, P.J.; Lingard, J. The Export Competitiveness of the Tuna Industry in Thailand. Br. Food J. 2013, 115, 328–341. [Google Scholar] [CrossRef]
- Sutawi, S.; Hendraningsih, L.; Wahyudi, A. Competitiveness of Indonesian Beef Trading in ASEAN. J. Indones. Trop. Anim. Agric. 2019, 44, 213–219. [Google Scholar] [CrossRef]
- Jain, M. Review of ASEAN-India Free Trade Agreement Using Revealed Comparative Advantage Index. Int. J. Bus. Econ. 2020, 5, 56–65. [Google Scholar]
- Laosutsan, P.; Shivakoti, G.; Soni, P. Comparative Advantage and Export Potential of Thai Vegetable Products Following the Integration into the ASEAN Economic Community. Int. Food Agribus. Manag. Rev. 2017, 20, 575–590. [Google Scholar] [CrossRef]
- Erokhin, V.; Li, D.; Du, P. Sustainability-Related Implications of Competitive Advantages in Agricultural Value Chains: Evidence from Central Asia—China Trade and Investment. Sustainability 2020, 12, 1117. [Google Scholar] [CrossRef]
- Leromain, E.; Orefice, G. New Revealed Comparative Advantage Index: Dataset and Empirical Distribution. Int. Econ. 2014, 139, 48–70. [Google Scholar] [CrossRef]
- Ballance, R.H.; Forstner, H.; Murray, T. Consistency Tests of Alternative Measures of Comparative Advantage. Rev. Econ. Stat. 1987, 69, 157–161. [Google Scholar] [CrossRef]
- Coniglio, N.; Vurchio, D.; Cantore, N.; Clara, M. On the Evolution of Comparative Advantage: Path-Dependent Versus Path-Defying Changes; University of Bari Aldo Moro: Bari, Italy, 2018. [Google Scholar]
- Gnidchenko, A.; Salnikov, V. Net Comparative Advantage Index: Overcoming the Drawbacks of the Existing Indices; National Research University Higher School of Economics: Moscow, Russia, 2015. [Google Scholar]
- Yeats, A.J. On the Appropriate Interpretation of the Revealed Comparative Advantage Index: Implications of a Methodology Based on Industry Sector Analysis. Weltwirtschaftliches Arch. 1985, 121, 61–73. [Google Scholar] [CrossRef]
- Hoen, A.R.; Oosterhaven, J. On the Measure of Comparative Advantage. Ann. Reg. Sci. 2006, 40, 677–691. [Google Scholar] [CrossRef]
- Khai, N.X.; Ismail, M.M.; Sidique, S.F. Consistency Tests of Comparative Advantage Measures: An Empirical Evidence from the Malaysian and Selected Asian Shrimp Products. Int. Food Res. J. 2016, 23, 2752–2758. [Google Scholar]
- Rusali, M.; Gavrilescu, C. Competitive Advantages and Disadvantages in Romania’s Agri-Food Trade—Trends and Challenges. In Proceedings of the 12th Congress of the European Association of Agricultural Economists, Ghent, Belgium, 26–29 August 2008; European Association of Agricultural Economists: Ghent, Belgium, 2008. [Google Scholar]
- Drabik, D.; Bartova, L. An Assessment of the Slovak Agri-Food Trade Specialisation Pattern. Ekonomický Časopis 2009, 57, 3–20. [Google Scholar]
- Carraresi, L.; Banterle, A. Agri-Food Competitive Performance in EU Countries: A Fifteen-Year Retrospective. Int. Food Agribus. Manag. Rev. 2015, 18, 37–62. [Google Scholar] [CrossRef]
- Campos, F.J.A.; Chavez, J.C.L.N.; Ortega, O.V.D. Competitiveness and Productivity of Mexican Agricultural Sector in APEC, 1980–2015. Portes Rev. Mex. De Estud. Sobre La Cuenca Del Pac. 2018, 12, 7–30. [Google Scholar]
- Bashimov, G. Turkey’s Export Performance of Tomato and Competitiveness. Alinteri J. Agric. Sci. 2016, 31, 1–8. [Google Scholar] [CrossRef]
- Zaghini, A. Trade Advantages and Specialisation Dynamics in Acceding Countries; European Central Bank: Frankfurt am Main, Germany, 2003. [Google Scholar]
- Ferto, I.; Hubbard, L.J. Revealed Comparative Advantage and Competitiveness in Hungarian Agrifood Sector. World Econ. 2003, 26, 247–259. [Google Scholar] [CrossRef]
- Erokhin, V.; Gao, T. Competitive Advantages of China’s Agricultural Exports in the Outward-Looking Belt and Road Initiative. In China’s Belt and Road Initiative: Changing the Rules of Globalization; Zhang, W., Alon, I., Lattemann, C., Eds.; Palgrave Macmillan: London, UK, 2018; pp. 265–285. [Google Scholar] [CrossRef]
- Karimi, M.S.; Malekshahian, M. Ricardian Comparative Advantage: Impact of Specialization on the Exportation of Products in ASEAN Countries. Ann. Econ. Financ. 2018, 19, 473–522. [Google Scholar]
- Oberoi, S. Dynamics of Trade Specialization and Trade Performance of ASEAN-India Free Trade Agreement. J. Int. Commer. Econ. Policy 2019, 10, 1950003. [Google Scholar] [CrossRef]
- Smutka, L.; Pokorna, I.; Pulkrabek, J. Regional Analysis of Competitiveness of Raw and White Sugar. Listy Cukrov. A Reparske 2012, 128, 141–145. [Google Scholar]
- Maitah, M.; Kuzmenko, E.; Smutka, L. Real Effective Exchange Rate of Rouble and Competitiveness of Russian Agrarian Producers. Economies 2016, 4, 12. [Google Scholar] [CrossRef]
- Benesova, I.; Maitah, M.; Smutka, L.; Tomsik, K.; Ishchukova, N. Perspectives of the Russian Agricultural Exports in Terms of Comparative Advantage. Agric. Econ. Zemed. Ekon. 2017, 63, 318–330. [Google Scholar] [CrossRef]
- Benesova, I.; Smutka, L.; Laputkova, A. Specifics of the Mutual Trade of the Post-Soviet Countries. Entrep. Bus. Econ. Rev. 2019, 7, 29–43. [Google Scholar] [CrossRef]
- Szczepaniak, I. Changes in Comparative Advantages of the Polish Food Sector in World Trade. Equilibrium. Q. J. Econ. Econ. Policy 2019, 14, 463–480. [Google Scholar] [CrossRef]
- Allegra, V.; Zarba, C.; La Via, G.; Zarba, A.S. Why the New Orange Juice Consumption Model Favors Global Trade and Growth in Orange Production. Br. Food J. 2019, 121, 1954–1968. [Google Scholar] [CrossRef]
- Ignjatijevic, S.; Ciric, M.; Caric, M. International Trade Structure of Countries from the Danube Region: Comparative Advantage Analysis of Export. Ekon. Cas. 2013, 61, 251–269. [Google Scholar]
- Smutka, L.; Maitah, M.; Svatos, M. Changes in the Czech Agrarian Foreign Trade Competitiveness—Different Groups of Partners’ Specifics. Agric. Econ. Zemed. Ekon. 2018, 64, 399–411. [Google Scholar] [CrossRef]
- Ortikov, A.; Vacek, T. Comparative Advantage: Products Mapping of Uzbekistan’s Agricultural Exports. In Proceedings of the 27th International Scientific Conference “Agrarian Perspectives XXVII—Food Safety—Food Security”, Prague, Czech Republic, 19–20 September 2018; Czech University of Life Sciences Prague: Prague, Czech Republic, 2018. [Google Scholar]
- Ortikov, A. Changes in the Character and Competitiveness of Uzbekistan’s Agrarian Foreign Trade. In Proceedings of the 26th International Scientific Conference “Agrarian Perspectives XXVII—Competitiveness of European Agriculture and Food Sectors”, Prague, Czech Republic, 13–15 September 2017; Czech University of Life Sciences Prague: Prague, Czech Republic, 2017. [Google Scholar]
- Verter, N.; Zdrahal, I.; Becvarova, V.; Grega, L. “Products Mapping” and Trade in Agri-Food Products between Nigeria and the EU28. Agric. Econ. Zemed. Ekon. 2020, 66, 34–45. [Google Scholar] [CrossRef]
- Rundassa, M.W.; Azene, D.K.; Berhan, E. Comparative Advantage of Ethiopian Textile and Apparel Industry. Res. J. Text. Appar. 2019, 23, 244–256. [Google Scholar] [CrossRef]
- Alessandrini, M.; Fattouh, B.; Scaramozzino, P. The Changing Pattern of Foreign Trade Specialization in Indian Manufacturing. Oxf. Rev. Econ. Policy 2007, 23, 270–291. [Google Scholar] [CrossRef]
- Ishchukova, N. The Position of the Russian Federation in the International Market of Agricultural and Foodstuff Products; Czech University of Life Sciences Prague: Prague, Czech Republic, 2013. [Google Scholar]
- Dunmore, J.C. Competitiveness and Comparative Advantage of U.S. Agriculture. Increasing Underst. Public Probl. Policies 1986, 21–34. [Google Scholar] [CrossRef]
- Siggel, E. International Competitiveness and Comparative Advantage: A Survey and a Proposal for Measurement. J. Ind. Compet. Trade 2006, 6, 137–159. [Google Scholar] [CrossRef]
- Costinot, A.; Donaldson, D.; Komunjer, I. What Goods Do Countries Trade? A Quantitative Exploration of Ricardo’s Ideas. Rev. Econ. Stud. 2012, 79, 581–608. [Google Scholar] [CrossRef]
- Hinloopen, J.; Van Marrewijk, C. On the Empirical Distribution of the Balassa index. Weltwirtschaftliches Arch. 2001, 137, 1–35. [Google Scholar] [CrossRef]
- Kim, H.Y. The Economic Effect and Implications of a FTA on Busan Fisheries Industry. J. Int. Trade Ind. Stud. 2008, 13, 73–103. [Google Scholar]
- Shah, S.; Kamal, M.; Yu, D. Did China-Pakistan Free Trade Agreement Promote Trade and Development in Pakistan? Int. J. Financ. Econ. 2020, 27. [Google Scholar] [CrossRef]
- Lin, X.; Kim, K.S. A Study on the Determinant of Korean Fisheries Export to ASEAN. J. Fish. Bus. Adm. 2016, 47, 15–32. [Google Scholar] [CrossRef]
- Choi, S.; Choi, H. Economic Effects of Korea-Singapore Free Trade Agreement on the Fisheries Sector. J. Fish. Bus. Adm. 2004, 35, 71–90. [Google Scholar]
- Abelson, P. The Trade Deficit. Science 1987, 236, 653. [Google Scholar] [CrossRef] [PubMed][Green Version]
- Feldstein, M. Correcting the Trade Deficit. Foreign Aff. 1987, 65, 795–806. [Google Scholar] [CrossRef]
- Mishra, R.K.; Karthik, M. Understanding the US-China Trade War: Causes, Consequences and Economic Impact. Glob. Trade Cust. J. 2020, 15, 580–591. [Google Scholar]
- Belke, A.; Domnick, C. Trade and Capital Flows: Substitutes or Complements? An Empirical Investigation. Rev. Int. Econ. 2021. [Google Scholar] [CrossRef]
- Krueger, A. International Trade: What Everyone Needs to Know; Oxford University Press: Oxford, UK, 2020. [Google Scholar] [CrossRef]
- Andreosso-O´Callaghan, B.; Nicolas, F. Are the Economies of ASEAN and the EU Complementary? Asean Econ. Bull. 2007, 24, 205–224. [Google Scholar] [CrossRef]
- Kurien, J. Responsible Fish Trade and Food Security; Food and Agriculture Organization of the United Nations: Rome, Italy, 2005. [Google Scholar]
- Teh, L.; Zeller, D.; Zylich, K.; Nguyen, G.; Harper, S. Reconstructing Vietnam’s Marine Fisheries Catch, 1950–2010; University of British Columbia: Vancouver, BC, Canada, 2014. [Google Scholar]
- Teh, L.; Zeller, D.; Pauly, D. Preliminary Reconstruction of Thailand’s Fisheries Catches: 1950-2010; University of British Columbia: Vancouver, BC, Canada, 2015. [Google Scholar]
- Garcia Garcia, S.; Barclay, K.; Nicholls, R. Can Anti-Illegal, Unreported, and Unregulated (IUU) Fishing Trade Measures Spread Internationally? Case Study of Australia. Ocean Coast. Manag. 2021, 202, 105494. [Google Scholar] [CrossRef]
- Steven, A.H.; Mobsby, D.; Curtotti, R. Australian Fisheries and Aquaculture Statistics 2018; Australian Bureau of Agricultural and Resource Economics and Sciences: Canberra, Australia, 2020.
- Fabinyi, M. The Chinese Seafood Market: Opportunities and Challenges for Australian Exporters; University of Technology Sydney: Sydney, Australia, 2018. [Google Scholar]
- Wardono, B.; Muhartono, R.; Apriliani, T.; Hikmah Zulham, A. Traditional Fisheries Supply Chain Management in the Border Area: The Natuna Islands, Indonesia. E3s Web Conf. 2020, 147, 02009. [Google Scholar] [CrossRef]
- Jaya, S. International Fish Trade: A Case Study of Indonesia. In Proceedings of the SEAFDEC Fish Trade Meeting, Bangkok, Thailand, 7–8 June 2018; Southeast Asian Fisheries Development Center: Bangkok, Thailand, 2018. [Google Scholar]
- Tran, N.; Wilson, N.; Hite, D. Choosing the Best Model in the Presence of Zero Trade: A Fish Product Analysis. In Nontariff Measures with Market Imperfections: Trade and Welfare Implications; Beghin, J.C., Ed.; Emerald Group Publishing Limited: Bingley, UK, 2013; pp. 127–149. [Google Scholar] [CrossRef]
- Henson, S.; Jaffee, S. Understanding Developing Country Strategic Responses to the Enhancement of Food Safety Standards. World Econ. 2008, 31, 548–568. [Google Scholar] [CrossRef]
- Surahman, Z.M.; Hanningtyas, I.; Aristi, D.; Cahyaningrum, F.; Laelasari, E. Factors Related to the Presence of Formaldehyde in the Salted Fish Trade in Ciputat, Indonesia. Malays. J. Med. Health Sci. 2019, 15, 89–94. [Google Scholar]
- White, E.; Froehlich, H.; Gephart, J.; Cottrell, R.; Branch, T.; Bejarano, R.A.; Baum, J. Early Effects of COVID-19 on US Fisheries and Seafood Consumption. Fish Fish. 2020, 22, 232–239. [Google Scholar] [CrossRef] [PubMed]
- Bennett, N.; Finkbeiner, E.; Ban, N.; Belhabib, D.; Jupiter, S.; Kittinger, J.; Mangubhai, S.; Scholtens, J.; Gill, D.; Christie, P. The COVID-19 Pandemic, Small-Scale Fisheries and Coastal Fishing Communities. Coast. Manag. 2020, 48, 336–347. [Google Scholar] [CrossRef]
- Supartini, A.; Oishi, T.; Yagi, N. Changes in Fish Consumption Desire and Its Factors: A Comparison between the United Kingdom and Singapore. Foods 2018, 7, 97. [Google Scholar] [CrossRef] [PubMed]
- De Koninck, R. Farmers of a City State: The Chinese Smallholders of Singapore; Universite Laval: Laval, QC, Canada, 1973. [Google Scholar]
- Wong, C.Y.; Lim, G. A Typology of Agricultural Production Systems: Capability Building Trajectories of Three Asian Economies. Asia Pac. Viewp. 2020, 61, 37–53. [Google Scholar] [CrossRef]
- Brander, J.; Taylor, M. Open Access Renewable Resources Trade and Trade Policy in a Two-Country Model. J. Int. Econ. 1998, 44, 181–209. [Google Scholar] [CrossRef]
- Emami, A.; Johnson, R. Unilateral Resource Management in a 2-Country General Equilibrium Model. Am. J. Agric. Econ. 2000, 82, 161–172. [Google Scholar] [CrossRef]
- Kathuria, S. Why Trade Liberalization Benefits Smaller Countries More. Available online: https://www.weforum.org/agenda/2015/02/why-trade-liberalisation-benefits-smaller-countries-more/ (accessed on 3 February 2021).
- Sneddon, C.; Fox, C. Inland Capture Fisheries and Large River Systems: A Political Economy of Mekong Fisheries. J. Agrar. Chang. 2012, 12, 279–299. [Google Scholar] [CrossRef]
- Chap, S.; Meng, K.; Tep, C.; Joffre, O. Crab Fisheries in Cambodia and the Development of Crab Banks; The Learning Institute and the WorldFish Center: Phnom Penh, Cambodia, 2012. [Google Scholar]
- Srean, P.; Sinh, K.; Prak, S.; Bin, C. Potency of Aquatic Local Resources in Cambodia. In Proceedings of the International Seminar on Promoting Local Resources for Food and Health, Bengkulu, Indonesia, 12–13 October 2015; ISEPROLOCAL: Bengkulu, Indonesia, 2015. [Google Scholar]
- Martin, S.; Lorenzen, K.; Bunnefeld, N. Fishing Farmers: Fishing, Livelihood Diversification and Poverty in Rural Laos. Hum. Ecol. 2013, 41, 737–747. [Google Scholar] [CrossRef]
- Hartje, R.; Buhler, D.; Grote, U. Eat Your Fish and Sell It, Too—Livelihood Choices of Small-Scale Fishers in Rural Cambodia. Ecol. Econ. 2018, 154, 88–98. [Google Scholar] [CrossRef]
- Joffre, O.M.; Castine, S.A.; Phillips, M.J.; Sellamuttu, S.S.; Chandrabalan, D.; Cohen, P. Increasing Productivity and Improving Livelihoods in Aquatic Agricultural Systems: A Review of Interventions. Food Secur. 2017, 9, 39–60. [Google Scholar] [CrossRef]
- Patricio, H.; Zipper, S.; Peterson, M.; Ainsley, S.; Loury, E.; Ounboundisane, S.; Demko, D. Fish Catch and Community Composition in a Data-Poor Mekong River Subcatchment Characterised through Participatory Surveys of Harvest from an Artisanal Fishery. Mar. Freshw. Res. 2018, 70, 153–168. [Google Scholar] [CrossRef]
- Horlings, J.; Marschke, M. Fishing, Farming and Factories: Adaptive Development in Coastal Cambodia. Clim. Dev. 2019, 12, 521–531. [Google Scholar] [CrossRef]
- Ebil, S.; Sheppard, C.; Wahab, R.; Price, A.; Bull, J. Changes in Community Structure of Finfish Catches in Brunei Darussalam between 2000 and 2009. Ocean Coast. Manag. 2013, 76, 45–51. [Google Scholar] [CrossRef]
- Teh, L.; Shon, D.; Zylich, K.; Zeller, D. Reconstructing Cambodia’s Marine Fisheries Catch, 1950–2010; University of British Columbia: Vancouver, BC, Canada, 2014. [Google Scholar]
- Kim, S. A Study on the Effects of Regional Trade Agreements on the Trade of Fishery Products in Korea. J. Korea Res. Assoc. Int. Commer. 2019, 19, 79–97. [Google Scholar] [CrossRef]
- Anderson, J.; Van Wincoop, E. Gravity with Gravitas: A Solution to the Border Puzzle. Am. Econ. Rev. 2003, 93, 170–192. [Google Scholar] [CrossRef]
- Péridy, N. The New Trade Policy between the USA and MENA Countries: A Quantitative Assessment. World Econ. 2005, 28, 491–518. [Google Scholar] [CrossRef]
- Kim, B. Pricing Behavior for Sustainably Farmed Fish in International Trade: The Case of Norwegian Atlantic Salmon (Salmo Salar). Sustainability 2018, 10, 4814. [Google Scholar] [CrossRef]
- Fishe, R.; Janzen, J.; Smith, A. Hedging and Speculative Trading in Agricultural Futures Markets. Am. J. Agric. Econ. 2014, 96, 542–556. [Google Scholar] [CrossRef]
- Harrigan, J. Scale Economies and the Volume of Trade. Rev. Econ. Stat. 1994, 76, 321–328. [Google Scholar] [CrossRef]
- Mohammadi, H.; Saghaian, S.; Aminizadeh, M.; Aghasafari, H. Food Safety Standards and Their Effects on Iran’s Fish Exports. Iran. J. Fish. Sci. 2020, 19, 3075–3085. [Google Scholar] [CrossRef]
- Santeramo, F.G.; Lamonaca, E. The Effects of Non-Tariff Measures on Agri-Food Trade: A Review and Meta-Analysis of Empirical Evidence. J. Agric. Econ. 2019, 70, 595–617. [Google Scholar] [CrossRef]
- Hammarlund, C.; Jonsson, P.; Valentinsson, D.; Waldo, S. Economic and Environmental Effects of Replacing Bottom Trawling with Fishing with Creels. Aust. J. Agric. Resour. Econ. 2021, 65, 94–118. [Google Scholar] [CrossRef]
- Lindsay, A.; Sanchirio, J.; Gilliland, T.; Ambo-Rappe, R.; Taylor, J.E.; Krueck, N.; Mumby, P. Evaluating Sustainable Development Policies in Rural Coastal Economies. Proc. Natl. Acad. Sci. USA 2020, 117, 33170–33176. [Google Scholar] [CrossRef] [PubMed]


| Stage | Method | Results |
|---|---|---|
| Trade potential | Indicative Trade Potential (ITP) | For each pair of i and j countries, a comparison of the current trade turnover in products pn with a potential value of trade. The four-level scale to measure trade potential. |
| Comparative advantage | Revealed Comparative Advantage (RCA) | Identification of comparative advantages in trade in products pn within pairs of countries i and j. |
| Trade advantage | Relative Trade Advantage (RTA) | Identification of trade advantages in trade in products pn within pairs of countries i and j. Detection of matches between comparative and trade advantages. |
| Overwriting advantages | Lafay Index (LI) | Identification of LI values for products pn traded within pairs of countries i and j. Detection of matches between comparative and trade advantages and LI values. |
| Matching advantages and potentials | Trade potential scale, RCA, RTA, and LI | The four-level scale to measure advantages. Detection of countries i with high potential and advantages in trade in products pn in [i;j] and [i;r] pairs. |
| Type of Trade Potential | Scale |
|---|---|
| Type 1: high | |
| Type 2: above average | |
| Type 3: below average | |
| Type 4: low |
| Type of Advantage | Criteria |
|---|---|
| Strong advantage (S) | RCA > 1, RTA > 0, and LI > 0 |
| Average advantage (A) | RTA > 0 and LI > 0 |
| Weak advantage (W) | RCA > 1, or RTA > 0, or LI > 0 |
| Disadvantage (D) | RCA < 1, RTA < 0, and LI < 0 |
| Countries | Indexes | AUS | BRN | KHM | CHN | IDN | JPN | LAO | MYS | MMR | NZL | PHL | SGP | KOR | THA | VNM | RCEP |
|---|---|---|---|---|---|---|---|---|---|---|---|---|---|---|---|---|---|
| AUS | RCA | − | − | − | − | − | − | − | − | − | − | − | − | − | + | − | |
| RTA | + | − | − | − | + | + | − | − | − | − | + | − | − | + | − | ||
| LI | − | − | + | − | + | + | − | − | − | − | + | − | − | + | − | ||
| BRN | RCA | − | − | − | − | − | − | − | − | − | − | − | − | − | − | − | |
| RTA | − | − | − | − | − | + | − | − | − | − | − | − | − | − | − | ||
| LI | + | − | + | + | + | + | − | − | − | − | − | + | + | − | − | ||
| KHM | RCA | + | − | − | − | − | + | − | − | − | − | − | − | + | − | − | |
| RTA | + | + | + | − | − | + | + | − | − | − | + | + | + | − | − | ||
| LI | + | + | + | − | + | + | + | + | − | − | + | + | − | − | − | ||
| CHN | RCA | − | − | − | − | + | − | + | − | − | + | − | + | + | − | + | |
| RTA | + | − | − | − | + | + | + | − | − | + | + | + | + | − | + | ||
| LI | − | − | − | − | + | + | + | − | − | − | + | + | − | − | + | ||
| IDN | RCA | + | − | − | + | + | − | + | − | − | − | − | − | + | + | + | |
| RTA | + | + | + | + | + | + | + | − | + | − | + | + | + | + | + | ||
| LI | − | + | + | − | + | + | − | − | − | − | − | + | + | + | + | ||
| JPN | RCA | − | − | − | − | − | − | − | − | − | − | − | − | − | − | − | |
| RTA | − | + | + | − | − | + | − | − | − | − | − | − | − | − | − | ||
| LI | − | + | + | − | − | + | + | − | + | − | + | + | + | − | − | ||
| LAO | RCA | − | − | − | − | − | − | − | − | − | − | − | − | − | − | − | |
| RTA | − | + | − | − | − | − | − | + | − | + | − | + | − | − | − | ||
| LI | − | + | − | − | − | − | + | + | − | − | + | + | − | − | − | ||
| MYS | RCA | − | + | − | − | − | − | − | − | − | − | − | − | − | + | − | |
| RTA | + | + | − | − | − | + | + | − | − | − | + | + | − | − | − | ||
| LI | + | + | + | − | − | + | + | − | − | − | + | + | − | + | − | ||
| MMR | RCA | + | + | − | + | + | + | − | + | + | − | + | + | + | + | + | |
| RTA | + | + | + | + | + | + | + | + | + | + | + | + | + | + | + | ||
| LI | + | + | + | + | − | + | + | + | − | + | + | + | − | + | + | ||
| NZL | RCA | + | + | + | + | − | + | + | + | − | − | + | + | + | + | + | |
| RTA | + | + | + | + | − | + | + | + | − | − | + | − | − | − | + | ||
| LI | + | + | + | + | − | + | + | − | − | − | + | − | − | − | + | ||
| PHL | RCA | − | + | − | − | − | + | − | − | − | − | − | − | − | − | − | |
| RTA | + | + | + | − | + | + | + | + | − | + | + | + | + | − | + | ||
| LI | + | + | + | − | − | + | + | + | − | − | + | + | + | − | + | ||
| SGP | RCA | − | − | − | − | − | − | − | − | − | − | − | − | − | − | − | |
| RTA | − | + | − | − | − | − | + | − | − | − | − | − | − | − | − | ||
| LI | − | + | + | − | − | + | + | + | − | − | − | + | − | − | − | ||
| KOR | RCA | − | − | − | − | − | + | − | − | − | + | − | − | + | − | − | |
| RTA | + | + | − | − | − | + | − | − | − | + | − | − | − | − | − | ||
| LI | + | + | − | − | − | + | + | − | − | + | − | + | + | − | − | ||
| THA | RCA | + | + | − | − | − | + | − | − | − | + | − | − | + | + | + | |
| RTA | + | + | − | − | − | + | + | + | − | − | − | + | + | − | + | ||
| LI | + | + | + | − | − | + | + | + | − | − | − | + | − | − | + | ||
| VNM | RCA | + | + | − | + | − | + | − | + | − | + | + | + | + | + | + | |
| RTA | + | + | + | + | − | + | + | + | − | + | + | + | + | + | + | ||
| LI | + | + | + | − | − | + | + | − | − | − | − | + | + | − | + |
| Countries | AUS | BRN | KHM | CHN | IDN | JPN | LAO | MYS | MMR | NZL | PHL | SGP | KOR | THA | VNM | RCEP |
|---|---|---|---|---|---|---|---|---|---|---|---|---|---|---|---|---|
| AUS | W | D | W | D | A | A | D | D | D | D | A | D | D | S | D | |
| BRN | W | D | W | W | W | A | D | D | D | D | D | W | W | D | D | |
| KHM | S | A | A | D | W | S | A | W | D | D | A | A | W | D | D | |
| CHN | W | D | D | D | S | A | S | D | D | W | A | S | W | D | S | |
| IDN | W | A | A | W | S | A | W | D | W | D | A | A | S | S | S | |
| JPN | D | A | A | D | D | A | W | D | W | D | W | W | W | D | D | |
| LAO | D | A | D | D | D | D | D | A | D | W | W | A | D | D | D | |
| MYS | A | S | W | D | D | A | A | D | D | D | A | A | D | W | D | |
| MMR | S | S | A | S | W | S | A | S | W | S | S | S | W | S | S | |
| NZL | S | S | S | S | D | S | S | W | D | D | S | W | W | W | S | |
| PHL | A | S | A | D | W | S | A | A | D | W | A | A | A | D | A | |
| SGP | D | A | W | D | D | D | A | D | D | D | D | W | D | D | D | |
| KOR | A | A | D | D | D | A | W | D | D | S | D | W | W | D | D | |
| THA | S | S | W | D | D | S | A | A | D | W | D | A | W | W | S | |
| VNM | S | S | A | W | D | S | A | W | D | W | W | S | S | W | S |
| Groups/ Countries | Advantage, Destinations (Products) * | Disadvantage, Destinations (Products) ** | Neutral, Destinations (Products) *** |
|---|---|---|---|
| Group 1 | |||
| CHN | AUS (p2–5), BRN (p5), KHM (p3, p5), JPN (p4), LAO (p2–5), MYS (p2, p3), NZL (p5), SGP (p2, p4, p5), THA (p2, p3) | IDN (p2, p4, p5), MMR (p2–5), NZL (p2, p4), PHL (p3, p5), THA (p4, p5), VNM (p2–5) | BRN (p2–4), KHM (p2, p4), IDN (p3), JPN (p2, p3, p5), MYS (p4, p5), NZL (p3), PHL (p2, p4), SGP (p3), KOR (p2–5) |
| JPN | AUS (p5), BRN (p2, p3, p5), KHM (p2–5), LAO (p2–5), MYS (p2, p3, p5), NZL (p4, p5), SGP (p2–5) | AUS (p2, p4), CHN (p2–5), IDN (p2–5), MMR (p2–5), NZL (p2, p3), PHL (p2–5), KOR (p2–5), THA (p2–5), VNM (p2–5) | AUS (p3), BRN (p4), MYS (p4) |
| KOR | AUS (p3–5), BRN (p2, p3, p5), KHM (p3, p5), LAO (p2–5), MYS (p3), MMR (p3), NZL (p3, p4), PHL (p2), SGP (p3–5), THA (p2) | CHN (p2–5), IDN (p4), JPN (p3), MMR (p2, p4), PHL (p3–5), THA (p4), VNM (p2–5) | AUS (p2), BRN (p4), KHM (p2, p4), IDN (p2, p3, p5), JPN (p2, p4, p5), MYS (p2, p4, p5), MMR (p5), NZL (p2, p5), SGP (p2), THA (p3, p5) |
| Group 2 | |||
| MMR | AUS (p2–5), BRN (p2–5), KHM (p3–5), CHN (p2–5), IDN (p2–4), JPN (p2, p3, p5), LAO (p2–5), MYS (p2–5), NZL (p2, p4, p5), PHL (p2–5), SGP (p2–5), KOR (p2–5), THA (p2–4), VNM (p2–5) | KHM (p2), IDN (p5), JPN (p4), NZL (p3), THA (p5) | |
| THA | AUS (p2–5), BRN (p2–5), CHN (p3, p4), IDN (p3), JPN (p3, p5), MYS (p2, p3, p5), NZL (p3, p4), SGP (p2–5), KOR (p3–5) | KHM (p2–4), CHN (p2), IDN (p2, p4, p5), MMR (p2–5), NZL (p2, p5), PHL (p3, p5), VNM (p2–5) | KHM (p5), CHN (p5), JPN (p2, p4), LAO (p2–5), MYS (p4), PHL (p2, p4), KOR (p2) |
| VNM | AUS (p2–5), BRN (p2–5), KHM (p3, p5), CHN (p2, p5), IDN (p3, p5), JPN (p2, p3, p5), LAO (p2–5), MYS (p2–5), NZL (p2–5), PHL (p2–4), SGP (p2–5), KOR (p2–5), THA (p2–5) | KHM (p4), IDN (p4), MMR (p3, p4) | KHM (p2), CHN (p3, p4), IDN (p2), JPN (p4), MMR (p2, p5), PHL (p5) |
| Group 3 | |||
| AUS | BRN (p2–5), KHM (p5), CHN (p2), JPN (p4, p5), LAO (p2–5), PHL (p2), SGP (p2–5), KOR (p2) | KHM (p3), CHN (p4, p5), IDN (p4), JPN (p3), MMR (p4, p5), NZL (p2–4), PHL (p3), THA (p4, p5), VNM (p2, p5) | KHM (p2, p4), CHN (p3), IDN (p2, p3, p5), JPN (p2), MYS (p2–5), MMR (p3), NZL (p5), PHL (p4, p5), KOR (p3–5), THA (p2, p3), VNM (p3, p4) |
| IDN | AUS (p2–5), BRN (p2–5), KHM (p2–5), CHN (p2–4), JPN (p2), LAO (p2–5), MYS (p2, p4), MMR (p5), NZL (p3–5), SGP(p2–5), KOR (p2–5), THA (p2, p4, p5), VNM (p2, p5) | MMR (p3, p4), THA (p3), VNM (p3, p4) | CHN (p5), JPN (p3–5), MYS (p3, p5), MMR (p2), NZL (p2), PHL (p2–5) |
| MYS | AUS (p2–5), BRN (p2–5), KHM (p3–5), IDN (p3), JPN (p2, p4, p5), LAO (p2–5), NZL (p5), PHL (p2), SGP (p2–5), KOR (p2–5) | CHN (p2, p4), IDN (p2, p4), MMR (p2–5), THA (p2, p3), VNM (p2, p3, p5) | KHM (p2), CHN (p3, p5), IDN (p5), JPN (p3), NZL (p2–4), PHL (p3–5), THA (p4, p5), VNM (p4) |
| NZL | AUS (p3–5), BRN (p2–5), KHM (p2–5), CHN (p2, p5), JPN (p2–5), LAO (p2–5), MYS (p2–5), MMR (p3), PHL (p2, p4), SGP (p2–5), KOR (p2–5), THA (p2, p4, p5), VNM (p2) | PHL (p3) | AUS (p2), CHN (p3, p4), IDN (p2–5), MMR (p2, p4, p5), PHL (p5), THA (p3), VNM (p3–5) |
| SGP | AUS (p3, p5), BRN (p2–5), KHM (p3–5), CHN (p3), IDN (p5), JPN (p2, p3), LAO (p2–5), MYS (p3), MMR (p5), PHL (p2, p5), KOR (p2–5), THA (p2, p3), VNM (p2) | AUS (p4), CHN (p2, p4, p5), IDN (p2–4), JPN (p4), MYS (p2, p4, p5), MMR (p2–4), NZL (p3), PHL (p3), THA (p4, p5), VNM (p3–5) | AUS (p2), KHM (p2), JPN (p5), NZL (p2, p4, p5), PHL (p4) |
| Group 4 | |||
| BRN | AUS (p4, p5), KHM (p3–5), IDN (p2), JPN (p2, p4), LAO (p2–5), MMR (p3, p5), PHL (p3), KOR (p3, p4), THA (p2), VNM (p4) | AUS (p3), CHN (p2, p3, p5), IDN (p5), JPN (p5), MYS (p2–5), MMR (p4), NZL (p2, p5), PHL (p5), SGP (p2–5), KOR (p5), THA (p3, p5), VNM (p2, p3, p5) | AUS (p2), KHM (p2), CHN (p4), IDN (p3, p4), JPN (p3), MMR (p2), NZL (p3, p4), PHL (p2, p4), KOR (p2), THA (p4) |
| KHM | AUS (p2–5), BRN (p2–5), CHN (p2, p3), IDN (p2), JPN (p2, p4), LAO (p2–5), MYS (p2, p3, p5), MMR (p3–5), NZL (p2), PHL (p2), SGP (p2–4), KOR (p2, p4) | CHN (p5), JPN (p5), THA (p4, p5), VNM (p2, p4, p5) | CHN (p4), IDN (p3–5), JPN (p3), MYS (p4), MMR (p2), NZL (p3–5), PHL (p3–5), SGP (p5), KOR (p3, p5), THA (p2, p3), VNM (p3) |
| LAO | AUS (p2, p3), BRN (p2–4), KHM (p3, p4), CHN (p2), IDN (p3), JPN (p3), MYS (p2, p3), MMR (p2–4), NZL (p2, p3), PHL (p2–4), SGP (p2), KOR (p4) | AUS (p4), KHM (p2), CHN (p3, p5), IDN (p4), JPN (p5), NZL (p4), SGP (p3), KOR (p3), THA (p2–5), VNM (p2–5) | AUS (p5), BRN (p5), KHM (p5), CHN (p4), IDN (p5), JPN (p2, p4), MYS (p4, p5), MMR (p5), NZL (p5), PHL (p5), SGP (p4, p5), KOR (p2, p5) |
| PHL | AUS (p2–5), BRN (p2–5), KHM (p2–5), CHN (p3), IDN (p3–5), JPN (p5), LAO (p2–5), MYS (p3–5), MMR (p3), NZL (p3, p5), SGP (p2, p4, p5), KOR (p3–5), THA (p2–5), VNM (p4, p5) | CHN (p2), VNM (p2) | CHN (p4, p5), IDN (p2), JPN (p2–4), MYS (p2), MMR (p2, p4, p5), NZL (p4), SGP (p3), KOR (p2), VNM (p3) |
Publisher’s Note: MDPI stays neutral with regard to jurisdictional claims in published maps and institutional affiliations. |
© 2021 by the authors. Licensee MDPI, Basel, Switzerland. This article is an open access article distributed under the terms and conditions of the Creative Commons Attribution (CC BY) license (http://creativecommons.org/licenses/by/4.0/).
Share and Cite
Erokhin, V.; Tianming, G.; Ivolga, A. Cross-Country Potentials and Advantages in Trade in Fish and Seafood Products in the RCEP Member States. Sustainability 2021, 13, 3668. https://doi.org/10.3390/su13073668
Erokhin V, Tianming G, Ivolga A. Cross-Country Potentials and Advantages in Trade in Fish and Seafood Products in the RCEP Member States. Sustainability. 2021; 13(7):3668. https://doi.org/10.3390/su13073668
Chicago/Turabian StyleErokhin, Vasilii, Gao Tianming, and Anna Ivolga. 2021. "Cross-Country Potentials and Advantages in Trade in Fish and Seafood Products in the RCEP Member States" Sustainability 13, no. 7: 3668. https://doi.org/10.3390/su13073668
APA StyleErokhin, V., Tianming, G., & Ivolga, A. (2021). Cross-Country Potentials and Advantages in Trade in Fish and Seafood Products in the RCEP Member States. Sustainability, 13(7), 3668. https://doi.org/10.3390/su13073668