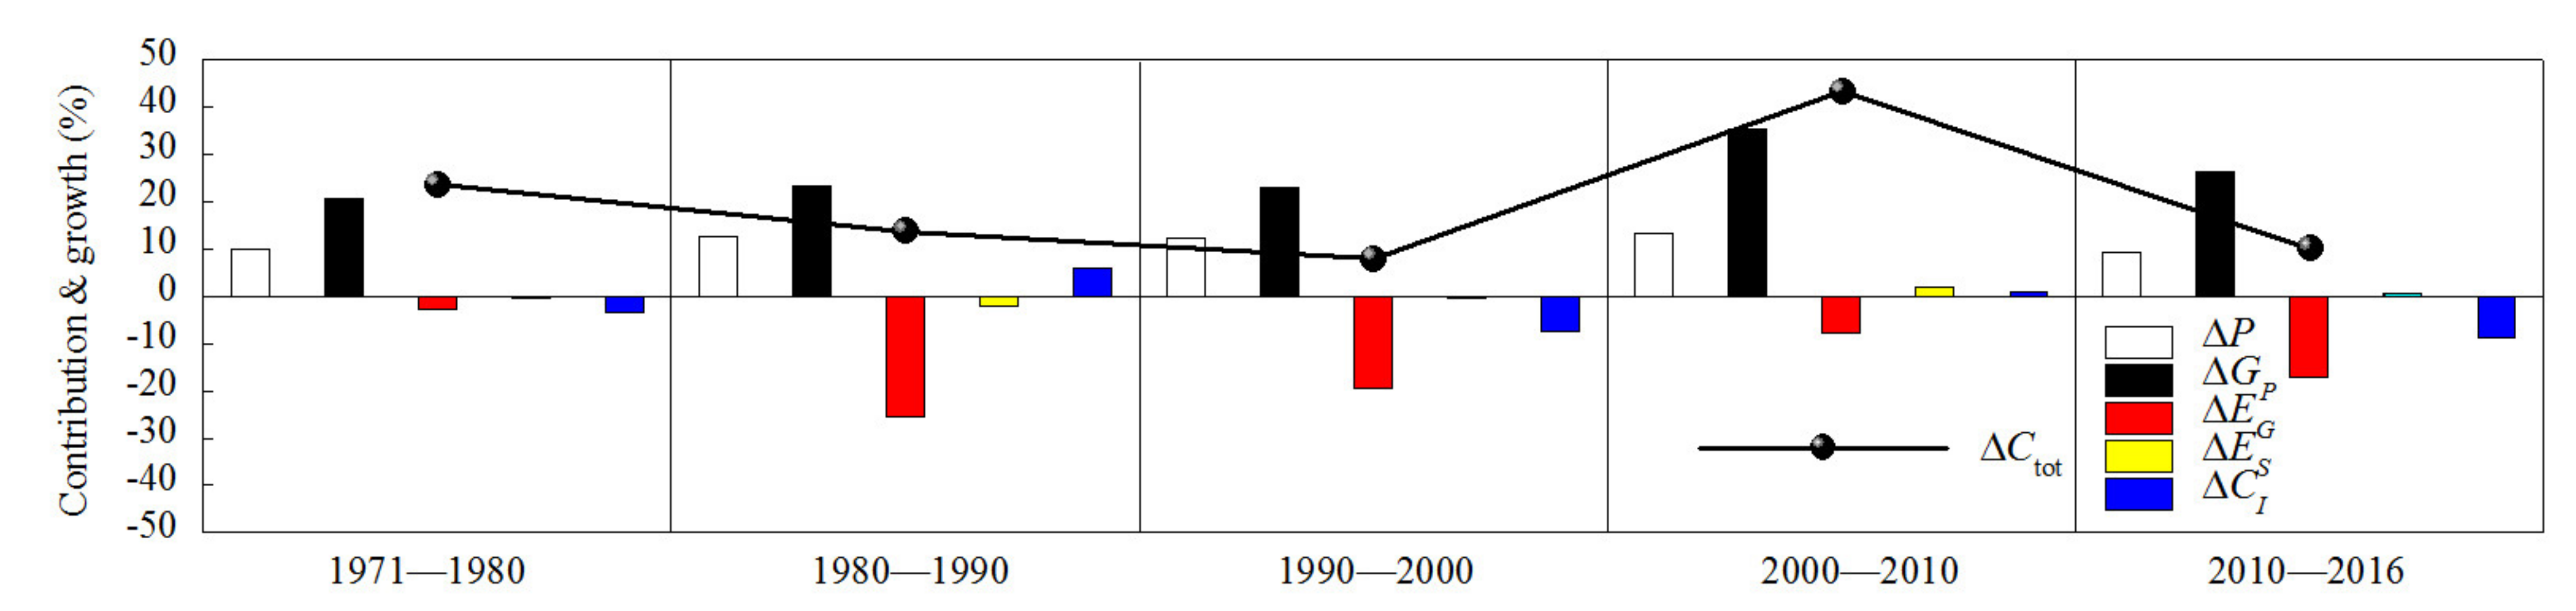
3.3.2. Decomposition Results of Seven Different Regions by Their Geographical Locations for Five Different Periods
The CO
2 emission change and the effects of the decomposed drivers from seven different regions by their geographical locations for five different periods are shown in
Table 6. The corresponding percentage change of CO
2 emission growth and the contribution of the decomposed drivers’ effects are depicted in
Figure 5. The average annual change percentage of CO
2 emission and the contribution rates of drivers for the five different periods are shown in
Table 7.
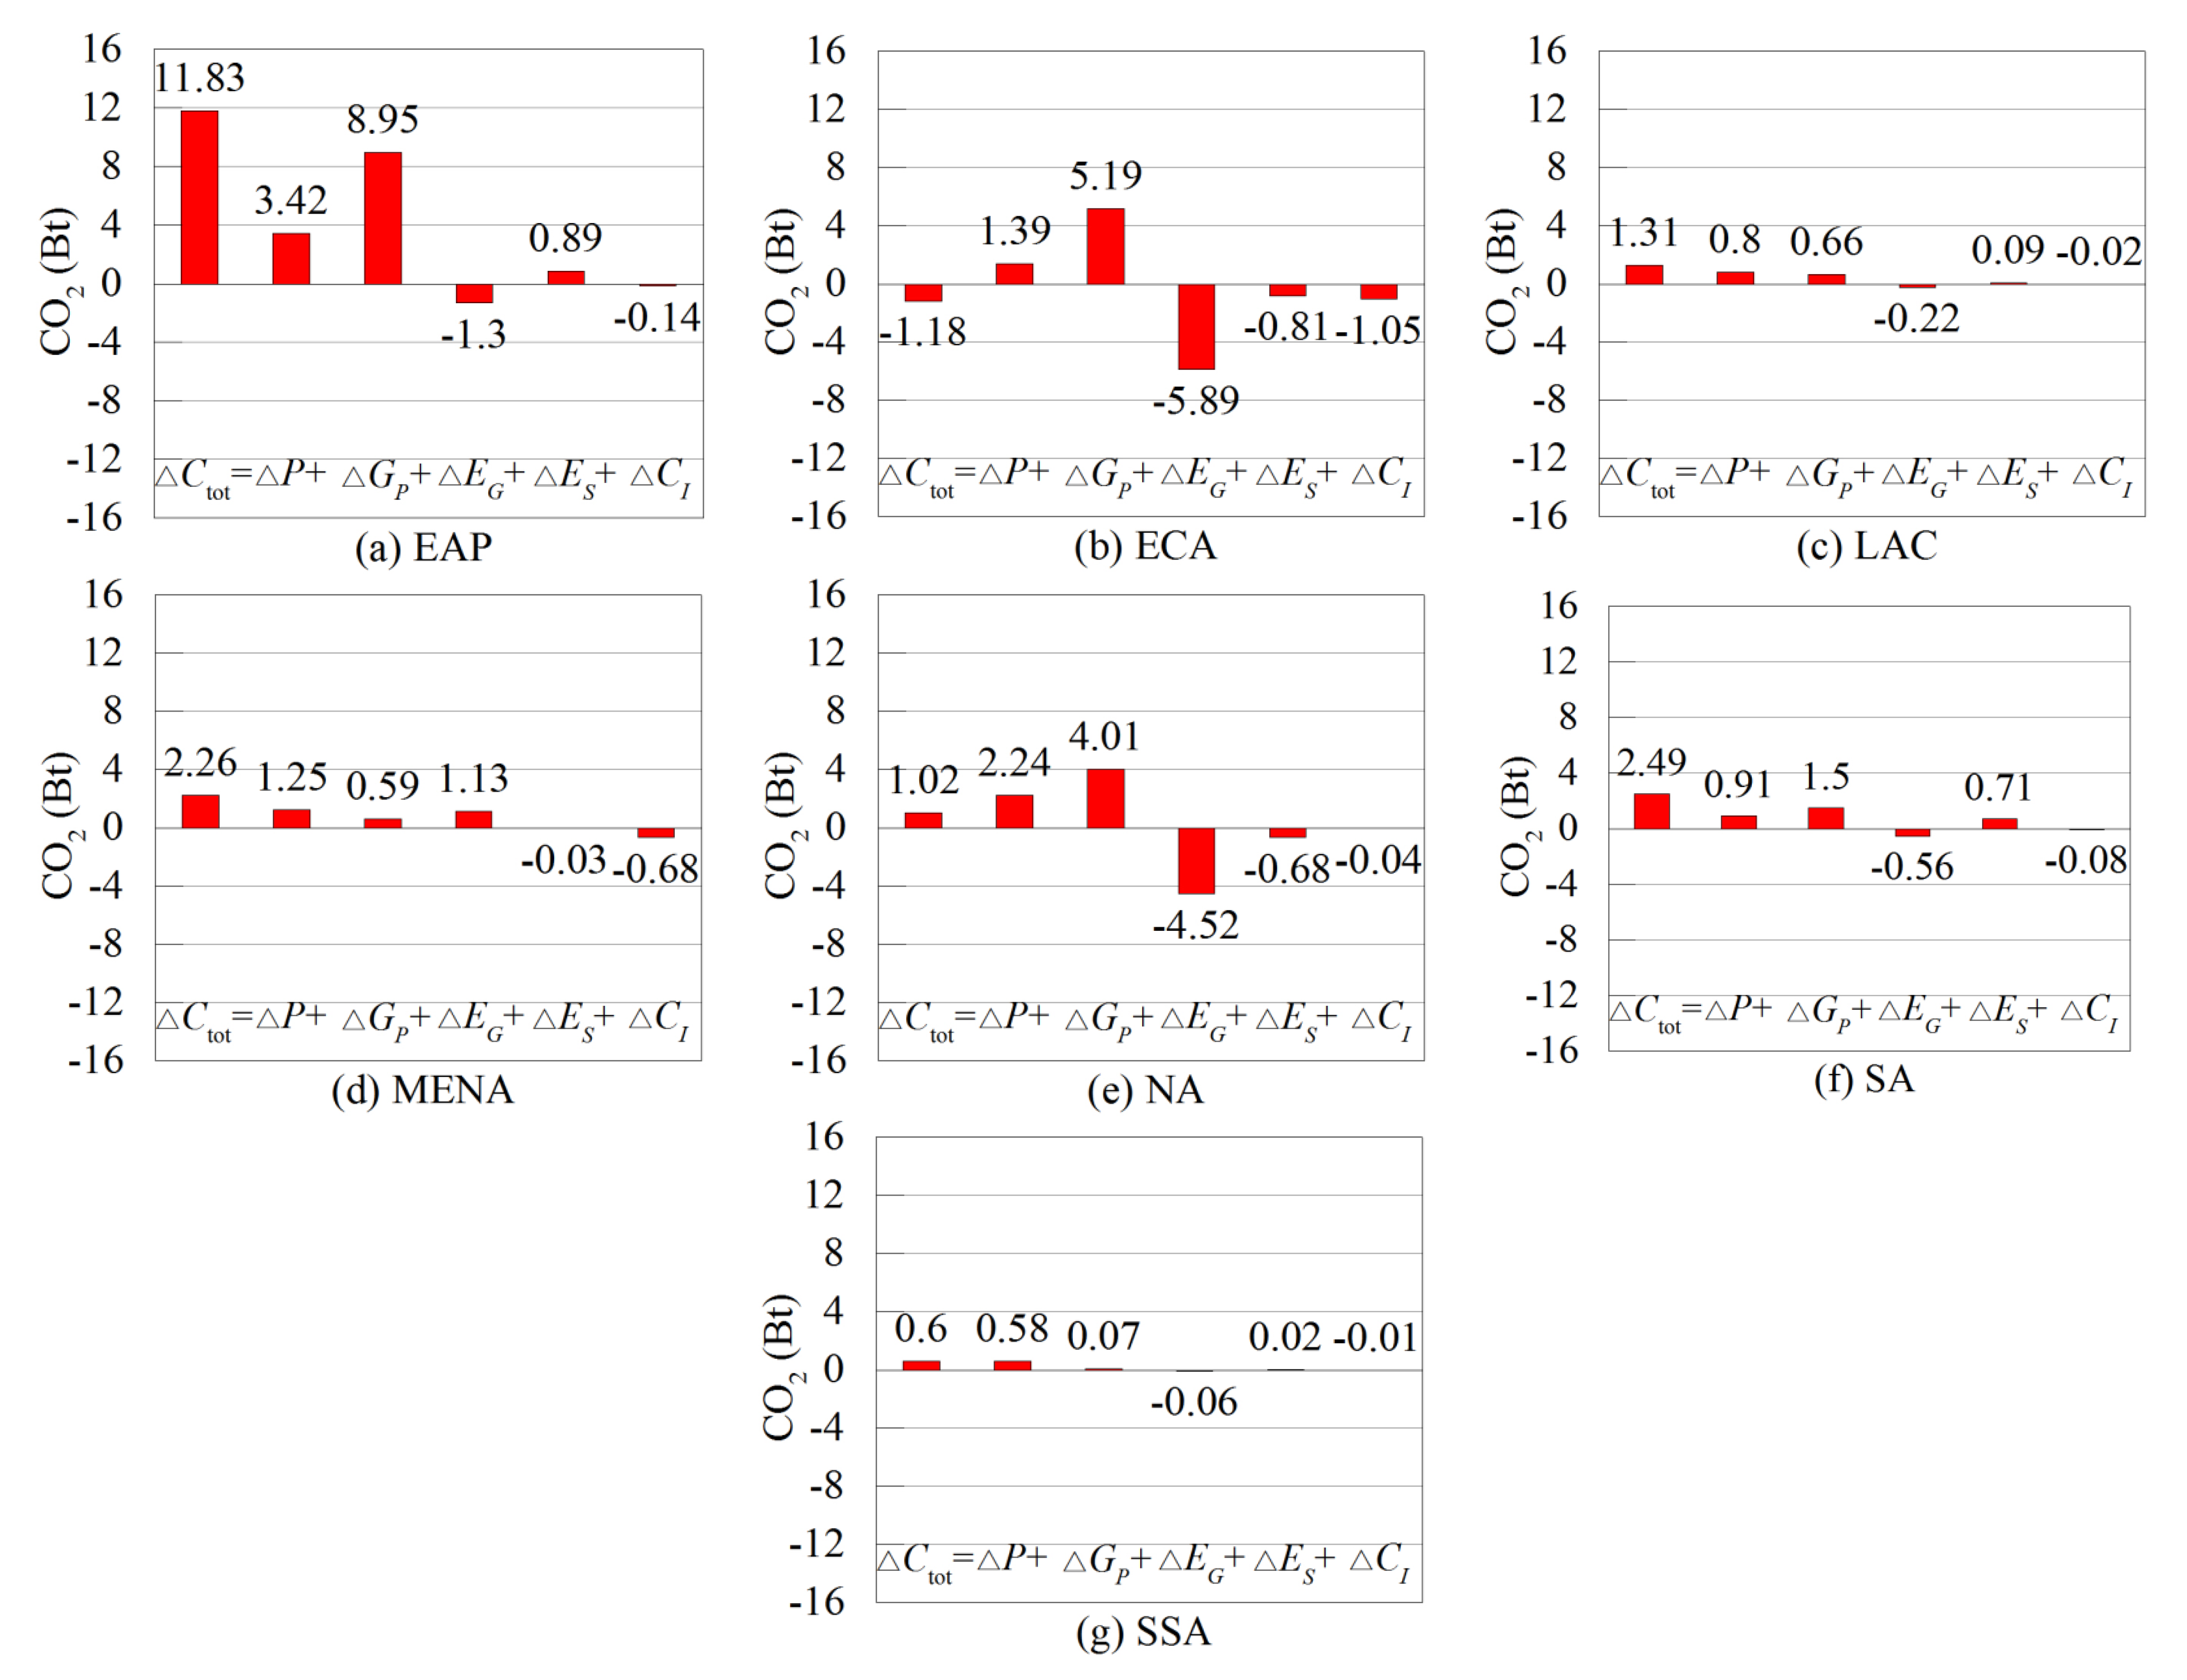
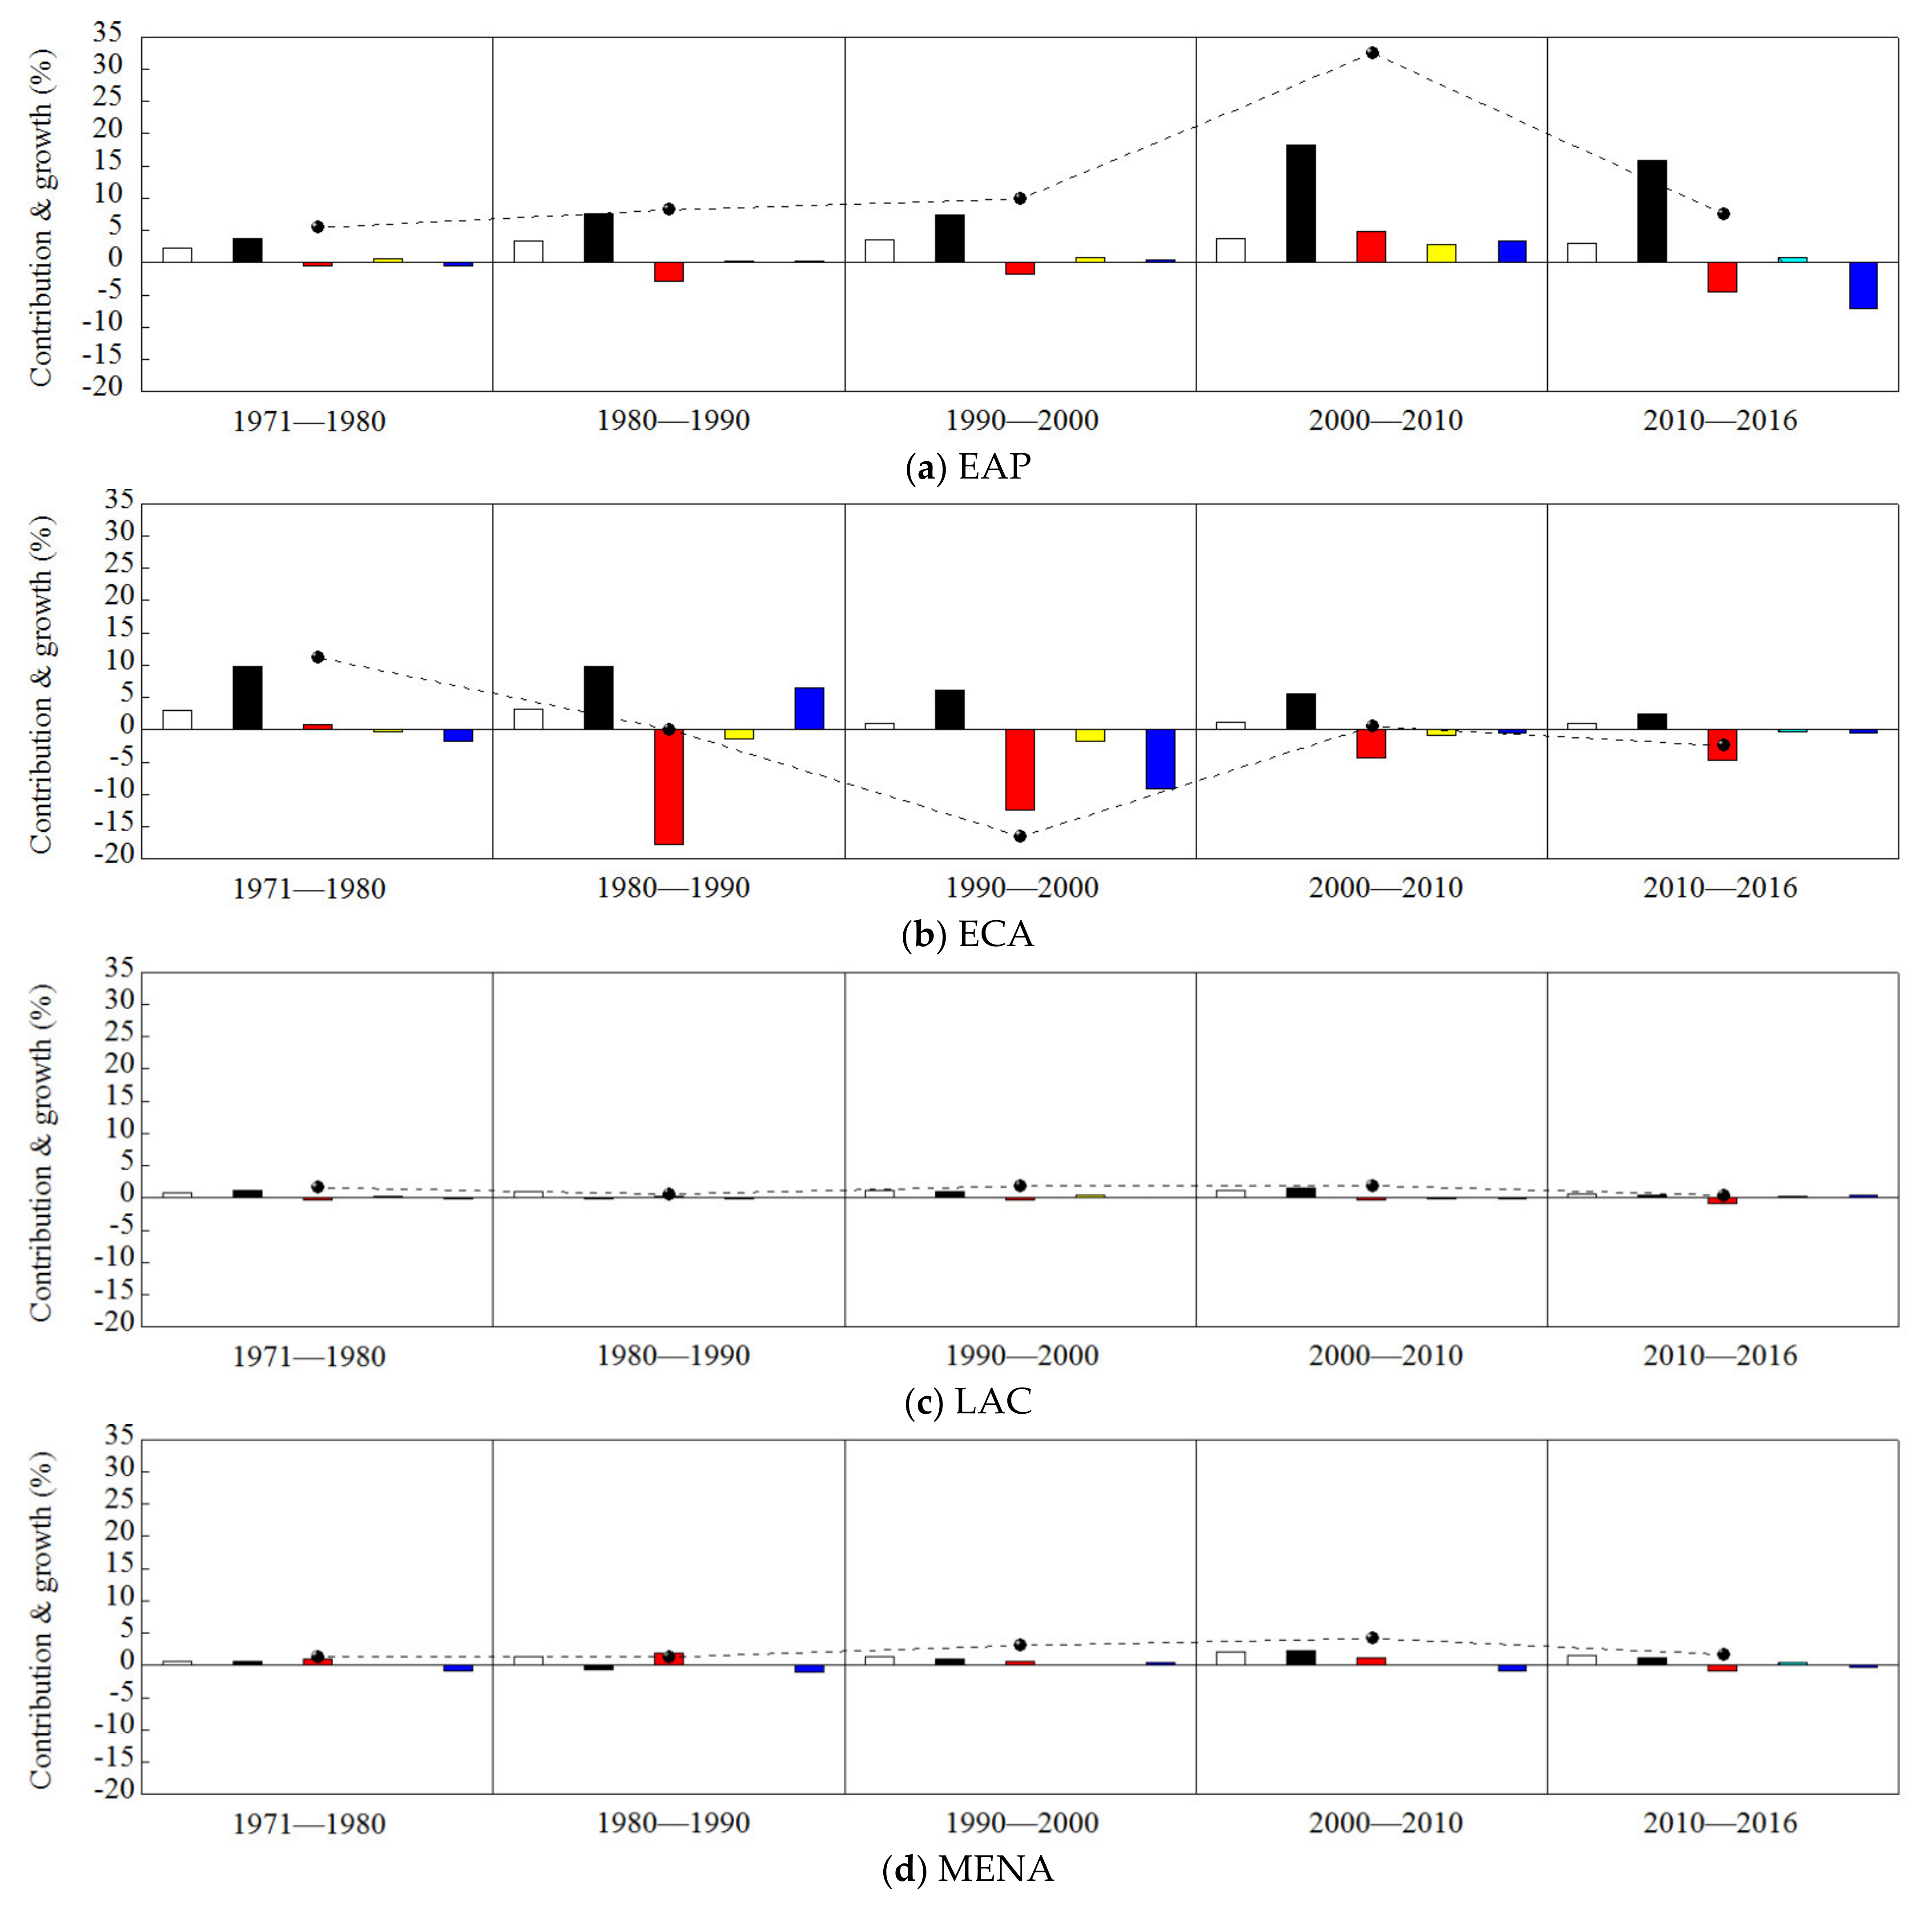
EAP: The CO
2 emissions of EAP increased by 1023.86 Mt, with a change of 5.59% to total CO
2 growth and an average annual change rate of 0.62% in the first stage (
Figure 5a,
Table 6 and
Table 7). Then, it decreased by 1533.85 Mt, with a change of 8.37% and an average annual change rate of 0.84% in the second stage. In the third stage, CO
2 increased again by 1851.81 Mt, with a change of 10.10% and an average annual change rate of 1.01%. Then, it sharply increased by 6011.41 Mt, with a change of 32.80% and an average annual change rate of 3.28% in the fourth stage. In the fifth stage, CO
2 increased again by 1405.60 Mt, with a change of 7.67% and an average annual change rate of 1.28%. Overall, the CO
2 emission of EAP exhibited a sequentially increasing trend, with a total growth amount of 11,826.53 Mt (
Table 6).
The population of EAP always had a driving impact on CO
2 emission growth, with the increasing effects of 426.73, 603.62, 645.86, 690.27, and 538.42 Mt and average annual contributions of 0.26%, 0.33%, 0.35%, 0.38%, and 0.49% from Stages 1 to 5, respectively, to total CO
2 growth (
Table 6 and
Table 7). Similarly, economic output also always had a driving impact on CO
2 emission growth, with the increasing effects (average annual contributions) of 684.82 (0.42%), 1374.18 (0.75%), 1353.35 (0.74%), 3339.65 (1.82%), and 2904.74 Mt (2.64%). However, energy intensity had an overall mitigating impact on CO
2 emission growth (except for the fourth stage), with the changing effects (average annual contributions) of −106.34 (−0.06%), −538.08 (−0.29%), −346.52 (−0.19%), 880.24 (0.48%) and −836.54 Mt (−0.76%). The energy structure effect always had a small but driving influence on CO
2 emissions, with the changing effects (average annual contributions) of 111.45 (0.07%), 41.29 (0.02%), 142.20 (0.08%), 504.36 (0.28%), and 125.89 Mt (0.11%). Even so, the carbon coefficient had still an overall mitigating impact (except for the second, third, and fourth stages), with the changing effects (average annual contributions) of −92.79 (−0.06%), 52.84 (0.03%), 56.92 (0.03%), 596.90 (0.33%), and −1326.90 Mt (−1.21%). These results indicate that the REC effect of EAP had an overall mitigating impact on driving global CO
2 emission by deteriorating the structure of energy use or increasing the corresponding carbon coefficient, with average annual contributions of 0.01% (=0.07% − 0.06%), 0.05% (=0.02% + 0.03%), 0.11% (=0.08% + 0.03%), 0.61% (=0.28% + 0.33%), and −1.10% (=0.11% − 1.21%), respectively.
ECA: The CO
2 emission of ECA increased by 2089.63 Mt, with a change of 11.40% and an average annual change rate of 1.27% in the first stage (
Figure 5b,
Table 6 and
Table 7). It slightly increased by 35.17 Mt, with a change of 0.19% and an average annual change rate of 0.02% in the second stage. However, in the third stage, CO
2 sharply decreased by −3002.11 Mt, with a change of −16.38% and an average annual change rate of −1.64%. Then, it slightly increased again by 131.64 Mt, with a change of 0.72% and an average annual change rate of 0.07% in the fourth stage. In the fifth stage, CO
2 slightly decreased again by −429.72 Mt, with a change of −2.34% and an average annual change rate of −0.39%. Overall, the CO
2 emissions of ECA exhibited an unstable decreasing trend, with a total change amount of −1175.39 Mt (
Table 6).
Similarly, the population of ECA always had a driving impact on CO2 emission growth, with the increasing effects (average annual contributions) of 551.73 (0.33%), 563.43 (0.31%), 184.71 (0.10%), 202.12 (0.11%), and 165.63 Mt (0.15%). Economic output also always had a driving impact, with increasing effects (average annual contributions) of 1783.13 (1.08%), 1808.50 (0.99%), 1118.87 (0.61%), 1009.14 (0.55%) and 439.96 Mt (0.40%). Energy intensity had an overall mitigating effect (except for the first stage), with the changing effects (average annual contributions) of 148.16 (0.09%), −3257.64 (−1.78%), −2278.21 (−1.24%), −808.50 (−0.44%), and −861.52 Mt (−0.78%). The energy structure effect always had a mitigating influence, with the changing effects (average annual contributions) of −62.18 (−0.04%), −271.80 (−0.15%), −345.57 (−0.19%), −163.68 (−0.09%), and −73.62 (−0.07%). Nevertheless, the carbon coefficient had an overall mitigating impact (except for the second stage), with the changing effects (average annual contributions) of −331.21 (−0.20%), 1192.67 (0.65%), −1681.91 (−0.92%), −107.44 (−0.06%), and −100.17 Mt (−0.09%). Thus, the REC effect of ECA had an overall mitigating impact on global CO2 emissions, with average annual contributions of −0.24% (=−0.04% − 0.20%), 0.50% (=−0.15% + 0.65%), −1.11% (=−0.19% − 0.92%), −0.15% (=−0.09% − 0.06%) and −0.16% (=−0.07% − 0.09%), respectively.
LAC: The CO
2 emission of LAC increased by 326.78 Mt, with a change of 1.78% and an average annual change rate of 0.20% in the first stage (
Figure 5c,
Table 6 and
Table 7). It increased by 133.45 Mt, with a change of 0.73% and an average annual change rate of 0.07% in the second stage. In the third stage, CO
2 increased again by 365.09 Mt, with a change of 1.99% and an average annual change rate of 0.20%. Then, it increased again by 374.96 Mt, with a change of 2.05% and an average annual change rate of 0.20% in the fourth stage. In the fifth stage, CO
2 increased again by 104.91 Mt, with a change of 0.57% and an average annual change rate of 0.10%. Overall, the CO
2 emission of LAC also exhibited a sequentially increasing trend, with a total growth amount of 1305.19 Mt (
Table 6).
The population always had a driving impact, with the increasing effects (average annual contributions) of 141.08 (0.09%), 188.69 (0.09%), 191.20 (0.09%), 191.26 (0.09%) and 112.95 Mt (0.10%). Economic output had an overall driving impact (except for the second stage), with the increasing effects (average annual contributions) of 214.58 (0.13%), −44.47 (−0.02%), 157.97 (0.09%), 287.30 (0.16%), and 74.10 Mt (0.07%). However, energy intensity had an overall mitigating impact (except for the second stage), with the changing effects (average annual contributions) of −46.67 (−0.03%), 33.89 (0.02%), −52.42 (−0.03%), −62.27 (−0.03%), and −168.85 Mt (−0.15%). However, the energy structure effect had an extremely unstable impact, with the changing effects (average annual contributions) of 52.47 (0.03%), −35.89 (−0.02%), 56.67 (0.03%), −18.20 (−0.01%), and 20.20 Mt (0.02%). Similarly, the carbon coefficient effect also had an extremely unstable impact, with the changing effects (average annual contributions) of −34.67 (−0.02%), −8.77 (−0.00%), 11.67 (0.01%), −23.13 (−0.01%), and 66.51 Mt (0.06%). Thus, the REC effect of LAC had an overall driving impact on global CO2 emissions (except for the second and fourth stages), with average annual contributions of 0.01% (=0.03% − 0.02%), −0.02% (=−0.02% − 0.00%), 0.04% (=0.03% + 0.01%), −0.02% (=−0.01% − 0.01%) and 0.08% (=0.02% + 0.06%), respectively.
MENA: The CO
2 emission of MENA increased by 271.83 Mt, with a change of 1.48% and an average annual change rate of 0.16% in the first stage (
Figure 5d,
Table 6 and
Table 7). It increased by 259.62 Mt, with a change percentage of 1.42% and an average annual change rate of 0.14% in the second stage. In the third stage, CO
2 increased again by 593.47 Mt, with a change of 3.24% and an average annual change rate of 0.32%. Then, it increased again by 795.80 Mt, with a change of 4.34% and an average annual change rate of 0.43% in the fourth stage. In the fifth stage, CO
2 increased again by 339.67 Mt, with a change of 1.85% and an average annual change rate of 0.31%. Overall, the CO
2 emission of MENA exhibited a sequentially increasing trend, with a total growth amount of 2260.39 Mt (
Table 6).
The population always had a driving impact, with the increasing effects (average annual contributions) of 122.69 (0.07%), 237.09 (0.13%), 246.74 (0.13%), 372.25 (0.20%), and 283.71 Mt (0.26%). The economic output effect had an overall driving impact (except for the second stage), with the increasing effects (average annual contributions) of 111.52 (0.07%), −127.95 (−0.07%), 178.97 (0.10%), 391.19 (0.21%), and 215.17 Mt (0.20%). Energy intensity had an overall driving impact (except for the fifth stage), with the changing effects (average annual contributions) of 190.10 (0.12%), 349.34 (0.19%), 90.26 (0.05%), 218.31 (0.12%), and −154.72 Mt (−0.14%). The energy structure effect had an overall driving impact, with the changing effects (average annual contributions) of −2.62 (−0.00%), 0.65 (−0.00%), −4.63 (−0.00%), −4.33 (−0.00%), and 61.90 Mt (0.06%). However, the carbon coefficient effect had an overall mitigating impact (except for the third stage), with the changing effects (average annual contributions) of −149.86 (−0.09%), −199.51 (−0.11%), 82.14 (0.04%), −181.63 (−0.10%), and −66.38 Mt (−0.06%). Thus, the REC effect of MENA had an overall mitigating impact on global CO2 emissions, with average annual contributions of −0.09% (=−0.00% − 0.09%), −0.11% (=−0.00% − 0.11%), 0.04% (=−0.00% + 0.04%), −0.10% (=−0.00% − 0.10%) and 0.00% (=0.06% − 0.06%), respectively.
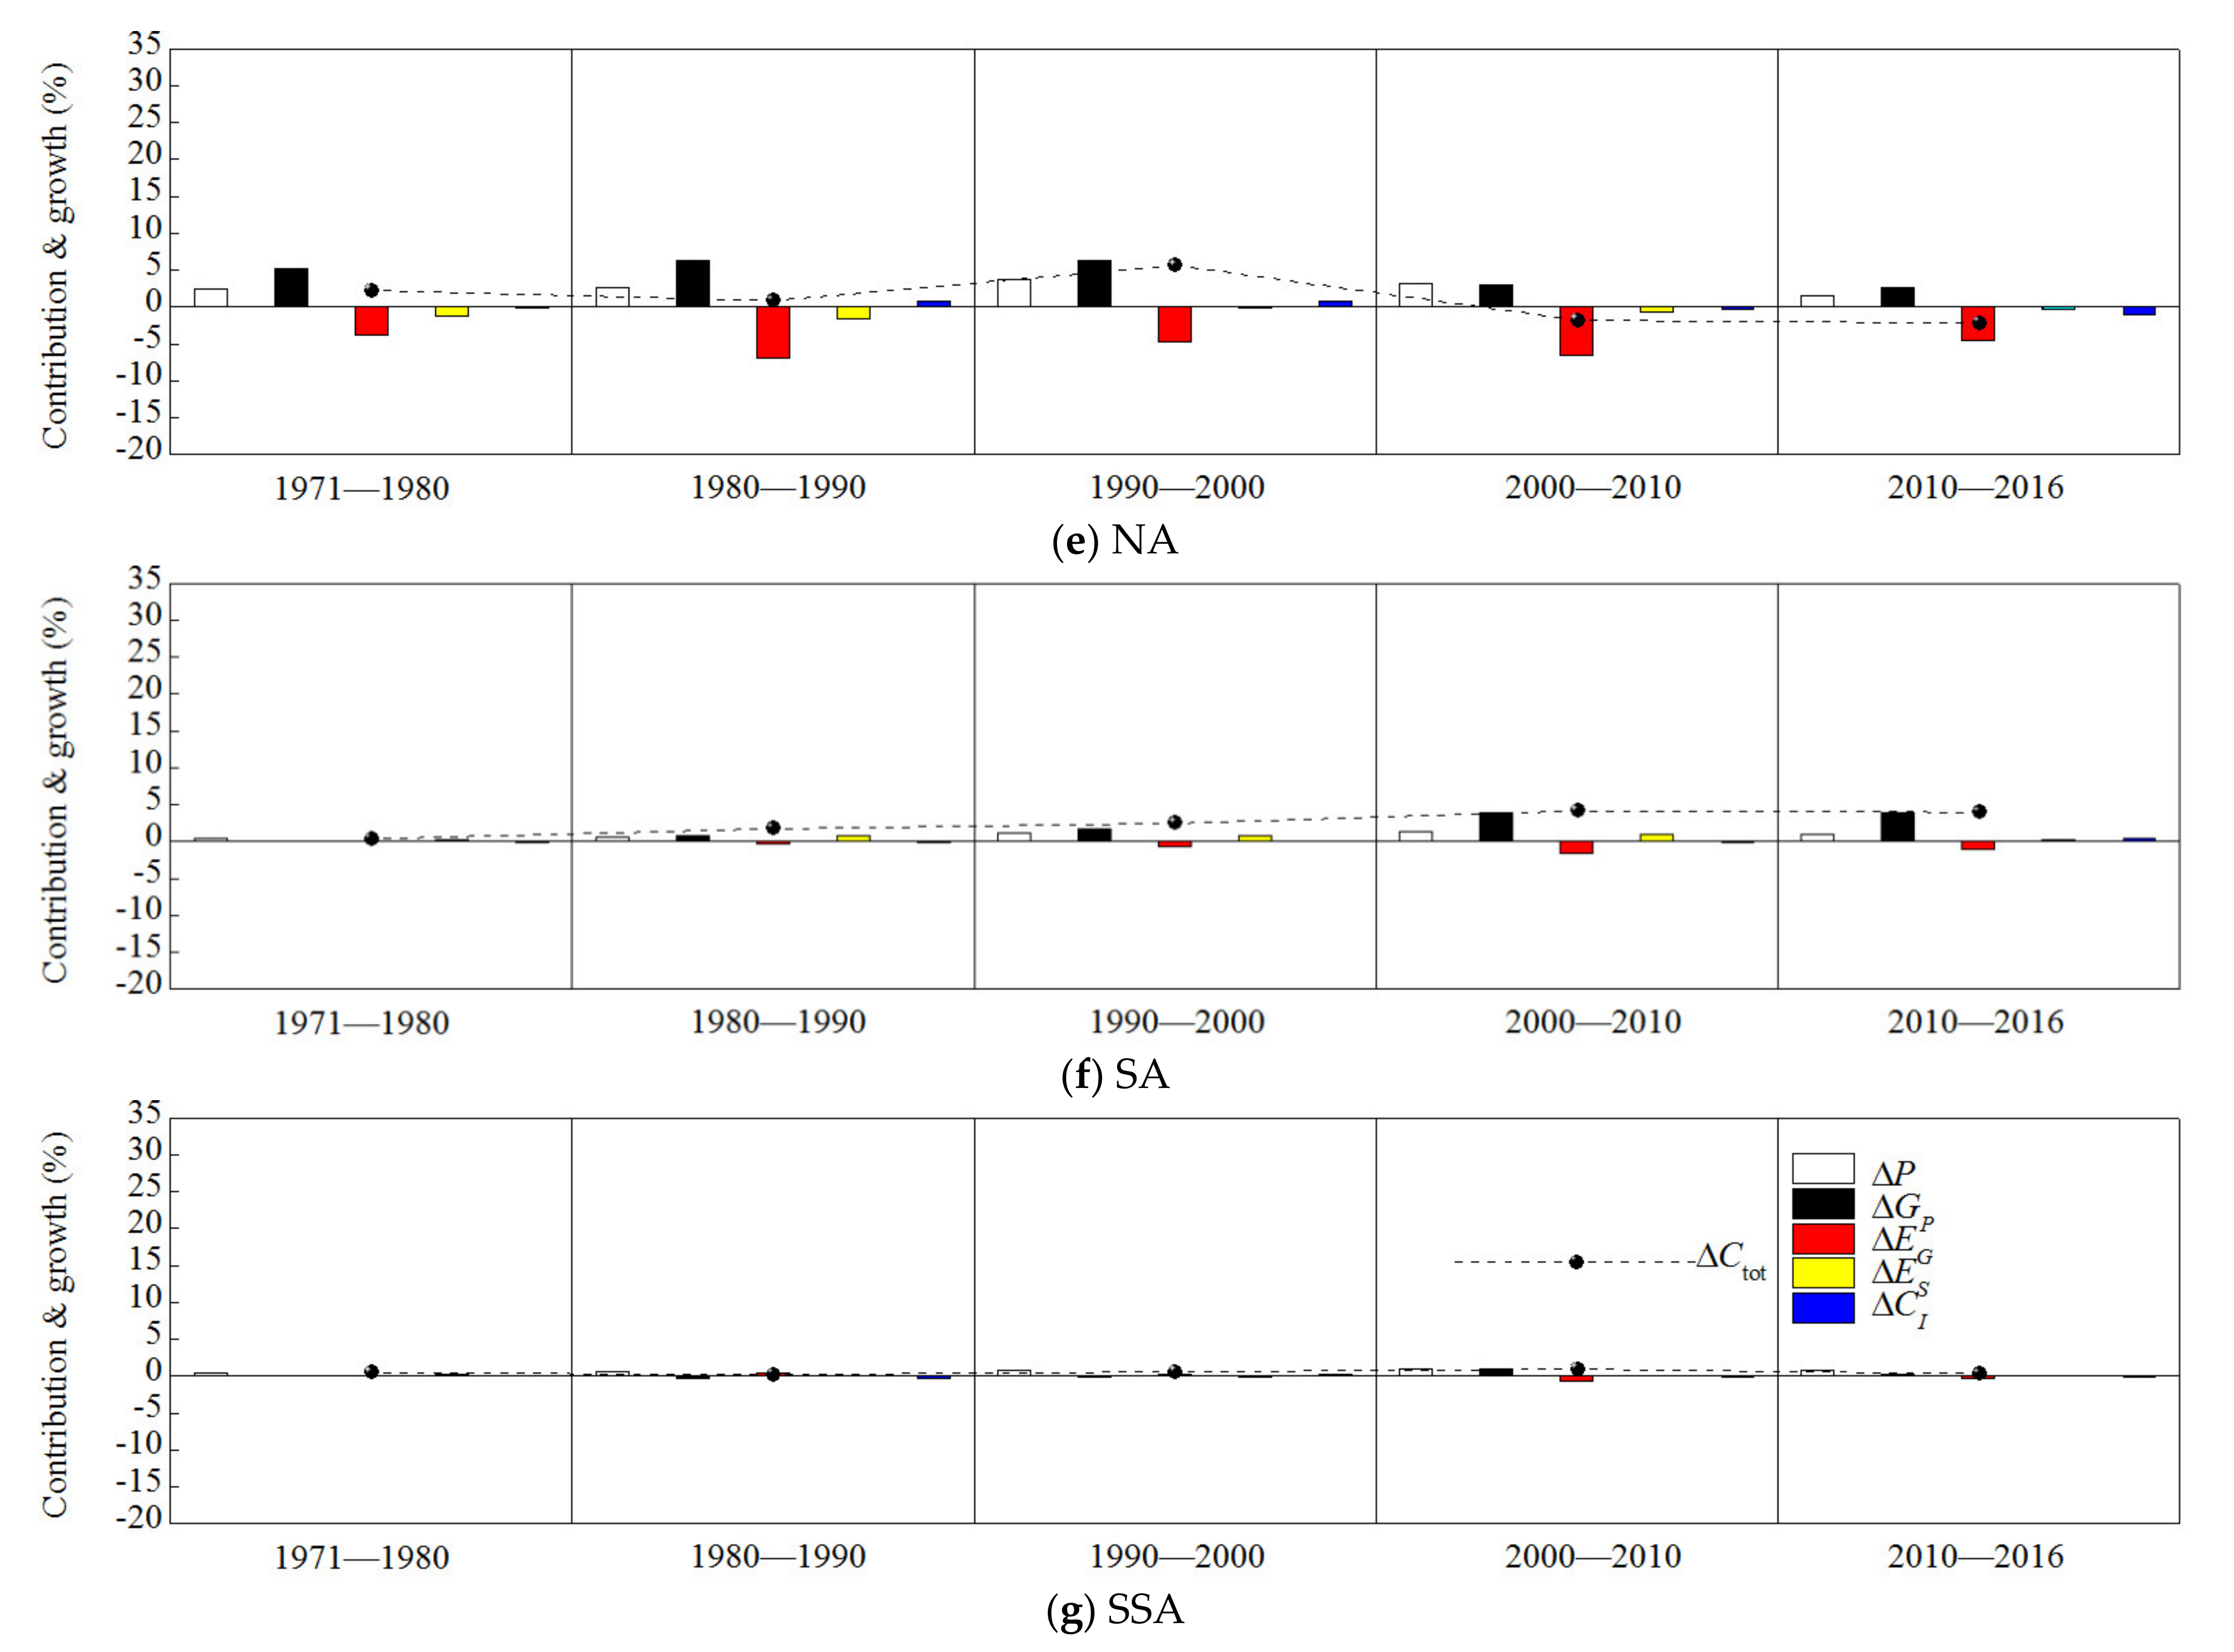
NA: The CO
2 emission of NA increased by 440.00 Mt, with a change of 2.40% and an average annual change rate of 0.27% in the first stage (
Figure 5e,
Table 6 and
Table 7). It slightly increased by 186.67 Mt, with a change of 1.02% and an average annual change rate of 0.10% in the second stage. In the third stage, CO
2 sharply increased again by 1066.08 Mt, with a change percentage of 5.82% and an average annual change rate of 0.58%. However, it decreased by −302.70 Mt, with a change percentage of −1.65% and an average annual change rate of −0.17% in the fourth stage. In the fifth stage, CO
2 decreased again by −372.32 Mt, with a change of −2.03% and an average annual change rate of −0.34%. Overall, the CO
2 emission of NA exhibited an increasing and, later, decreasing trend, although, overall, it was an increasing trend, with a total growth amount of 1017.73 Mt (
Table 6).
The population always had a driving impact, with the increasing effects (average annual contributions) of 436.88 (0.26%), 436.88 (0.27%), 684.15 (0.37%), 564.74 (0.31%), and 256.84 Mt (0.23%). The economic output effect also always had a driving impact, with the increasing effects (average annual contributions) of 940.08 (0.57%), 1153.15 (0.63%), 1147.11 (0.63%), 546.14 (0.30%), and 460.22 Mt (0.42%). However, energy intensity always had a mitigating impact, with the changing effects (average annual contributions) of −704.66 (−0.43%), −1282.23 (−0.70%), −865.79 (−0.47%), −1223.57 (−0.67%), and −826.75 Mt (−0.75%). The energy structure effect also always had a mitigating impact, with the changing effects (average annual contributions) of −217.93 (−0.13%), −298.89 (−0.16%), −17.29 (−0.01%), −117.88 (−0.06%), and −61.91 Mt (−0.06%). The carbon coefficient effect had an overall mitigating impact (except for the second and third stages), with the changing effects (average annual contributions) of −14.37 (−0.01%), 124.31 (0.06%), 117.89 (0.06%), −72.13 (−0.04%), and −200.71 Mt (−0.18%). Thus, the REC effect of NA had an overall mitigating impact on global CO2 emissions (except for the third stage), with average annual contributions of −0.14% (=−0.13% − 0.01%), −0.10% (=−0.16% + 0.06%), 0.05% (=−0.01% + 0.06%), −0.10% (=−0.06% − 0.04%) and −0.24% (=−0.06% − 0.18%), respectively.
SA: The CO
2 emission of SA increased by 98.37 Mt, with a change of 0.54% and an average annual change rate of 0.06% in the first stage (
Figure 5f,
Table 6 and
Table 7). It slightly increased by 350.17 Mt, with a change of 1.91% and an average annual change rate of 0.19% in the second stage. In the third stage, CO
2 increased again by 484.41 Mt, with a change of 2.64% and an average annual change rate of 0.26%. It increased again by 797.47 Mt with a change percentage of 4.35% and an average annual change rate of 0.44% in the fourth stage. In the fifth stage, this CO
2 increased again by 759.27 Mt, with a change of 4.14% and an average annual change rate of 0.69%. Overall, the CO
2 emission of SA exhibited a sequentially increasing trend, with a total growth amount of 2489.69 Mt (
Table 6).
The population always had a driving impact, with the increasing effects (average annual contributions) of 61.76 (0.04%), 115.22 (0.06%), 187.26 (0.10%), 253.23 (0.14%), and 181.56 Mt (0.17%). The economic output effect also always had a driving impact, with the increasing effects (average annual contributions) of 24.56 (0.01%), 154.63 (0.08%), 286.72 (0.16%), 699.91 (0.38%), and 701.11 Mt (0.64%). However, energy intensity always had a mitigating impact, with the changing effects (average annual contributions) of −3.59 (−0.00%), −50.50 (−0.03%), −139.88 (−0.08%), −284.83 (−0.16%), and −208.42 Mt (−0.19%). However, the energy structure effect always had a driving impact, with the changing effects (average annual contributions) of 36.31 (0.02%), 152.55 (0.08%), 151.09 (0.08%), 157.56 (0.09%), and 24.37 Mt (0.02%). The carbon coefficient effect had an overall mitigating impact (except for the fifth stage), with the changing effects (average annual contributions) of −20.66 (−0.01%), −21.72 (−0.01%), −0.79 (−0.00%), −28.39 (−0.02%), and 60.65 Mt (0.06%). Thus, the REC effect of SA had an overall driving impact on global CO2 emissions, with average annual contributions of 0.01% (=0.02% − 0.01%), 0.07% (=0.08% − 0.01%), 0.08% (=0.08% + 0.00%), 0.07% (=0.09% − 0.02%) and 0.08% (=0.02% + 0.06%), respectively.
SSA: The CO
2 emission of SSA increased by 113.64 M,t with a change of 0.62% and an average annual change rate of 0.07% in the first stage (
Figure 5g,
Table 6 and
Table 7). It slightly increased by 65.99 Mt, with a change of 0.36% and an average annual change rate of 0.04% in the second stage. In the third stage, CO
2 increased again by 137.73 Mt, with a change of 0.75% and an average annual change rate of 0.08%. It increased again by 201.03 Mt, with a change of 1.10% and an average annual change rate of 0.11% in the fourth stage. In the fifth stage, CO
2 increased again by 84.20 Mt, with a change percentage of 0.46% and an average annual change rate of 0.08%. Overall, the CO
2 emission of SSA also exhibited a sequentially increasing trend, with a total growth amount of 602.59 Mt (
Table 6).
The population always had a driving impact, with the increasing effects (average annual contributions) of 76.14 (0.05%), 112.82 (0.06%), 125.38 (0.07%), 177.17 (0.10%), and 131.83 Mt (0.12%). The economic output effect had an overall driving impact except for the second and third stages, with the increasing effects (average annual contributions) of 14.50 (0.01%), −56.16 (−0.03%), −31.15 (−0.02%), 172.60 (0.09%), and 44.37 Mt (0.04%). However, energy intensity had an overall mitigating impact except for the second and third stages, with the changing effects (average annual contributions) of −3.41 (−0.00%), 59.34 (0.03%), 17.21 (0.01%), −136.85 (−0.07%), and −71.24 (−0.06%). The energy structure effect had an overall driving impact except for the third and fifth stages, with the changing effects (average annual contributions) of 28.32 (0.02%), 2.49 (0.00%), −19.86 (−0.01%), 8.75 (0.00%), and −3.39 Mt (−0.00%). However, the carbon coefficient effect had an overall mitigating impact except for the third stage, with the changing effects (average annual contributions) of −1.91 (−0.00%), −52.50 (−0.03%), 46.13 (0.02%), −20.63 (−0.01%), and −17.36 Mt (−0.02%). Thus, the REC effect of SSA had an overall mitigating impact on global CO2 emissions, with average annual contributions of 0.02% (=0.02% +0.00%), −0.03% (=0.00% − 0.03%), 0.01% (=−0.01% + 0.02%), −0.01% (=0.00% − 0.01%) and −0.02% (=0.00% − 0.02%), respectively.
It can be easily seen that the CO
2 emission growth and the corresponding drivers’ contributions were exhibited mainly in EAP, ECA, and NA (
Figure 5). Furthermore, the population and economic output almost always had driving effects, the latter often more than the first, especially in the fourth stage of EAP. These results could arise from the fact that some developing countries, such as China (in EAP,
Table A1), had high economic output and, concurrently, rapid economic development. Moreover, energy intensity almost always had a mitigating effect (except in MENA), especially in the second stage of ECA. These results could arise from the fact that many developed countries, such as Germany and Sweden (in ECA,
Table A1), have, for a long time, paid much more attention to enhancing the level of science and technology to increase energy use efficiency and reduce energy intensity and carbon emissions.
It should be noteworthy that CO
2 emission growth and the corresponding drivers’ contributions of LAC, MENA, SA, and SSA were extremely small and can almost be neglected (
Figure 5,
Table 6 and
Table 7). However, an interesting result was that the annual average contribution rate of the energy intensity effect of LAC was positive (0.02%) in the second stage and, concurrently, the annual average contribution rates of the energy structure effect and the carbon coefficient effect were not more than zero (0.00 and −0.02%, respectively). The annual average contribution rate of the REC effect was negative (−0.02% =0.00% − 0.02%). These results indicate that many developing countries (i.e., Panama, Mexico, and Haiti) of LAC have recently developed their own economy and reduced carbon emissions only by using more and more renewable energy to replace the utilization of fossil energy such as coal, oil, and natural gas. These countries worry that they have not paid attention to improving their level of science and technology and production efficiency for saving energy and reducing energy intensity. Hence, with the fast development of their economy and rapid growth of REC, energy intensity exhibited a driving impact, although the REC effect brought out an obvious mitigating impact on CO
2 emission growth (
Table 7). Similar situations can also be seen in the first stage of ECA, the first, second, and fourth stages of MENA, and the second stage of SSA.


 CO2 decrease
 CO2 growth


