Article

Sustainable Development with Schumpeter Extended Endogenous Type of Innovation and Statistics in European Countries

Department of Finance and Accounting, Faculty of Economic Sciences, Lucian Blaga University of Sibiu, 550324 Sibiu, Romania
*
Author to whom correspondence should be addressed.
Sustainability 2021, 13(7), 3848; https://doi.org/10.3390/su13073848
Submission received: 5 March 2021 / Revised: 25 March 2021 / Accepted: 26 March 2021 / Published: 31 March 2021

Abstract

:
In the economic growth models, technological progress is either exogenous or endogenous. The endogenized theory is based on analytical modeling of the economic process in order to include the event of innovating. Theory around the subject innovation and economic growth also includes several independent parameters that have a strong impact over innovation. However, few of them established creativity as an independent parameter of innovation. The present paper aims to extend the endogenized theory in order to include creativity as an independent parameter of innovation, based on the evidence of a panel data of 28 countries, through 8 years. A theoretical model, a multiple linear regression, an ANOVA analysis and correlational matrixes were used in order to fulfill our purpose. Results show that innovation is determined by the level of knowledge twice as much as the level of creativity. A conceptual framework for an extension of endogenous growth models, in order to include creativity, is presented in the paper. The model can enhance economic growth by fostering creativity or knowledge and thus, the size of innovation, which is the main driver for economic growth in the model presented.

1. Introduction

In the economic growth models, technological progress is either exogenous [1,2] or endogenous [3,4,5,6] driven by horizontal innovation [3,5] or learning by doing [6] in the neoclassical perspective. Additionally, from the Aghion-Howitt [7,8,9,10,11] or Reinganum perspective [12], vertical innovation in the neo-classical Schumpeterian perspective was constructed upon a model of “creative destruction”. The replicator principle in the evolutionary perspective is based on a selection process, following the replicator equation, involving different decisions for each economic actor, thus being the driving force of the economic growth [13,14,15]. In [16], technological change is “cumulative” and the model involves the savings, knowledge and startups diffusion, in contrast with [17], where the function is based on the expansion of new techniques, based on innovation, or continued with [18,19], where heterogenic sectors are involved.
The endogenized theory is based on analytical modeling of the economic process in order to include the event of innovating and, thus, generating economic growth by technological progress, and productivity growth [20]. Some scholars connected the innovation process with creativity and other inner dependencies [21,22], or constructed a specific type of creativity, like economical creativity [23] and creativity as investment [24,25,26,27], but, still, a deeper research of the connection between the two concepts (creativity and innovation) is appropriate, since there is no evidence of the impact of creativity on innovation, at the macroeconomic level. The literature provides evidence of the impact of firm-level creativity over the firms’ success [22], the economic results [23] or the economic growth [21], while individual creativity is discussed only from the perspective of particular or firm-level development. The problem of the individual level of creativity and its impact over the economic growth or the level of innovation was not found in the targeted literature.
Present study aims to determine the effect of creativity over the level of innovation, first by extending an endogenous model of creative destruction, and then by applying the model on a panel of data. Another topic discussed in the present paper concerns about the sustainable character of the innovation process. Thus, the first objective of the present study is related to the extension of an endogenous economic growth model, by endogenizing innovation. It is desired, then, to identify the influence of creativity on innovation, by applying the model on a macroeconomic indicators panel. The third objective is to approach the concept of innovation sustainability, especially within the concern of creative destruction.
The present model endogenizes not only the technological progress, but also the size of the innovation itself, defined as the quality of the innovation, since, in the basic model used in the present paper, innovation is characterized by the occurrence rate and the size of the innovation, which was not defined in the basic model. The extension of the model incorporated creativity, knowledge (defined as previous innovation) and the managerial competence.
In every mature economy, much interest is shown to knowledge in regard to innovation and economic growth, especially when the concept of development is involved. The present paper aims to overcome the classical perspective by validating creativity as a very important aspect of any innovation that might determine a sustainable development of a process. The validation is made both theoretically and empirically by using a time-series data panel of over 230 values of aggregated indexes, composed of over 9 dimensions. As innovation was statistically proven to be the driver of economic growth in neoclassical perspectives using panel data [1,2], it is an example of good practice for future extensions of similar models to use the same method. Data used was obtained accessing Europe.eu, Worldbank data and Eurostat.
The main contribution of the paper consists in extending the current theory of innovation in the process of economic growth, statistically validating the dependency of innovation on creativity and knowledge by using a time-series analyze of European countries for a range of 8 years. The paper is also discussing the sustainable part of the innovation, improving the concept of innovation process by defragmenting it in three chronological phases. The model is applicable in every model of economic growth, when technological progress is a result of innovation, being a further explanation of how to acquire the innovation itself, mainly if a sustainable innovation is a priority.
This paper is structured in six sections. In the second section, an extensive literature review of the analyzed topics is provided, focusing on economic growth models and theories that enhance innovation as the primer promoter of economic growth and creativity, especially those theories that merge creativity within the innovation process in some way or capture the value of creativity for entrepreneurship. The third part presents the endogenous-Schumpeterian model of economic growth through innovation, which is exactly the model extended in the present paper by introducing motivation, knowledge and creativity as parameters of innovation. The fourth part presents an extension of the model to include creativity, the motivation to include each parameter alone, and theories that support the current findings. The five part presents the statistical validation of the model, including the main dependencies, while the sixth part presents some discussions and conclusions.

2. Literature Review

2.1. Framework

In the field of economic growth, the most aporic work was made by Solow and Swan in the neo-classical growth model, constructing output as an aggregated function of capital, labor, and technology and introducing technological progress as the main driver of economic growth [1,2]. Further models that tend to endogenize the technological progress that was only postulated in the Solow-Swan model, concluded in two directions: neo-classical models and evolutionary models. Romer and Lucas pioneered the neo-classical approach of the exogenous Solow-Swan model, by endogenizing the technological progress [3,4,28]. One approach was “learning by doing” ability of the workers in the economy, which are permanently streamlining their performance, therefore generating growth [6]. Another endogenous approach are Romer’s models that endogenized technological progress, first by setting that technology grows at the same rate with capital (generating thus the AK approach, a model named after its inner equations, where A representing a productivity parameter, while K is capital, based on capital accumulation, capital being understood as physical, intangible and human capital or, in a holistic way, as knowledge) [29], and secondly by increasing the technology parameter, A, through extending the variety of products, introducing new, but not necessary developed ones, focusing on horizontal innovation [3]. Additionally, Grossman and Helpman introduced a model of vertical product innovation, by “repeated product improvements in a continuum of sectors” [30], structured on three sectors (the research sector, intermediate product sector, and final production sector). The model is stochastic, and quality of the product is always improving. The economy growth rate is constant and positively correlated with R&D activity. The model also includes a different approach, of horizontal innovation but consists to underline its vertical progress [5].
As further thinking models occurred, Joseph Schumpeter introduced the concept of “creative destruction” as the force that “tends to make old innovations, technologies and skills become obsolete” [10]. This creative destruction is the one that ensures the long run growth of an economy by destabilizing the no-growth equilibrium that was established by the actions of hedonistic economic beings, as Schumpeter himself called the non-innovators. The creative destruction is the result of the innovation that also relies on investments like R&D (research and development) and is conducted by the energetic entrepreneurs.
A “neo-classical Schumpeterian approach” of Aghion-Howitt composes technological progress as a result of competition and profit maximizations of the entities which have the power to innovate, constructing innovation as a function of arrival rate and size. In Aghion-Howitt model, a distinction is made between innovation sector, consumption and intermediate sector, thus having different competitive environments [7,8,9,10,11]. Reinganum also constructed a model of “creative destruction”, involving monopoly of the firm that succeeded to innovate and a continuum of innovation that restores the balance of the economy by installing another monopolist. It also involves all Schumpeterian innovations: new organization method, production or transportation methods, markets or goods [12].
In the evolutionary framework, (e.g., Nelson and Winter [13], Dosi [14], Sahal [15]), based on Veblen [31], and Schumpeter theory [20], the economy is heterogenic, involving a selection process, economic actors possessing diverse characteristics. Thus, the decision rule is different from actor to actor. Here, the innovation results from R&D activities. The driving force of the economic growth in the evolutionary view is the replicator equation. In the Conlisk model, technological change is “cumulative” and output is a function of savings, diffusion of new knowledge, and productivity distribution of startups [16]. In the Silverberg and Lehnert model, creative destruction is modeled as a function of the expansion of new techniques through innovation and contraction of the low-profitable techniques [17]. The objective of the decision makers, in the replicator equation, is to maximize the profit. Verspagen proposed an economy with heterogenic sectors that differ in the goods they produce and in labor productivity [18,19]. In the replicator equation, the objective of each sector is cost minimization.

2.2. Creativity, Knowledge and Motivation in Innovation Theory

In the work of Kafka and Petrakis, creativity is the generator of microeconomic growth, strongly related with innovation and entrepreneurship [21]. They stated that, among other factors of influence, like passion, also found as growth parameter in [32,33], or entrepreneurial leadership, also found in [34,35], creativity is a force that conducts to microeconomic growth [21]. Heunks states that creativity fosters innovation and success only in older firms (>32 years) [22]. Ko and Butler constructed the concept of “entrepreneurial creativity” as a prolific relationship of social networks, alertness to opportunities, prior knowledge, and opportunities that drive the associative or dissociative thinking in entrepreneurial creativity [23]. Positive relationship between entrepreneurship and economic growth was found also in [36]. Additionally, in same study is presented the proof that “level of entrepreneurship in a given country is not explained by … labor, capital, knowledge … and market friendly government policies” and entrepreneurship acts as independent factor. The paper is actually presenting empirical evidence for Schumpeter entrepreneurship-economic growth correlation. For Kafka and Petrakis, entrepreneurial creativity is a function of eight factors that concur to generate it. Namely “education and knowledge”, the manager capacity of “managing disrupting technologies”, spillover effect of creativity, “cultural background and personal characteristics” of the entrepreneur, “motivates and incentives, managing resources, (and) institutional background”.
Heunks constructed relational schemes based on the correlations among different variables, while innovation (as output) is positively correlated with cooperation among entrepreneurs and external capital availability [22]. It is also positively correlated with the level of education, self-confidence, future orientation, and leadership of the entrepreneur. Positive relationship states even with flexibility (and control in the case of small firms). With creativity, product innovation has positive correlation in the case of old firms, the “role of creativity for innovation and success increases during the firm’s life cycle”. Both creativity and innovation are raised by the risk-taking behavior of the entrepreneur. Creativity is positively influenced by the acceptance of challenge and entrepreneurship.
Sternberg and Lubart constructed a theory that empowers creativity with value, more specific, arguing the value of creative ideas that initially may look overwhelming or “ridiculous” to potential investors [24]. They stated that creative ideas should be considered investments, as they have a lower price when bought, associated with higher risk of incertitude and higher price after implementation and success [25,26]. Therefore, the theory includes six resources of creativity, namely intellectual abilities (specially the synectic ability to see things different, the analytical ability to recognize worthy ideas and practical ability to sell new ideas), knowledge, thinking styles (as in terms of intuitive or analytical), personality traits, motivation, and environmental factors [27].
One theory of creativity that targets its impact on economic growth is “the general theory of entrepreneurial creativity”, that presents entrepreneurial creativity (composed of five dimensions) as, intuitively, the main generator of the creative process, which is, in this turn, the main input, along with environmental supportiveness of the performance outcomes (measured as the “level of new combinations” and the “financial performance) [37]. Following Sternberg and Lubart [24,25,26], “the general theory of entrepreneurial creativity” claims five dimensions for entrepreneurial creativity: intelligence, personality, motivation, thinking styles and knowledge. The theory shapes the creative process in the five stages of a firms cycles of life (the five-level staircase of creative development, starting with intention, start-up, survival, low level growth, ending with high level growth) underlining that entrepreneurial creativity increases as the firm grows in development. The second input for the creative process is the environmental supportiveness (as they propose dynamism, heterogeneity and lack of hostility regarding new combinations). The theory is also sustained by a series of articles that enforce the strong positive relationship among creativity and growth [21,23,37,38,39,40,41,42], creativity and innovation [22,24,25,26,43] and innovation and growth [1,2,3,4,5,6,7,8,9,10,11,12,28,44]. The theory itself proposes the entrepreneurial creativity as the independent variable and innovation level and business development (claiming growth) as dependent variables.
Cronie et al. found that, a direct relationship is stated between higher levels of creativity and entrepreneurship inclination (in comparison with undergraduates or managers) [38]. In [39], Morris et al. found that focused creativity, explained as achievement imagery, is more related to high growth enterprises than to low growth ones. In contrast, task imagery or unrelated imagery is more related to low growth enterprises than to high growth ones. In [40], Khan conducted an empirical study to determine what is the relationship among financial performance and entrepreneurs’ characteristics and the most significant finding is that “instead of achievement motivation, the most significant correlate of venture success that emerges is the creativity and ingenuity of the entrepreneur”. In [41], Lim et al. found, a negative relationship between creativity and minimum production cost. In Gielnik et al. [42], it is concluded that “divergent thinking had a positive indirect effect on venture growth through the generation of original business”. In Baron et al. [43], a positive relationship is found of positive affect over the radicalness of innovation, when dynamism-moderated creativity is the mediator. Murat Ar and Baki proposed a conceptual scheme that was also empirically tested about the inputs of the product and process innovation. Significant dependencies were found among product innovation and R&D strategy, top management support, customer focus, creative capability and supplier relationship [44]. Additionally, process innovation had strong relationship with organizational learning capital and organizational collaboration [44].
Changing the point of view, a strong relationship was found between IQ, as a measurement of intelligence, and economic growth, in [45,46]. In [47], intelligence, also measured by IQ, has a positive effect over innovation. Nusbaum, found a more significant connection between the two cognitional dimensions and stated that “creativity and intelligence are more strongly connected that conventional thoughts relate” [48]. Jacobs sustained that the main source that generates innovation is the knowledge transfer between sectors [49]. Consisting, in [50] was conducted an empirical research on the effect that geographical knowledge spillovers have on the level of innovation and was found a positive relationship among them. In the same research, a positive relation was found between the level of innovation and local universities, and disinterested basic research. Lee, Florida and Gates found positive relationships among creativity, diversity and innovation [51]. Moreover, in [52], Knudsen et al. found strong correlations among geographical areas where the percentage of creative class workforce was high and innovative performance of that areas, showing that the percentage of creative class workforce had direct implications on the level of innovation.

2.3. Aghion Howitt Basic Model of Growth through Creative Destruction

A differentiable specification of Aghion Howitt model [7,8,9,10,11,53,54,55,56], from other endogenous models of growth through vertical innovation [3], is the presence of the obsolesce of the previous innovations through generating the newest innovation, thus fostering the “creative destruction” principle, that Schumpeter argues in his book [20], as the main driver for economic growth.

2.3.1. Basic Model

The main assumptions of the model imply that there is a three-sector economy: the final production sector, intermediate production and research sector, characterized as follows, by perfect competition, monopoly and, respectively, perfect competition with high competition state.
The treatable objects are “consumption goods, intermediate goods and labor” [7].
The society consists of a “continuum of infinite-lived individuals” with identical time preferences over consumption, equal to interest rate r > 0 (the marginal utility being constant).
Labor consists of all population and it is derived in three types: unskilled (M), skilled (N) and specialized (R). The unskilled labor and specialized labor are going to be used entirely in the final production, respectively, the research, therefore being neglected at some point in the model. The model focuses on skilled labor which could migrate through intermediate production to research.
The final production equation (y) consists of a productivity parameter (A) and the flow of the intermediate good (x, being the only input in the final production):
y = AF x ,   F > 0 ,   F < 0
The intermediate good production function is using only skilled labor (L):
x = L
Innovation arrives at a Poisson arrival rate of λ, the constant parameter, and a function of n and R:
λ ϕ n , R ,   λ ϕ technology   of   research ,   ϕ   is   contant   returns ,   concave   production   function
The model presents a memoryless research and assume that skilled labor is essential, so that:
ϕ 0 , R = 0
Time is continuous and indexed by τ ≥ 0. The interval of tth innovation is denoted t = 0,1 …. The length of the interval will thus be:
λ ϕ n t , R ,
Innovations are vertical and reflected in a new intermediate good which increase productivity parameter, A. So, the innovations are supposed to be radical to obsolete last innovation and generate monopoly of the innovator. The innovation effect is seen in the At-At−1 difference, meaning that there is a factor of grow in technological parameter (conventionally equivalent to productivity growth), expressed as ɣ, so that:
At = A0 ɣt
The intermediate monopolist objective is to maximize the “expected present value of profits” over the current interval:
(1)
The inverse demand curve is pt = At F′(xt);
(2)
The monopolist chooses xt to max [At F′(xt) − wt] xt, knowing At and wt;
(3)
In the model, the “productivity-adjusted wage” is ωt ≡ wt/At, the “marginal-revenue function” is ῶ(x) ≡ F′(x) + x F″(x) and it is made the assumption that ῶ’(x) < 0 for all x > 0 (downward sloping) and respects the third and fourth of the Inada-type conditions.
(4)
The flow of monopoly profits is then: πt = At π ˇ t), where π ˇ (ω) ≡ −( x ̃ (ω))2 F″( x ̃ (ω)) and the quantity of output is xt = x ̃ (ω), where x ̃ (ω) = ῶ(x)−1.
The innovation is characterized by an arrival rate of λϕ(z,s), being independent for the inputs of another firms. Z reflects the amount of skilled labor invested in research. So,
N = L + z.
The research firm’s objective is to choose z and s at each date so to maximize the flow of expected profits from research:   λ ϕ z , s V t + 1 w t z w t s s , where wts is the wage rate of the specialized labor and Vt+1 is the value of the t + 1st innovation.
From the Kuhn–Tucker conditions it follows that w t   φ n t λ V t + 1 13 , nt ≥ 0, with at least one equality. So, the present cost of research must be bigger that the value of the next innovation.
The value of the t + 1 innovation is generated by the future profit, rationalized by the exponentially distributed length of the innovation interval:
V t + 1 = π t + 1 r + λ φ n t + 1
The most important intertemporal spillover effect is the fact that innovation raises productivity forever. The innovation is built upon the last innovation, so the next monopolist gains all the previous innovations.

2.3.2. Equilibrium with Endogenous Size of Innovation

The Aghion Howitt extension of the model, which allows research firms to choose the frequency and size of innovation.
The arrival rate of endogenous size innovations is:
(A) λ ϕ z , s υ γ , υ γ   <   0 , “the bigger the innovation, the harder to discover” and υ γ   <   0 , marginal cost increases with size.
The value of the t + 1th innovation becomes then:
V t + 1 = A t + 1 π ˇ ω ` r + λ φ n ` υ γ ` ,  
where γ` is the stationary equilibrium value of γ.
The expected flow of profits of the research firm in interval t is:
λ ϕ z , s υ γ γ V t w t z w t s s ,
taking Vt as given.
Thus, the profit maximization choice also maximizes γυ(γ). Because the product of γυ(γ) is concave, therefore, γ` is defined by the condition:
υ γ ` + γ `   υ   γ ` = 0
The first order condition, along with (7), produces the stationary-equilibrium equation:
N n ` λ φ n ` = υ γ ` γ ` π ˇ N n ` r + λ φ n ` υ γ `
Comparative stats: The number of skilled people employed in research, in stationary equilibrium, increases with a decrease in the rate of interest r, an increase in the total endowment N of skilled labor and an increase in the arrival parameter λ and an increase in γ.
Welfare analysis:
(1)
The expected present value of consumption:
U = A 0 F N n r λ φ n υ γ γ 1
where r λ φ n υ γ γ 1 is a social discount rate
(2)
Thus, independently of n, the social planner will choose γ to max υ γ γ 1
(3)
The socially-optimal value γ* is then defined by:
υ γ * + γ *   υ   γ *   υ   γ * = 0
(4)
By the concavity of the γυ(γ), the stationary-equilibrium value γ` < γ* (socially optimal value). Innovation is smaller under laisses-faire. The difference comes from the internalization of the loss of the existing advantage of the present innovation (γ − 1), whereas the private research sector does not internalize it.
(5)
The socially optimal level of research employment, n*, satisfies the condition:
F N n * λ φ n * = υ γ * γ * 1 F N n * r λ ϕ n * υ γ * γ * 1  
(6)
By comparing (17) with (12) it is seen, in the first place, that the social discount rate, r λ ϕ n * υ γ * γ * 1   appears in (12) in the right-hand side (the marginal benefit), in place of the “private discount rate” r + λ φ n ` υ γ ` . The private rate is obviously greater due to the intertemporal spillover effect, that is, the social planner takes into account that the benefit will continue forever. In the right-hand side of the equation, profit π ˇ N n ` , from (9), is replaced by the total output F N n * in (12), due to the appropriability effect [57]. Due to the “business-stealing” effect, (ɣ − 1) replace ɣ in (12), the social planner internalizing the previous monopolist’s loss. Additionally, in the marginal cost (the left-part of the equation), the wage N n ` from (9) is replaced by the marginal output F N n * , that is a “monopoly distortion” effect, as Aghion and Howitt called it. The cost of research in laisses faire is less than the cost of research in the socially optimal case, “because, in laissez-faire, the alternative use of skilled research labor is a monopolist”. Additionally, the fact that ɣ` < ɣ*, makes n` < n* (with respect to λ).
The rate of growth of the entire economy, constructed in the Aghion Howitt model as λ φ(n`) υ(ɣ`) lnɣ`, is affected by the smaller size of the innovation form the laisses faire economy, the direct effect of the size being to decrease the average rate of economic growth, although the arrival rate has an exact opposite effect.
In addition, when innovations are not drastic, the business stealing effect determine too small innovations in laisses faire economy, but it is mitigated by the researchers which tend to increase the size to increase future profits. The marginal profit is independent of the size of innovation in the drastic case, counting on the arrival rate of innovation, but in the non-drastic case of innovation, both the size and arrival rate count in the marginal profit of the researchers.

3. Materials and Methods

For the theoretical framework, it has been used the Aghion-Howitt model, that is based on the creative destruction, as the main promotor for the economic growth, and endogenizes the size of innovation. A scanning of the literature around the subject “innovation” was performed (especially looking for the innovation conditionalities), and then the most fitted dependable parameters for the present research were selected in order to construct the added equations, modelled as log linear approximations.
After the construction of the theoretical model, a secondary analyzation of available data was performed, its methodology being presented below.
The sampling method used is a multi-stage sampling to illustrate the best the macro relationship of creativity, innovation and the level of knowledge. The first method used was purpose sampling, in which the European region was chosen because of the heterogeneity of its state’s innovations. The second method applied in the present research was the convenience method, in which the European Union countries were selected, 28 panel data, for which representative data from 2011 to 2018 was obtained. Thus, this generated a panel data of more than 230 registrations, available in supplementary materials.
The external validity of the sampling multi-stage technique, that was suitable for global generalization, is relying on the heterogeneity of the levels of creativity and innovation, found in the European countries.
To succeed a good construct validity, we have chosen to aggregate the indices from measurements that represent at best the parameter involved, standing on previous studies and theoretical causalities. In this framework, are presented the variables involved in the construction of the parameters.
Firstly, creativity was constructed upon patent applicators [58], trademark applicators, design applicators (as part of the intellectual property rights system that sustains creativity), and royalties per capita [59].
Considering that creativity is the process of idea generation [60,61,62,63,64,65], patent, trademarks, and design applicators are considered to be the usual results of creative ideas, before they are transformed into innovations, by implementation. Implementation is measured by the managerial competence, which, in the present regression is the intercept. The number of applicators of patent, trademark and design was selected because it is sustained by the inner structure of the creativity itself and the difference between creativity, inventiveness and innovation. In this perspective it is presented the diagram that best represents the inner causalities of the three concepts, using managerial competence as a mediator. Creativity is the generator of the invention, thus creative ideas are not always feasible, that is why it is appropriate to choose the applicators for the innovation registers, not the ones who already succeed in registering their creative ideas into innovations.
In Figure 1, presented above, invention is a result of motivation, creativity and expertise, measured as knowledge [66,67,68]. As regression will be performed, based on the previous model, the basics assumptions will be maintained, of which in the research field, the competition is perfect [10], thus assuming equivalent motivations for all agents involved. Invention is not included in the present model, thus being a particular concept that traits a big number of theoretical approaches regarding it [68,69]. Invention is than transformed into innovation by using managerial competence (the capability to properly administrate available resources). The inner difference between invention and innovation stands in the implementation or commercial property of the creative idea. In this regard, the invention is not rounded and prepared for implementation, thus being an unrefined result, in opposition to innovation, that has economic potential, either through commercialization or implementation. Thus, the middle phase of invention is going to be neglected.
Creativity and knowledge generate invention, which, with respect to managerial competence, generates innovation. Thus, knowledge is measured in the share of population that completed tertiary education and the number of new doctorates (indicators used as inputs in innovation measurement in [47,70]), share of enterprises providing ICT training (information and communication technologies, used also as an innovation variable in [71]), medium and high-tech product exports and households with ICT. The main reason of constructing knowledge with these inputs is to outline knowledge and leading-edge technology appropriateness such as access to information (ICT, tertiary education, doctorates) and technology (medium, high tech products exports).
Innovation is going to be represented here as the dependent variable. Innovation data is constructed using scientific publication among 10% most cited (as proposed in [54]), SMEs with product/process innovations, SMEs with market/organizational innovation, SMEs innovating inn-house and sales of new to market/new to firm product innovations (as Schumpeter constructed innovation, relying on four categories: product, organizational, market and process innovation [20]).
Data was obtained by using secondary analysis of the variables mentioned before, as constructors of the three parameters. The causalities of the three variables are sustained by the theoretical approach, that was presented in the previous section.
To sustain the model, a multiple linear regression was performed, in which the dependent variable was innovativeness and the independent variables were creativity and knowledge. The level of significance considered was of 95%, thus considering the usual α value of 0.05. The regression was pursued in SPSS, using simple least squares method. Data distribution was normalized using log normalization method. The missing data was estimated using interpolation. All data was public, and no personal consent was needed.
The construction of the data, by using the variables mentioned above (in Figure 1), implied a composite construction with equal weights.
Thus, the internal validity of the model is validated by the causality properties of the relationship among the parameters involved, that is also relied on the theoretical background.
The experimental design is the quasi-experimental design of two groups of countries: the countries that present drastic innovations and non-drastic innovation countries. The regression was measured using ANOVA method.
The main hypothesis is:
Hypothesis 0 (H0).
Creativity level has a significant effect over innovation.
To validate the hypothesis, the p-value from the ANOVA regression was used, along with analyzing the goodness of fit, by using the R squared adjusted value. The fact that the R squared adjusted is a bit smaller when taking social experiments was also a pivot factor.

4. Results

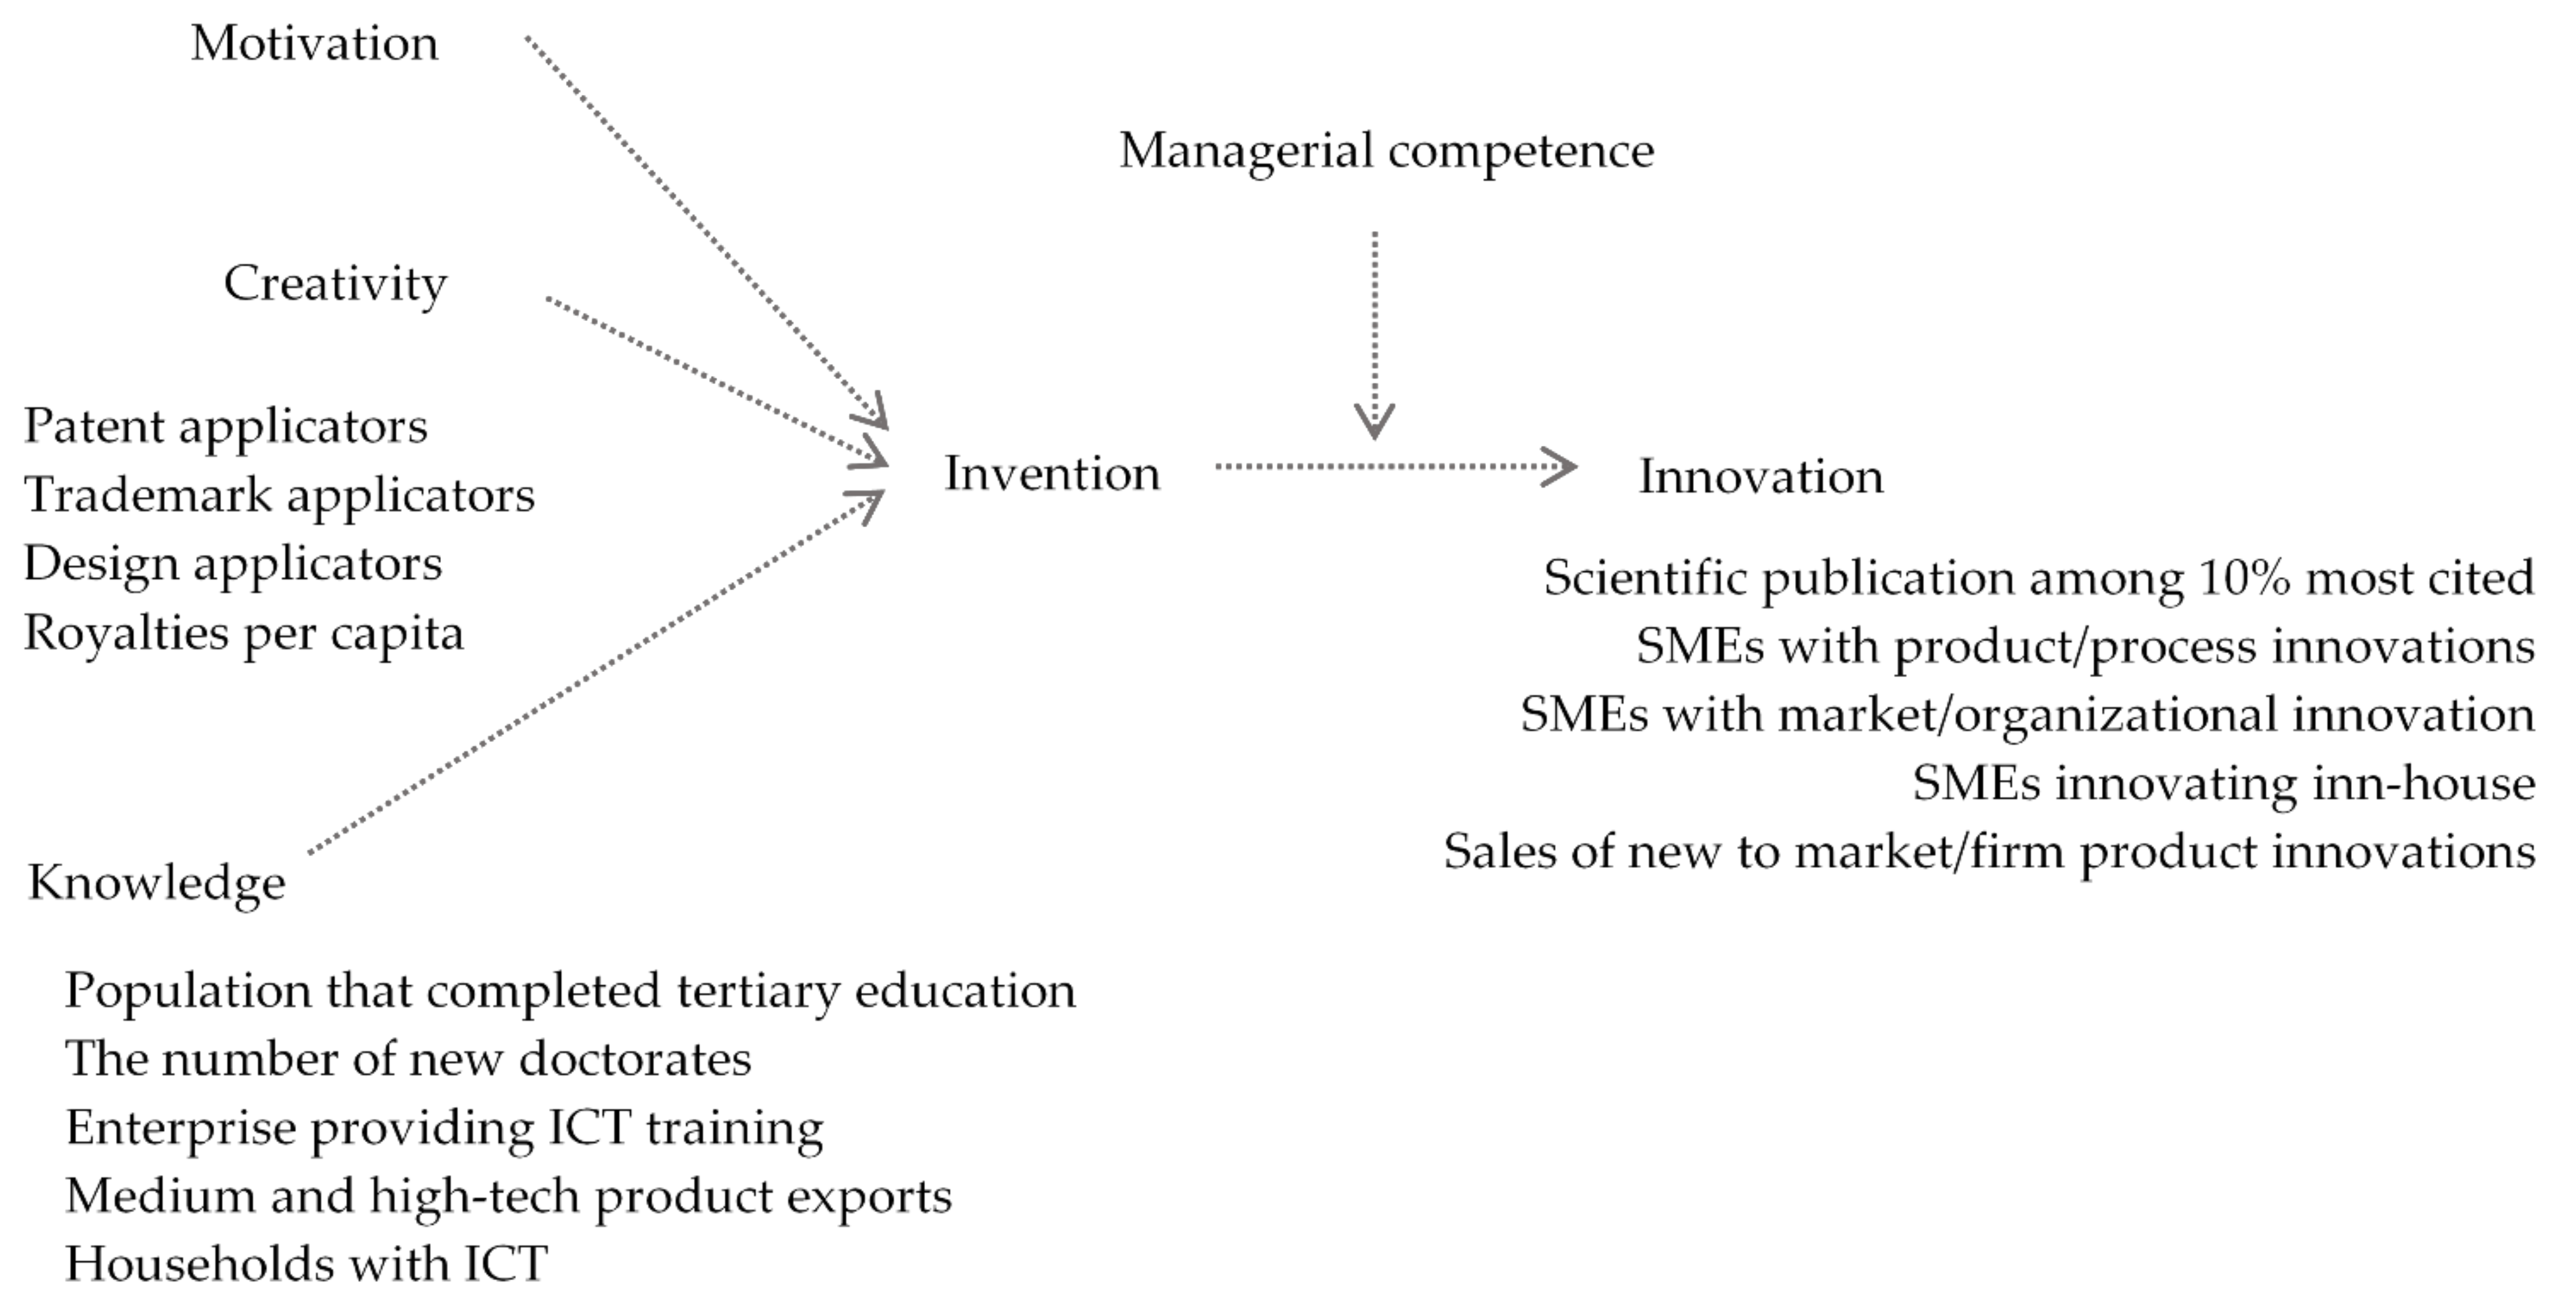
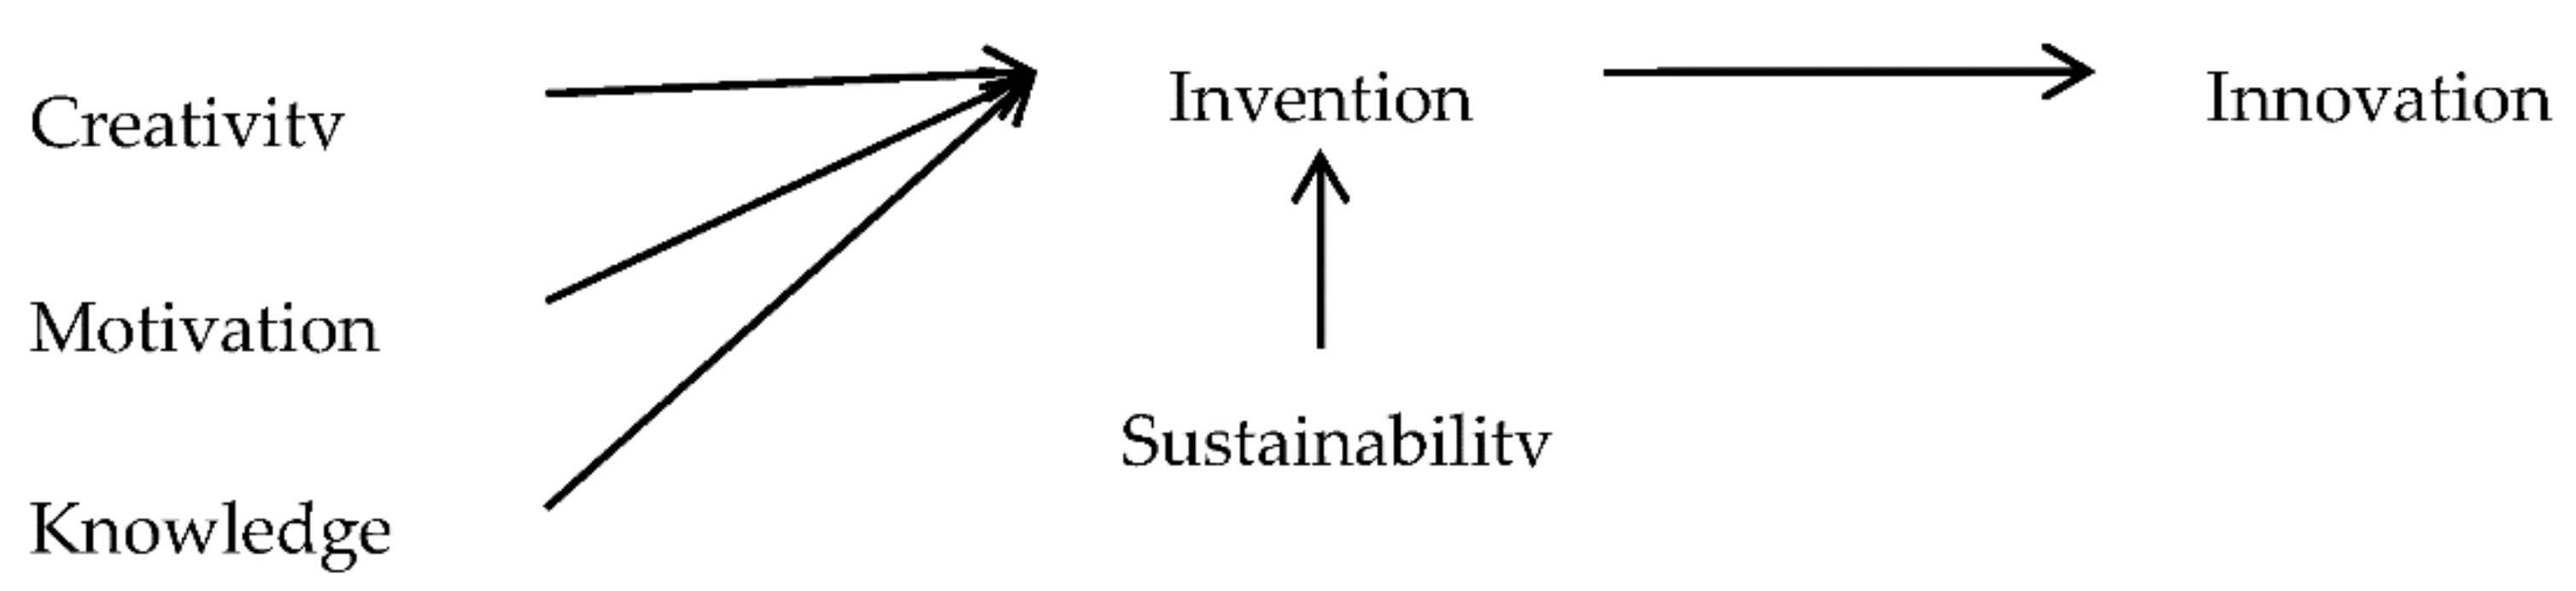
4.1. Extension of the Model by Including Creativity as Part of the Innovation Size Determinants

In his book, Schumpeter is making a clear distinction between invention and innovation (so does Rosenberg in [72]), implementing invention as a condition for pursuing innovation. After the innovation was achieved, the commercializing phase arrives. The difference between innovation and creativity is highlighted in [65,73], where innovation is constructed upon two stages, the driving force of the “economic creativity” and its implementation as innovation. Economic creativity is defined as the creativity that produces results capable of having “potential economic value” and also has two stages, namely the research phase and the idea generation phase [64,74]. Amabile, as a pioneer in individual and organizational creativity, marked creativity as a precursor phase of innovation [75].
Secondly, Schumpeter states that motivation is the main force that is driving the entrepreneur to pursue innovation and growth, manifested by the internal success of creating a body of work [20]. Additionally, another source of entrepreneurial motivation is manifested by the competition itself (self or with others) or the state of flow in act of creation [76]. Additionally, Squalli, in [47], stated that innovation is defined as a novelty, new combination of ideas.
As many inputs of innovation were defined in the second part, a brief summarization is appropriate.
Inputs of quality of innovation are, as follows (based on the literature theories and empirical research):
(1)
Creativity, theocratized in [21,24,77], and empirically sustained in [22,51,70] as positively correlated with innovation, or creative class workforce as positively correlated with innovation [52];
(2)
Leadership, theocratized in [21];
(3)
Motivation of the entrepreneur, theocratized by Schumpeter in [20], and McClelland in [78], positively correlated in [79,80], and as passion theocratized in [21];
(4)
Analytical intelligence (measured by IQ), which has a positive relationship with innovation [47], and economic growth [45,46];
(5)
Education, which has also a positive correlation with innovation according to [22,81], when countries are closer to the technological frontier;
(6)
Personality traits such as risk-taking, self-confidence, future orientation and leadership, according to [22,37];
(7)
Cooperation among entrepreneurs [37];
(8)
Accessibility to external capital [37];
(9)
Flexibility and control (in the case of small firms) [37];
(10)
Culture, also presenting a positive relationship with innovation [65];
(11)
Styles of thinking, including innovation orientation, focus on the problem [82]; contrary thinking, intuition [83]; ideation, analogical thinking, as in [37]; scenario building, the planning fallacy, and self-justification of decisions [84];
(12)
Knowledge cumulated by the researcher [37], knowledge transfer across sectors [49], and knowledge spillovers [50];
(13)
Investments and technological opportunities, that have a positive correlation with innovation [85,86,87], and also do the public expenditure in research [70].
In Aghion-Howitt model, the size of innovation is constructed as an undefined function, not dependent on the number of researchers (be them skilled or specialized), that is a parameter influencing the arrival rate of the innovation. Thus, in the innovation function, the labor invested in research would not be taken into consideration and the size of innovation will mainly refer to the quality of the innovation in comparison to the actual level of the cutting edge-technology.
As innovation, identified as a cognitive process, consist of two or more phases [65,88,89,90] always starting withthe creative process [20,37], it is implied that the relationship among them consists of a positive causality [22,51,70]. In the model, creativity has an organizational level [43,52,66,75] and it is specifically referring to the average economic creativity of the skilled labor (from Aghion Howitt model [7,10,11]). Additionally, not the artistic type of creativity was taken in consideration, rather to the ordering process, originality, problem stating and problem-solving type of creativity [91]. The creativity process consists of many phases, as results from [60,61,62,63], although there is made a discrepancy between economic creativity and universal creativity, as the economic creativity consists of a two phases process: research and idea generation [64,65]. It is also a result of many converging psychometric or external conditions (personality traits, motivation, environmental support, and knowledge [37]; competition, that is having an ambiguous dependency [75,92,93]; or intelligence [48]), thus the “creativity” parameter is going to be constructed as an undefined function, due to its complex structure and ambiguous dependencies.
The leadership parameter [21], defined in the present model as a managerial competence of the entrepreneur who seeks to innovate and invest the skilled labor in research, is going to be a constant, for the simplicity of the model, thus constraining firms to have the same managerial competence. Passion [20,21,78,79,80], will be structured in the present model as sustaining creativity by causality, thus being considered an implicit parameter of the creativity function, but not defined in the present model. Analytical intelligence, measured by IQ [45,46,47], is considered to be homogenous and a function of education and knowledge, although, in the present model it will be neglected and not used as a parameter, due to poor empirical evidence of the causality conditions of intelligence and innovation. Although education has a positive correlation with innovation [22], especially when countries are closer to the technological frontier [81], it also has a very complex structure, being strongly connected to the political, legislative, institutional and level of development (as itself a function of innovation), generating a recursive causality with innovation, thus also being neglected in the present model. Personality traits [22,37], cooperation among entrepreneurs [37], accessibility to external capital [37], flexibility and control (in the case of small firms [37]) and styles of thinking are also parameters of the managerial competence of the entrepreneurs, and the researchers and they will be integrated in the leadership parameter. The influence of culture and other external dependencies is going to be neglected.
The knowledge accumulated by researchers is equal to cutting-edge technology, consisting of the last innovation [37]. By the intertemporal spillover effect, innovation raises forever, thus next innovation cannot be less than the present one and the previous innovation is, therefore, to be considered general knowledge, due to the free access of all others entrepreneurs to the previous innovation. Hence knowledge is equal to the previous innovation.
We will define knowledge as the knowledge level:
ε t γ t 1 ,  
where εt defines the level of knowledge of all skilled people implied in research, in time t.
The knowledge transfer across sectors [49] and knowledge spillover [50] will not be taken into consideration, because the present extension is made on the basic Aghion Howitt model, not including the multidimensional space. Regardless the fact that investments and technological opportunities have a positive correlation with innovation [85,86,87] and also do the public expenditure in research [70], they will not be included in the present extension of the model but could be taken in consideration for future research regarding the Aghion-Howitt model of innovation by capital accumulation [8].
Thus, from the arrival rate of endogenous size innovations (14),
λ ϕ z , s υ γ ,   υ γ   <   0 ,
“the bigger the innovation, the harder to discover” and υ γ   < 0, marginal cost increases with size, the innovation size function is going to be extended to:
υ γ = M · θ ć ή · ε t ό ,
where:
(14)
θ ć is a creativity function, dependent on many conditional factors, that are not the subject of the present paper;
(15)
M is the managerial competence level, which is a known constant, given by history and the countries political, educational and traditional specification;
(16)
ε t   is the knowledge level (the level of specialized knowledge), which is equal to the last innovation, from (13);
(17)
ή and ό are creativity and knowledge elasticities.
Size of innovation in equilibrium:
If we replace the innovation function in 9 with (15) we get:
N n ` λ φ n ` = Μ · θ ć ή · ε t ό γ ` π ˇ N n ` r + λ φ n ` Μ · θ ć ή · ε t ό
Which is equal to:
N n ` λ φ n ` = Μ · θ ć ή · γ t 1 ό γ ` π ˇ N n ` r + λ φ n ` Μ · θ ć ή · γ t 1 ό
Which establishes a recursive function of the size of innovation, based on the cutting-edge innovation and implies that, because of the positive conditionality of growth on the size of innovation, growth is sustained by the size of the creativity, as implemented in the innovation function.
Because the business stealing effect, that determines too small innovations in laisses faire economy, when innovations are not drastic, is mitigated by the researchers which tend to increase the size to increase future profits, it is necessary to establish a high level of creativity which leads to an increase in profits, due to the direct dependency of the size of innovation on the level of creativity.
Because the marginal profit is independent of the size of innovation in the drastic case, but counting on the arrival rate of innovation, the profit growth is independent of the level of creativity. After reaching the point of the drastic case of innovation, any growth of the size of innovation due to creativity is irrelevant to the overall profit and might be considered a waste of resources.
In Figure 2, sustainable development comes not from the innovation phase, but rather from an intermediate phase of invention. To gain sustainability in the innovation process, the destructive part of creativity should be eliminated in the inventing phase. The inventing process should not only allow, but also support future innovations upon present inventions.
We need to ask ourselves if the size of innovation is different in different domains, if creative people imply different types of creativity in different sectors and if research has heterogenous or homogenous creativity among its invested labor. Sternberg, in [94], stated that creativity is not defined as domain specific and neither as general. In Mihaly [95], it is stated that creativity is actually domain specific due to specific time and effort needed in different sectors. In Gardner [96], creativity is of many types and it is specific for different classes of domains, which is consequent with [91], where creativity takes the form of 10 types. As mentioned above, in this paper the focus is on the ordering process, originality, problem stating and problem-solving type of creativity [91], which are consistent with the thinking styles associated with innovation (innovation orientation, focus on problem, contrary thinking, intuition, ideation, analogical thinking, scenario building, the planning fallacy and self-justification of decisions [37,82,83,84]). In the research sector, a homogenous type of creativity should be considered, due to the systematization of the research process through R&D activity.

4.2. Multiple Linear Regression

The next table presents the multiple regression outcomes, ran in SPSS, by using simple least squares. The constant shows a level of 0.072. Thus, we can argue that innovation stands on the combination of creativity and knowledge. The results of the regression, presented in Table 1, show that a dependency of 63.3% of innovation is explained by the level of knowledge of the individuals in a country, mainly construing the principle according to knowledge and work are the most important pillars in order to succeed in the innovative process. Only 29% of innovation is sustained on creativity, based on data of European countries, arguing that innovation is nurtured mainly on the level of knowledge and less on creativity.
The next plot of the variables, Figure 3, shows the same dependency of 0.633 and 0.29 of innovation on knowledge and creativity is shown below. The plot was obtained using MATLAB and 233 available indexes values. The figure shows a scatter plot, and it can be clearly seen that the countries with a higher knowledge level tend to innovate more, regardless of the creativity level. Thus, the creativity is sustained even by the visual representation to be around 0.29 significant for innovation. As Figure 3 shows, the most innovative countries do have even small creativity levels and the less innovative countries do have big creativity levels too. There are no creatively countries which were not mediumly or highly innovative. Therefore, a little creativity can drive big innovation, but big creativity will, for sure, foster big innovation. The knowledge level, in contrast, is very important to the level of innovation. It can surely be understood that a bigger amount of information will generate a larger base for the creative ideas (taking into consideration that creativity is usually understood as making new arrangements of the information already hold [97]). So, the countries with smaller levels of knowledge do have smaller levels of innovation. Furthermore, the countries with higher levels of knowledge do present medium or high innovation levels.

4.3. Mapping Innovation, Knowledge and Creativity

In Figure 4, a spider web regarding national creativity, innovation, and knowledge level is shown. As mentioned above, the web illustrates that a big proportion of countries with low creative indicators have high innovation levels. Take, for example, Sweden, UK, Croatia, Czech Republic, Belgium, France, Slovenia or Slovakia, that have relatively medium or small creative indexes and high level of national innovation. In contrast, Malta has a high level of creativity, but a medium level of innovation. Additionally, the countries with the highest creativity have the highest level of innovation. Take, for this example, Spain, Austria, Cyprus, Denmark, Germany or Luxembourg.
Summarizing, countries with lower creativity can have either a high or a low level of innovation, but countries with higher creativity level will have, for sure, high innovative level (the only exception in the present study was Malta, which is considered an extremum of the available data). Now let us look at the knowledge-innovation connection. As Figure 4 shows, the pattern of the innovation and knowledge level is almost overlapping. There were also exceptions. Take, for example Portugal. For Portugal, the level of knowledge and creativity are medium, although, the level of innovation is at its highest level. Other exceptions are Sweden, Slovenia, and Slovakia, all of them share high levels of knowledge, but medium levels of innovation. Summarizing the knowledge effect over innovation, it can be seen that if knowledge is low, there is a big chance that innovation will also be low (a 0.69 change, as the regression results show). In contrast, a big level of knowledge will generate a big level of innovation.
Figure 5 shows the absolute changes of the three indicators for each country, from 2011 to 2018. It is observed that the changes in innovation follow the pattern of creativity rather than that of knowledge, with a few exceptions. For example, Polonia presented a decrease in innovation based not on the decrease in creativity, but on the decrease in the level of knowledge obtained within the index calculated for this state. In Romania, although creativity has undergone a slight positive change, innovation has fallen sharply, being founded neither by the increase of creativity, nor by the stagnation of the level of knowledge.

4.4. Correlation

In Table 2, the correlation matrix is shown, outstanding that patent applicators are highly correlated with new graduated doctorates. Additionally, enterprise providing ICT training is correlated with all of the SMEs innovating dimensions, thus consolidating the importance of ICT training in the innovational process. Even the access to ICT of the households is essential for scientific publications among 10% most cited, and patent applications. Additionally, a very interesting negative dependency between trademarks applicators and new doctorate graduates is shown. The same negative dependency is found between trademark and design applicators, or sales of new-to-market and new-to-firm product innovations.
To consolidate the relationship among variables, a partial correlation matrix was performed, using GDP (gross domestic product) as a control variable, shown in Table 3. The partial correlation consolidates and sustains the regression and the relationship that was constructed in the present research, generating a correlation value of 0.676 between knowledge and innovation, with control for GDP values. A 0.588 correlation between creativity and innovation was also found, with control for GDP values. The findings support the regression results. A 0.611 correlation between creativity and knowledge was obtained, with control for GDP variables, which may be problematic if it is considered the multicollinearity between variables. Still, the value is not to be considered a problem, because of the proper p- and F-values that were obtained in the regression.

4.5. Goodness of Fit and Hypothesis Testing

We now retake the regression presented above and present it in Figure 6.
The R squared adjusted, obtained for the multivariable linear regression, using the simple least squares (OLS) is about 0.465, a medium level of fitness, as shown in Table 4. If we take in consideration that the model consists of some social parameters and it is mainly a social experiment, the R squared adjusted value should be considered a significant one.
The regression outcomes sustain the hypothesis. In order to statistically approve the hypothesis, a null hypothesis was constructed, as follows:
Hypothesis 1 (H1).
Creativity level does not have a significant effect over innovation.
For testing the null hypothesis, the p-value was used, extracting it from the regression ran above, and found out that the p-value was around 0.000, having an F-stat of 97.763. This rejects the null hypothesis and adopts the alternative hypothesis, which is exactly the main conclusion Hypothesis 0 (H0).

4.6. Innovation Trends in Europe

In Figure 7 it is presented the trend of innovation if creativity and knowledge would be at their maximum values. It actually shows the potential of innovation for each country, if the knowledge and creativity values are going to be enhanced to their historical maximum values. Therefore, it can be seen that Luxembourg has the maximum potential of gaining innovation, of course reported on capita, followed by Denmark, Sweden and Finland. Luxembourg occupied of course, the highest order in hierarchy, when it comes to creativity, in all the reference periods, while Malta, Sweden, Germany, Finland and Denmark followed in the top ten. Regarding knowledge, United Kingdom had the highest value in the index, followed by Denmark, Ireland, Sweden and Finland, while Luxembourg still remained in the top 10. It is seen therefore, that creativity is a valuable resource to foster and maintain at a higher level, when it comes to innovation. As it was already mentioned, sustainability is a dimension that should be achieved in the inventing phase of the innovation process, so, in terms of sustainable innovation, the level of knowledge that leads the inventing process is also of great importance.

5. Discussion

As it was shown in the fifth section, the Schumpeterian endogenous model of economic growth through creative destruction, developed by Aghion-Howitt, can be extended by endogenizing the size of the innovation. The model uses as parameters to measure innovation: the arrival rate of innovation (constructed as Poisson rate, including a constant value and a function of the number of specialized researchers and qualified workers who were chosen to do research instead of manufacture) and the size of innovation, which was exogenous. In this perspective it is appropriate to endogenize the size of innovation.
Because the arrival rate uses the number of persons involved in the research activity, it was considered that the arrival rate to be the quantitative measurement of the innovation, so the size to refer to the qualitative part of the innovation. That is why creativity and knowledge represent the variables that determine the quality of research.
The results show that the level of knowledge is the most important in determining national innovation. Similar studies promoted accumulated knowledge (which in this study is similar to knowledge) to be one of the main promotors of innovation [37,49,50]. This studies also include knowledge spillover and knowledge transfer.
Additionally, the theoretical approach sustains other creativity theories, like in [21,24,77], in the process of generating innovation, even if innovation is usually misinterpreted with invention. The difference between invention and innovation was highlighted in Section 4. Other empirical approaches regarding creativity support our findings [22,51,70].
If the educational perspective is considered, the fact that the number of new doctorate graduates is strongly correlated with patent applicators (measurement of creativity), support the findings from [22,81]. The insignificant and negative dependencies with trademarks and design applicators and with the number of royalties per capita suggest opposite conclusion.
The regression results do sustain the theoretical framework acquired to endogenize the Aghion-Howitt model:
υ γ = Μ · θ ć ή · ε t ό ,
where:
  • θ ć is a creativity function,
  • M is the managerial competence level,
  • ε t   is the knowledge level,
  • ή and ό are creativity and knowledge elasticity.
The only difference is the fact that it was not include the managerial competence as a parameter in the regression, basically on the fact that the assumptions of the basic model permit us to construct the managerial competence as being equivalent to all involved agents, thus being neglected.

6. Conclusions

As others have shown, creativity can foster innovation, being, the main driver of innovation, conceptually and time dependent, being Additionally, the first event that occurs to gain innovation. As many evolutionary and endogenous models follow the innovation link to explain technological progress, a conceptual framework for an extension of such models, in order to include creativity, is presented in the present paper. Empirical data has consolidated the model and outlines the importance of the both the creativity and the level of knowledge to innovation. Limitations of the present model may include the neglection of capital, but this can also provide directions for future research, especially because creativity has an ambiguous relationship with capital (due to its heterogenic manifestation, that can foster success or unsuccess, being strongly dependent of the managerial capacity when capital is involved). The present study consolidates the previous works of Kafka and Petrakis, where creativity is the generator of microeconomic growth, strongly related with innovation and entrepreneurship, that also involve entrepreneurial leadership.
The contribution of the present study to the theoretical field of innovation and creativity consists of the direct dependency among innovation and the two variables, presented both conceptually and analytically, acquired to represent at its best the innovation process in a simple model. The main dependencies of the process are creativity (as research and idea generation), knowledge (as the level of knowledge or the size of the previous innovation) and managerial competence as the binder of the two with resources (in invention phase). The model can enhance economic growth by fostering creativity and thus, the size of innovation, which is the main growth driver for economy.
Future studies may focus on introducing the creativity parameter in the evolutionary perspective (considering the replicator equations, thus extending the evolutionary growth theory using creativity as a function that can foster relative importance of entrepreneurs in an economy, considering that creativity has been proved as an important factor in entrepreneurial success) or constructing a cellular automata innovation model (because creativity is a parameter of innovation, the cellular automata model could be based on the same parameters, starting from a simple equation, of internal, neighbor and public state, concerning growth, creativity, and the level of knowledge). Another research direction might be focusing on introducing creativity in a capital growth model, with creativity being a parameter fostering entrepreneurial success or economic growth; it is interesting to question creativity as a parameter fostering capital accumulation, if used in combination with knowledge and managerial competence.
Limitations of the present research involve the relatively small analytical development of the theoretical framework, or the neglection of the managerial competence in the multivariable regression. Another limitation might be the neglection of the invention phase in the present model or the neglection of capital. These limitations may also be taken in consideration for future studies, based on the technical contradiction principle.

Supplementary Materials

The following are available online at https://www.mdpi.com/article/10.3390/su13073848/s1, Table S1: Knowledge data, Table S2: Knowledge data, Table S3: Knowledge data, Table S4: Innovation data, Table S5: Innovation data, Table S6: Innovation data, Table S7: Creativity data, Table S8: Creativity data.

Author Contributions

Conceptualization, M.P.C. and R.A.N.; methodology, M.P.C. and R.A.N.; software, M.P.C. and R.A.N.; validation, M.P.C. and R.A.N.; formal analysis, M.P.C. and R.A.N.; investigation, M.P.C. and R.A.N.; resources, M.P.C. and R.A.N.; data curation, M.P.C. and R.A.N.; writing—original draft preparation, M.P.C. and R.A.N.; writing—review and editing, M.P.C. and R.A.N.; visualization, M.P.C. and R.A.N.; supervision, M.P.C. and R.A.N.; project administration, M.P.C. and R.A.N.; funding acquisition, M.P.C. and R.A.N. All authors have read and agreed to the published version of the manuscript.

Funding

Project financed by Lucian Blaga University of Sibiu & Hasso Plattner Foundation research grants LBUS-IRG-2020-06.

Institutional Review Board Statement

Not applicable.

Informed Consent Statement

Not applicable.

Data Availability Statement

Conflicts of Interest

The authors declare no conflict of interest.

References

  1. Swan, T. Economic Growth and Capital Accumulation. Econ. Rec. 1957, 33, 103–108. [Google Scholar] [CrossRef]
  2. Solow, R.M. A Contribution to the Theory of Economic Growth. Q. J. Econ. 1956, 70, 65–94. [Google Scholar] [CrossRef]
  3. Romer, P.M. Endogenous Technological Change. J. Polit. Econ. 1990, 98, S71–S102. [Google Scholar] [CrossRef] [Green Version]
  4. Lucas, R.E. On the Mechanics of Economic Development. J. Monet. Econ. 1988, 22, 3–42. [Google Scholar] [CrossRef]
  5. Guarini, G. Innovation and Growth in the Grossman-Helpman’s 1991 Model with Increasing Returns. Econ. Bull. 2011, 31, 147–155. [Google Scholar]
  6. Arrow, K.J. The Economic Implications of Learning by Doing. Rev. Econ. Stud. 1962, 29, 155. [Google Scholar] [CrossRef]
  7. Aghion, P.; Howitt, P. A Model of Growth Through Creative Destruction. Econometrica 1992, 60, 323. [Google Scholar] [CrossRef]
  8. Howitt, P.; Aghion, P. Capital Accumulation and Innovation as Capital Accumulation in Long-Run Growth. J. Econ. Growth 1998, 3, 111–130. [Google Scholar] [CrossRef]
  9. Aghion, P.; García-Peñalosa, C.; Howitt, P. Knowledge and Development: A Schumpeterian Approach. Econ. Growth Macroecon. Dyn. Recent Dev. Econ. Theory 2004, 9780521835, 46–80. [Google Scholar] [CrossRef]
  10. Aghion, P.; Akcigit, U. Innovation and Growth: The Schumpeterian Perspective. Econ. Bord. 2017, 29–72. [Google Scholar] [CrossRef] [Green Version]
  11. Zilibotti, F.; Aghion, P.; Howitt, P.; Garcia-Penalosa, C. Endogenous Growth Theory. Can. J. Econ. Rev. Canad. d’Econ. 1999, 1338. [Google Scholar] [CrossRef]
  12. Reinganum, J.F. Innovation and Industry Evolution. Q. J. Econ. 2014, 100, 81–99. [Google Scholar] [CrossRef] [Green Version]
  13. Nelson, R.R.; Winter, S.G. An Evolutionary Theory of Economic Change; Belknap Press: Harvard, MA, USA, 1982. [Google Scholar] [CrossRef]
  14. Dosi, G.; Nelson, R.R. An Introduction to Evolutionary Theories in Economics. J. Evol. Econ. 1994, 4, 153–172. [Google Scholar] [CrossRef]
  15. Sahal, D. Alternative Conceptions of Technology. Res. Policy 1981, 10, 2–24. [Google Scholar] [CrossRef]
  16. Conlisk, J. An Aggregate Model of Technical Change. Q. J. Econ. 1989, 104, 787. [Google Scholar] [CrossRef]
  17. Silverberg, G.; Lehnert, D. Long Waves and “evolutionary Chaos” in a Simple Schumpeterian Model of Embodied Technical Change. Struct. Chang. Econ. Dyn. 1993, 4, 9–37. [Google Scholar] [CrossRef]
  18. Verspagen, B. Uneven Growth Between Interdependent Economies: An Evolutionary View on Technology Gaps, Trade, and Growth; Aldershot and Brookfield: Avebury, UK, 1993. [Google Scholar]
  19. Hodgson, G.M.; Verspagen, B. Uneven Growth between Interdependent Economies: An Evolutionary View on Technology Gaps, Trade and Growth. Econ. J. 1994, 104, 1214. [Google Scholar] [CrossRef] [Green Version]
  20. Schumpeter, J.A. The Theory of Economic Development; Routledge: London, UK, 1934. [Google Scholar]
  21. Petrakis, P.E.; Kafka, K.I. Entrepreneurial Creativity and Growth. In Entrepreneurship—Practice-Oriented Perspectives Passion; InTech: Rijeka, Croatia, 2016. [Google Scholar] [CrossRef]
  22. Heunks, F.J. Innovation, Creativity and Success. Small Bus. Econ. 1998, 10, 263–272. [Google Scholar] [CrossRef]
  23. Ko, S.; Butler, J.E. Creativity: A Key Link to Entrepreneurial Behavior. Bus. Horiz. 2007, 50, 365–372. [Google Scholar] [CrossRef]
  24. Sternberg, R.J.; Lubart, T.I. An Investment Theory of Creativity and Its Development. Hum. Dev. 1991, 1–31. [Google Scholar] [CrossRef]
  25. Sternberg, R.J.; Lubart, T.I. Buy Low and Sell High: An Investment Approach to Creativity. Curr. Dir. Psychol. Sci. 1992, 1, 1–5. [Google Scholar] [CrossRef]
  26. Sternberg, R.J.; Lubart, T.I. Investing in Creativity. Am. Psychol. 1996, 51, 677–688. [Google Scholar] [CrossRef]
  27. Sternberg, R.J. The Assessment of Creativity: An Investment-Based Approach. Creat. Res. J. 2012, 24, 3–12. [Google Scholar] [CrossRef]
  28. Mulder, P.; De Groot, H.L.F.; Hofkes, M.W. Economic Growth and Technological Change: A Comparison of Insights from a Neo-Classical and an Evolutionary Perspective. Technol. Forecast. Soc. Chang. 2001, 68, 151–171. [Google Scholar] [CrossRef] [Green Version]
  29. Romer, P.M. Increasing Returns and Long-Run Growth. J. Polit. Econ. 1986, 94, 1002–1037. [Google Scholar] [CrossRef] [Green Version]
  30. Grossman, G.M.; Helpman, E. The Review of Economic Studies, Ltd. Quality Ladders in the Theory of Growth Quality Ladders i n the Theory of Growth. Source Rev. Econ. Stud. Rev. Econ. Stud. 1991, 58, 43–61. [Google Scholar] [CrossRef] [Green Version]
  31. Veblen, T. Why Is Economics Not an Evolutionary Science? Q. J. Econ. 1898, 12, 373–397. [Google Scholar] [CrossRef] [Green Version]
  32. Cardon, M.S.; Wincent, J.; Singh, J.; Drnovsek, M. The Nature and Experience of Entrepreneurial Passion. Acad. Manag. Rev. 2009, 34, 511–532. [Google Scholar] [CrossRef] [Green Version]
  33. Chen, X.P.; Yao, X.; Kotha, S. Entrepreneur Passion and Preparedness in Business Plan Presentations: A Persuasion Analysis of Venture Capitalists’ Funding Decisions. Acad. Manag. J. 2009, 52, 199–214. [Google Scholar] [CrossRef]
  34. Davies, B.J.; Davies, B. Strategic Leadership. Sch. Leadersh. Manag. 2004, 24, 29–38. [Google Scholar] [CrossRef]
  35. Hirschi, G.; Jones, M. Affects of Strategic Leadership on Business Success—A Cross-Cultural Analysis from a Resource Based View. MIBES Trans. 2009, 3, 1–18. [Google Scholar]
  36. Smith, D. The Role of Entrepreneurship in Economic Development. Glob. Entrep. Dev. Index 2013, 53–71. [Google Scholar] [CrossRef] [Green Version]
  37. McMullan, W.E.; Kenworthy, T.P. Creativity and Entrepreneurial Performance: A General Scientific Theory; Springer International Publishing: Cham, Switzerland, 2015. [Google Scholar] [CrossRef]
  38. Cromie, S.; O’Donaghue, J. Assessing Entrepreneurial Inclinations. Int. Small Bus. J. Res. Entrep. 1992, 10, 183–205. [Google Scholar] [CrossRef]
  39. Morris, J.L.; Fargher, K. Achievement Drive and Creativity as Correlates of Success in Small Business. Aust. J. Psychol. 1974, 26, 217–222. [Google Scholar] [CrossRef]
  40. Khan, A.M. Entrepreneur Characteristics and the Prediction of New Venture Success. Omega 1986, 14, 365–372. [Google Scholar] [CrossRef]
  41. Lim, S.B.; Ribeiro, D.; Lee, S.M. Factors Affecting the Performance of Entrepreneurial Service Firms. Serv. Ind. J. 2008, 28, 1003–1013. [Google Scholar] [CrossRef]
  42. Gielnik, M.M.; Frese, M.; Graf, J.M.; Kampschulte, A. Creativity in the Opportunity Identification Process and the Moderating Effect of Diversity of Information. J. Bus. Ventur. 2012, 27, 559–576. [Google Scholar] [CrossRef]
  43. Baron, R.A.; Tang, J. The Role of Entrepreneurs in Firm-Level Innovation: Joint Effects of Positive Affect, Creativity, and Environmental Dynamism. J. Bus. Ventur. 2011, 26, 49–60. [Google Scholar] [CrossRef]
  44. Ar, I.M.; Baki, B. Antecedents and Performance Impacts of Product versus Process Innovation: Empirical Evidence from SMEs Located in Turkish Science and Technology Parks. Eur. J. Innov. Manag. 2011, 14, 172–206. [Google Scholar] [CrossRef]
  45. Weede, E.; Kämpf, S. The Impact of Intelligence and Institutional Improvements on Economic Growth. Kyklos 2002, 55, 361–380. [Google Scholar] [CrossRef]
  46. Jones, G.; Schneider, W.J. Intelligence, Human Capital, and Economic Growth: A Bayesian Averaging of Classical Estimates (BACE) Approach. J. Econ. Growth 2006, 11, 71–93. [Google Scholar] [CrossRef]
  47. Squalli, J.; Wilson, K. Intelligence, Creativity, and Innovation. Intelligence 2014, 46, 250–257. [Google Scholar] [CrossRef]
  48. Nusbaum, E.C.; Silvia, P.J. Are Intelligence and Creativity Really so Different? Fluid Intelligence, Executive Processes, and Strategy Use in Divergent Thinking. Intelligence 2011, 39, 36–45. [Google Scholar] [CrossRef] [Green Version]
  49. Jacobs, J. The Economy of Cities; Random House: New York, NY, USA, 1969. [Google Scholar]
  50. Zucker, L.G.; Darby, M.R.; Armstrong, J. Geographically Localized Knowledge: Spillovers or Markets? Econ. Inq. 1998, 36, 65–86. [Google Scholar] [CrossRef]
  51. Lee, S.Y.; Florida, R.; Gates, G. Innovation, Human Capital, and Creativity. Int. Rev. Public Adm. 2010, 14, 13–24. [Google Scholar] [CrossRef]
  52. Knudsen, B.; Florida, R.R.; Stolarick, K. Beyond Spillovers: The Effects of Creative Density on Innovation; 2005. [Google Scholar]
  53. Aghion, P.; Akcigit, U.; Howitt, P. The Schumpeterian Growth Paradigm, Annu. Rev. Econom. 2015, 7, 557–575. [Google Scholar]
  54. Aghion, P.; Bloom, N.; Blundell, R.; Griffith, R.; Howitt, P. Competition and Innovation: An Inverted-U Relationship. Q. J. Econ. 2005, 120, 701–728. [Google Scholar] [CrossRef] [Green Version]
  55. Aghion, P.; Harris, C.; Howitt, P.; Vickers, J. Competition, Imitation and Growth with Step-by-Step Innovation. Rev. Econ. Stud. 2001, 68, 467–492. [Google Scholar] [CrossRef]
  56. Aghion, P.; Howitt, P. Model of Growth through Creative Destruction. NBER Work. Pap. Ser. 1990, 1–50. [Google Scholar]
  57. Lucas, B.; Sjak, S. Sustainable Resource Use and Economic Dynamics; Bretschger, L., Sjak, S., Eds.; Springer International Publishing: Cham, Switzerland, 2013; Volume 53. [Google Scholar] [CrossRef]
  58. Gault, F. Handbook of Innovation Indicators and Measurement; Edward Elgar Publishing: Cheltenham, UK, 2014. [Google Scholar] [CrossRef]
  59. UNTACD. Creative Economy Report 2010. English 2010, 392. [Google Scholar] [CrossRef]
  60. Poincaré, H. Mathematical Creation. Monist 1910. [Google Scholar] [CrossRef]
  61. Hadamard, J. An Essay on the Psychology of Invention in the Mathematical Field. J. Philos. 1945, 42, 333. [Google Scholar] [CrossRef]
  62. Sadler-Smith, E. Wallas’ Four-Stage Model of the Creative Process: More Than Meets the Eye? Creat. Res. J. 2015, 27, 342–352. [Google Scholar] [CrossRef] [Green Version]
  63. Hammershøj, L.G. Creativity in Education as a Question of Cultivating Sensuous Forces. Think. Ski. Creat. 2014, 13, 168–182. [Google Scholar] [CrossRef]
  64. Howell, J.M.; Higgins, C.A. Champions of Technological Innovation. Adm. Sci. Q. 1990, 35, 317–341. [Google Scholar] [CrossRef]
  65. Williams, L.K.; McGuire, S.J. Economic Creativity and Innovation Implementation: The Entrepreneurial Drivers of Growth? Evidence from 63 Countries. Small Bus. Econ. 2008, 34, 391–412. [Google Scholar] [CrossRef]
  66. Amabile, T.M. Entrepreneurial Creativity through Motivational Synergy. J. Creat. Behav. 1997. [Google Scholar] [CrossRef]
  67. Amabile, T.M.; Pillemer, J. Perspectives on the Social Psychology of Creativity. J. Creat. Behav. 2012. [Google Scholar] [CrossRef]
  68. Altshuller, G. The Innovation Algorithm; Technical Innovation Center: Worcester, UK, 1999. [Google Scholar]
  69. Rossman, J. The Motives of Inventors. Q. J. Econ. 1931, 45, 522. [Google Scholar] [CrossRef]
  70. Hollanders, H.; Van Cruysen, A. Design, Creativity and Innovation: A Scoreboard Approach. In PRO INNO /INNO Metrics: Design, Creativity and Innovation; Springer: Cham, Switzerland, 2009; pp. 1–37. [Google Scholar] [CrossRef] [Green Version]
  71. Aghion, P.; Askenazy, P.; Bourlès, R.; Cette, G.; Dromel, N. Education, Market Rigidities and Growth. Econ. Lett. 2009, 102, 62–65. [Google Scholar] [CrossRef]
  72. Nathan, R. Perspectives on Technology; Cambridge University Press: Cambridge, UK, 1979; Volume 70. [Google Scholar] [CrossRef]
  73. Hall, C.M.; Williams, A.M.; Hall, C.M.; Williams, A.M. Knowledge, Creativity, and Innovation. Tour. Innov. 2019, 84–133. [Google Scholar] [CrossRef]
  74. Thomas, R.J. New Product Success Stories: Lessons from Leading Innovators; John Wiley and Sons: New York, NY, USA, 1996. [Google Scholar] [CrossRef]
  75. Drucker, P.F. The Coming of the New Organization. Harv. Bus. Rev. 1988, 45–53. [Google Scholar]
  76. Bevan-Roberts, E.M.; Csikszentmihalyi, M.; Rathunde, K.; Whalen, S. Talented Teenagers—The Roots of Success and Failure. Br. J. Educ. Stud. 1994, 42, 299. [Google Scholar] [CrossRef]
  77. Sternberg, R.J.; O’Hara, L.A.; Lubart, T.I. Creativity as Investment. Calif. Manag. Rev. 1997. [Google Scholar] [CrossRef]
  78. McClelland, D.C. The Achieving Society; D Van Nostrand Company: Princeton, NJ, USA, 1961. [Google Scholar]
  79. Romero, I.; Martínez-Román, J.A. Self-Employment and Innovation. Exploring the Determinants of Innovative Behavior in Small Businesses. Res. Policy 2012, 41, 178–189. [Google Scholar] [CrossRef]
  80. Martínez-Román, J.A.; Romero, I. About the Determinants of the Degree of Novelty in Small Businesses’ Product Innovations. Int. Entrep. Manag. J. 2013, 9, 655–677. [Google Scholar] [CrossRef]
  81. Vandenbussche, J.; Aghion, P.; Meghir, C. Growth, Distance to Frontier and Composition of Human Capital. J. Econ. Growth 2006, 11, 97–127. [Google Scholar] [CrossRef]
  82. Gryskiewicz, N. Entrepreneurs’ Problem-Solving Styles: An Empirical Study Using the Kirton Adaption/Innovation Theory. J. Small Bus. Manag. 1993, 31, 22–31. [Google Scholar]
  83. Allinson, C.W.; Chell, E.; Hayes, J. Intuition and Entrepreneurial Behaviour. Eur. J. Work Organ. Psychol. 2000, 9, 31–43. [Google Scholar] [CrossRef]
  84. Baron, R.A. Cognitive Mechanisms in Entrepreneurship: Why and When Enterpreneurs Think Differently than Other People. J. Bus. Ventur. 1998, 13, 275–294. [Google Scholar] [CrossRef]
  85. Levin, S.L.; Scherer, F.M. Innovation and Growth: Schumpeterian Perspectives. South. Econ. J. 1986, 52, 888. [Google Scholar] [CrossRef]
  86. Scherer, F.M. The Propensity to Patent. Int. J. Ind. Organ. 1983, 1, 107–128. [Google Scholar] [CrossRef]
  87. Scherer, F.M. Firm Size, Market Structure, Opportunity, and the Output of Patented Inventions. Am. Econ. Rev. 1965, 55, 1. [Google Scholar] [CrossRef]
  88. Braun, V. The Innovation War; Pearson Technology Group: London, UK, 1997; Volume 3. [Google Scholar] [CrossRef]
  89. Lynne, G.; Morone, J.; Paulson, A. Marketing and Discontinuous Innovation: The Probe and Learn Process. In Winning through Innovation; Tushman, M.L., O’Reilly, C.A., Eds.; Harvard Business School Press: Harvard, MA, USA, 1996; pp. 353–375. [Google Scholar]
  90. Ann, M. Innovative Genius: A Framework for Relating Individual and Organizational Intelligences to Innovation. Management 1996, 21, 1081–1111. [Google Scholar]
  91. Bleakley, A. ‘Your Creativity or Mine?’: A Typology of Creativities in Higher Education and the Value of a Pluralistic Approach. Teach. High. Educ. 2004, 9, 463–475. [Google Scholar] [CrossRef]
  92. Cook, P. The Creativity Advantage—Is Your Organization the Leader of the Pack? Ind. Commer. Train. 1998, 30, 179–184. [Google Scholar] [CrossRef] [Green Version]
  93. Pressman, S. Book Review: The Competitive Advantage of Nations. J. Manag. 1991, 17, 213–215. [Google Scholar] [CrossRef]
  94. Sternberg, R.J. The Theory of Successful Intelligence. Interam. J. Psychol. 2005, 39, 189–202. [Google Scholar] [CrossRef]
  95. Mihaly, C. Flow and the Psychology of Discovery and Invention; Cambridge University Press: Cambridge, UK, 1997. [Google Scholar] [CrossRef]
  96. Gardner, H. Frames of Mind; Basic Books: New York, NY, USA, 2011. [Google Scholar]
  97. Runco, M.A. Comments on Where the Creativity Research Has Been and Where Is It Going. J. Creat. Behav. 2017, 51, 308–313. [Google Scholar] [CrossRef]
Figure 1. The relationship among creativity, invention and innovation.
Sustainability 13 03848 g001
Figure 2. The sustainable innovation processes.
Sustainability 13 03848 g002
Figure 3. Scatter plot.
Sustainability 13 03848 g003
Figure 4. Spider web of the national levels of creativity, innovation and knowledge.
Sustainability 13 03848 g004
Figure 5. Changes in knowledge, creativity and innovation.
Sustainability 13 03848 g005
Figure 6. Regression results.
Sustainability 13 03848 g006
Figure 7. Innovation trends in Europe.
Sustainability 13 03848 g007
Table 1. Results of multiple regression.
Coefficients
ModelUnstandardized CoefficientsStandardized CoefficientstSig.
BStd. ErrorBeta
(Constant)0.0720.033 2.1980.029
CREATIVITY0.290.0710.254.0750
KNOWLEDGE0.6330.0770.5058.2160
Table 2. Binary correlation matrix.
Share of Households with ITC at HomeMedium and High-Tech Product ExportsNew Doctorate GraduatesPopulation Completed Tertiary EducationEnterprises Providing ICT TrainingSMEs with Product or Process InnovationsSMEs with Marketing or Organizational InnovationsSMEs Innovating in-HouseScientific Publications among Top 10% Most CitedSales of New-to-Market/Firm Product InnovationsPatent ApplicationsTrademark ApplicationsDesign ApplicationsAuthor’s Royalties Collected Euro/Capita
Share of households with ITC at home1.00
Medium and high-tech product exports0.401.00
New doctorate graduates0.540.231.00
Population completed tertiary education0.37−0.20.011.00
Enterprises providing ICT training0.620.300.570.291.00
SMEs with product or process innovations0.600.060.480.310.701.00
SMEs with marketing or organizational innovations0.530.130.420.260.660.881.00
SMEs innovating in-house0.550.090.400.320.660.970.871.00
Scientific publications among top 10% most cited0.760.110.540.440.610.820.750.761.00
Sales of new-to-market and new-to-firm product innovations0.130.450.45−0.170.320.190.250.180.191.00
patent applications0.760.230.740.190.610.630.480.600.710.101.00
Trademark applications0.370.10−0.20.360.370.370.350.390.36−0.240.161.00
Design applications0.450.140.09−0.030.300.390.380.350.41−0.200.400.661.00
Author’s royalties collected euro / capita0.430.09−0.10.330.280.320.490.340.33−0.180.050.520.431.00
Table 3. Partial correlations, with control for GDP (gross domestic product).
Correlations
Control VariablesKNOWLEDGEINNOVATIONCREATIVITY
GDPKNOWLEDGECorrelation1
INNOVATIONCorrelation0.676 *1
CREATIVITYCorrelation0.611 **0.588 **1
* Sig 0.000, ** Sig 0.001.
Table 4. Goodness of fit.
Model1
R0.685
R Square0.469
Adjusted R Square0.465
Std. Error of the Estimate0.1486003
Publisher’s Note: MDPI stays neutral with regard to jurisdictional claims in published maps and institutional affiliations.

