1. Introduction
Conservation of biological diversity is one of the key sustainable development goals (SDGs) that seeks to protect, restore, and promote sustainable use of ecosystem services and reduce threat to biodiversity [
1]. The expanding global economy coupled with increased human population poses a continuous threat to biodiversity [
2]. Some scholars caution that nearly half of the world’s wildlife species could be on extinction within the next few decades if the inverse relationship between economic growth and biodiversity continues [
3,
4].
Given the importance of biodiversity, there have been growing efforts to conserve wildlife in developing countries that inhabit most of the world’s biodiversity. One of these efforts is the designation of protected areas (PAs) by the International Union for the Conservation of Nature (IUCN) through various donor support programs. However, there are rising concerns in developing countries that increasing size of protected areas leads to the systematic exclusion of local communities from natural resource use that results into the failure of biodiversity conservation projects [
5].
Governance of protected areas, defined as who holds authority, responsibility, and accountability for decisions in protected areas, is considered an important factor that explains variation in biodiversity conservation outcomes [
6]. Many development experts maintain that the systematic inclusion of the local communities in the governance of protected areas under certain agreements can guarantee the sustainability of natural resource use [
2]. In addition, proponents of sustainable development argue that inclusion of local communities can be a ‘win–win’ strategy that generates both economic and environmental benefits [
2,
7,
8,
9,
10,
11,
12,
13].
Despite widespread recognition of community-based conservation in recent years, there is dearth of empirical evidence on whether countries with larger size of community-governed protected areas do better in terms of national biodiversity conservation statistics. For example, a recent meta-analytical study evaluating the impact of PAs on species population finds positive impact of PAs on habitat cover with inconclusive evidence on whether PAs are effective for species conservation [
14]. Although, a global analysis by Oldekop et al. [
15] shows a positive association between the socioeconomic and biodiversity conservation outcomes of PAs, however, this study does not consider any precise variation in the governance arrangements within protected areas and suggests possible influence of such arrangements on the social and biodiversity conservation objectives. Besides, the literature also points to the lack of macro-level causal connection between governance (management) and biodiversity conservation outcomes across different countries [
16,
17,
18].
The next section sheds light on the history and evolution of designated protected areas as a conservation policy and its relationship with conservation outcomes vis-à-vis economic incentive mechanisms in the light of previous studies. Then, the following sections describe data, methods, specifications, and findings. The last two sections discuss and conclude.
2. Literature Review
Since the start of modern protected areas movement in North America, Australia, New Zealand, and South Africa in the late nineteenth century, the idea of protected areas spread around the world in the twentieth century with different driving forces. For example, in North America, many protected areas were exclusively designated to safeguard dramatic and sublime scenery of natural heritage, or geo-heritage, such as minerals and fossils while, in Africa, the concern was with game parks [
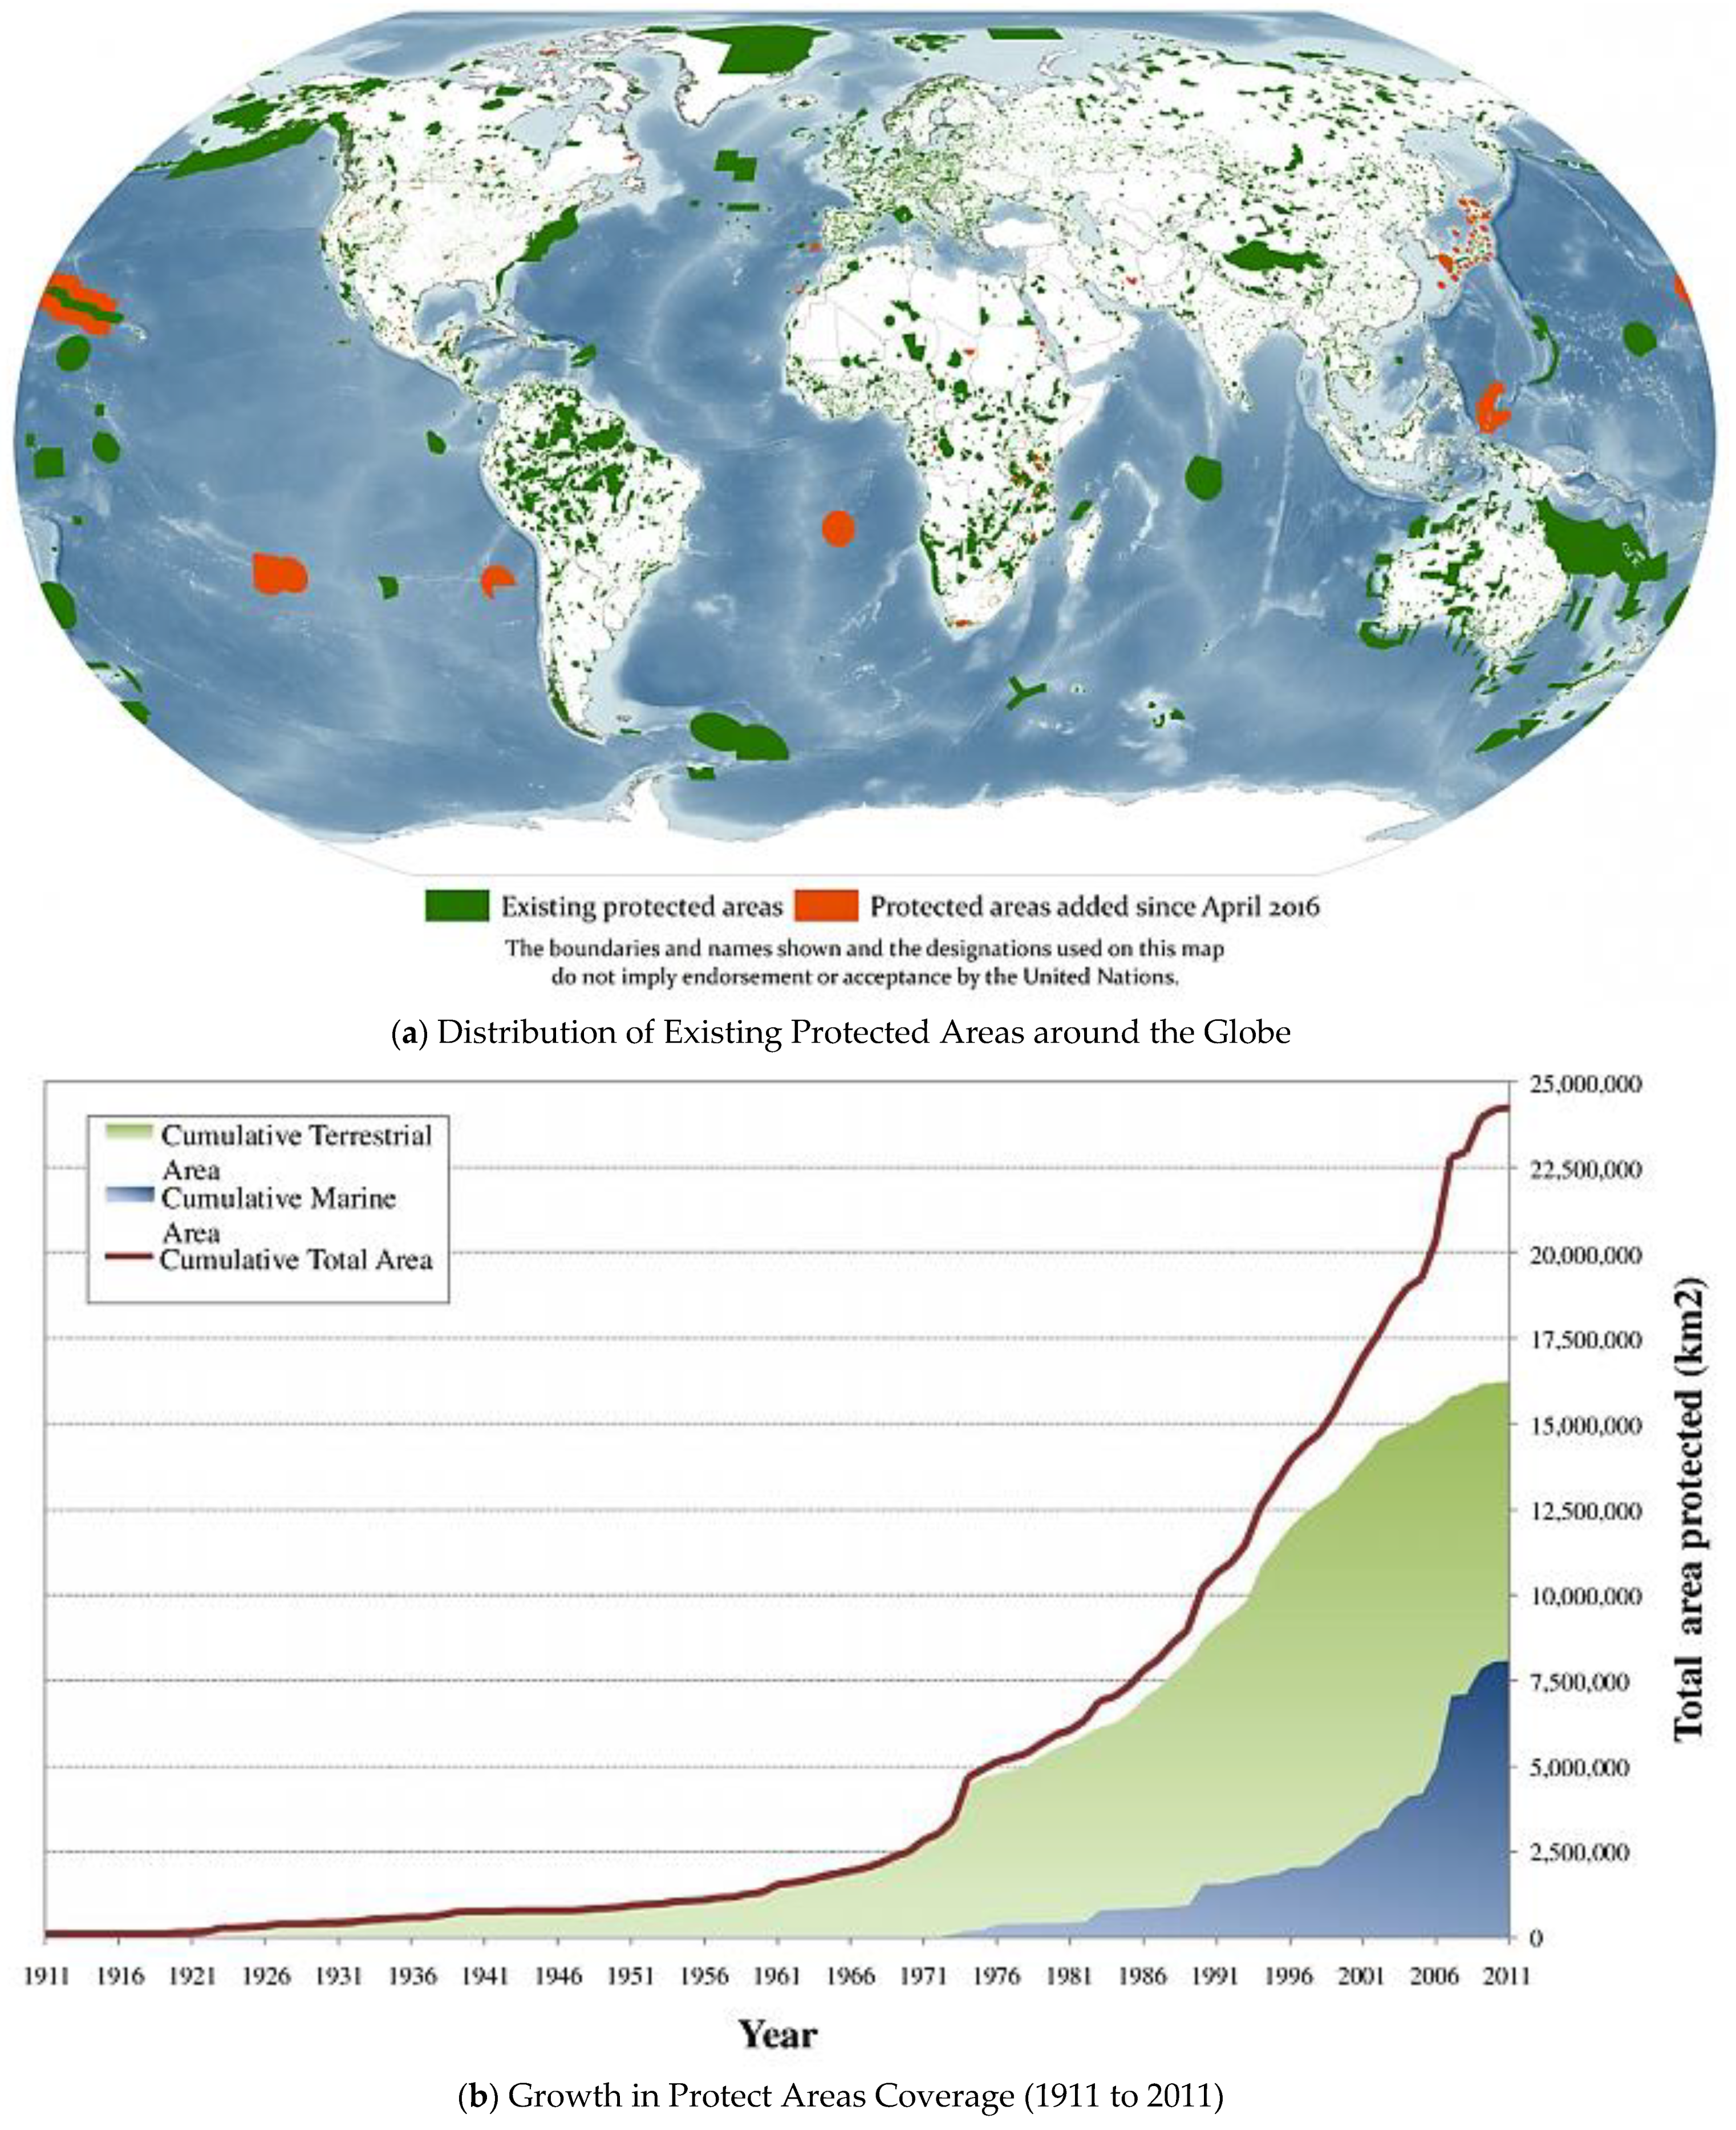
19]. In 2016, there were a total of 202,467 protected sites, over a 20 million km
2 area, or nearly 14.7% of the earth’s land [
20]. One of the most important purposes of many designated PAs is the preservation of constituent species and ecosystem services [
21,
22,
23,
24]. Understanding of the conditions under which such PAs are designated and how they deliver their biodiversity conservation outcome is therefore important for policy makers and conservation specialists to adopt sustainable courses of actions.
The IUCN officially defines PA as “a clearly defined geographical space, recognized, dedicated and managed, through legal or other effective means, to achieve the long-term conservation of nature with associated ecosystem services and cultural values” [
22] (p. 30). The World Database on Protected Areas (WDPA) -a joint initiative between the United Nations Environment Programme (UNEP), the World Conservation Monitoring Centre (UNEP-WCMC), the IUCN and the World Commission on Protected Areas (WCPA)- is the largest database that collects, compiles and reports data on marine and terrestrial PAs in collaboration with various governmental and non-governmental organizations, academia, and industry. Its aim is to develop and maintain an accurate and freely available up-to-date database on PAs status around the world to be used as a global standard by all relevant stakeholders [
25].
In the WDPA database, the governance of PAs is sorted out with many categories. These include: PAs established by the government; areas established under the regional and international conventions; privately owned conservation areas; and areas conserved by indigenous people and local communities. The IUCN has further two broad types of classifications: (1) management categories and (2) governance types. The protected area management categories help us classify PAs based on their primary management objectives [
22] while the governance types classify PAs according to who holds authority, responsibility, and accountability for them [
26]. Currently about 65% of the PAs in the WDPA have an IUCN Management Category, and 88% have governance types [
27]. In this paper, we use the latter classification because it sufficiently tells us the extent to which authority, responsibility and accountability is devolved to the lower level in terms of resource use.
2.1. Governance of Protected Areas
Governance refers to the process of decision-making and exercising of authority in an organization. According to Graham, Amos and Plumptre [
6], governance of PAs is defined as interactions among structures, processes and traditions that determine the extent to which power is exercised, responsibility is shared, the way decisions are taken and how citizens or other stakeholders participate in the process. Achievement of the protected areas’ objectives is closely associated with the extent of power and decision-making capacity, responsibilities sharing, rights to use and the way financial, political, or communal support is generated around PAs [
28].
Ever since PAs have been used for conservation, decisions about how to protect, conserve and use the natural resources inside or around the PAs have been done by the state (central or local government), international organizations, private owners, or local communities. Recently, there has been increasing attention to understand the nature of governance in terms of appropriateness to the specific context, effectiveness in delivering lasting results and livelihood benefits under different governance regimes [
26]. Although an ideal governance setting does not exist for all PAs, the IUCN suggests a set of “good governance” principles (indicators) that can provide insights about the way specific governance settings contribute to protecting livelihood, rights and values of the indigenous people in or around these areas [
20,
21]. The key concepts of IUCN governance category include, participation, innovation, benefits sharing, respect and informed approval of the stakeholders. According to the IUCN, the purpose of creating this variable is to measure the extent to which full and effective participation of relevant stakeholders including local peoples is ensured, and the proportion of benefits shared equitably [
26].
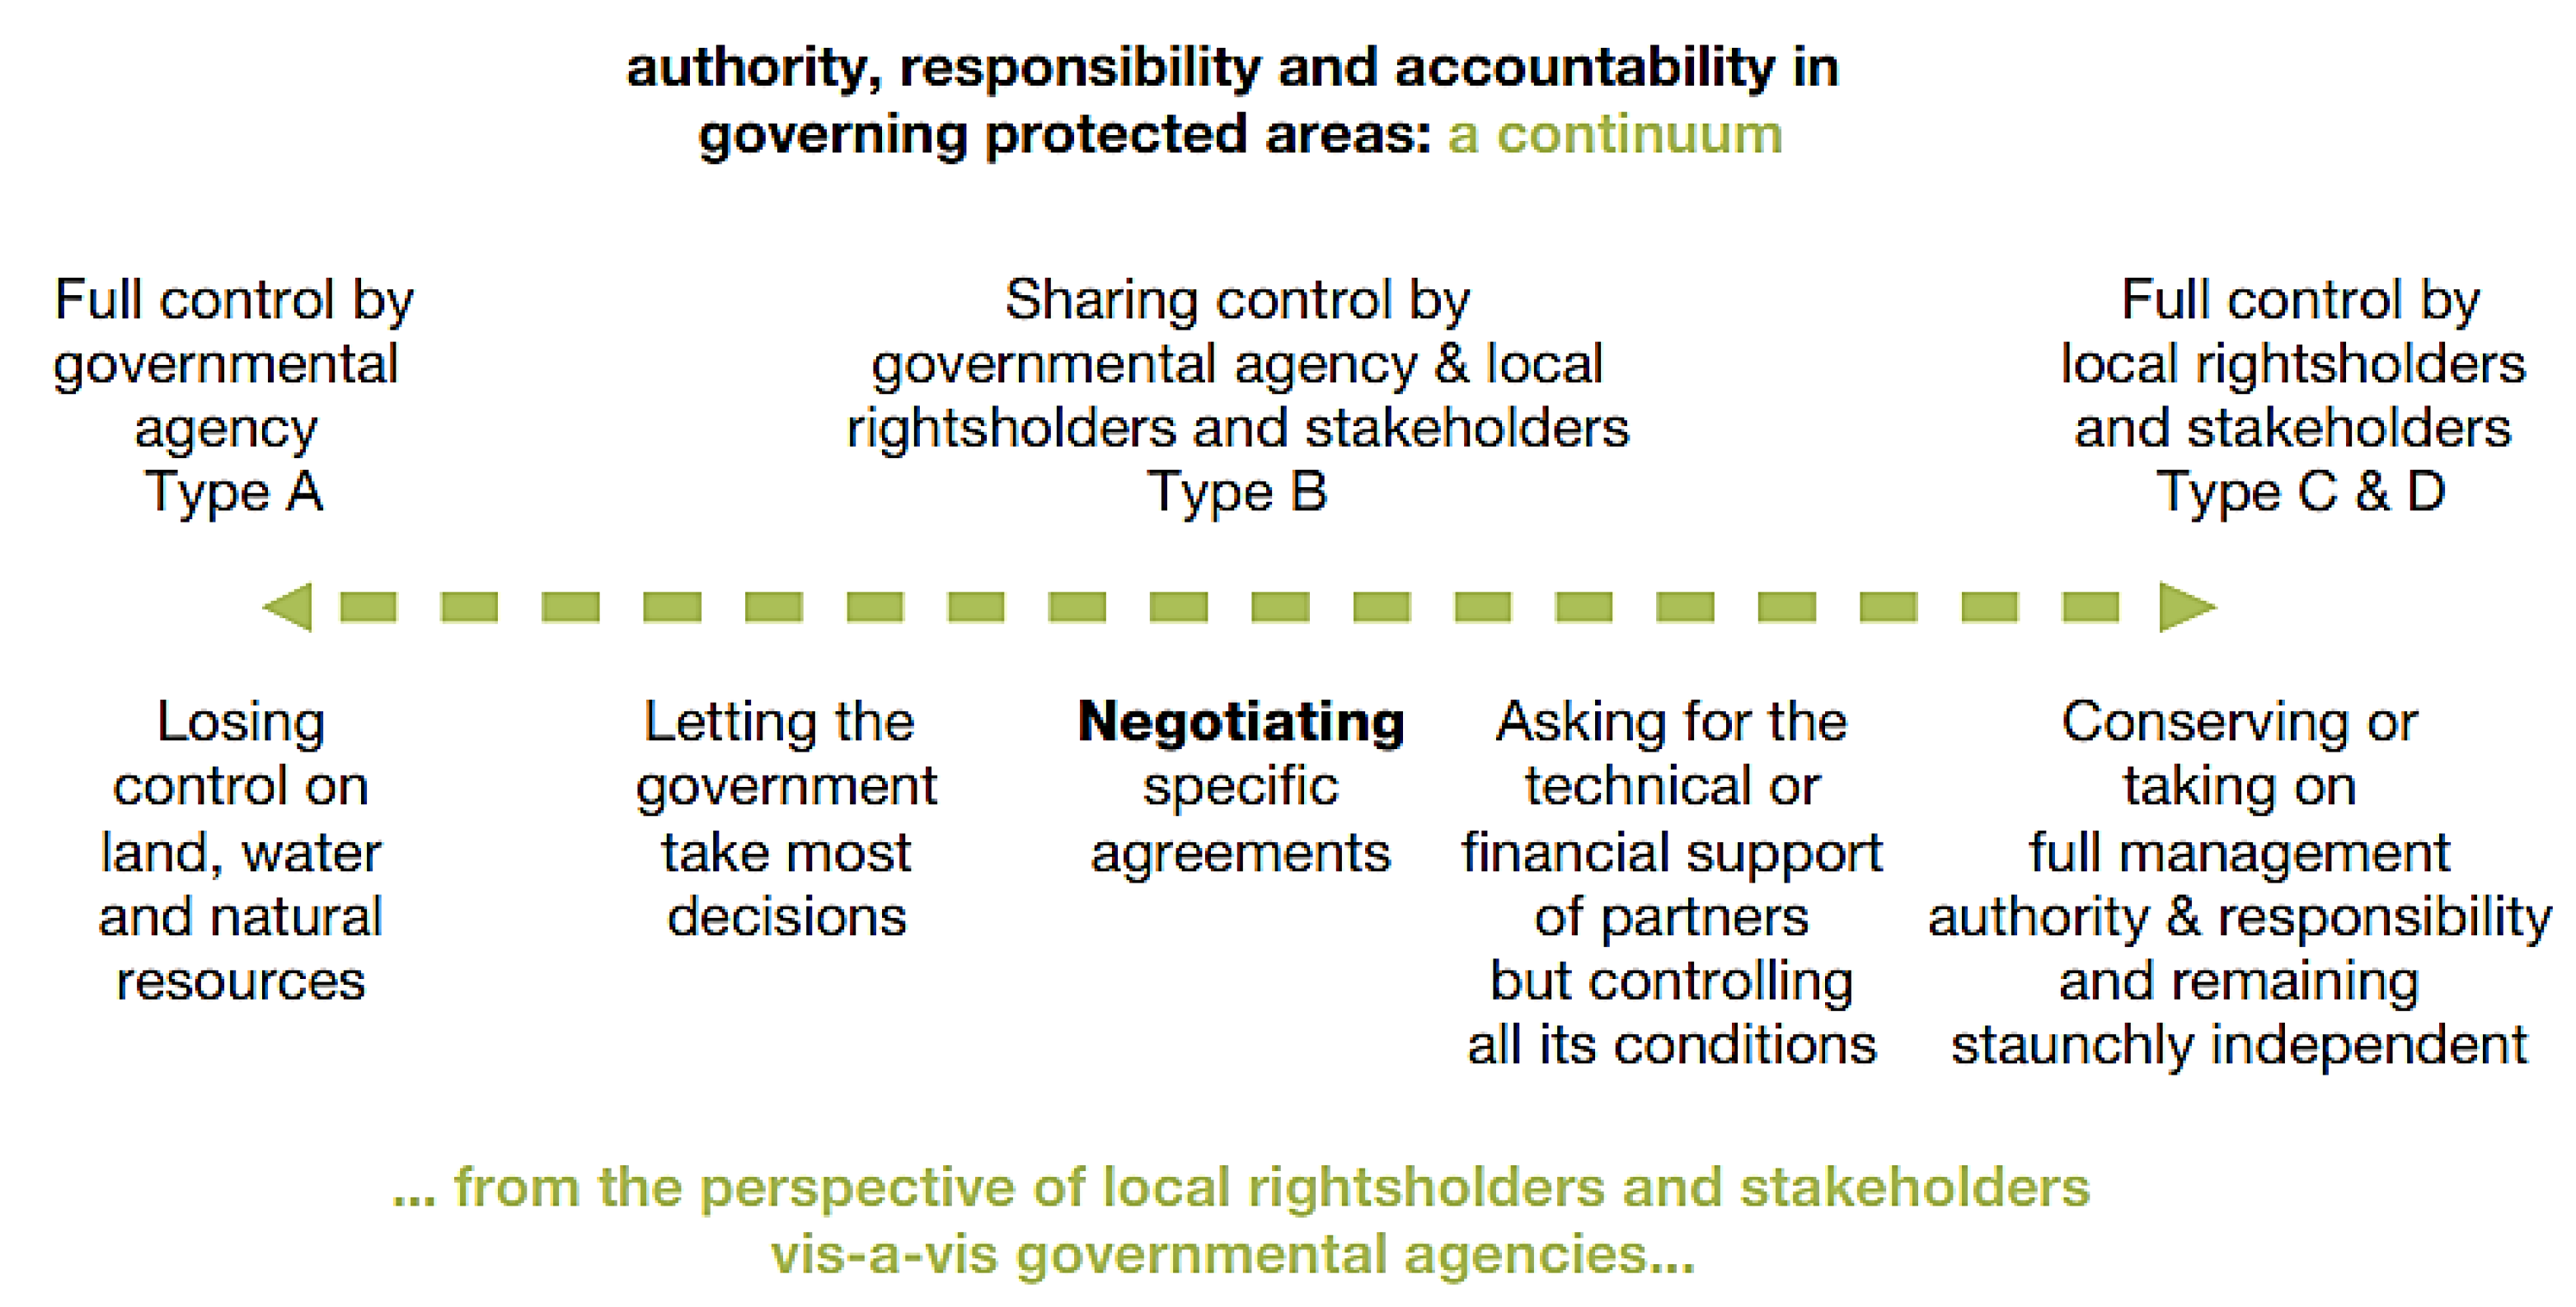
Figure 1 shows the distribution of the four types of governance variables, which are discussed in the following text.
2.1.1. State PAs and Conservation Outcomes
The state PAs are characterized by strict government control over the designated areas in terms of authority, responsibility and accountability in decisions and determination of its conservation objectives [
20]. Usually, a ministry or PA agency under the national or sub-national government is responsible for the management and development of enforcement plans for the PAs. In most of the cases, central governments take overall control of PAs and make all major decisions with a little or no say from the local people in or around PAs [
14,
28]. Historically, state PA was the dominant type of governance, however, recently, there have been increasing efforts in delegating the authority to the sub-national level or local level [
28,
29,
30].
Although the establishment of PAs is considered a great achievement per se, many environmentalists and social scientists believe that state PAs alone cannot safeguard preservation of biodiversity due to multiple reasons [
25,
26,
31,
32,
33]. For example, many state PAs have been established under the top-down approach of the nineteenth century [
24,
34]. Such PAs have failed to consider social, cultural, and political values that are important for the indigenous communities [
23]. Governments frequently deprive communities from extracting resources that are essential for their livelihoods, and in some cases, local people are pushed out from their lands with no consultation or appropriate compensation [
35]. This often results in adverse social impact on local communities that include disruption of their traditional way of living, lack of cooperation with protected areas’ authorities and hostile attitude towards nature [
36,
37,
38,
39]. In addition, conflicts emerge between state authorities and local people that reduce the effectiveness of PAs in conservation outcomes [
11,
31,
40]. In the later section of this paper, we extend this discussion to some country specific cases where conflicts between states and local people have emerged.
2.1.2. Community-Governed PAs and Conservation Outcomes
The effect of the inappropriate protected areas’ management on the livelihood of local people is well documented [
22,
23,
37,
41,
42,
43]. A number of studies report concerns of local communities about their exclusion from getting benefits from the local natural resources, such as forests, wildlife, and vegetation [
35,
40,
43,
44,
45,
46]. Local communities in many developing countries depend on the natural resources that PAs seek to preserve as part of their livelihoods. For example, people living in or around a forest reserve might depend on the forest use for fuel, plants and vegetation for their livestock, agriculture, and wildlife for proteins, etc. Therefore, their interest in PA management and negotiation for their share of the costs and benefits related with conservation policies is well recognized [
23,
47]. In most cases, local communities seek access to local resources, overcome human–wildlife conflicts and get their share in financial benefits arising from the natural resource, such as trophy payments, employment, tourism ventures and market for local products [
33,
36,
48]. In addition to their livelihood attachment, local people also have knowledge and practical traditions about biodiversity conservation that they have developed historically [
49]. As a result, the recent decades have seen increasing interventions in developing countries that encourage governments to devolve authority to local communities and adopt inclusive strategies in identifying priorities for natural resource management, particularly in protected areas.
The IUCN categorization of governance helps us understand the extent to which protected areas’ governance has been decentralized and local people are involved in decision making about the PA management. Community-governed PAs are formally defined as “PAs where the management, authority and responsibility rests with indigenous peoples and/or local communities who have roles in various forms of customary or legal, formal or informal institutions and rules” [
22] (p. 26). Both local community and indigenous people under this definition are associated with the concept of “commons” which refers to a form of natural resource that requires governance and management collectively by a community of people [
50]. The last decade has seen significant developments in the recognition and development of indigenous people for conservation of biodiversity. The terms “indigenous people” and “community conserved territories and areas” (ICCAs) are now being frequently used to describe natural ecosystems that contain significant biodiversity along with ecological benefits and cultural values while conserved by indigenous peoples and local communities through customary laws or other effective means [
22,
26]. This form of governance has three essential characteristics; (1) close and profound relation of local communities with the site; (2) community’s major role in decision-making; and (3) the community’s decisions lead to positive conservation outcomes due to benefits they seek from optimal use of natural resources.
2.1.3. Other Forms of Protected Areas’ Governance
The other two forms of PAs governance are collaborative or joint governance and the governance by private owners. The terms joint governance, shared governance, co-management, and collaborative management are sometimes used interchangeably. Collaborative governance is usually featured by a form of governance in which decision-making authority and responsibility rests with one agency, which is required to inform or consult other stakeholders when planning or implementing a specific plan [
26]. The private governance comprises protected areas governed by individuals, NGOs or corporate entities called “private protected areas” such as private ranches etc. This form of governance is more common in developed countries. Since this study’s main focus is on the Sub-Saharan African countries (more discussion in methodology section), therefore, the governance by private owners is not discussed in much detail here.
2.2. Economic Incentives and Community Involvement in PAs
Community-based conservation programs are based on the premise of perceived financial incentives from regulated hunting of endangered mammals for local communities who are committed to conserve them for their own benefits [
37,
44,
51]. The expectations of direct and indirect benefits (e.g., hunting, ecotourism etc.) can make them interested in being engaged in conservation programs. Studies have shown high motivation and interest in participation in community-based conservation programs in general where the potential for these incentives is higher [
39,
44,
52]. A large number of country-specific case studies have individually attempted to find major factors that lead to better compliance with conservation plans [
34,
40,
44,
52,
53,
54,
55,
56,
57,
58]. Conventional conservation policies, such as establishing national parks, often lead to conflicts between government and local communities by restricting local communities from using natural resources including wildlife in protected areas and even displacing them forcibly out of their villages [
37]. Such conflicts might arise because economically poor local communities who live on subsistence agriculture in their traditional lands perceive wildlife mainly as a threat to their livelihoods [
59].
To what extent the holding of authority, responsibility, and accountability in making key decisions for PAs affects the conservation outcomes is the question that lacks empirical answer. To understand the relations between governance and conservation outcomes, it is important to identify the channel through which such an effect might reach the ultimate objectives of PAs’ conservation of threatened species. Considering the number of studies that find economic incentives as a tool for conservation of threatened species, especially mammals [
12,
23,
51,
60,
61,
62,
63], two important assumptions are important to be held before hypothesizing any effect of community participation on conservation outcomes. First, given their livelihood constraints and dependencies on local resources, people in poor countries are primarily not concerned with conservation objectives that global forces, such as the IUCN, seek. Secondly, in the past two decades, the market value of wildlife products has increased significantly due to regulations and limitations imposed by the Convention on International Trade in Endangered Species (CITES). In other words, if there are no potential economic benefits of the target resource, local people are less likely to affect conservation outcomes. Moreover, a recent meta-analysis on 42 studies from 35 papers by Geldmann et al. [
14] measuring the effectiveness of PAs on species populations, finds no direct impact of PAs establishment on species population. Thus, we hypothesize that:
Countries with relatively larger size of community-governed protected areas do better than countries with relatively larger size of state-governed protected areas in conservation of species that carry potentially higher economic incentives for local people.
3. Data and Methods
This paper uses three different empirical approaches. We first exploit the variation in the size of designated protected areas under different governance systems and group countries into inclusive (community-governed) PAs (treatment group) and non-inclusive (strictly governed by government) protected areas (comparison group). To measure the causal effect, we apply a generalized difference-in-difference (DID) model that involves multiple treated units and periods as suggested by Wing et al. [
64] and synthetic control methods developed by Abadie, Diamond, and Hainmueller [
65,
66] and Galiani and Quistorff [
67].
Appendix A Figure A2 shows countries’ distribution in treatment and comparison groups based on the observed variations in the cumulative size of the community-governed PAs. We also use ordinary least square (OLS) fixed effect multiple regression method to check the robustness of the effect of PAs governance on the proportion of threatened mammals and birds. Our findings supplement recent individual qualitative studies and some meta-analytical findings that suggest positive conservation and socio-economic outcomes of community-governed PAs strictly-state-governed protected areas [
15].
We select Sub-Saharan African countries for three reasons. First, serious biodiversity loss particularly in mammals and birds coincides with high poverty rates in Sub-Saharan African countries [
2]. Second, over the last twenty years, community-based interventions have been made widely in Sub-Saharan Africa as mechanisms to combine rural development and conservation efforts [
23,
24,
25]. Third, Sub-Saharan African countries share similar characteristics in terms of biodiversity richness and species diversity.
3.1. Data and Variables Description
In order to examine the effect of the governance of PAs on the population of threatened species, we use the IUCN Red List as a measure of environmental degradation, the outcome variable. The IUCN Red List is a globally recognized approach for assessing and monitoring the status of biodiversity [
68]. The scientific objectivity of the IUCN Red List is assessed through the Red List Categories and Criteria developed in 1994 and revised in 2001 [
69]. According to this criterion, there are nine categories: extinct, extinct in the wild, critically endangered, endangered, vulnerable, near threatened, least concern, data deficient, and not evaluated. Every surveyed specie falls into one of these categories. So far, the IUCN has developed quantitative criteria for three categories: critically endangered, endangered, and vulnerable. Species listed within each of these categories are believed to share a similar probability of extinction risk [
22]. Species falling into the categories of critically endangered, or endangered and vulnerable are collectively described as ‘threatened’ and are generally used as a measure of threat to biodiversity. Consistent with IUCN classification, our measure of biodiversity loss in a country is the number of mammals and bird’s species known to be threatened from 2000 to 2016. These two taxonomic groups have been comprehensively assessed since 2000. Previous studies that have used this measure include Mikkelson et al. [
70] and Naidoo and Adamowicz, [
71].
To measure each country’s biodiversity-related governance policy, the World Database on Protected Areas (WDPA-IUCN) offers a range of variables that cover the nature of governance and management objectives within PAs in each country around the world. The governance category segregates PAs according to “who holds authority, responsibility and accountability for the PAs resources” [
22,
26]. We use the IUCN Protected Area Management Category and Governance Type Matrix developed by Borrini-Feyerabend et al. [
26] to classify protected areas’ categories that qualify two broad governance criteria: state-governed PAs and community-governed PAs. We use variables on the reported size of the conserved area, governance type and year of designation as an indicator of inclusiveness of the local people in the decision-making related to the designated PAs [
72]. Since the focus of this study is terrestrial protected areas, therefore we exclude marine protected areas from our data. Further, we also exclude designated areas, which come under the category of natural monuments. We also assume that the ownership of protected areas to be independent of the relationship of government and management structures of PAs. Due to the long history of PAs establishment and multiple designation in each year, we collapse (sum) the size of designated protected areas (in km
2) by year and cumulate since the 1980s. To match each country’s protected areas’ status with the IUCN Red List, we keep the cumulative PAs (in three different governance types e.g., state-governed, community-governed, and not-reported) from 2000 to 2016. The cumulated status of PAs in each country in a year captures the size of the PAs separated with different governance levels. Due to increased interventions in most of the Sub-Saharan African countries, there is considerable variation in the size of designated areas in each subsequent year since 2000.
We utilize this variation to measure the country’s ability to devolve power, authority, and accountability of PAs to the local community. We implicitly controlled for the gross wildlife exports value by using the CITES data on the exports of endangered species from Sub-Saharan African countries. The CITES database offers data on the number and size of wildlife products including trophies, live and dead bodies, skins and others with clear geneses and taxonomic classifications. We use the data on CITES reported by importing countries. We do this because of the weak reporting standards of the exporting countries mostly in Sub-Saharan Africa. The variable of gross exports is expected to be positively correlated with the IUCN threat level due to the trade sanctions on the endangered mammals and birds listed by the CITES.
To measure the level of economic development, we use GDP per capita (constant 2010 USD) from the World Bank Archives (2000–2016). Previous studies have used GDP per capita as an important determinant of threat to biodiversity [
70,
71]. To account for the country-specific differences in habitat, we use forest area as a percentage of total land area that may have a direct effect on the number of species threatened. We also control for other observable characteristics that might affect biodiversity including rule of law and political stability. Data on forest cover, income, rule of law and political stability are obtained from World Bank Tables.
Table 1 shows the summary statistics of the variables used in this work.
3.2. The Generalized Difference-in-Difference Approach
We first adopt a generalized difference-in-difference (DID) design to analyze the effect of countries with larger size of community-governed PAs (henceforth, treatment group) on the conservation outcomes using two-way fixed effects regression model. Generalized DID model allows for using different treatment units and multiple pre-and-post periods using fixed effect models [
64]. The typical DID design where two groups and two periods are utilized does not accommodate the complexity encountered in cases where multiple units are exposed to treatment at multiple time periods. Recent studies, such as Hao and Cowan [
73], Harper et al. [
74] and Anderson et al. [
75], have adopted this approach to estimate the causal effect of state adoption of medical marijuana laws on the neighboring states. Using this design, for group ≥ 2 and time ≥ 2 periods, (
Treatment)
it = 1 if the treatment is active in group
i and period
t; otherwise, (
Treatment)
it = 0. Similar to the two-group two-period case, the core assumption in the generalized DID is that any unmeasured determinants of the outcomes are either time invariant or group invariant. We estimate the outcome variable Y in country
i in year
t using the generalized DID equation as follows:
where the variable (
Treatment)it is a dummy variable that equals 1 for country
in the post-treatment period (after the country has introduced community-governed PAs) and is 0 otherwise.
is a vector of control variables that include log of the trophy exports, forest area, population density and gross domestic product in country
i in year
t. In Equation (1), the
represents the combined effects of the time-invariant characteristics of country
i, and
represents the combined effects of the time-varying but group-invariant factors. This two-way fixed effect parameterization stems from the typical parallel trend assumption involved in the two-group two-period DID, but it enables us to capture more variation in the details of the research design. We are more confident about our results after using unit-specific time trends and finding no significant change in the treatment coefficient. Otherwise, we might wonder whether our treatment effect has absorbed differences between treatment countries due to an underlying time trend-something that happens when policies kick in at different points in time.
3.3. The Synthetic Control Methods
We also adopt the synthetic control method (SCM) to estimate the treatment effect of the countries with a larger size of community-governed PAs on the IUCN Red List of threatened mammals and birds. The SCM allows us to quantitatively estimate effects in small sample settings in a manner suggested by Abadie and Gardeazabal [
76] and Abadie et al. [
65,
66]. The synth_runner command in STATA-16 provides tools to automate the process of conducting in-place placebos and calculating inference on the various possible measures. Following Cavallo et al. [
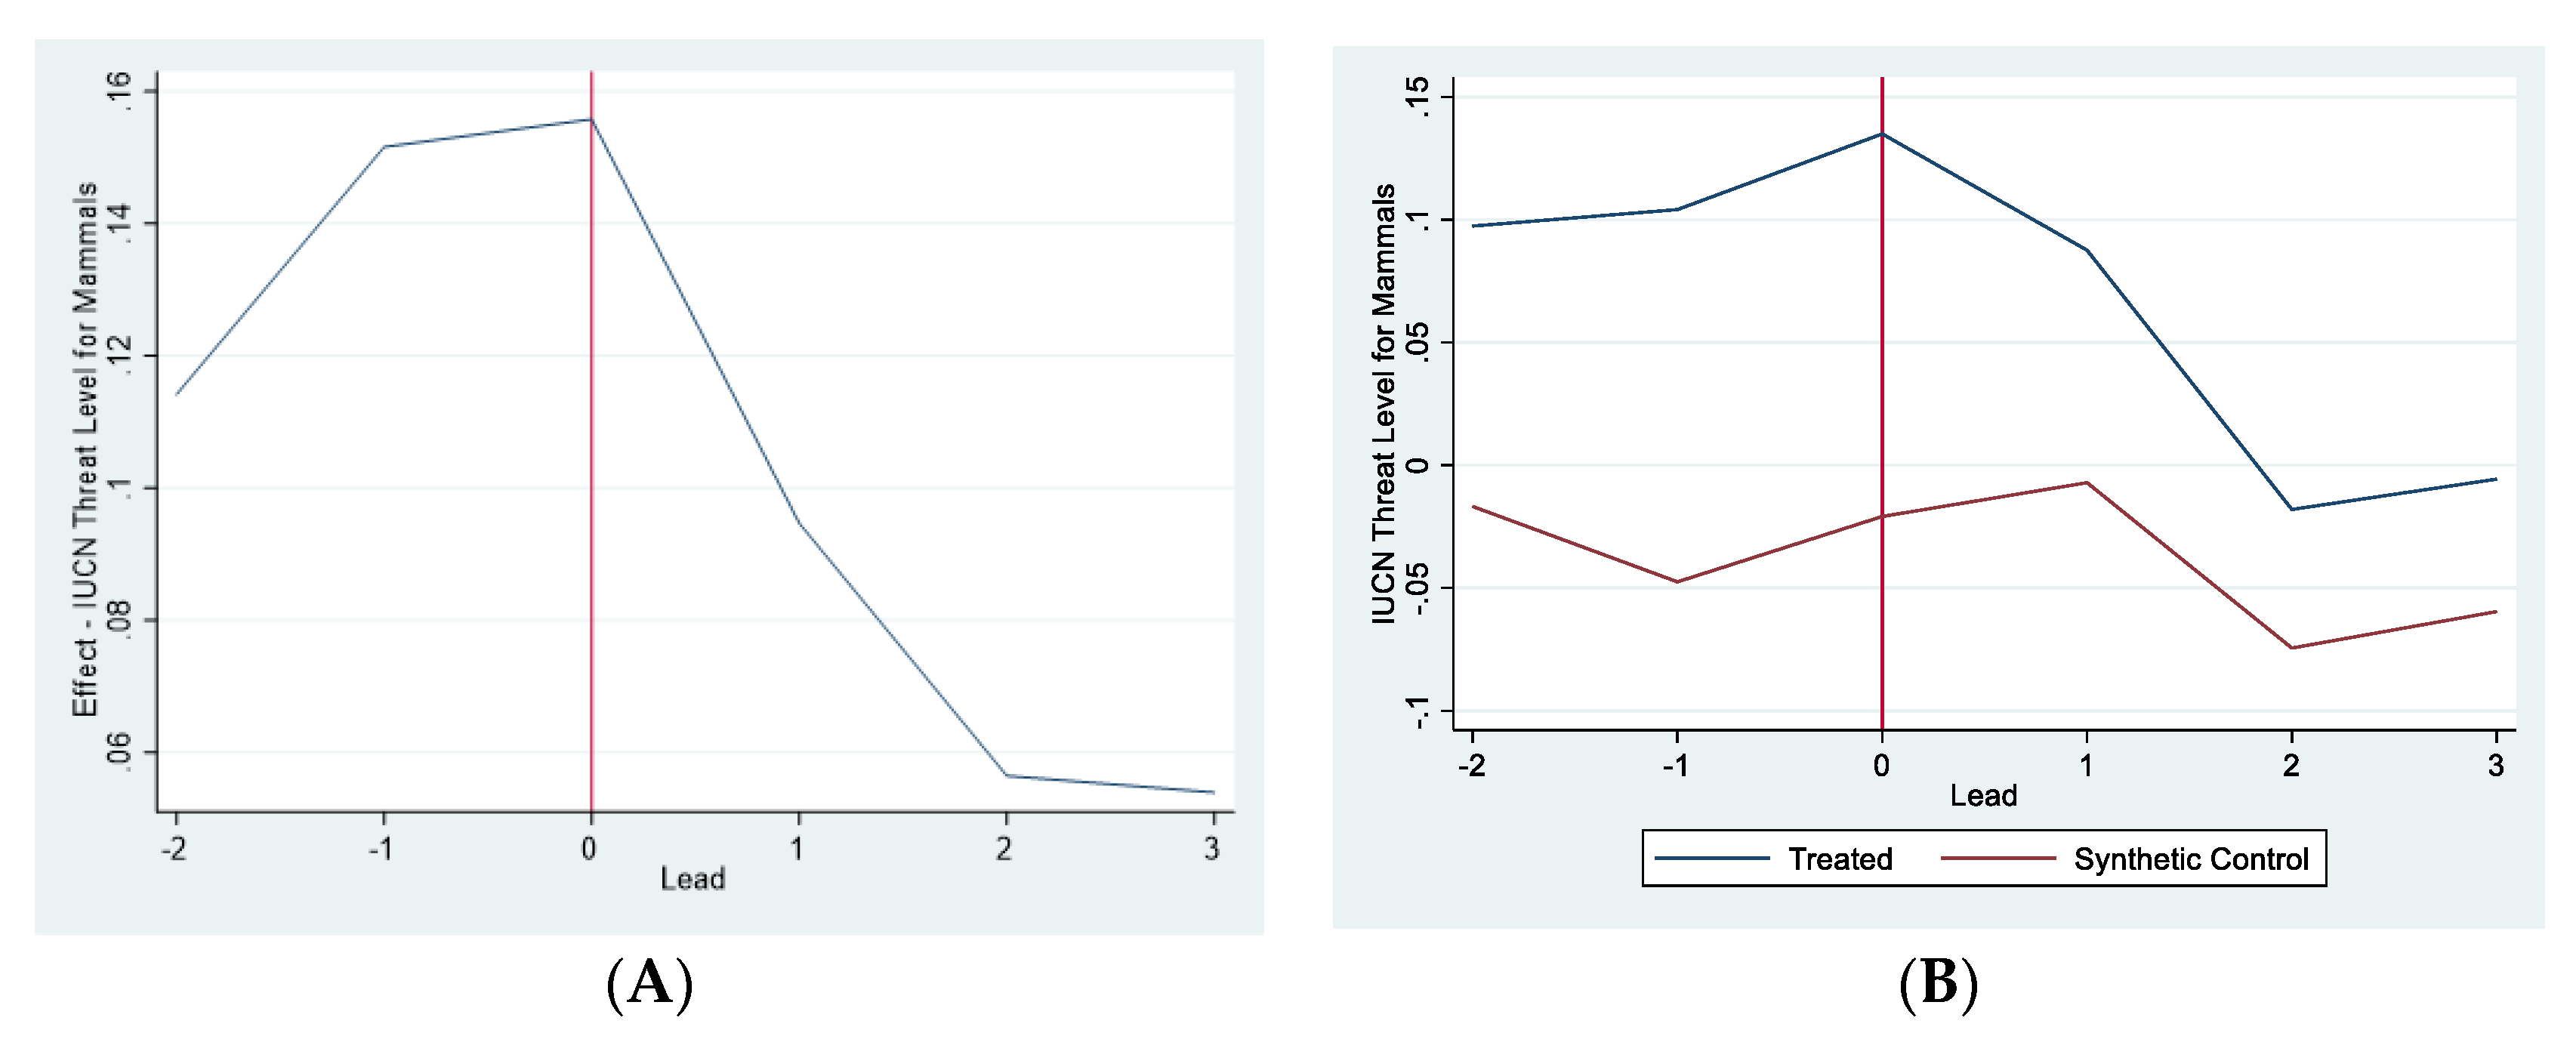
77], this modified version of Synth command extends the initial estimation strategy to allow for multiple units that receive treatment at potentially different times, allowing for matching on trends in the outcome variable rather than on the level besides other important features. In
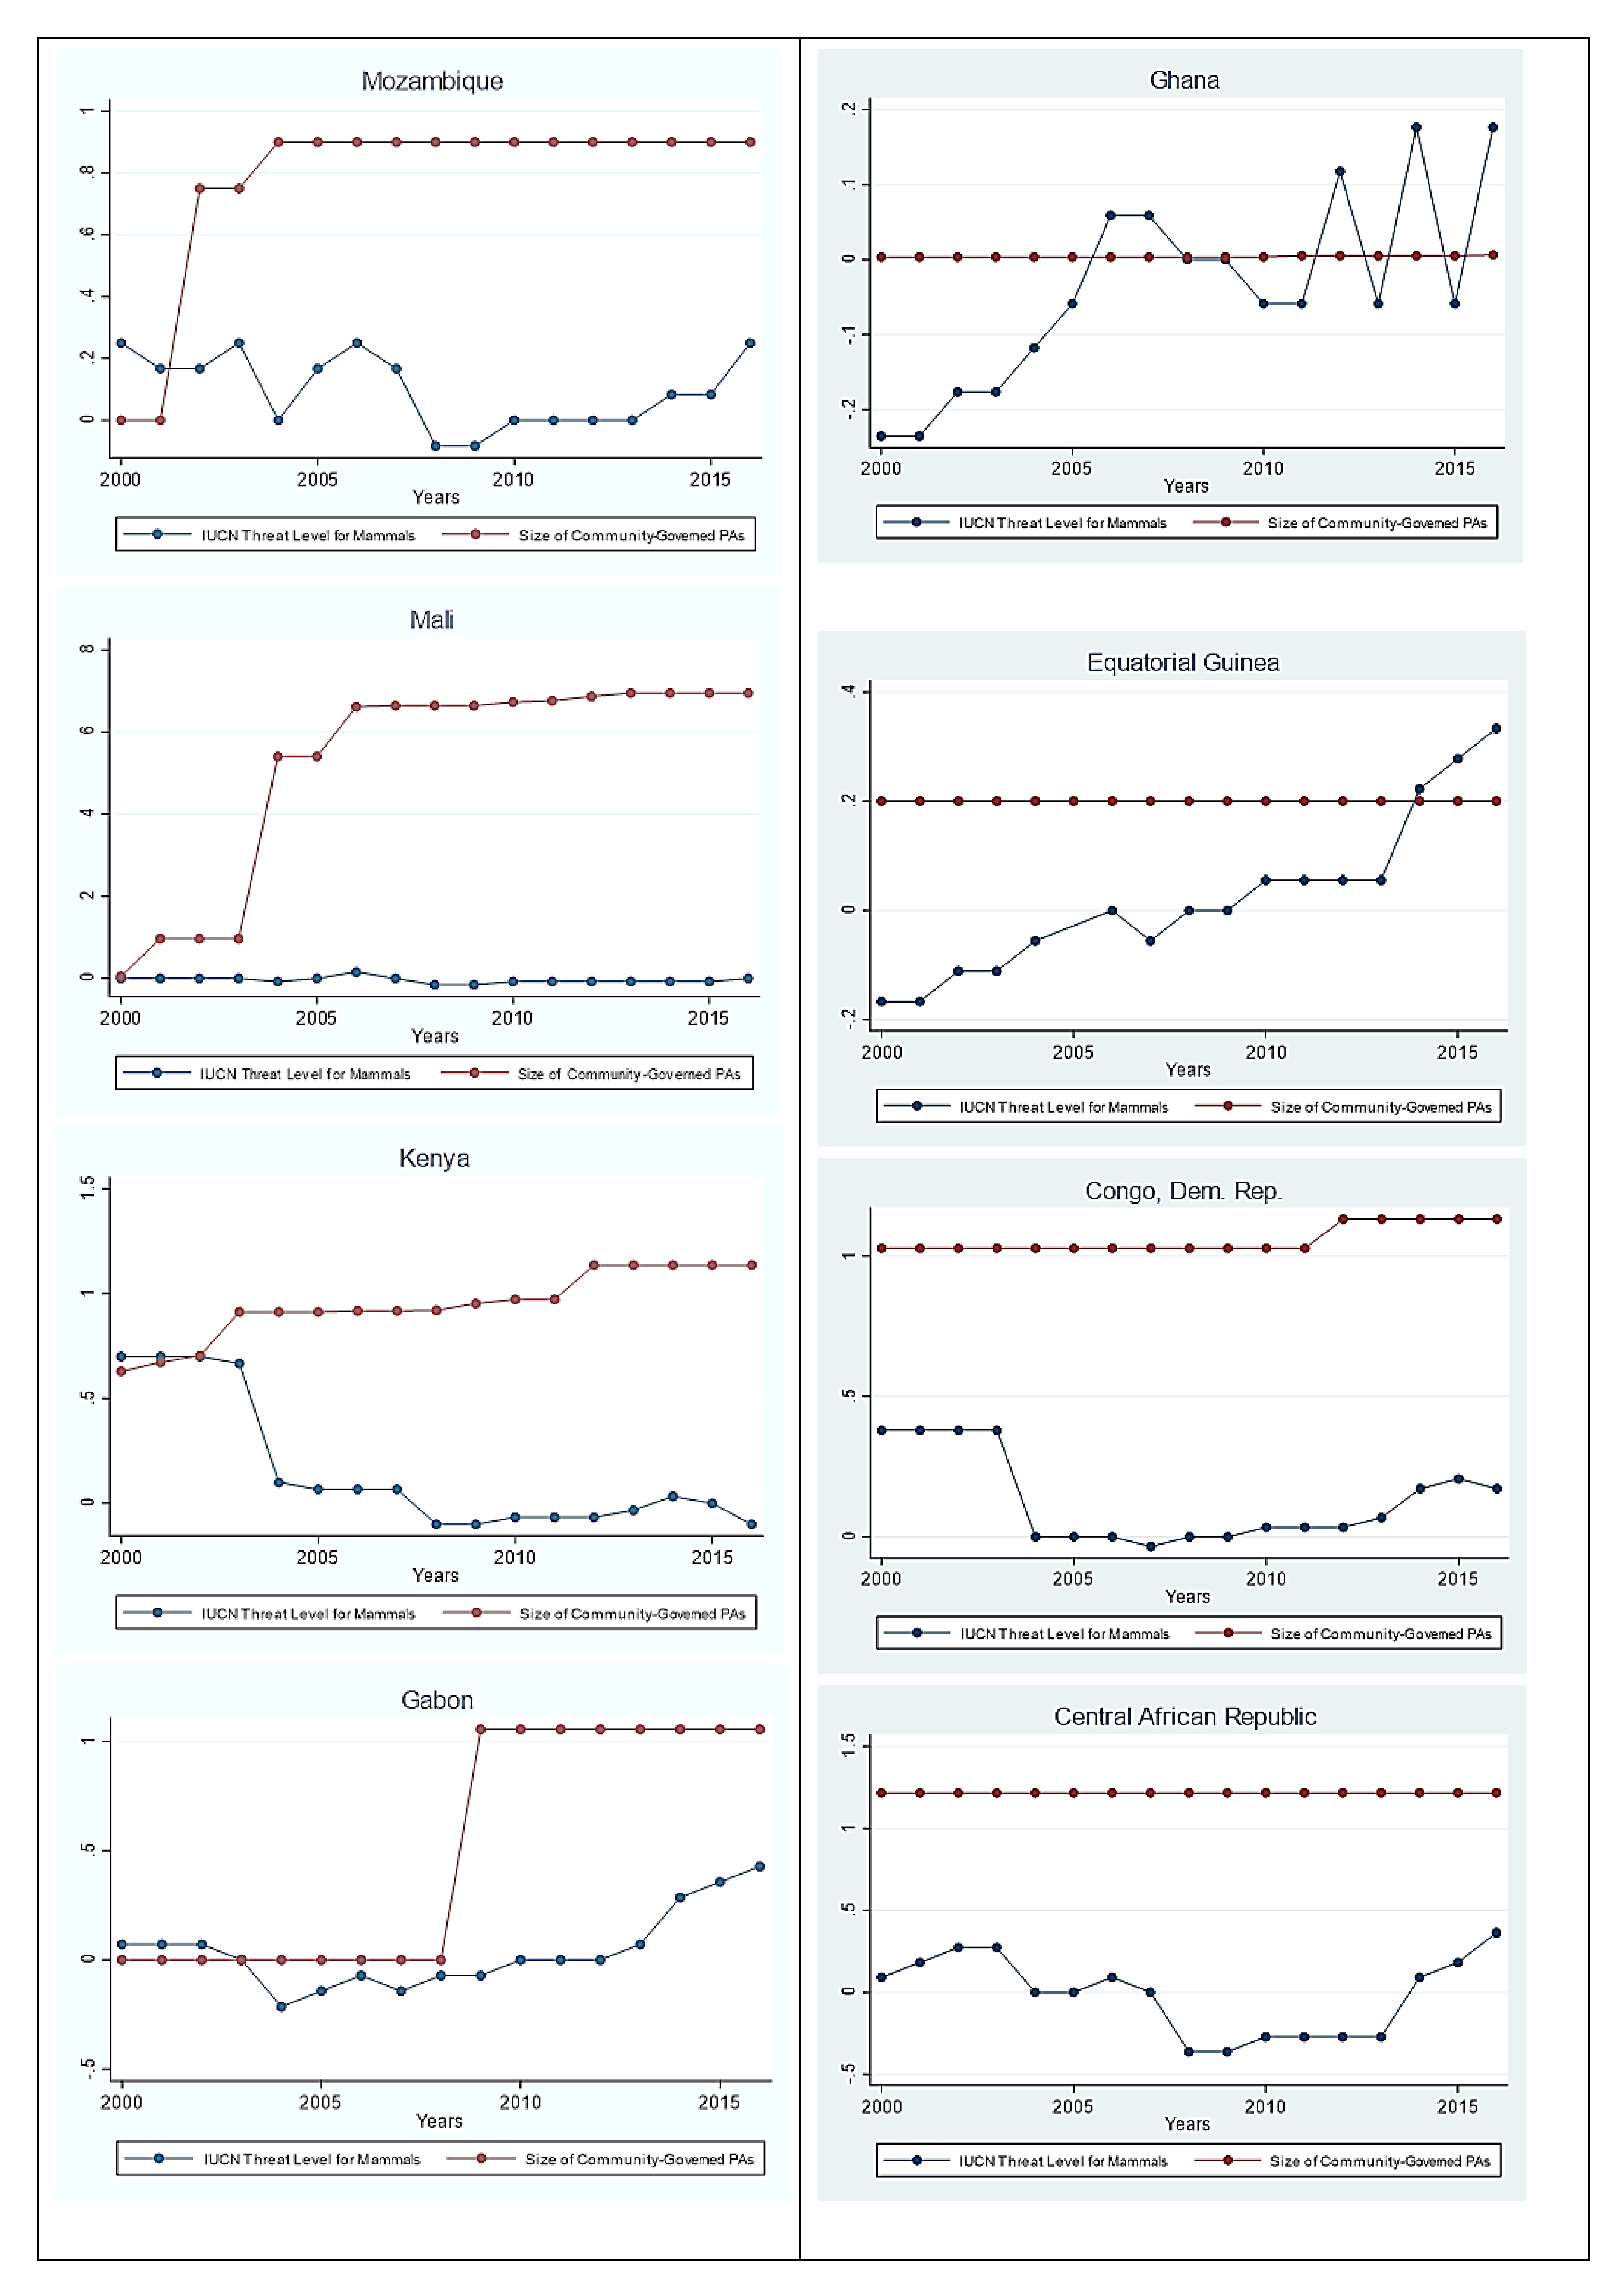
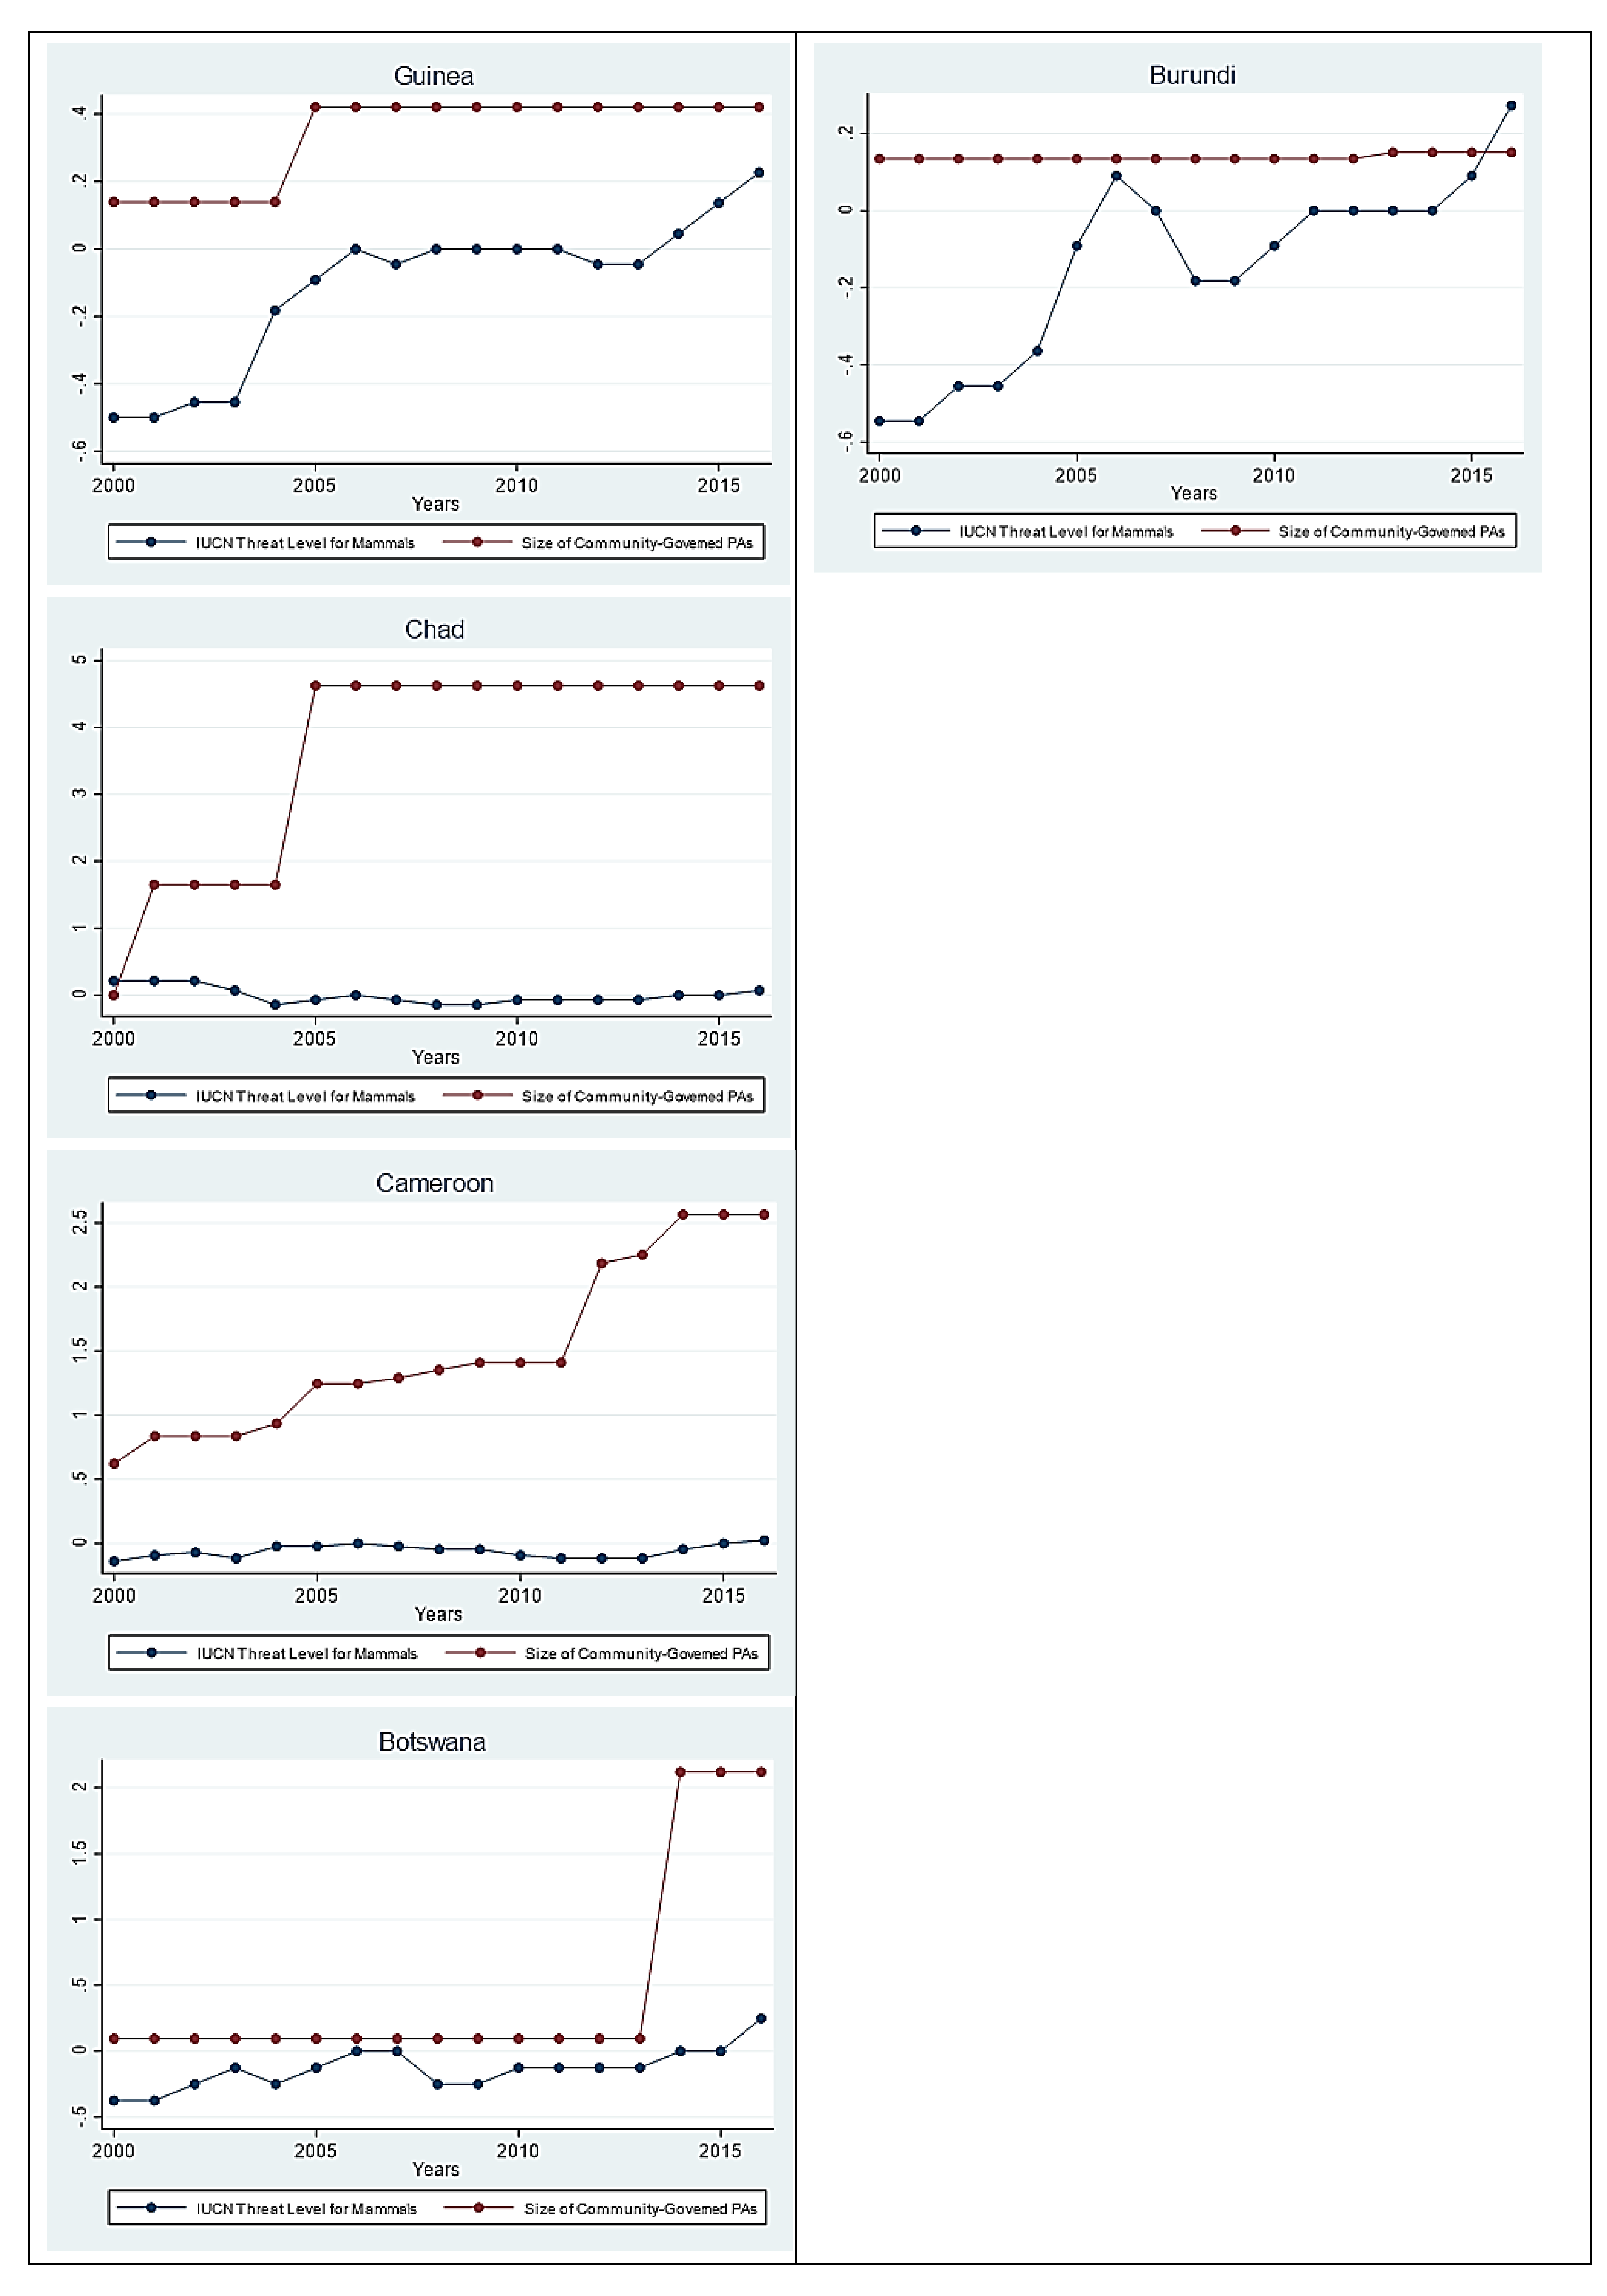
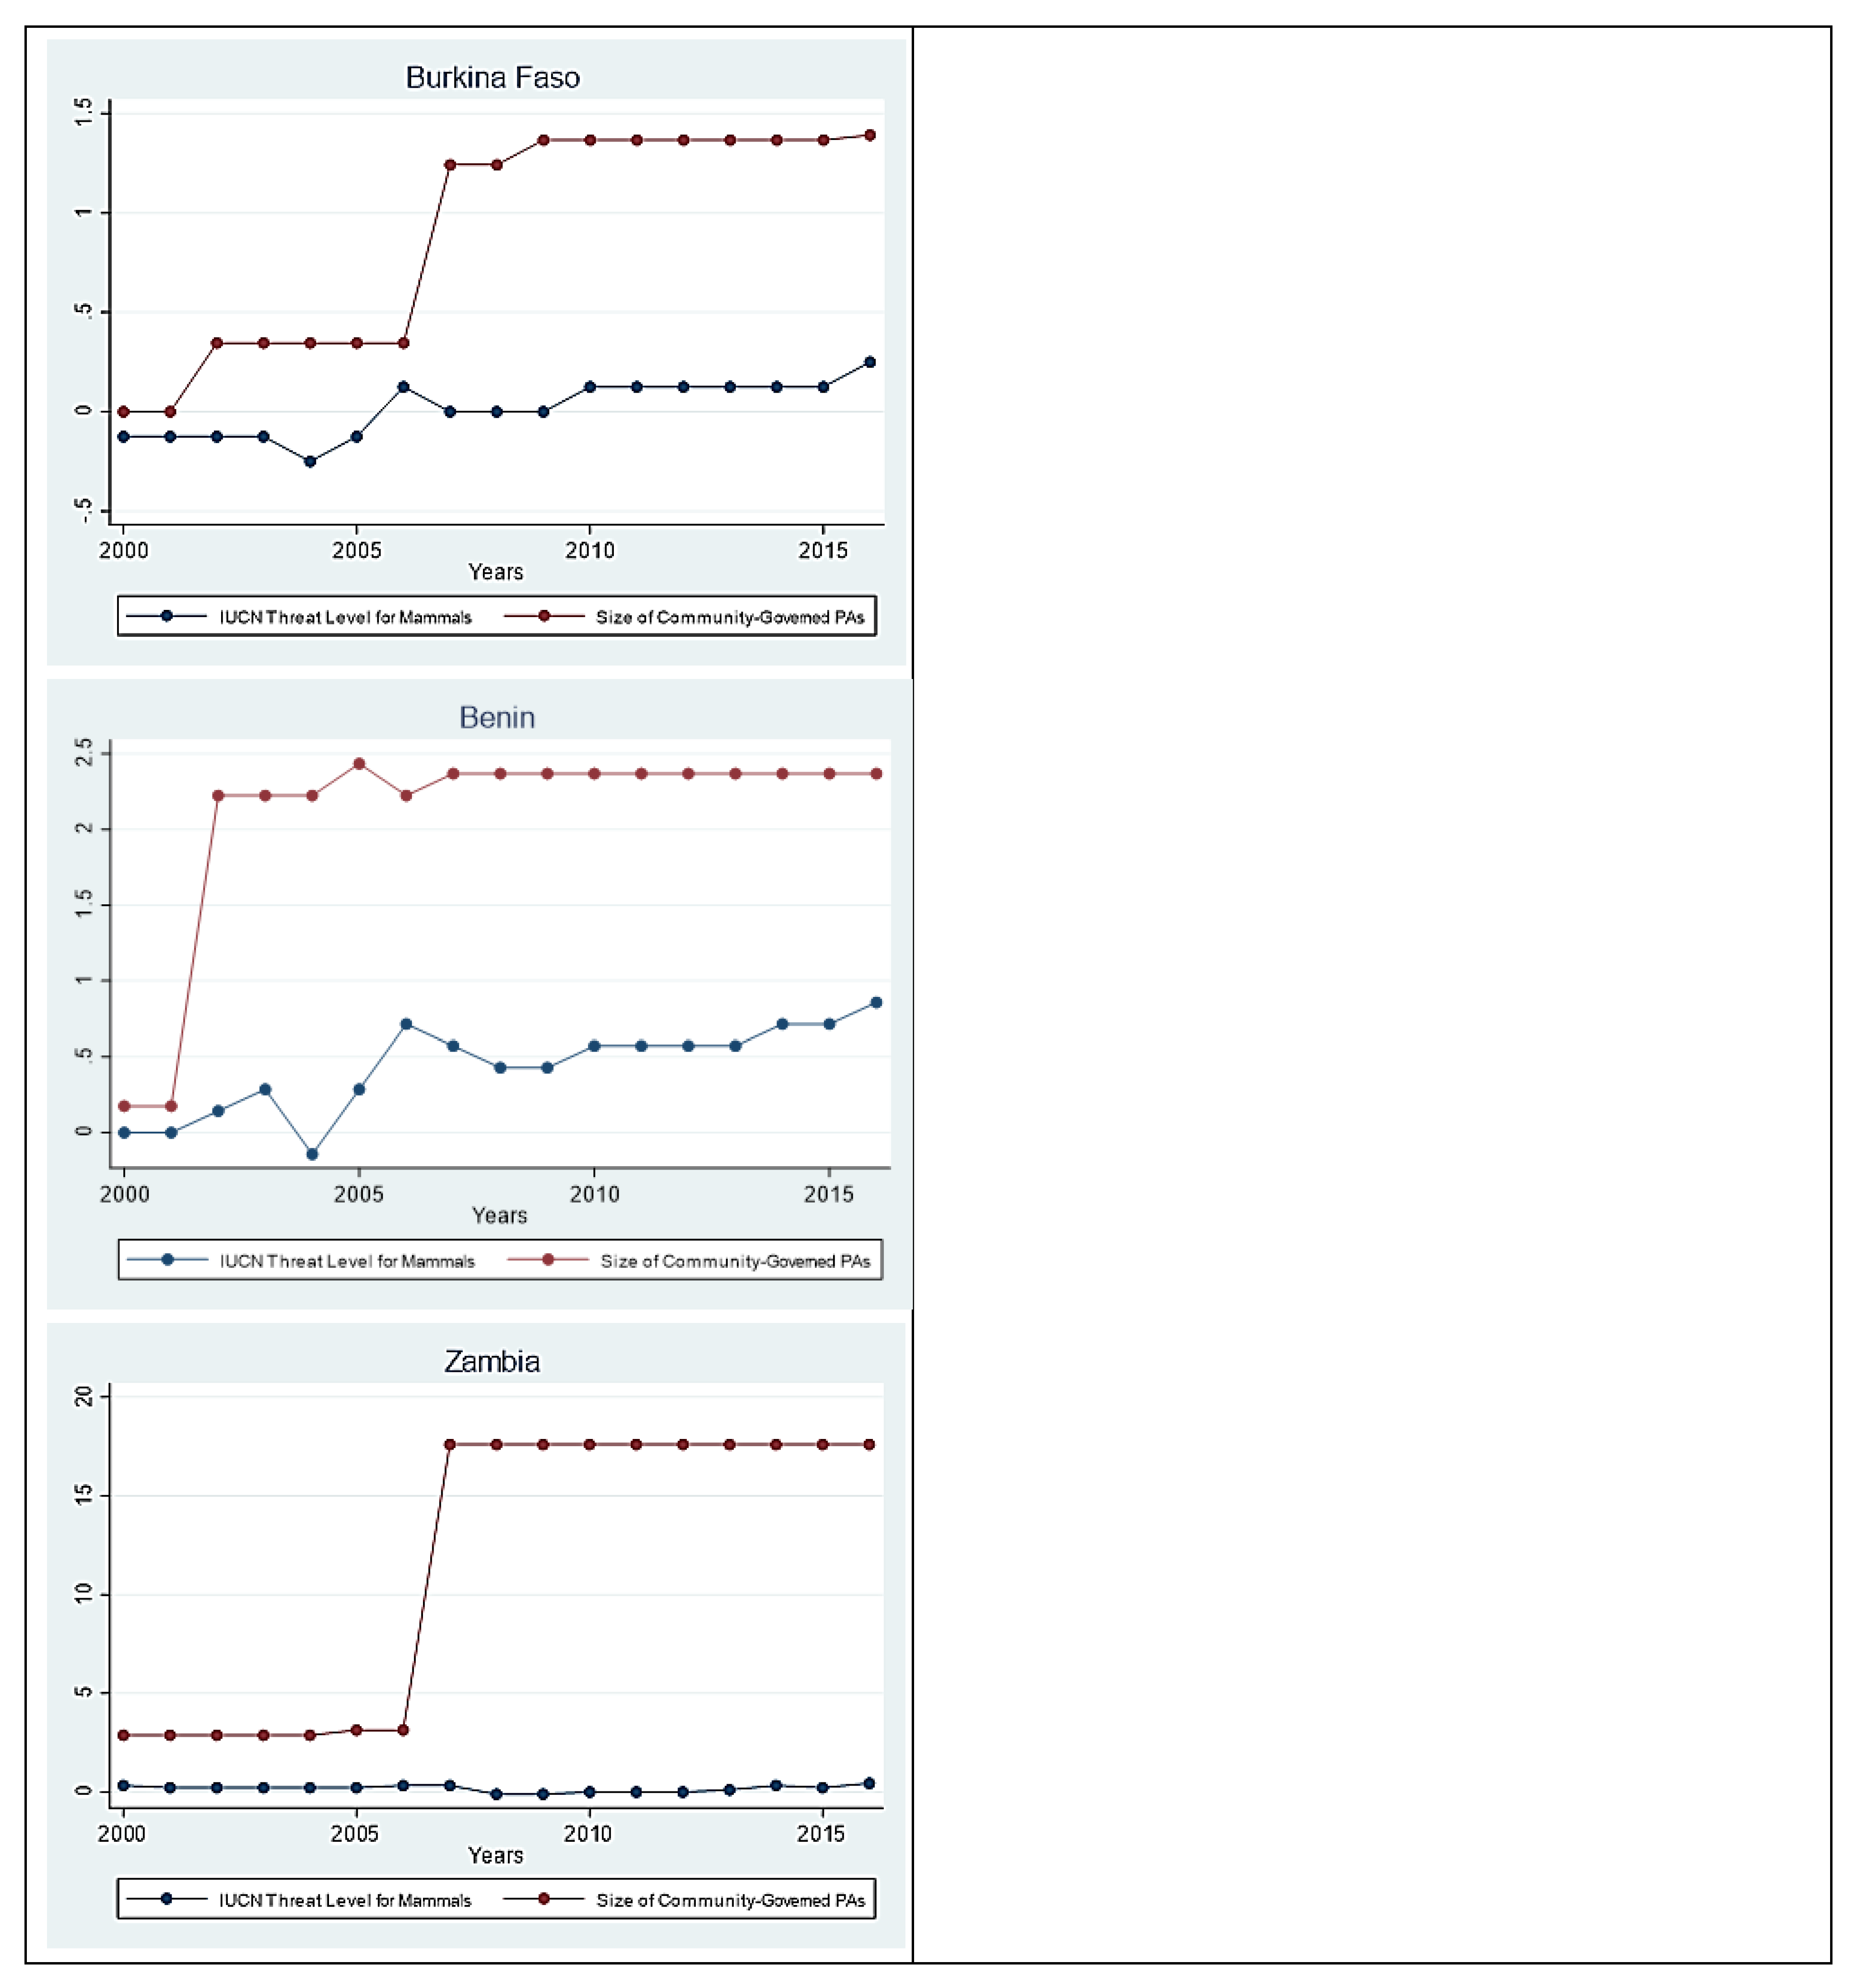
Figure 2 we graphically examine the effect of the treatment countries compared to their synthetic controls’ counterparts. While using DID method, we normally assume that the effects of unobserved confounders are constant over time, the synthetic control method allows for these effects to change over time, by re-weighting the control group so that it has similar pre-program characteristics to the treated group. The observed outcome can be written as the sum of the treatment effect and the treatment-free potential outcomes such that:
where
represents the time-fixed effect,
represents a vector of time-invariant predictors coupled with time-varying coefficient,
θt, represents a vector of time-invariant unobserved predictor variables with time-varying coefficient
, variable
is an indicator that takes the value 1 for the treated unit after T
0 and is 0 otherwise, and the
represents the unobserved transitory shocks. The SCM generalizes the DID method under the assumption of linear relationship between the outcome and the predictors by allowing the effect of
of the unobserved predictors
to vary over time unlike typical DID methods that constrain such effects to be constant.
3.4. Alternate Ordinary Least Square (OLS) Fixed Effect Method
To check the robustness of the effect of PAs governance on the proportion of threatened mammals and birds, we also use OLS fixed effect multiple regression method. It is well documented that in using cross-country data, country fixed effect helps us loosen up the assumption of commonality across countries by estimating a separate constant for each country [
78,
79]. We also additionally control for specific time-trends using the year-fixed effect. To capture the inclusion of local communities in protected areas’ governance, we use the IUCN World Database on Protected Areas (WDPA) to measure community-governed PAs and state-governed PAs for a panel of Sub-Saharan African Countries over the period 2000–2016. In doing so, we divide total protected areas into three types: state-strictly-governed, community-governed, and protected areas-not-reported. Since habitat size may directly affect biodiversity as suggested by previous studies e.g., [
17] etc., we use the size of PAs governed strictly by state and PAs-not-reported as control variables to isolate the only variation in the size of community-governed PAs.
We adopt the following model to estimate the effect of PAs governance on the IUCN threat level.
where
The threat rate is calculated as the percentage change in the number of X (taxonomic group, e.g., mammals and birds) compared to base year 2000 in country i in year t. The threshold is 0 which means that if a country’s endangered mammals population remains the same, it is the least good indication. The negative sign of threat signifies the country’s good performance towards biodiversity conservation.
Variables CG, SG and NR in Equation (4) represent a country’s PAs governance by community, state and “governance-not-reported” respectively measured as cumulative size (in km2). The log of GDP per capita represents the income per capita in country i in year t. Variables TE is the gross value of trophy exports from country i in year t, FR is the forest areas as a percent of total land area in country i in year t, RL and PS are a country’s score on rule of law and political stability respectively measured in units of standard deviations (−2.5 to 2.5) in year t. Country fixed-effect and year fixed effects are represented by Ci and Yt while εit is the error term clustered at country level.
5. Discussion
Since any decrease in the threat level below threshold is considered substantially important for a country’s performance towards conservation of endangered species, the overall magnitude of these results is crucial for sustainable development. Two important implications can be derived from our findings:
First, in spite of the differences in legislations in different Sub-Saharan countries, governance of protected areas matters. Consistent with earlier country specific studies, we find variation in the biodiversity conservation outcomes of PAs attributable to differences in the governance types of protected areas. Two main reasons can be associated with this difference in aggregate trend. First, the level of threat to species depends on the compliance of the community with conservation policies of governments. Previous studies have documented an increase in endangerment of mammals in countries with relatively centralized management and governance structures [
51,
52,
53,
54]. The positive coefficient of variable state-governed PAs in
Table 4 also shows the potential drawback of strictly state-governed PAs for mammal’s conservation. In cases, where PAs are strictly governed by states, communities often do not cooperate with state authorities due to the perception that they are excluded from exploiting natural resources. The closer the livelihood attachment with the resources in the PAs is, the stronger would be the level of community-resistance. State-governed PAs do not achieve conservation goals due to the conflict with local people. Conservation of endangered species needs a holistic approach in which local people play a key role in protecting the resource. State machinery is not capable of safeguarding a large biodiversity hotspot, which is surrounded by people whose activities directly and indirectly affect the wildlife. For example, mammals are more vulnerable to illegal activities, such as poaching and illegal hunting in areas where community compliance with conservation strategies is low. A recent study on conflicts between local people and government managers of protected areas in Kogyae Strict Nature Reserve (KSNR) in Ghana reveals that imposition of conservation policies without effective participation of local people forced them to increase illegal activities, such as hunting and encroachment, resulting in uncontrolled conflicts in the KSNR [
82]
. Second, community-compliance also depends on the nature of the good that is conserved. For a common good that carries potential economic incentive, communities tend to conserve if they are given the authority, responsibility, and control over related financial benefits. In community-governed PAs, generally, the governments and international organizations agree on the distribution of the share of the economic benefits generated as a result of activities within or around PAs to the local community. In Sub-Saharan Africa, mammals are the most dominant source of revenues for the community (if given their fair share), such as in the trophy hunting industry.
Secondly, since the type of bottom-up approach to governing protected areas in each country differs, therefore, it is important to understand the existence of matches and mismatches between national and global priorities by looking into each country’s legislation. According to recent studies on Natura 2000, the World’s highly coordinated network of protected areas in Europe, substantial mismatches are observed between protected areas’ management system of member country and regional conservation plans [
83,
84,
85]. The national conservation priorities in Sub-Saharan African countries can be more complex given the fact that economic incentives are the most important driver for local people near protected areas. While it is difficult to assess governance with each protected area covered in this study, we provide an account of legislative differences in some of the Sub-Saharan countries related to conservation of biodiversity [
86]
In South Africa, the National Environmental Management Protected Areas Act (2003) is in place to regulate protected areas. More specifically, the National Parks Act (1976) remains in force, addressing matters related to national parks. The existing legislation does not include any specific statement regarding wildlife ownership; however, the Protected Areas Act sets out a “protected area system” and provides for consultation and public participation that requires consultation of local authorities with lawful occupiers of lands. Under this act, “the management authority may enter into an agreement with another organ of state, local community, individual or other party for the co-management of the area by the parties or the regulation of human activities that affect the environment in the area” [
86] (p. 73). Such agreements may be intended to delegate powers, share benefits, use biological resources, develop local management capacity and knowledge exchange. In Tanzania, the main piece of legislation regarding conservation is the Wildlife Conservation Act 2009. The Act includes emphasize on public participation and the involvement of traditional communities as well as of the private sector (Section 5) in key decisions related to conservation such as practiced in the Ngorongoro Conservation Area. For hunting of game animals or protected animals, the act requires a permit for the sustainable utilization of wildlife [
86] (p. 76). In Zimbabwe, the main legal framework related to conservation is the Environmental Management Act (Cap. 20:27). Contrary to the emerging trend in other countries that involve local communities in natural resource management, one provision of the Environmental Management Act in Zimbabwe allows the President to set aside areas of “communal land” for environmental purposes, including “conservation or improvement of natural resources”, without providing for any consultation. In Botswana, the principal legislation related to conservation is the Wildlife Conservation and National Parks Act 1992 under which numerous regulations have been adopted. Section 83 of the Wildlife Conservation and National Parks Act grants the ownership of wild animals to the owner of land on which animals are kept or confined within a game-proof fence. The conservation planning is mostly done at the protected areas level where specific regulations may be adopted. Under the Wildlife Conservation and National Parks Act, different types of licenses are introduced such as “bird licenses”, “single game licenses”, “small game licenses” and “special game licenses” (secs. 26–38). In Namibia, the Environmental Management Act 2007 provides a legislative framework for conservation and natural resource management. The amended Nature Conservation Ordinance 1996 is a basic piece of legislation providing for the establishment of “nature conservancies” specifically for the involvement of local communities in wildlife management. Some provisions of the Forest Act, enacted in 2001, govern community-based forest management and declares the “living organisms” found in forests as a “forest produce”. Under the Wildlife Ordinance of 1996, which provides mechanism for management conserved areas, any group of persons residing on communal land may be recognized as the “conservancy committee” of the area. To do so, the committee must be representative of the community residing in the area, the constitution of the committee must provide for the sustainable management of game and the committee “must have the ability to manage funds and has an appropriate method for the equitable distribution, to members of the community, of benefits derived from the consumptive and non-consumptive use of game in such area” [
86] (p. 22).
To sum up, there is a wide variety of legislative features ranging from the conservation of biodiversity and specific endangered species and their habitats, to hunting tourism in response to the needs and respect of the traditions of local populations in Sub-Saharan African countries. A more adequate evaluation of legal frameworks should involve consideration of many other factors, such as overall government objectives and their degree of implementation within specific protected areas (e.g., the degree of decentralization), existing administrative practices at various territorial levels and their effectiveness, experience in the implementation of existing legislation (e.g., provisions which have remained dead letter, procedures which are bypassed in practice), local customs, public perception of the role of law and authority, economic and social needs. This type of detail analysis is obviously not possible for all countries.
The flagship Communal Areas Management Programme for Indigenous Resources (CAMPFIRE) in Zimbabwe is the best example to explain how community involvement in PAs management positively affects conservation outcomes. To establish this link between local community, income and mammal’s conservation, Taylor [
44] documents that between 1989 and 2006, the CAMPFIRE income from high valued safari hunting amounted to nearly US
$30 million of which 52% were allocated to sub-districts wards and villages for community projects and household benefits. The same study finds significant positive trend in mammals’ conservation including elephants and buffalos’ populations. A number of other studies have documented the positive effect of devolving responsibility, authority, and accountability of natural resource management on the attitude of local people towards conservation [
23,
31,
45,
52,
82,
87].
We also find no effect of community-governed PAs on the IUCN Red List threat to birds. This no-effect has interesting implications. First, as expected, the community does not respond to the conservation of birds due to the lack of potential economic incentives as compared to cases for mammals. Second, there might be an increasing threat to bird species due to increased community involvement. Other unobserved factors, such as pollution or other human factors, might also cause extinction of birds from PAs.
A widely recognized area of revenue generation in Sub-Saharan Africa is the community-based trophy hunting industry which has been promoted as an effective strategy for conservation of endangered animals since the 1980s [
10,
12,
23,
37,
38,
39,
40,
52,
88]. One argument is that the income from trophy hunting activities can empower local communities to protect biodiversity through employment of more anti-poaching rangers. If revenue cannot be generated from trophy hunting, the communities might transform the natural habitats to other forms of land use that provide higher returns on investment compared to conservation but will have negative impacts on biodiversity. Moreover, trophy hunting also generates revenue in areas, which are not suitable for tourism including countries facing political instability and adverse geographic conditions. According to Lindsey [
23], a minimum of 1,394,000 km
2 is used for trophy hunting in Sub-Saharan Africa, which is larger than the area occupied by national parks. In 2006, trophy hunting was practiced in 23 Sub-Saharan African countries with an estimate of USD 201 million per year gross revenues compared to USD 33–39 million dollars in Eurasia [
89].
Most of the successful cases of these programs reflect a significantly positive effect on the livelihood of the local community along with conservation outcomes. For example, Di Minin [
89] argues that hunting in Sub-Saharan African has strongly contributed to the conservation efforts in those conservancies of important terrestrial biodiversity where trophy hunting is practiced (
Table 5). Studies also cite trophy hunting as a key component of community-based conservation in Sub-Saharan countries [
23]. In parts of Zambia, Botswana, Namibia, Tanzania and Zimbabwe, improvement in conservation attitude among local communities has resulted in increasing revenues from trophy hunting. In addition, in these countries, communities are increasingly involved in community-based natural resource management programs and attempt to include their lands in wildlife management projects [
10,
29]. Similarly, in Namibia, revenues from trophy hunting are considered a primary stimulus for development of wildlife conservancies on more than 70,000 km
2 of communally owned areas [
9]. Further, in Tanzania, incentives from trophy hunting have resulted into the creation of Wildlife Management Areas where sustainable wildlife utilization is the primary land use [
23].
The inference we draw from our findings in this context is subject to the assumption that WDPA dataset does not have significant reporting or measurement errors. As we know WDPA data is compiled through surveys by different government agencies, there is possibility of misreporting or erroneous reporting of the types of data representing each protected area. While econometric models we apply largely overcome such measurement errors, we still suggest readers to refer to the caveats and limitations of WDPA datasets provided in
Section 7.
6. Conclusions
Community-governed PAs can be used as an effective conservation policy that enables countries to achieve biodiversity conservation outcomes not at the cost of social exclusion. In this paper, we provide empirical support for the argument that decentralization and devolving the authority, responsibility and accountability of natural resource management help reduce threat to biodiversity. More specifically, we adopted three different methods to test our hypothesis that community-governed PAs do better than strictly state-governed PAs in terms of biodiversity conservation.
Following the generalized DID approach, we find that on average, countries with a significant increase in cumulative size of community-governed PAs are likely to decreases the IUCN threat to mammals by nearly 17% as compared to those countries where community-governed PAs size is less than half of the total PAs. Our synthetic control methods and OLS panel fixed effect results support the hypothesis that increasing the size of community-governed PAs is likely to reduce the IUCN Threat to mammals. On the other hand, the effect of community-governed PAs on the threat to birds is rather positive but not statistically significant, indicating no effect of governance type on the threatened birds’ population in Sub-Saharan African countries. In addition, increasing the size of state-governed PAs does not do better for conservation. Our analysis of 32 Sub-Saharan countries shows no effect of state-governed PAs on the IUCN Red List threat to mammals and birds indicating less effectiveness of strictly state-governed PAs compared to community-governed PAs. In spite of the significant effect in countries with larger size of community-governed protected, we acknowledge the difference between national conservation policies and regional plans. We provide a brief description of the legislative frameworks within Sub-Saharan African countries and identify specific regulations related to conservation of biodiversity. We, therefore, conclude that establishment of PAs does help achieve biodiversity conservation outcomes if such efforts do not exclude communities that heavily depend on the natural resources in and around biodiversity hotspots. Addressing social concerns of communities at risk with more innovative approaches, such as stakeholder analysis, and simulation models, can ameliorate the potential conflict between state authorities and local people [
90].
Our results suggest that more inclusive governance that devolves authority, responsibility, and accountability of natural resource management (particularly in PAs) to the local communities can address the challenge of conservation as well poverty by giving fair share of the benefits to local people. However, government of protected areas at local level in each of Sub-Saharan countries needs to be in line with national legislations and regional conservation plans to achieve sustainable outcomes. Merely establishment of strictly state-governed PAs might negatively affect the conservation objectives if local communities are excluded from the benefits of natural resources in designated areas.
In a broader context, sustainable development that achieves social and environmental (biodiversity) objectives is possible through inclusion of local communities in environment decision making particularly in developing countries.
7. Limitations and Future Research Directions
This study is subject to some limitations that should be considered while interpreting the findings. First, the biodiversity measure adopted in this study is the IUCN Red List of threatened mammals and birds. There is another genesis of species, such as amphibians, which are also important in defining the overall status of biodiversity. Thus, our results are only limited to mammals and birds identified as threatened from 2000 to 2016. Taking into consideration all species in measuring biodiversity might be more comprehensive in analyzing the effectiveness of PAs governance.
Secondly, despite the usefulness of WDPA datasets for categorizing and classifying protected areas, it is important to point out certain limitations while using WDPA database. In this context, we provide a careful assessment as to what extent WDPA data could be utilized for analytical purposes and how it can be improved for future analyses. The WDPA database informs about the key indicators that allow governments and international organizations to track progress toward area-based conservation targets. The primary sources of data in the WDPA continues to be government organizations and departments responsible for conservation of biodiversity in identified regions. Therefore, either deliberate or unintended flaws are possible on part of agencies that report the data about the status or governance-type of conservation areas. We acknowledge this potential gap that might exist in the countries’ national statistics and hence, adopt a more conservative approach in using the datasets. We also note that where there are known gaps in official national data, these gaps are filled by experts working individually or through affiliations with non-governmental organizations, institutions and more [
91]. Considering the governance type, our key variable, it is important to understand the construct validity of this variable. The key concepts of IUCN governance category include, participation, innovation, benefits sharing, respect and informed approval of the stakeholders. According to IUCN, the purpose of creating this variable is to measure the extent to which full and effective participation of relevant stakeholders including local peoples is ensured, and the proportion of benefits shared equitably [
26]. The variation we find in the cumulative size of protected areas differenced by governance types ensures that the WDPA as a whole is ideal only for global analyses, though some parts of it may be well suited to regional or national analyses. We acknowledge this inconsistency in using WDPA for analysis as they can impact upon results. Moreover, our model that accounts for country-specific characteristics and time trend within each country allows us to draw inference about the variation in governance types and its impact on the IUCN red list. We suggest that in order to improve the WDPA datasets for future research purposes, country specific profile of protected areas should be ranked through a standard index that is consistent and applicable on all types of protected areas. This type of index must ensure the internal and external validity of the measurement of governance type rather than merely classifying the governance-type subjectively. In addition, separation of set of countries with different reporting standards for protected areas is also desirable to allow for more robustness checks of the impact of inclusiveness on conservation outcomes.
Thirdly, our sample is composed of 32 Sub-Saharan African countries for which the data on all variables was available. Our results only apply to countries in Sub-Saharan Africa or those that share similar socio-economic characteristics. Fourthly, we aggregate the types of governance of protected areas into three broad categories; community-governed, state-governed, and protected areas about which governance status is not reported. Our findings take a general classification of governance rather than each specific sub-classification of governance, such as partially-devolved governance, collaborative (joint) governance, or governance by private owners. PAs in Sub-Saharan Africa do not have identical enforcement authorities, e.g., the range of community involvement varies. A further analysis of each sub-type of governance might be useful in explaining the extent of conservation success in protected areas. Lastly, although the IUCN is the only organization around the world that records the data on PAs management and governance, there might still be PAs which are not designated yet contributing to the national statistics on the Red List. Our assumption is that if such PAs exist, they are normally distributed, and thus we rule out any systematic relationship with our estimates.


