Abstract
The purpose of this study was to illustrate and understand how consumers of cooperative food products could be segmented in the region of Western Greece. For this purpose, a questionnaire survey was undertaken involving almost 500 consumers in the selected region. Consumers were segmented on the basis of their consumption of cooperative products and in association with their attributes and beliefs regarding cooperatives’ products. Τhe performed cluster analysis grouped participants into four distinct groups with different characteristics and perceptions regarding cooperatives’ products. The consumer groups were called “skeptics”, “cooperative”, “passively sensitive”, and “indifferent”. According to the results, in general, participants considered cooperative food products as a safe choice with excellent value for money and contributing to the local society, economy, and sustainability. Segmentation could allow agricultural cooperatives to focus only on those segments of consumers that are willing to pay for cooperative products by allocating all available resources in serving them. The results of this research, even with its limitations, can help directors and marketing executives of agricultural cooperatives to better understand that operating in a specific market could be more effective when targeted at specific segments to help not only the viability of agricultural cooperatives but also their economic development and growth.
1. Introduction
Adding value, increasing incomes and cost reduction are goals shared by agricultural cooperatives and investor-owned firms [1]. However, agricultural cooperatives often fail to respond to market changes, endangering their economic results and viability [2] as a result of limited connection to the market [3] and response to consumers’ needs [4]. Meanwhile, they have to face wholesalers, intermediaries, retailers, and cutthroat competition by rival private food companies [5]. A market-oriented approach, such as the use of brand names, have been marshaled by agricultural cooperatives to facilitate their way into the competitive environment of the food sector, while their slow response to modern marketing techniques and their counting on (at least in the case for the Greek agricultural cooperatives) government protection and finance is holding back the procedure [2].
Nevertheless, some progress has been made since agricultural cooperative management realized that following traditional perceptions, such as the existence of a “typical” customer, can no longer be effective and profitable. To some extent, this “typical” customer no longer exists. Thus, businesses from all industry sectors use market segmentation in their marketing and strategic planning. For many, market segmentation is regarded as the panacea of modern marketing [6] since it helps businesses deal with heterogeneity by balancing the variability in customers’ needs with the limits of available resources. By focusing marketing efforts on certain segments, the effectiveness of limited resources can be increased. Thus, segmentation is fundamental to successful marketing strategies. If the product or service focuses on the segment’s preferences, then the competitive advantage could be multiplied [7].
Accordingly, it is crucial for agricultural cooperatives to develop marketing strategies that will ensure the successful promotion of their members’ products, particularly in highly competitive markets or markets in crisis, where product adjustment to the increasing consumer demands is imposed [8]. The strategy of market segmentation could allow agricultural cooperatives to identify and target appropriate market groups in order to gain a place in those markets [9,10]. Segmenting consumers by group size is a usual approach that is available for agricultural cooperatives. However, this a simplistic technique since there are more effective approaches that involve using other characteristics, such as business relationships [11] and demographics. While meeting customer needs is critical, the cooperative must also meet its own long-term needs to survive; therefore, it is essential for cooperatives to maintain relationships and market shares with the most profitable customers. Understanding cooperatives’ customer base and realizing that “one size cannot fit all” is essential for the long-term viability of agricultural cooperatives.
In general, there is a small amount of literature on market segmentation regarding products traded by agricultural cooperatives. Furthermore, despite the well-documented benefits that segmentation offers, agricultural cooperatives continue to encounter implementation difficulties, forcing them to seek the causes and possible solutions. The key to overcoming these barriers is that agricultural cooperatives must strive to identify and serve segments that can be profitable. By focusing on such segments, cooperatives could become more efficient, competitive, and subsequently profitable. Nevertheless, as far as we know, there has been no prior attempt to segment consumers of cooperative products in Greece. The goal of this study was to fill this gap given that segments other than customers’ group size could be proved helpful for planning, managing, and marketing Greek agricultural cooperatives’ products.
The present study was conducted in the region of Western Greece and the criteria used for clustering was based on the level of knowledge consumers had regarding cooperative products, the criteria directing their purchases, and consumers’ general opinions regarding cooperative products. The following objectives were established for our research: (a) to explore the categories of cooperative food products bought in Western Greece, (b) to explore the characteristics assigned to “cooperative products” in Western Greece, (c) to create segments of consumers based on these characteristics, (d) to compare the behavior of the consumer segments, (e) to profile these segments in terms of their dominant demographic characteristics, and (f) to provide directions for segmenting cooperative consumers. Finally, the segmentation procedure could allow cooperative managers to have a lucid view of different types of consumers and their motivations and experiences.
This paper is divided into five parts. The Section 2 deals with the Greek agricultural cooperatives and the food marketing strategies they can choose, the Section 3 presents the methodology followed, the Section 4 presents the results of the analysis conducted in this study, and the Section 5 concludes this work.
2. Theoretical Background
2.1. Greek Agricultural Cooperatives
The agri-food sector is considered to be of particular importance for the Greek economy, as it is linked with Greece’s traditional productive sectors, such as agriculture, livestock farming, and fisheries. The food sector in Greece, as a part of the agri-food chain, is dominated by small-sized businesses that are not particularly organized and have limited investment in research and technology. Such businesses are mainly locally active and primarily use domestic raw materials for their products. The contribution of agricultural cooperatives to the food sector is relatively small (approximately 8% of the total businesses). These businesses trade products such as cheese, milk, fresh fruits, and olive oil, covering primary and vital consumer needs [12,13].
Of particular importance is that Greek agricultural cooperatives can play an important role since they can improve the social and financial situations of both their members and the local communities in which they operate and develop their business activities [14]. Cooperatives can strengthen farmers’ bargaining power, constitute an important driver of rural development, and substantially contribute to the financial viability of rural areas, especially in the less favored regions of Greece [15].
Although agricultural cooperatives in Greece hold large market shares in certain industries, such as olive oil, table olives, wine, and dairy products, in total, they create limited added value for their members, namely, farmers [16]. Even if there are examples of agricultural cooperatives that have successfully developed strong brand names, as a rule, cooperatives in Greece face significant financial problems and structural weaknesses that existed before the economic crisis that occurred during 2008–2018 [17]. Furthermore, Greek agricultural cooperatives focus on production rather than marketing [18].
In the same vein, the development of individual trademarks by each agricultural cooperative, which is often combined with the implementation of quality systems, forces cooperatives to invest in individual brand names to which only small quantities of products correspond, thus leading to high costs being incurred for their reputation [17]. The high reputation cost, combined with the fragmentation of product quantities in the market and the multitude of available trademarks (e.g., in the olive oil market), prevent the creation of strong trademarks. Because strong trademarks, coupled with suitable supply chains, enable higher added value to be created and higher revenue for cooperative members to be generated, it is of particular importance that the cooperatives plan more effective marketing strategies. A strategy that aims toward covering the customers’ needs better than competitors are able to can be substantially facilitated by understanding consumers’ perceptions regarding cooperative products.
This tendency has also rendered agricultural cooperatives in Greece extremely vulnerable [3] and unable to respond to rapid market changes [19]. The implementation of commercial strategies is, in general, weak and cooperative food products are less differentiated than those of large private food firms [20,21].
2.2. Marketing Strategies for Agricultural Cooperatives
Many Greek food products are marketed under producer-owned brand names that reflect qualitative characteristics that are linked with certain geographic regions (e.g., PDO—protected designation of origin, PGI—protected geographical indication) following a strategy that is focused on targeted market segments. However, the small size of agricultural holdings, the low production capacity and their geographical dispersion, farmers’ low professional capabilities, inadequate commercial and business education, and delayed technology adoption result in low competitiveness and loss of commercial opportunities [20]. Due to the specificities of Greek production, the most appropriate marketing strategy to be followed is the differentiation and focus strategy on specific market segments [22]. These strategies are implemented to a relatively small extent [16,20]. Thus, commercial opportunities are not fully exploited such that consumers substitute agricultural cooperative products with conventional ones available in the market.
Similarly, the existence of a large number of trademarks in agricultural cooperatives is positively related to the implementation of quality systems, where it is considered that trademarks drive firms to invest more into their name and reputation [10]. These weaknesses lead to the fragmentation of product quantities in the market, in conjunction with the multitude of available trademarks (e.g., in the olive oil market), which prevents the creation of strong trademarks. Strong trademarks, coupled with suitable supply chains, could provide a higher added value to the products and increased revenue to members of the cooperatives. There is an undisputed need for cooperatives to plan their marketing strategy and market orientation.
Market orientation reflects a firm’s tendency to accept that the best way to achieve its business goals is to satisfy its customers more effectively and efficiently than its competitors. Such a strategy should initially explore consumers’ perceptions regarding cooperative products and their characteristics [23].
2.3. Factors Affecting the Purchase of Cooperative Products
Research findings highlight consumers’ interest in products of agricultural cooperatives and collective initiatives, as well as in products sold by farmers. The interest can be viewed as a positive attitude or as a preference toward food sold by cooperatives and collective initiatives or toward products directly sold by farmers. Undoubtedly, consumers purchase products that will enable them to satisfy their needs. However, the purchase is linked to perceptions they have regarding the product and whether this reflects their personal values and beliefs [24].
Apart from the abovementioned factors, consumers’ buying interests also depend on their geographic, demographic, psychographic, and behavioral characteristics. More precisely, consumers perceive cooperative products as being less processed and consider cooperatives an empowering force for the local economy, protecting both the farmers and the environment [25]. At the same time, consumers are willing to pay premium prices for ethically sourced products [26] and this interest in the ethical aspect of products is growing amongst consumers. For example, consumers are willing to pay more for a product that has Fairtrade labeling over unlabeled products [27]. In this way, the willingness to pay (WTP) for cooperative products is influenced by food quality and safety attributes, followed by price and availability [28,29]. Moreover, the influence of the perceived quality on the purchase of products in alternative food networks in Italy showed that families with children tend to purchase more such products due to their nutritional attributes [30]. In addition to quality, food choices are affected positively by the educational level of the consumers i.e., in the case of the Italian alternative food networks [31] or local honey in Serbia [32].
In the same direction, consumers in New Zealand are willing to pay more for local products that come directly from farmers or a farmers’ market [33]. This behavior is common to consumers over 50 years old with a higher household income; whereas the intention to purchase is more intense in the 30–49 age group, as they value more localness. Likewise, consumers in South Carolina are willing to pay an approximately 27% premium to purchase locally grown products [34]. Thus, these results suggest a positive relation between WTP age and WTP income, and females are more likely to purchase animal products produced locally than males. A similar study [35] supported both the point that older consumers with a higher income [33] and mainly females [34] are willing to pay more for such products.
There are studies that endorse the superior taste and other organoleptic characteristics as the factor that primarily affects an individual’s choice. Quality and taste appear to be the main drivers for purchasing local products, along with the contribution to the local economy [36]. The freshness of the agricultural products, the variety offered, and the health attributes can also affect consumers in farmers’ markets [37]. Furthermore, extrinsic characteristics, such as packaging, could influence consumers’ decisions [38].
Similarly, nutritional labeling could be a significant factor affecting customer preferences, which can, in turn, affect both the taste and price expectations of a consumer [39]. The significance of labeling to food purchases is attributed to the fact that it can reflect the quality and ethical aspects surrounding the product [40]. Furthermore, a positive image is conveyed to consumers through sustainability and quality cues displayed on the labels. By providing this information successfully to the audience, labeling contributes to consumer decision-making; thus, in the long run, leading to market efficiency [41].
Another characteristic that affects consumers’ choices is the place of their residence. In this regard, farmers’ market shoppers are more likely to reside in urban areas, while rural consumers should prefer to purchase directly from farmers [36]. These results are supported also by different studies [42,43,44]. In addition, there are different motives pushing urban and rural consumers to buy agricultural products directly from farmers. Research in Indonesia showed that even if the quality of local products was considered superior across the respondent sample, consumers in urban areas considered that issues related to food safety and contribution to the local economy as being more important than individuals in rural areas [45]. On the other hand, the main factor hindering purchase is the price, often preventing the purchase of local products directly from farmers [27]. It should also be remembered that for the majority of buyers, price is a key determinant of purchasing decisions [46]. Thus, the high prices of local food sold by short-supply food chains could be an inhibitor to consumers’ purchases.
Focusing on the food products that are traded by the agricultural cooperatives, it should be noted that there is a positive attitude of European consumers toward agricultural cooperatives and their products; however, this is negatively related to the existing level of knowledge regarding cooperatives [47]. The same positive attitude was also observed in Canada, as Albertan consumers were aware and positively inclined toward cooperative products due to their attributes [48]. Therefore, it could be stated that consumers of cooperative products are highly educated individuals, of a broader age scale, who are mainly driven by convenience [49].
Nevertheless, consumers may have a positive attitude toward cooperative products but they may not portray that behavior when purchasing food products due to the attitude–behavior gap [50]. In general, consumers can be classified into two groups based on the motivations and barriers they face when purchasing food products. Consumers who belong in the positive group, i.e., those that are keen on the examined food, appreciate their taste and quality, exhibit low barrier scores, and are willing to pay more compared to the negative group [51,52].
In summary, consumers must be aware of products with differentiated characteristics and their perception of such products must be favorable. Furthermore, they must be willing to pay premium prices to purchase these products. On the other hand, farmers and agricultural cooperatives must be aware of consumer preferences and offer the requested quantity at the appropriate price. It is therefore imperative to have knowledge of consumer segments prior to any decision regarding the marketing strategy to be followed.
3. Material and Methods
The primary aim of this study was to segment consumers of agricultural cooperatives’ products, which was pursued using an online questionnaire that was to consumers over 18 years old in the region of Western Greece. The survey involved 500 consumers throughout the region who were selected using the following simple criteria: (a) they made food purchases for their families and (b) they were willing to answer the questionnaire. Participants were selected by using the convenience sampling technique. Convenience sampling is a type of sampling where the first available primary data source will be used for the research without additional requirements. Thus, this sampling method involves finding participants who are conveniently available to participate in the study. The contact with the respondents was done outside local food stores, grocery markets, and supermarkets. Sometimes, convenience samples are highly vulnerable to selection bias and sampling error, making it difficult to generalize the research findings [53,54]. However, in many business studies, this method is applied in order to gain initial primary data regarding specific issues, such as the consumers’ perceptions regarding a particular brand or collecting opinions of customers in relation to their perspectives on the attributes of a product. The illustrative scope of this study fit this research methodology.
The respondents were asked different questions in order to reveal their purchasing behavior regarding food and cooperative food products that they buy and consume. The questionnaire was composed of three sections. In the first section, consumer behavior toward food was examined. The second section investigated consumer behavior regarding cooperative food, and in the third section, questions related to demographics were included.
Figure 1 illustrates the area that the study was conducted in, along with information related to the population of the region of Western Greece and the number of agricultural cooperatives in the area under consideration.
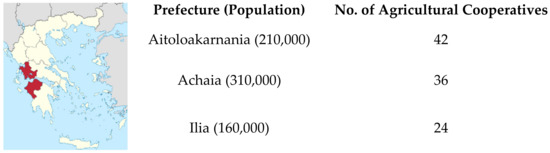
Figure 1.
The research study area.
Multi-item questions with a five-point Likert scale were included in the questionnaire and were related to the consumption frequency of cooperative products in the region of Western Greece, as well the properties attributed to them. Principal component analysis (PCA) with a varimax rotation was performed on these multi-item questions to reveal independent variables affecting the consumption of food products from agricultural cooperatives. The number of the extracted factors was based on the eigenvalue criterion, according to which, factors with eigenvalues greater than or equal to one were retained in the final model [55]. The PCA technique is used to reduce the number of individual items into a smaller number of factors or components; it has been used in many studies as a first step for revealing meaningful segments (see, for example, [56,57,58]). The grouping process is based on the notion that the variables under study are correlated and, to be implemented successfully, there must be a hypothesis postulating that several variables can be grouped into a smaller group. At this stage, the aim was to reduce the multi-topic questions into a smaller number of components [59].
As a next step, cluster analysis was employed to group respondents into homogeneous segments of consuming behavior. The cluster analysis tool aims toward sorting different observations into two or more clusters and is based on variable combinations. However, in this study, factor scores were employed in the cluster analysis instead of the raw variables to prevent problems of multicollinearity [56,60]. Cluster analysis has been used by many authors for segmentation in the field of consumer food science [61,62] and in other cases [63]. In addition, the combination of cluster analysis and factor analysis is common in many research papers where factor and cluster analyses are used in a complementary fashion in order to enhance the interpretation of results found using other methods [64,65,66,67].
The results derived from principal components analyses regarding the consumption frequency of cooperative products and the properties attributed to them were used in the clustering process. The aim of cluster analysis is to identify a system for separating observations into groups, where objects within each group would exhibit similar characteristics. In the present study, k-means cluster analysis was applied, as it is suitable for big samples, where all statistical analyses were performed using IBM SPSS Statistics for Windows, Version 22.0. Armonk, NY: IBM Corp (New York, USA). In total, the answers of 386 respondents were considered in the current study, as these questionnaires were fully and correctly completed; a further 114 questionnaires were incomplete and were removed from the analysis process.
4. Results
The demographics of the participants, presented in Table 1, were considered in the first part of the analysis. The sample mainly consisted of females (60%), 47.9% of the participants were married and 43.3% were within the 18–32-years age group. Moreover, 40% of the respondents had completed undergraduate studies and were employed in the public or private sector (42%).

Table 1.
Sociodemographic characteristics of the respondents.
The participants were asked to state how frequently they consumed agricultural cooperative products. The results presented in Table 2 show that fresh fruits, dairy and cheese products, vegetables, and olive oil occupied the highest places in the list regarding cooperative food preferences. The interpretation of consumer behavior toward food can be facilitated via consumer segmentation [56]. Therefore, principal component analysis was performed on the answers related to the purchasing frequency for cooperative food products with the aim to create a shorter list of “product baskets” using the components derived via the PCA. Table 3 shows the PCA results and the rotated component matrix regarding the preferences of cooperative food products. Moreover, the respondents were asked to evaluate several properties that were associated with agricultural cooperative and food products. Table 4 presents the main properties and characteristics of these products according to the respondents’ answers. Principal component analysis was performed on the answers related to the properties of cooperative food products. Table 5 shows the results from the PCA and the rotated component matrix regarding the cooperative food product properties.
Table 2.
Means and standard deviations for the preferred cooperative food product categories in terms of their purchase frequency.
Table 3.
Principal components analysis results regarding preferences toward cooperative products for consumers in Western Greece.
Table 4.
Properties of cooperative food products consumed in Western Greece.
Table 5.
Principal components of the properties of cooperative food products consumed in Western Greece.
The results in the footnotes of Table 3 and Table 5 show two performance measures: the Kaiser-Meyer-Olkin (KMO) measure of sampling adequacy and Bartlett’ sphericity test. A KMO value close to 1 indicates that the patterns of the correlations are relatively compact and the factor analysis yielded distinct and reliable components. Values between 0.8 and 0.9 (as in Table 3 and Table 5) can be characterized as very good [59]. Bartlett’s test of sphericity tests the hypothesis that the correlation matrix is an identity matrix, which would indicate that the variables are unrelated and, therefore, unsuitable for structure detection. Significance values less than 0.05 (as in Table 3 and Table 5) indicate that a principal component analysis of the data may be useful. Moreover, Table 3 and Table 5 show the components after the varimax rotation, together with the corresponding factor loadings. The factors of each variable were then transformed into uncorrelated factor scores (mean = 0, std. dev. = 1) using the Anderson–Rubin method (available in SPSS) in order to use them in the k-means cluster analysis and estimate clusters while avoiding the problem of multicollinearity.
The PCA results regarding the products’ characteristics show that the Cronbach’s α reliability coefficients were high for the first two factors at 0.784 and 0.767, whereas for the third component, the value was equal to 0.619, which is considered marginally acceptable [59]. The first component was loaded with seven items: “they are sold close to the time of production,” “they are safe for my family’s health and mine,” “trustworthy information on their labels,” “supports the local economy,” “their production process ensures environmental protection,” “great value-for-money ratio,” and “they look appealing”; this component was named “characteristics of cooperative food products.” The second component was loaded with the following four items: “they can be identified when displayed on store shelves,” “supreme quality of cooperative food products,” “can be easily found and purchased,” and “cooperative products are worth seeking”; this component was named “reputation.” The third component included the following three items: “they are more expensive compared to other food products,” “producer’s name is stated on the packaging,” and “they are certified by trustworthy bodies”; this component was named “price/value.”
The results derived from the two aforementioned component analyses, i.e., the three food groups and the three property groups, were used in the k-means cluster analysis to create the consumer segments. It was aforementioned that this process is similar to many other segmentation studies. Based on the results of the cluster analysis and the F statistics (F(3, 382) = 29,856), four statistically meaningful clusters of consumers were formed. The first cluster was composed of 104 members and represented 26.9% of the total participants. The second cluster consisted of 110 respondents and accounted for 28.5% of the total sample. The size of the third cluster was equal to 103 respondents and accounted for 26.7% of the total participants, while the fourth cluster consisted of 69 members and represented 17.9% of the number of participants. The tests and detailed statistics regarding the clusters are presented in Table A2 and Table A3 of Appendix A.
To determine the identity and characteristics of the respondents, chi-squared tests, along with crosstabulations, were applied to the four clusters created and several questions. Specifically, the questions used were related to the purchase decision process of cooperative products, such as the location/place of purchase, quality, experience, sensitivity, satisfaction acceptance, and loyalty characteristics. Additionally, to develop the profile of the four distinct consumer types regarding cooperative products, questions related to the physical characteristics of the respondents were used, such as the demographics (age, gender, etc.) see for more details Table 6.
Table 6.
Descriptions of the four clusters based on the consumers’ buying behavior toward cooperative products.
4.1. Cluster 1 (26.9%): “Skeptics”
This cluster was composed of participants who preferred to shop locally from small stores and focus on the brand, producer’s name, and country of origin. Regarding the properties of cooperative products, respondents considered them to be overpriced. Moreover, they emphasized and trusted the label and product information and they remained loyal to small/local food stores. For the quality characteristics of cooperative food products, this group was highly interested in the certification, labeling, country of origin, and environmental protection.
In this group, consumers exhibited high levels of agreement on questions related to cooperative products. However, they ranked second in this regard compared to the “cooperative” group. The knowledge around these products was considered high since 28.85% of the participants were aware of them and 34.62% could identify them. In general, consumers in this group felt they made a worthy purchase when buying such products compared to similar ones from other brands.
Cluster 1 (Table A3 in Appendix A) was mainly composed of consumers who had an undergraduate educational level (approximately one-third of the group members). Moreover, 38.5% stated their monthly household income was less than 500€ and 44.2% belonged to the 18–32-years age group. This cluster was predominantly composed of female consumers (three-quarters of the group members) and one out of four participants was occupied in the public sector. Additionally, the weekly expenditure on food was up to 50€ for 47.1% of the respondents and a high percentage of consumers (45%) resided in the regional unit of Aitoloakarnania.
4.2. Cluster 2 (34.7%): “Cooperative”
In this cluster, participants exhibited the highest rates regarding the quality characteristics and usage experience of cooperative food products. Moreover, they had the most positive opinion toward these products (related to the design, packaging, producer’s information stated on the packaging, certification, and the indication of the country of origin) compared to participants in the other clusters.
Regarding experience, participants showed higher scores and purchased more cooperative products than the other groups. Thus, they were positively inclined toward such food products. Noteworthy is the fact that this cluster did not consider cooperative food products as overpriced. Furthermore, in the questions related to the market, this group considered the purchase of cooperative products the best purchase they could make.
Concerning the satisfaction derived from the purchase of cooperative food products, participants claimed to be very satisfied and they tended to consider these purchases to be the best they could ever make: 52.73% agreed that it is the best purchase they could ever make and 46% felt satisfied when buying cooperative products. Therefore, they appeared to be the most enthusiastic regarding this purchase compared to the other groups. Moreover, they considered them of high quality and that they were worth the money; thus, making it the best choice. The overall knowledge of the participants regarding cooperative food products was the highest among the groups, and they demonstrated a willingness to try products offered by cooperatives that they would not normally consume.
Finally, the second cluster consisted mainly of consumers with an undergraduate educational level (approximately one-third of the group) and 36.4% of participants had a monthly income of 500 to 1000€. Additionally, 52.7% belonged to the 33–47-years age group and they tended to be married (55.5%) without any children (50%). A total of 60% of the participants were female and were significantly more likely to be occupied in the private sector than in other areas (one-fifth of the participants). Regarding the weekly food expenditure, 44.5% of this group’s members claimed they spent from 51 to 100€, and the largest percentage of the participants (42.7%) resided in the regional unit of Aitoloakarnania.
4.3. Cluster 3 (26.8%): “Passively Sensitive”
Consumers who belong to cluster 3 were characterized as passively sensitive since they avoided giving definite answers when questioned about the quality characteristics of cooperative products. At the same time, they were aware of these products and could identify them when displayed on store shelves. However, these consumers appeared cautious and therefore refrained from giving high ratings to statements related to quality, safety, and respect for the environment. It is worth noting that in all questions related to the purchase satisfaction characteristics regarding cooperative products, this group exhibited the lowest scores (Table 6).
Consumers in cluster 3 mainly had an undergraduate education level (approximately one-third of the group) and 44.7% had a monthly income of up to 500€. Moreover, 46.67% of the participants were 18–32 years old, 54.4% were single, and 62.1% do not have children. In this group, 52.4% of the respondents were female and they were more likely to be employed in the private sector. Regarding food expenditure, 60.8% of the consumers spent up to 50€ on a weekly basis and 37% of the participants resided in Aitoloakarnania and another 37% in Achaia.
4.4. Cluster 4 (17.9%): “Indifferent”
Participants in cluster 4 were considered “indifferent” due to the lack of sufficient knowledge regarding quality characteristics attributed to the cooperative products. It should be highlighted that in this group, consumers were not aware of cooperative products and could not identify them on the store shelves. This was further supported by the fact that none of the participants in this cluster (69 participants in total) stated that they were completely aware or could identify such products. Therefore, consumers in cluster 4 did not seek to purchase cooperative products from stores.
Having mentioned all the above, lower scores were expected from these participants regarding questions related to quality (appearance, packaging, and quality) and satisfaction characteristics of cooperative products. However, consumers appeared to be relatively positive regarding the satisfaction associated with product quality and the fact that cooperative products supported the local economy and society.
Cluster 4 was composed of consumers who were more likely to hold a university degree (30.4%) and 31.9% of them stated that they had a monthly income of up to 500€. Additionally, 46.6% of the respondents belonged to the 18–32-years age group, they were not married (50.7%), and did not have children (47.8%). The “indifferent” group mainly consisted of females (71%) and 23.8% of the participants claimed to be unemployed. Furthermore, their weekly food expenditure was approximately 50€ for 46.4% of the consumers and a significant majority (62.1%) lived in Aitoloakarnania.
5. Discussion
Cluster analysis has been used in many segmentation studies in the field of consumer food science, which has obtained meaningful results by using socioeconomic and demographic features [68]. However, food product choice is getting too complex to be exclusively explained by sociodemographic factors [69]. Thus, adding more complicated variables, such as consumers’ values and attributes about products, could be useful when trying to group consumers into segments [67].
In the present study, segmentation was performed on the basis of product usage and preferences with the assistance of two multi-item variables, namely, the frequency of purchased cooperative products and consumers’ views regarding their attributes. Principal component analysis was used to reduce the number of items to a smaller number of components. Finally, three product groups (baskets) and three components for the products’ attributes were used. As the survey results demonstrated, six components were used to form the consumer groups, resulting in the creation of four clusters. Specifically, consumers of two groups showed a keen interest in the products of agricultural cooperatives, namely, the “cooperative” and “skeptics” groups. On the other hand, there was a group of consumers that was “indifferent” about cooperative products and one more group that was ambivalent about cooperative products even if they were familiar with them; this was the group of “passively sensitive” consumers.
Three or four consumer segments are a typical result for consumer segmentation studies [67,68,69], which usually involves indifferent, dissatisfied, or even hater categorizations. On the other side, there are interested, involved, satisfied, seekers, or even lovers, while on the borderlines, there are groups of consumers who are ambivalent, unaware, and rational, and consumers in general who do not have not a clear and strong preference for the examined products, and consequently, their buying behavior is questionable. In any case, consumer segmentation is of paramount importance to the operation of a company. Most food businesses prefer to address a specific market segment with a specific marketing strategy in order to concentrate their efforts and resources in areas where maximum effectiveness can be achieved [70].
Based on the analysis results, there were two groups of consumers who were aware of the characteristics of the cooperative products and consequently positively inclined to the quality of the cooperative products. These types of consumers could identify cooperative products when displayed on store shelves. Product recognition and, accordingly, label recognition are crucial factors that generate a positive attitude among consumers [67,71,72]. However, the attitude between these groups of consumers differs regarding the product price. The “cooperative” group considered that the price of the products was not high and the cooperatives’ products offered good value for money. On the other hand, the “skeptics” generally considered that the products were overpriced, though some did claim that they offered good value for money. Product price and willingness to pay determine consumers’ attitudes in many studies and play an important role when defining market segments [73,74].
Taking this into account, a promotion strategy for cooperative products must emphasize the products’ quality characteristics. Thus, “skeptic” consumers could be persuaded of the products’ value in relation to the benefits for producers/consumers, the local community, and the economy. Regarding the other two consumer groups, agricultural cooperatives do not need to implement a certain strategy for the indifferent group. However, “passively sensitive” consumers could be “likely consumers” since they are already aware of these products and can identify them when displayed on store shelves. Nevertheless, the “passively sensitive” consumers appeared cautious about the characteristics of the cooperative products related to quality, safety, etc. In any case they could be potential consumers if the promotional strategy used for the “skeptic” consumers proves to be successful.
Overall, agricultural cooperatives in Greece should not rely on a single marketing strategy as a panacea for their sustainability and viability [15]. There are many potential marketing strategies that should be evaluated, combined, and applied for the different markets and market segments where agricultural cooperatives are operating.
6. Conclusions and Suggestions
Food businesses, including agricultural cooperatives, should select marketing strategies involving product differentiation and targeting specific consumer segments in order to be competitive. Understanding customers’ needs and realizing that “one size cannot fit all” is essential for their long-term viability. In general, the implementation of undifferentiated marketing is challenging for small firms since larger competitors that use the cost leadership approach can easily neutralize them by using aggressive policies that would push them out of the market. Only a few leading and large enterprises can successfully target the entire broader market through the cost leadership strategy and other marketing tactics, known as undifferentiated marketing.
Therefore, the best option for the smaller food businesses seeking to increase competitiveness and become sustainable is using the segmentation and specialization process by targeting specific consumer groups. By segmenting the market, food businesses aim to identify, within a broader product market, a group of buyers sharing common characteristics, beliefs, and perceptions that differentiate them from consumers of other groups. Selecting a marketing strategy is a complex and crucial determinant for the viability and sustainability of agricultural cooperatives. Thus, in order to produce a cooperative strategy, it is necessary to examine other areas related to cooperative products, such as promotion and advertising methods, packaging, and trademark issues, as well as the management of supply chains, to fully address the potential of the chosen marketing strategy.
The present study provided evidence about the usefulness of market segmentation as a marketing strategy for agricultural cooperatives, offering a variety of benefits. The required customer analysis allows agricultural cooperatives to meet customers’ needs and expectations since it provides a wider view of their profile and consumption behavior. Moreover, by examining their competitors in segments, agricultural cooperatives can enhance their assessment of the competitive situation, gaining the advantage of distinguishing the segments they should target and the nature of competitive advantage to seek. The results derived from this study could provide insight that may contribute to more effective strategic and tactical marketing decisions by agricultural cooperatives all over Europe.
These approaches require further research and specific surveys to examine consumers’ perceptions about food products from agricultural cooperatives. In any case, it is of great interest for all food companies in all countries to identify consumption patterns with certain perceptions.
7. Limitations
The most important weakness of this survey is that it was limited to Western Greece and the results were based on a convenience sample, making it difficult to generalize its findings. Nevertheless, to the best of the authors’ knowledge, it is one of the first surveys on consumers’ attitude toward the products of agricultural cooperatives in Greece. However, these limitations apply to most consumer behavior studies, and future research could reproduce this study in Greece or even in other European countries to examine the stability of the segments and to assess the validity of the scales. Nevertheless, the advantage of the survey lies in the guidelines provided for segmenting consumers of agricultural cooperative products. These can be utilized by a broader marketing strategy for the development and promotion of the products of agricultural cooperatives.
Author Contributions
Conceptualization, O.T., A.K., P.K. and F.C.; methodology, O.T.; software, A.K.; validation, A.K., F.C. and P.K.; formal analysis, A.K.; investigation, A.K.; data curation, A.K.; writing—original draft preparation, O.T. and P.K.; writing—review and editing, F.C.; visualization, F.C. and P.K.; supervision, A.K. and F.C.; project administration, A.K. and F.C. All authors have read and agreed to the published version of the manuscript.
Funding
This research received no external funding.
Institutional Review Board Statement
Not applicable.
Informed Consent Statement
Informed consent was obtained from all subjects involved in the study.
Data Availability Statement
Data available on request.
Conflicts of Interest
The authors declare no conflict of interest.
Appendix A
Table A1.
Final cluster centers.
Table A1.
Final cluster centers.
| Component Used in Cluster Analysis | Cluster | |||
|---|---|---|---|---|
| 1 | 2 | 3 | 4 | |
| Principal component: first products basket | 0.50492 | 0.29854 | −0.44640 | −0.53385 |
| Principal component: second products basket | −0.27878 | 0.61553 | −0.26252 | −0.46489 |
| Principal component: third products basket | 0.89608 | 0.06714 | −0.53989 | −0.43354 |
| Principal component: product characteristics | −0.09025 | 0.53475 | −0.99464 | 0.40980 |
| Principal component: reputation | 0.42930 | 0.38487 | 0.16223 | −10.38670 |
| Principal component: price/value | 0.95033 | −0.36958 | −0.31834 | 0.01200 |
Table A2.
Analysis of variance (ANOVA) results regarding the characteristics across the clusters.
Table A2.
Analysis of variance (ANOVA) results regarding the characteristics across the clusters.
| Component | Sum of Squares | df | Mean Square | F | Sig. | |
|---|---|---|---|---|---|---|
| first products basket | Between groups | 73.125 | 3 | 24.375 | 29.856 | 0.000 |
| Within groups | 311.875 | 382 | 0.816 | |||
| Total | 385.000 | 385 | ||||
| second products basket | Between groups | 79.760 | 3 | 26.587 | 33.273 | 0.000 |
| Within groups | 305.240 | 382 | 0.799 | |||
| Total | 385.000 | 385 | ||||
| third products basket | Between groups | 108.848 | 3 | 36.283 | 50.190 | 0.000 |
| Within groups | 276.152 | 382 | 0.723 | |||
| Total | 385.000 | 385 | ||||
| Product characteristics | Between groups | 145.406 | 3 | 48.469 | 77.277 | 0.000 |
| Within groups | 239.594 | 382 | 0.627 | |||
| Total | 385.000 | 385 | ||||
| Reputation | Between groups | 179.942 | 3 | 59.981 | 111.738 | 0.000 |
| Within groups | 205.058 | 382 | 0.537 | |||
| Total | 385.000 | 385 | ||||
| Price/value | Between groups | 102.901 | 3 | 34.300 | 46.447 | 0.000 |
| Within groups | 282.099 | 382 | 0.738 | |||
| Total | 385.000 | 385 | ||||
Table A3.
Description of the consumers’ demographic characteristics across the four clusters.
Table A3.
Description of the consumers’ demographic characteristics across the four clusters.
| Clusters Demographics | Frequencies | First Cluster: “Skeptics” | Second Cluster: “Cooperatives” | Third Cluster: “Passively Sensitive” | Fourth Cluster: “Indifferent” |
|---|---|---|---|---|---|
| Gender | |||||
| Male | 153 | 39 | 45 | 49 | 20 |
| Female | 233 | 65 | 65 | 54 | 49 |
| Age groups (years) | |||||
| 18–32 | 167 | 46 | 41 | 48 | 32 |
| 33–47 | 160 | 45 | 58 | 34 | 23 |
| 48–65 | 59 | 13 | 11 | 21 | 14 |
| Years of education | |||||
| <9 | 10 | 3 | 4 | 2 | 1 |
| 9–12 | 80 | 18 | 22 | 21 | 19 |
| 13–14 | 76 | 21 | 18 | 21 | 16 |
| 15–16 | 155 | 45 | 49 | 40 | 21 |
| 17–18 | 65 | 17 | 17 | 19 | 12 |
| Monthly household income | |||||
| 0–500€ | 139 | 40 | 31 | 46 | 22 |
| 501–1000€ | 114 | 26 | 40 | 27 | 21 |
| 1001–1500€ | 87 | 23 | 26 | 21 | 17 |
| >1500€ | 46 | 15 | 13 | 9 | 9 |
| Marital status | |||||
| Single | 180 | 52 | 45 | 56 | 27 |
| Married | 185 | 46 | 61 | 43 | 35 |
| Divorced | 21 | 6 | 4 | 4 | 7 |
| Number of children | |||||
| None | 207 | 55 | 55 | 64 | 33 |
| 1–2 | 154 | 42 | 44 | 35 | 33 |
| 3–4 | 25 | 7 | 11 | 4 | 3 |
| Weekly expenditure on food | |||||
| Up to 50€ | 189 | 49 | 46 | 62 | 32 |
| 51–100€ | 119 | 30 | 49 | 23 | 17 |
| 101–150€ | 54 | 18 | 13 | 11 | 12 |
| >150€ | 24 | 7 | 2 | 6 | 8 |
| Occupation | |||||
| Private sector | 83 | 18 | 26 | 24 | 15 |
| Public sector | 79 | 25 | 23 | 17 | 14 |
| Freelancer | 64 | 18 | 22 | 14 | 10 |
| Student | 62 | 17 | 14 | 19 | 12 |
| Unemployed | 57 | 15 | 16 | 18 | 19 |
| Farmer | 29 | 8 | 5 | 10 | 6 |
| Retired | 12 | 3 | 4 | 1 | 4 |
| Place of residence | |||||
| Regional unit of Aitoloakarnania | 153 | 46 | 41 | 30 | 36 |
| Regional unit of Achaia | 107 | 41 | 25 | 30 | 14 |
| Regional unit of Elia | 74 | 15 | 30 | 21 | 8 |
References
- Kontogeorgos, A. Brands, quality badges and agricultural cooperatives: How can they co-exist? TQM J. 2012, 24, 72–82. [Google Scholar] [CrossRef]
- Kontogeorgos, A.; Chatzitheodoridis, F.; Loizou, E. Adaptation strategies for the Greek agricultural cooperatives during the economic crisis. Agric. Econ.-Czech 2016, 62, 26–34. [Google Scholar] [CrossRef]
- Benos, T.; Kalogeras, N.; Verhees, F.J.; Sergaki, P.; Pennings, J.M. Cooperatives’ Organizational Restructuring, Strategic Attributes, and Performance: The Case of Agribusiness Cooperatives in Greece. Agribusiness 2016, 32, 127–150. [Google Scholar] [CrossRef]
- Kalogeras, N.; Pennings, J.M.; Van Der Lans, I.A.; Garcia, P.; Van Dijk, G. Understanding heterogeneous preferences of cooperative members. Agribusiness 2009, 25, 90–111. [Google Scholar] [CrossRef]
- Beverland, M. Can cooperatives brand? Exploring the interplay between cooperative structure and sustained brand marketing success. Food Policy 2007, 32, 480–495. [Google Scholar] [CrossRef]
- Dibb, S. Market segmentation: Strategies for success. Mark. Intell. Plan. 1998, 16, 394–406. [Google Scholar] [CrossRef]
- McBurnie, T.; Clutterbuck, D. Give Your Company the Marketing Edge; Penguin Books: London, UK, 1998. [Google Scholar]
- Cechin, A.; Bijman, J.; Pascucci, S.; Omta, O. Decomposing the Member Relationship in Agricultural Cooperatives: Implications for Commitment. Agribusiness 2012, 29, 39–61. [Google Scholar] [CrossRef]
- Drugova, T.; Curtis, K.R.; Akhundjanov, S.B. Organic wheat products and consumer choice: A market segmentation analysis. Br. Food J. 2020, 122, 2341–2358. [Google Scholar] [CrossRef]
- Sultan, P.; Wong, H.Y.; Sigala, M. Segmenting the Australian organic food consumer market. Asia Pac. J. Mark. Logist. 2018, 30, 163–181. [Google Scholar] [CrossRef]
- Kenkel, P.; Customer Segmentation in Agricultural Cooperatives; Oklahoma State University. Division of Agricultural Sciences and Natural Resources. Cooperative Extension Service. 2004. Available online: https://hdl.handle.net/11244/49693 (accessed on 22 January 2021).
- Batzios, A.; Kontogeorgos, A.; Chatzitheodoridis, F.; Sergaki, P. What Makes Producers Participate in Marketing Cooperatives? The Northern Greece Case. Sustainability 2021, 13, 1676. [Google Scholar] [CrossRef]
- Bijman, J.; Iliopoulos, C. Farmers’ cooperatives in the EU: Policies, strategies, and organization. Ann. Public Coop. Econ. 2014, 85, 497–508. [Google Scholar] [CrossRef]
- Kontogeorgos, A.; Sergaki, P.; Chatzitheodoridis, F. An assessment of new farmers’ perceptions about agricultural cooperatives. J. Dev. Entrep. 2017, 22, 1750003. [Google Scholar] [CrossRef]
- Chatzitheodoridis, F.; Michailidis, A.; Theodosiou, G.; Loizou, E. Local Cooperation: A Dynamic Force for Endogenous Rural Development. In Balkan and Eastern European Countries in the Midst of Global Economic Crisis, Contributions to Economics; Part, 3; Karassavoglou, A., Polychronidou, P., Eds.; Springer: Heidelberg, Germany, 2013; pp. 121–132. [Google Scholar] [CrossRef]
- Iliopoulos, C. Support for Farmers’ Cooperatives. Country Report Greece; Wageningen UR: Wageningen, The Netherlands, 2012. [Google Scholar]
- Kontogeorgos, A.; Sergaki, P.; Kosma, A.; Semou, V. Organizational Models for Agricultural Cooperatives: Empirical Evidence for their Performance. J. Knowl. Econ. 2016, 9, 1123–1137. [Google Scholar] [CrossRef]
- Kyriakopoulos, K.; Meulenberg, M.; Nilsson, J. The impact of cooperative structure and firm culture on market orientation and performance. Agribusiness 2004, 20, 379–396. [Google Scholar] [CrossRef]
- Novkovic, S.; Power, N. Agricultural and Rural Cooperative Viability: A Management Strategy based on Cooperative Principles and Values. J. Rural. Coop. 2005, 3, 67–78. [Google Scholar] [CrossRef]
- Sergaki, P.; Semos, A. The Greek Unions of Agricultural Cooperatives as Efficient Enterprises. Agric. Econ. Rev. 2006, 7, 15–27. [Google Scholar] [CrossRef]
- Salavou, H.E.; Sergaki, P. Generic Business Strategies in Greece: Private Food Firms versus. Agric. Coop. J. Rural. Coop. 2013, 41, 44–59. [Google Scholar] [CrossRef]
- Karipidis, F.I. Cooperative Marketing of Agricultural Products and Unused Capabilities in Greece. Social Economy (in Greek), 2015. Volume 4. Available online: https://d1wqtxts1xzle7.cloudfront.net/50349075/Cooperative_Marketing_of_Agricultural_Pr20161116-17555-1t42j4i.pdf? (accessed on 22 January 2021).
- Karipidis, P.; Chrysochou, P.; Karypidou, I. The importance of relationship characteristics in the export performance of food firms. Br. Food J. 2020, 122, 1305–1320. [Google Scholar] [CrossRef]
- Grunert, K.G. Food quality and safety: Consumer perception and demand. Eur. Rev. Agric. Econ. 2005, 32, 369–391. [Google Scholar] [CrossRef]
- Araque-Padilla, R.A.; Montero-Simó, M.J.; Rivera-Torres, P.; Aragón-Gutiérrez, C. Moderating the Relationship between Price and Perceived Value of Ethical Products. J. Agric. Environ. Ethics 2014, 28, 217–230. [Google Scholar] [CrossRef]
- Tully, S.M.; Winer, R.S. The Role of the Beneficiary in Willingness to Pay for Socially Responsible Products: A Meta-analysis. J. Retail. 2014, 90, 255–274. [Google Scholar] [CrossRef]
- Poelmans, E.; Rousseau, S. How do chocolate lovers balance taste and ethical considerations? Br. Food J. 2016, 118, 343–361. [Google Scholar] [CrossRef]
- Rangar, S.; Bhat, A.; Kachroo, J.; Dwivedi, S.; Isher, K.A.; Sharma, S. Consumer Behaviour Towards Milk and Milk Products: Case of Dairy Cooperative of Uttarkhand. Agro Econ. Int. J. 2020, 7, 71–73. [Google Scholar] [CrossRef]
- Jamwal, M.; Pandey, A.C. Consumer Behaviour towards cooperative milk societies: A Study on measuring customer satisfaction of ‘Aanchal’ milk (A Member Milk Union of UCDF Ltd.). Needs Strateg. Manag. Perspect. 2020. [Google Scholar] [CrossRef]
- Mastronardi, L.; Romagnoli, L.; Mazzocchi, G.; Giaccio, V.; Marino, D. Understanding consumer’s motivations and behaviour in alternative food networks. Br. Food J. 2019, 121, 2102–2115. [Google Scholar] [CrossRef]
- Novelli, S.; Corsi, A. Alternative Food Networks and Local Markets: Determinants of Consumers’ Choices between Conventional and Farmers’ Stands; Department of Economics and Statistics Cognetti de Martiis, Working Papers 201542. University of Turin: Torino, Italy, 2015. Available online: https://ideas.repec.org/p/uto/dipeco/201542.html (accessed on 22 January 2021).
- Vapa-Tankosić, J.; Ignjatijević, S.; Kiurski, J.; Milenković, J.; Milojević, I. Analysis of Consumers’ Willingness to Pay for Organic and Local Honey in Serbia. Sustainability 2020, 12, 4686. [Google Scholar] [CrossRef]
- Berg, N.; Preston, K.L. Willingness to pay for local food? Consumer preferences and shopping behavior at Otago Farmers Market. Transp. Res. Part A: Policy Pr. 2017, 103, 343–361. [Google Scholar] [CrossRef]
- Carpio, C.E.; Isengildina-Massa, O. Consumer willingness to pay for locally grown products: The case of South Carolina. Agribusiness 2009, 25, 412–426. [Google Scholar] [CrossRef]
- Feldmann, C.; Hamm, U. Consumers’ perceptions and preferences for local food: A review. Food Qual. Prefer. 2015, 40, 152–164. [Google Scholar] [CrossRef]
- Brozzi, R.; Stawinoga, A.E.; Hoffmann, C.; Streifeneder, T. Determinants of local food purchase Insight from a consumer survey in South Tyrol (Italy). Socio.hu 2016, 4, 99–115. [Google Scholar] [CrossRef][Green Version]
- Tey, Y.S.; Arsil, P.; Brindal, M.; Teoh, C.T.; Lim, H.W. Motivations Underlying Consumers’ Preference for Farmers’ Markets in Klang Valley: A Means-End Chain Approach. Sustainability 2017, 9, 1958. [Google Scholar] [CrossRef]
- De Pelsmaeker, S.; Schouteten, J.J.; Lagast, S.; Dewettinck, K.; Gellynck, X. Is taste the key driver for consumer preference? A conjoint analysis study. Food Qual. Prefer. 2017, 62, 323–331. [Google Scholar] [CrossRef]
- Jo, J.; Lusk, J.L. If it’s healthy, it’s tasty and expensive: Effects of nutritional labels on price and taste expectations. Food Qual. Prefer. 2018, 68, 332–341. [Google Scholar] [CrossRef]
- Annunziata, A.; Ianuario, S.; Pascale, P. Consumers’ Attitudes toward Labelling of Ethical Products: The Case of Organic and Fair Trade Products. J. Food Prod. Mark. 2011, 17, 518–535. [Google Scholar] [CrossRef]
- Silva, A.R.D.A.; Bioto, A.S.; Efraim, P.; Queiroz, G.D.C. Impact of sustainability labeling in the perception of sensory quality and purchase intention of chocolate consumers. J. Clean. Prod. 2017, 141, 11–21. [Google Scholar] [CrossRef]
- Grebitus, C.; Lusk, J.L.; Nayga, R.M. Effect of distance of transportation on willingness to pay for food. Ecol. Econ. 2013, 88, 67–75. [Google Scholar] [CrossRef]
- Conner, D.; Colasanti, K.; Ross, R.B.; Smalley, S.B. Locally Grown Foods and Farmers Markets: Consumer Attitudes and Behaviors. Sustainability 2010, 2, 742–756. [Google Scholar] [CrossRef]
- Campbell, B.L.; Mhlanga, S.; Lesschaeve, I. Perception versus Reality: Canadian Consumer Views of Local and Organic. Can. J. Agric. Econ. 2013, 61, 531–558. [Google Scholar] [CrossRef]
- Junita, A.; Abubakar, E.; Muda, I.; Abdullah, S. Influence of budget participation and leadership style against rebudgeting on work unit of apparatus. J. Bus. Retail. Manag. Res. 2018, 13, 184–195. [Google Scholar] [CrossRef]
- Jarzębowski, S.; Bourlakis, M.; Bezat-Jarzębowska, A. Short Food Supply Chains (SFSC) as Local and Sustainable Systems. Sustainability 2020, 12, 4715. [Google Scholar] [CrossRef]
- Nilsson, J.; Ruffio, P.; Gouin, S. Do Consumers Care About Cooperatives? In Vertical Markets and Cooperative Hierarchies; Springer: Dordrecht, The Netherlands, 2007. [Google Scholar] [CrossRef]
- Dakurah, H.A.; Goddard, E.W.; Osuteye, N. Attitudes Towards and Satisfaction with Cooperatives in Alberta. A Survey Analysis. In Proceedings of the American Agricultural Economics Association Annual Meeting, Providence, RI, USA, 24–27 July 2005. [Google Scholar] [CrossRef]
- Sommer, R.; Becker, F.; Hohn, W.; Warholic, J. Customer Characteristics and Attitudes at Participatory and Supermarket Cooperatives. J. Consum. Aff. 1983, 17, 134–148. [Google Scholar] [CrossRef]
- Vlaeminck, P.; Vandoren, J.; Vranken, L. Consumers’ Willingness to Pay for Fair Trade Chocolate. In The Economics of Chocolate; Oxford University Press (OUP): Oxford, UK, 2016. [Google Scholar] [CrossRef]
- Chambers, S.; Lobb, A.; Butler, L.; Harvey, K.; Traill, W.B. Local, national and imported foods: A qualitative study. Appetite 2007, 49, 208–213. [Google Scholar] [CrossRef]
- Željka, M.; Petljak, K.; Borović, D.; Tomić, M. Segmentation of local food consumers based on altruistic motives and perceived purchasing barriers: A Croatian study. Econ. Res.-Ekon. Istraživanja 2020, 1–22. [Google Scholar] [CrossRef]
- Taherdoost, H. Sampling Methods in Research Methodology; How to Choose a Sampling Technique for Research. SSRN Electron. J. 2016, 5, 18–27. [Google Scholar] [CrossRef]
- Etikan, I.; Musa, S.A.; Alkassim, R.S. Comparison of Convenience Sampling and Purposive Sampling. Am. J. Theor. Appl. Stat. 2016, 5, 1. [Google Scholar] [CrossRef]
- Malhotra, N.K.; Birks, D.F. Marketing Research an Applied Approach, 3rd ed.; Pearson Education Limited: Harlow, UK, 2007. [Google Scholar]
- Alamanos, E.; Bourlakis, M.; Tzimitra-Kalogianni, I. Segmenting Greek tomato consumers: Policy and marketing insights towards a healthy diet. Br. Food J. 2013, 115, 488–507. [Google Scholar] [CrossRef]
- Brečić, R.; Željka, M.; Cerjak, M. Importance of intrinsic and extrinsic quality food characteristics by different consumer segments. Br. Food J. 2017, 119, 845–862. [Google Scholar] [CrossRef]
- Schnettler, B.; Vidal, R.; Silva, R.; Vallejos, L.; Sepúlveda, N. Consumer willingness to pay for beef meat in a developing country: The effect of information regarding country of origin, price and animal handling prior to slaughter. Food Qual. Prefer. 2009, 20, 156–165. [Google Scholar] [CrossRef]
- Field, A. Discovering Statistics Using SPSS; SAGE Publication: London, UK, 2015. [Google Scholar]
- Grunert, K.G.; Juhl, H.J.; Esbjerg, L.; Jensen, B.B.; Bech-Larsen, T.; Brunsø, K.; Madsen, C. Øland Comparing methods for measuring consumer willingness to pay for a basic and an improved ready made soup product. Food Qual. Prefer. 2009, 20, 607–619. [Google Scholar] [CrossRef]
- Annunziata, A.; Vecchio, R. Functional foods development in the European market: A consumer perspective. J. Funct. Foods 2011, 3, 223–228. [Google Scholar] [CrossRef]
- Low, J.Y.; Lin, V.H.; Yeon, L.J.; Hort, J. Considering the application of a mixed reality context and consumer segmentation when evaluating emotional response to tea break snacks. Food Qual. Prefer. 2021, 88, 104113. [Google Scholar] [CrossRef]
- Vecchio, Y.; De Rosa, M.; Adinolfi, F.; Bartoli, L.; Masi, M. Adoption of precision farming tools: A context-related analysis. Land Use Policy 2020, 94, 104481. [Google Scholar] [CrossRef]
- Gorman, B.S.; Primavera, L.H. The Complementary Use of Cluster and Factor Analysis Methods. J. Exp. Educ. 1983, 51, 165–168. [Google Scholar] [CrossRef]
- Kontogeorgos, A.; Chatzitheodoridis, F.; Theodossiou, G. Willingness to Invest in Agricultural Cooperatives: Evidence from Greece. J. Rural. Coop. 2014, 42, 1–18. [Google Scholar] [CrossRef]
- Blbas, H.T.; Mahmood, S.H.; Omer, C.A. A Comparison results of factor analysis and cluster analysis to the migration of young people from the Kurdistan Region to Europe. ZANCO J. Pure Appl. Sci. 2017, 29, 44–55. [Google Scholar] [CrossRef]
- Tleis, M.; Callieris, R.; Roma, R. Segmenting the organic food market in Lebanon: An application of k-means cluster analysis. Br. Food J. 2017, 119, 1423–1441. [Google Scholar] [CrossRef]
- Kavak, B.; Gumusluoglu, L. Segmenting Food Markets—The Role of Ethnocentrism and Lifestyle in Understanding Purchasing Intentions. Int. J. Mark. Res. 2007, 49, 71–94. [Google Scholar] [CrossRef]
- Montero-Vicente, L.; Roig-Merino, B.; Buitrago-Vera, J.; Sigalat-Signes, E. Characterisation of fresh fruit consumption in Spain based on food-related lifestyle. Br. Food J. 2019, 121, 3307–3320. [Google Scholar] [CrossRef]
- Chinnici, G.; D’Amico, M.; Pecorino, B. A multivariate statistical analysis on the consumers of organic products. Br. Food J. 2002, 104, 187–199. [Google Scholar] [CrossRef]
- Adasme-Berríos, C.; Sanchez, M.; Mora, M.; Schnettler, B.; Lobos, G.; Díaz, J. Segmentation of consumer preference for food safety label on vegetables. Br. Food J. 2016, 118, 2550–2566. [Google Scholar] [CrossRef]
- Pappalardo, G.; Chinnici, G.; Selvaggi, R.; Pecorino, B. Assessing the Effects of the Environment on Consumers’ Evaluations for Wine. Wine Econ. Policy 2020, 9, 31–42. [Google Scholar] [CrossRef]
- Gil, J. Market segmentation and willingness to pay for organic products in Spain. Int. Food Agribus. Manag. Rev. 2000, 3, 207–226. [Google Scholar] [CrossRef]
- Di Vita, G.; Pappalardo, G.; Chinnici, G.; La Via, G.; D’Amico, M. Not everything has been still explored: Further thoughts on additional price for the organic wine. J. Clean. Prod. 2019, 231, 520–528. [Google Scholar] [CrossRef]

Publisher’s Note: MDPI stays neutral with regard to jurisdictional claims in published maps and institutional affiliations. |
© 2021 by the authors. Licensee MDPI, Basel, Switzerland. This article is an open access article distributed under the terms and conditions of the Creative Commons Attribution (CC BY) license (http://creativecommons.org/licenses/by/4.0/).