Article

A Study on Decision-Making Opinion Exploration in Windows-Based Information Security Monitoring Tool Development

1
Department of Information Management, College of Management, National Defense University, Taipei City 11258, Taiwan
2
Department of Multimedia Design, St. John’s University, New Taipei City 25135, Taiwan
*
Author to whom correspondence should be addressed.
Sustainability 2021, 13(7), 3815; https://doi.org/10.3390/su13073815
Submission received: 26 February 2021 / Revised: 18 March 2021 / Accepted: 26 March 2021 / Published: 30 March 2021

Abstract

:
In the information era, information security monitoring tools would be helpful for enterprises/organizations to monitor employees’ computer usage behaviors and improve their information security protection. The Windows-based operating systems have the largest market share in the world. Therefore, the study target is the development of a Windows-based information security monitoring tool in this study. We proposed an assessment model for developing an information security tool in this study to explore the significances of functionalities in a Windows-based information security monitoring tool and the decision-makers’ decision opinions. We adopted four steps with four study methods: the literature study method, the Delphi method, the analytic hierarchy process (AHP) method, and the analysis methods related to data-driven decision-making in the proposed model. In Step 1, we studied some literature about information security monitoring, and we discovered 26 functionalities as the decision criteria in this study. In Step 2, using the Delphi method, we confirmed the decision criterion set with potential decision-makers and organized the decision criteria hierarchy. In Step 3, we designed an AHP questionnaire to get the criterion weight vectors from the 12 decision-makers. With the AHP method, this study received the weights of the decision criteria and found that the 16 functionalities among the 26 functionalities should receive their corresponding developing priority in a Windows-based information security monitoring tool. Finally, we used the Pearson correlation coefficient and cosine distance to explore the correlations and similarities among the decision-makers’ decision opinions. This study found the relevance among the decision-makers’ decision opinions in a Windows-based information security monitoring tool developed with the Pearson correlation coefficients/the cosine distances among all pairs of decision-makers’ decision opinions.

1. Introduction

With the advancement of information technology, enterprises/organizations widely use information software and hardware, and the resulting information security issues are also getting worse. Enterprises/organizations control their information security risks and ensure continued operations with information security policy formulations and relevant management measure implementations. In general, an enterprise/organization expects to reduce the occurrence of an information security incident, and it will depend on the effective operations of its information security management mechanism to appropriately reduce the incidence of related information security violations. Therefore, enterprises/organizations require the implementation of an information security monitoring tool.
The Global Data Exposure Report surveyed 1028 information security leaders and found that 69% of organizations said they were compromised because of an internal threat and confirmed that they had preventive measures in place at the time of the breach, 38% of companies admitted to data breaches in the past 18 months, half of which were due to employee behavior, and 78% of information security leaders believe prevention strategies and solutions are not enough to stop internal threats [1]. The 2020 Insider Threat Report showed that today’s most destructive security threats originate from trusted insiders, both malicious insiders and negligent insiders who can access sensitive data and information systems. This report also found that 68% of organizations consider that internal attacks are moderate or extremely vulnerable, and 68% of organizations confirmed that internal attacks are becoming more frequent. From the aforementioned related reports, it is obvious that internal employees are often a primary hidden concern of information security in an enterprise/organization [2]. Therefore, how to reduce information security incidents from the internal threats is an issue for an enterprise/organization.
For an enterprise/organization, its major internal threats of information security come from its employees. Employees in an enterprise/organization usually use their personal computers over an intranet or the Internet to process business affairs. For an enterprise/organization, employees’ personal computers might be the primary source of internal information security issues. Therefore, for enterprises/organizations, how to monitor employees’ personal computers is an important issue. In practice, many enterprises/organizations use information security monitoring tools to collect information related to information security and monitor computer systems’ operations. Therefore, it is a good solution for enterprises/organizations to monitor their computer systems, especially their employees’ personal computers, with an information security monitoring tool.
In general, computers with different operating systems need to install their corresponding information security monitoring tools. The Desktop Operating System Market Share Worldwide (2020) report mentioned that Microsoft Windows operating system has the highest global market share: the average global market share of the Microsoft Windows operating system was 77.68% in the past year (2019/07~2020/06) [3]. Microsoft Windows is the most widely used operating system for desktop computers in the world now. Therefore, a Windows-based information security monitoring tool would be the most needed for enterprises/organizations. This study will explore developing priority for the functionalities in a Windows-based information security monitoring tool. For exploring this study topic, this study will adopt an assessment model for development of an information system tool to assess developing priorities for the functionalities in a windows-based information security monitoring tool. The assessment model for an information security tool development adopts several methods, such as the literature study method, the Delphi method, the analytic hierarchy process (AHP) method, and some data-driven decision-making analytical methods. Finally, we will rely on the study analysis results to propose developing priority for functionalities in a Windows-based information security monitoring tool and explore the decision opinions of decision-makers.
In this paper, Section 2 reviews the literature about information security monitoring to find functionalities in an information security monitoring tool and identify the decision criterion set related to a Windows-based information security monitoring tool. Section 3 introduces the assessment model for an information security tool development in this study, and the proposed model will use the literature study method, the Delphi method, the AHP method, and two data-driven decision-making analytical methods. Section 4 presents the main study results of the proposed assessment model, including the decision-making hierarchy determined by the Delphi method and the weight analytical results for functionality developing priorities in a Windows-based information security monitoring tool with the AHP method. Also, Section 4 presents the correlations and similarities among decision-making opinions in the development of a Windows-based information security monitoring tool with two data-driven decision-making analytical methods. Section 5 provides more developing priority explorations for functionalities in a Windows-based information security monitoring tool and further discussion related to the correlation and similarity in decision-makers’ decision opinions. Section 6 presents a conclusion for this study and recommendations for future research.

2. Related Work

In general, hardware, software, and network assets are information assets to generate valuable information [4]. According to Dey, enterprise/organization information security primarily refers to the protection of all related assets, including hardware, networks, Internet connections, software, applications, databases, data (static and transmission), archives, directories, hardcopy reports, telephone calls, faxes, and archives [5]. Besides, end-user computer operation behaviors may influence information security effectiveness in enterprises/organizations [6]. Shropshire et al. also emphasized that, for an enterprise/organization, the understandings of user computer operation behaviors become very important [7]. Understanding end users’ security-related behaviors is a critical job for enterprises/organizations. Thus, enterprises/organizations should implement a monitoring program to monitor their employee computer systems [8]. Otero et al. mentioned that an enterprise/organization must keep implementing information security controls and measures to detect security events promptly and respond to incidents on time [9]. Stoll et al. thought that the information security technical control measures should include access control, network management, identification and authentication management, configuration management, malicious software management, and availability management [10]. Information security controls can be software or hardware functions to achieve specific information security goals—it is easy for a software tool to implement information security controls in an enterprise/organization [11]. Usually, an information security monitoring tool needs to collect the computer’s basic information in an information system.
Ahmad et al. mentioned that organizations should use a general network-monitoring tool to detect network behaviors [12]. Kurundkar et al. also proposed that an organization might use information security technology-based network behavior analysis tools to examine network traffic and identify network security problems in network traffic flow [13]. Thus, for organizations/enterprises, it is essential to develop an information security monitoring tool to monitor and analyze network behaviors in their computers. Moreover, the leakage of confidential information may not only be through computers/networks but also through printing documents. Yamada et al. thought that we could control confidential printings with a watermark [14]. Therefore, a watermark is a possible countermeasure to protect confidential printings.
Enterprises/organizations must implement information security monitoring tools to monitor the use of personal computers by employees and prevent information security incidents, which can improve the information security of enterprises/organizations. Information security monitoring, especially personal computer monitoring, involves many aspects, such as basic computer information, usage behavior, information security control, network behavior, printing control, etc. According to the above description, the following sections review the literature related to personal computer (PC) information security monitoring.

2.1. Computer Basic Information

Computer basic information represents an overview of the computer system, and it includes computer hardware, operating system, computer network, applications, multimedia technology, database technology, information security technology, etc. [15]. Hazra mentioned that an asset management tool should monitor and manage the hardware, software, network, and other information assets independently in an enterprise/organization [4]. About the basic information of a computer system, Al-Zarouni and Sanders mentioned that the computer name is one of the important computer system variables collected by a malicious script or some utilities, especially for information security tools [16]. Soubramanien et al. also mentioned that event information should include the username and computer name; usually, a malicious script can execute some malicious attacks on the computer with a specific computer name [17]. Moreover, users prefer to assign usernames on each computer system and they log on to a computer system with the usernames at any time [18]. Therefore, an information security monitoring tool should collect information about a computer name and usernames in a computer.
Generally, the hardware is the physical element of the supporting processes in a computer system: it may be several devices, including central processing unit (CPU), memory, disk drive, optical disk, and network interface card, etc. [19, 20]. The software on a computer consists of the programs, such as operating system (OS), service, maintenance or administration software, package software, or standard software [4]. For software operating continually on a computer system, it is necessary to identify patches, fixes, new versions of existing software to update the computer, and make that software available to the computer [21]. Thus, an information security monitoring tool should collect hardware and software information in a computer. Network connectivity is a necessary feature for today’s use of computer systems. Generally, the network connectivity of computer is based on its network interface card configuration [22] and its network routing settings [23]; thus, the network interface card configuration and the network routing settings of a computer are the critical essential information for a computer. Moreover, due to rapid growth in the use of electronic data processing in computer systems, information security monitoring tools require special attention to provide and deal with potential threats, vulnerabilities, and control functions [24]. Thus, an information security monitoring tool should collect the information related to network interface card configuration, network routing settings, and electronic data in a computer.
Examining the above literature, we can find that an information security monitoring tool should collect the “computer name”, “username”, “hardware information”, “software information”, “network information”, and “electronic data” as essential information of a computer.

2.2. Usage Behaviors

In general, computer usage behaviors refer to users’ operations involved in the period from power on/logon to power off/logoff, and an information security monitoring tool should collect the events related to those operations. We explore related literature in the following paragraphs.
Reference [25] mentioned that users can watch the execution behavior of application software with “process ID”. For improving the information security in an enterprise/organization, an information security monitoring tool should monitor, adjust, and document the process names and process IDs of implemented application software [26]. The file name, file path, and file type are primary information for a computer to store data, and users can access specific files from computer storage devices with that information. Also, applications use file names and file paths as the primary attributes to identify files [27]. Therefore, as well as the file name, file path, operation type, and file type are information related to user access file behavior, too [28]. Besides, software licensing uses a digital certificate [29], and some information security operations are also based on the required certificate [30]. With collected installed certificate information, information security monitoring tools can know the installed software and the handled information security operations, and indirectly understand user behavior on a computer.
CPU utilization is one indicator for us to understand users’ operation behaviors on a computer; when a malicious program invades a computer system, its operation will be different from a legitimate application related to CPU utilization [31]. Moreover, an information security management system should monitor system performance, such as hard disk utilization and input/output (I/O) load [32]. Therefore, an information security monitoring tool can detect possible information security attacks with information about CPU utilization and disk utilization.
Lim et al. identified that booting and uptime of a computer would be helpful to respond effectively to an information security incident [33]. Sbeyti used several kinds of information to observe user behavior on mobile devices, where power on/off is one such observation information [34]. Moreover, for establishing an audit trail, information security should record user operations, and the operations include user login/off a computer system [35]. Further examining user behaviors on computers, users might use mobile media devices, such as compact disc (CD), universal serial bus (USB) disk, and Digital Versatile Disc (>DVD), to improve their operations on computers, and these peripheral devices should be controlled and protected [19].
The authors of Reference [36] emphasized that users should use the system log and related logs to identify threats and detect malicious activities. Therefore, an information security tool should have functions to enable/disable system logs and related logs; then, it can access these logs to analyze users’ behaviors. Besides, when users operate computers, they often involve official information related to the business information of enterprises/organizations. Opponents can easily read such information that may be confidential through users’ careless operations. For an information security monitoring tool, keyword monitoring [37] is one possible measure to prevent classified information leakage from user operations.
From the above-discussed literature, we can find that an information security monitoring tool should record several kinds of information to understand users’ usage behaviors on a computer. That information includes “process IDs”, “file and path”, “CPU utilization”, “disk utilization”, “power on/off and logon/out”, “peripheral input/output devices”, “log”, “keyword”, and “certificate”.

2.3. Information Security Control

Information security control in a computer system may involve several control areas, such as hardware/software control, storage control, Internet control, screen control, and biometrics control.
The authors of Reference [38] thought the information security control scope for a computer should include the hardware and software of the computer. The hardware-related information security control should provide essential information on a hardware device, such as device type, device name [39], and manipulation capabilities, to enable, disable, start, and stop [40]. The software information security control should collect the information about installed software in a computer [41] and permit installing/uninstalling specified software. Moreover, the storage control involves disk drive operation and shared directory operation, the disk drive operation includes listing, adding, or removing disk drives [42], and the shared directory operation may consist of creating, deleting, and modifying a shared directory [43].
Internet control is an important information security control in an enterprise/organization. A computer system can connect to the Internet only through its network interface card(s) [44]; moreover, different types of network applications have to go through several ports to connect to the Internet [45]. Thus, Internet control should know the network interface card number in a computer and port-related information. For manipulating the Internet connections in a computer, Internet control should enable/disable some specified ports. Besides, in some enterprises/organizations, their computers prohibit connecting to the Internet; therefore, Internet control should be able to detect a specific IP address to know whether the Internet connection is available or not.
Generally, through the installation and use of the screen saver [46], users can avoid leaving their computers for a long time to prevent unauthorized persons from operating their computers. Moreover, screen capture is a usual function that can be used to capture the screen of information security incidents or monitor employees’ computer operation behaviors [47]. Because of this, the screen control should support the screen saver and screen capture functions. At last, biometrics [48] becomes more available on different types of information platforms; usually, it can be based on voice, fingerprint, iris, or face to identify the user’s identity. Since biometrics feature copying is not easy, it is a good function for a computer login operation. Therefore, biometrics may be a control function in information security control.
According to the literature related to information security control, it is significant that an information security monitoring tool should implement five functions to support the information security control in a computer system. Those functions include “hardware/software control”, “storage control”, “Internet control”, “screen control”, and “biometrics control”.

2.4. Network Behaviors and Printing Control

The authors of Reference [49] thought a computer’s traffic volume is critical information to observe user network behaviors on a computer. Some network anomalies, including flooding attacks and certain types of Denial of Service (DoS) attacks, trigger significant traffic volume changes [50]. As more web-based applications are available over the Internet, browsing history information can display the various activities performed by users on a specific website; usually, it contains a URL, a reference to a private file, or URL parameters [51]. Therefore, an enterprise/organization needs to record and analyze user browsing histories; then, it can understand the users’ browsing behaviors. Also, connection time is important information to know network applications’ connection situations, and it can show user network behaviors and detect abnormal connection behaviors over a network [52]. Thus, an information security monitoring tool should monitor the connection time of network applications. From the above literature related to network behaviors, it is significant that an enterprise/organization can observe its employees’ network behaviors with network traffic volume, browsers’ browsing history records, and the length of network connection time.
Several schemes are available for printing control, and watermark is one of the famous printing control schemes. A watermark is a specific image (mark) printed on a document periodically and repeatedly; usually, when a printer prints documentation with a watermark, the watermark shows a “confidential” string or one specific printer ID [53]. In general, users adopt a watermark scheme to control document printing in a printing apparatus, and users require to have some printing settings for watermark; usually, these settings include font, style, size, color, character set, and printing content, such as “FOR INTERNAL USE ONLY” [54]. Then, users can depend on their requirements to control the watermark on their printing apparatus. Therefore, an information security monitoring tool should have functions to manipulate watermark settings and control (e.g., enable/disable). Besides, a printing permission scheme would request user information, such as ID and password, to determine whether to permit the execution of printing or not [55]. Thus, the printing permission control might be a good scheme for an information security monitoring tool to control the printing process.
Examining the literature related to network behaviors and printing control, it is significant for an information security monitoring tool to record the information about “current network traffic volume”, “browsers’ history records”, and “connection time” to understand users’ network behaviors. Also, an information security monitoring tool should implement the “watermark setting”, “watermark control”, and “printing permission control” functions to do printing control jobs in a computer system.

3. Methodology

This study proposes an assessment model for an information security tool development to explore functionality implementation in a Windows-based information security monitoring tool. We will describe the proposed assessment model and the methods adopted in the proposed assessment model in the following subsections.

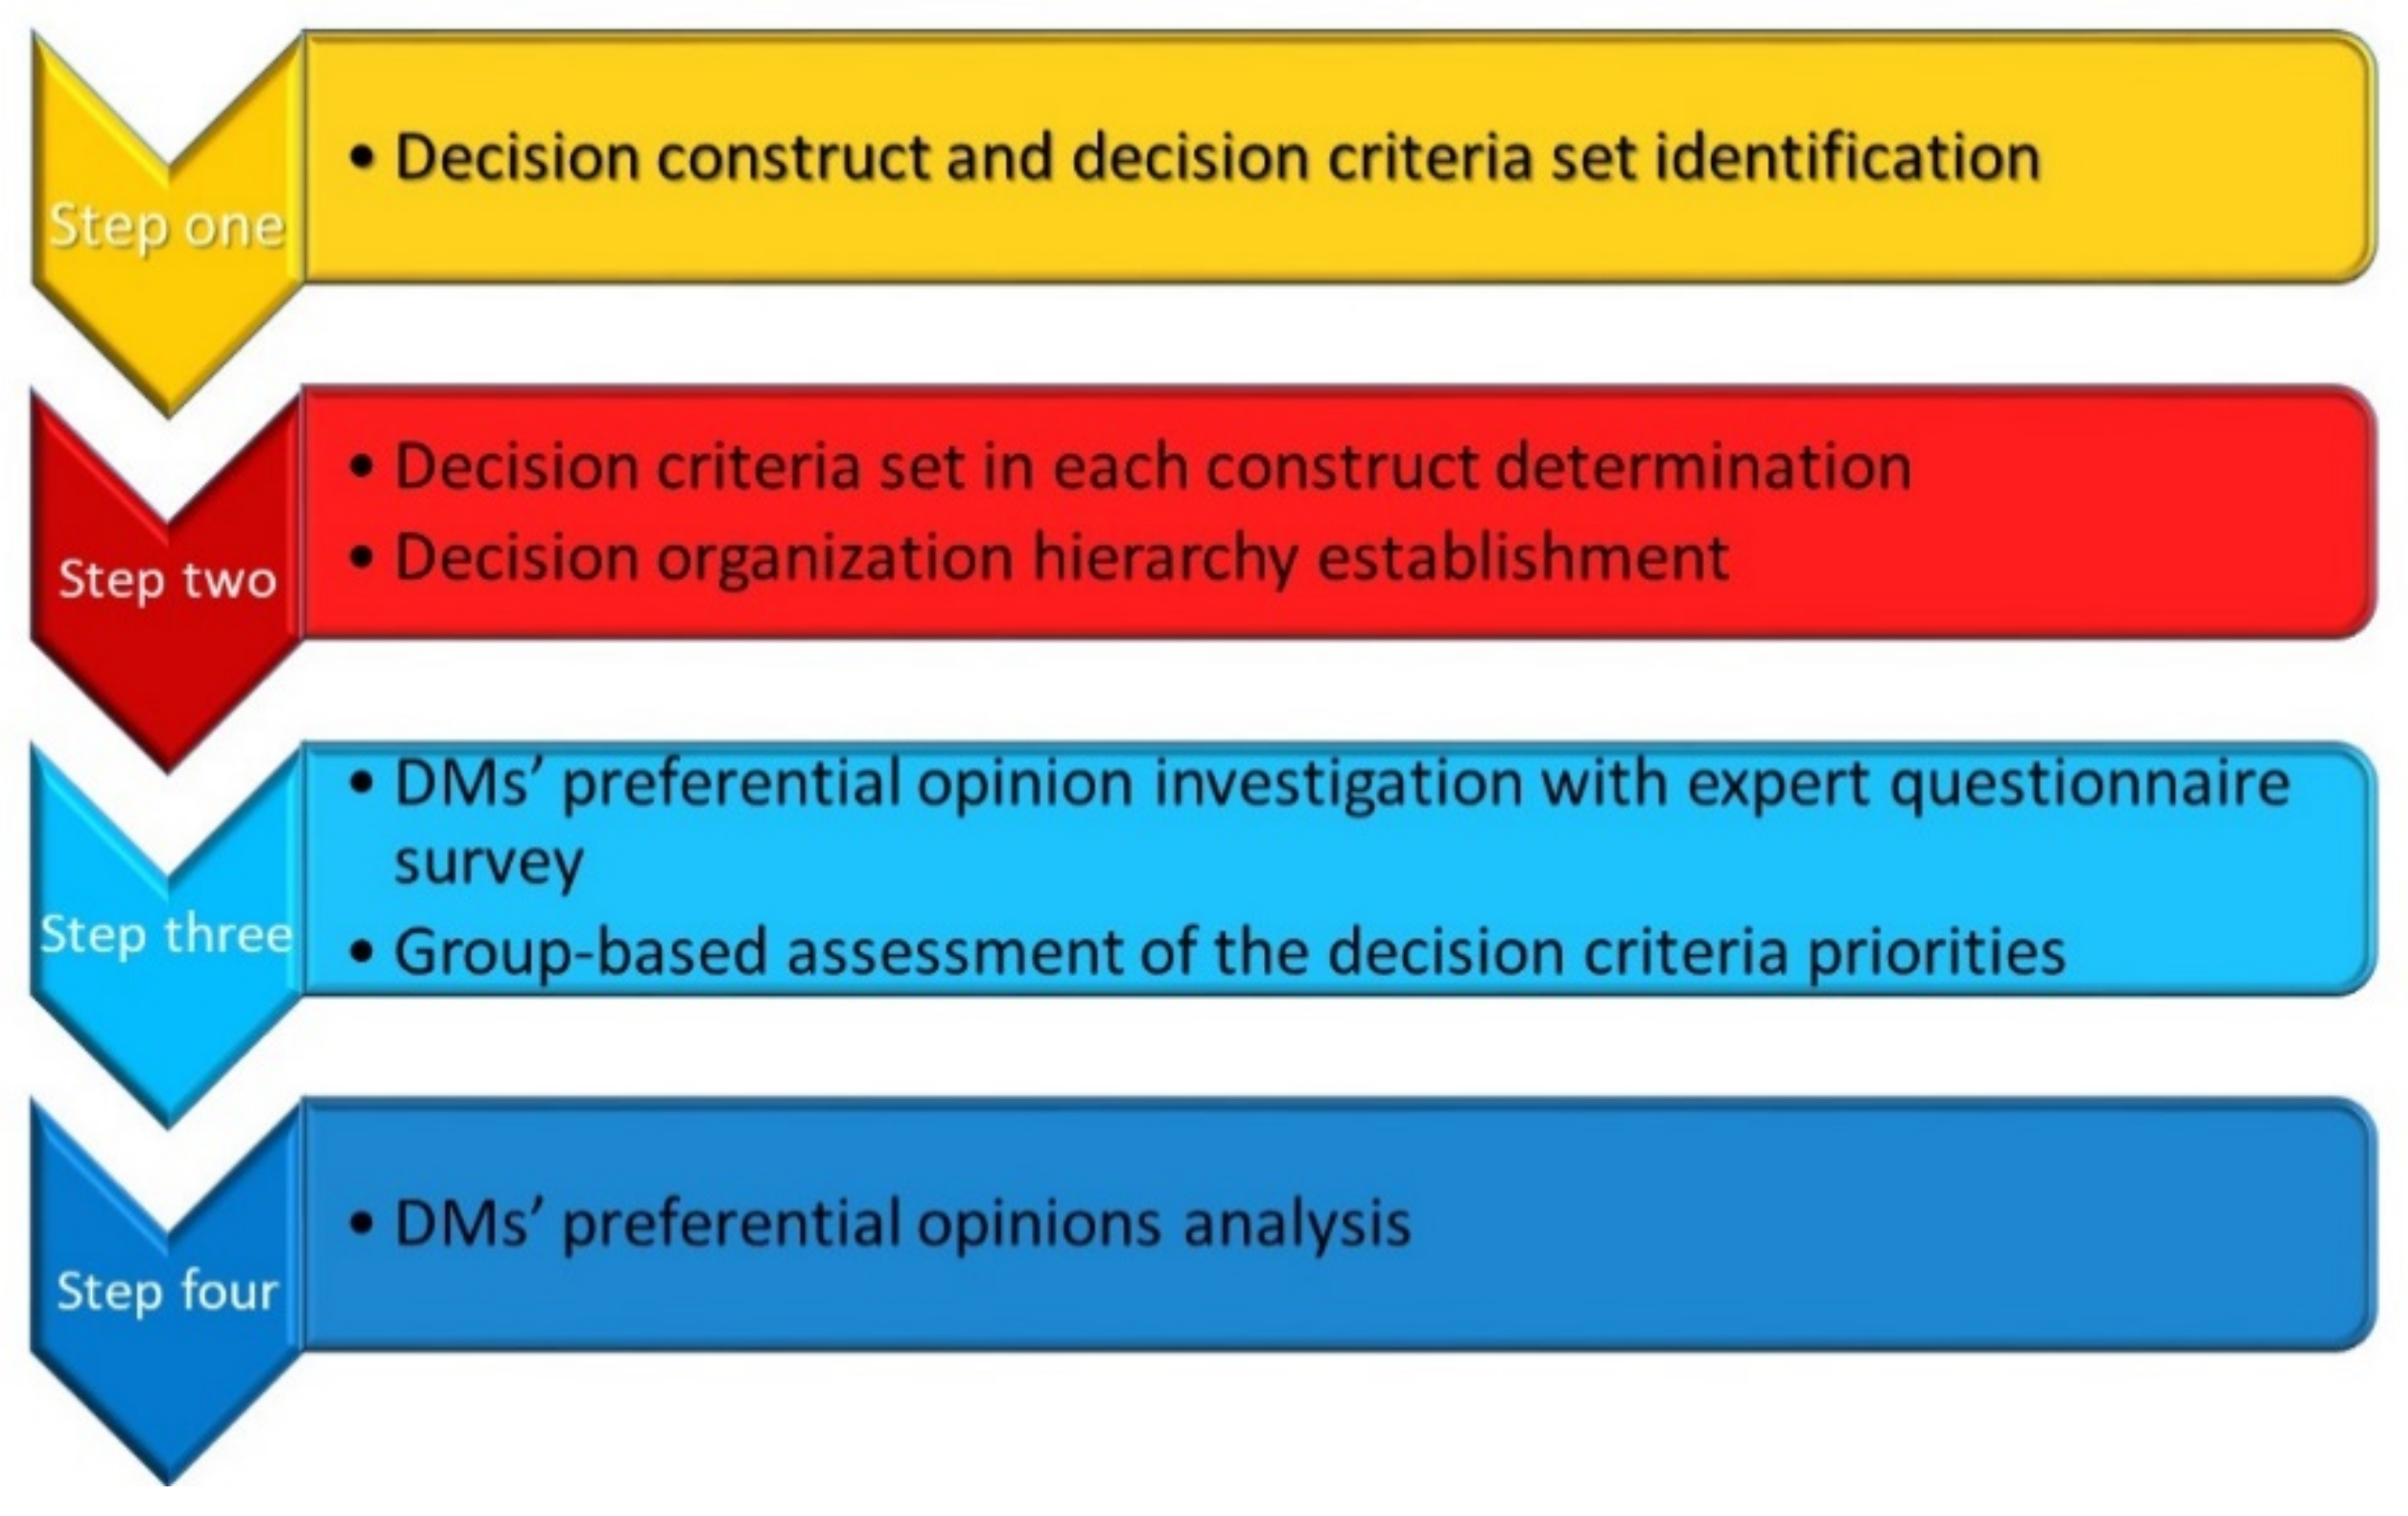
3.1. The Assessment Model for an Information Security Tool Development: Overview

The proposed assessment model organizes four fundamental steps through a systematic process and it helps explore the function’s implementation in a Windows-based information security monitoring tool. The proposed assessment model adopts several well-known methods applied to multi-attribute decision-making studies, and these methods include the literature study method, the Delphi method, the AHP method, and two data-driven decision-making analytical methods. Figure 1 shows the systematic process diagram of the assessment model for development of an information security tool, and Table 1 displays the illustration of the methods applied to each step. Besides, the following paragraphs describe how the proposed assessment model uses these famous methods.
Step one identified the decision criteria set for the study. It depended on the literature study method to survey literature related to information security monitor functions, especially for the Windows operating system. After reviewing the literature, we attempted to find out possible functionalities in a Windows-based information security monitoring tool as the decision criteria set for the proposed assessment model.
Step two confirmed the decision organization hierarchy for this study. It adopted the Delphi method to identify the relationships among the decision criteria and decision constructs first. This step consulted potential decision-makers to confirm decision criteria under each construct by email/instant message apps or face-to-face interviews. Then, it established a decision organization hierarchy for the proposed assessment model.
Step three consisted of decision-makers’ preferential opinion investigation with an AHP expert questionnaire survey and group-based assessment of the decision criteria priorities. This step used face-to-face interviews with the decision-makers and asked the decision-makers to fill out the designed AHP expert questionnaire based on the decision hierarchy. After an expert questionnaire survey, this step received each decision-maker’s preferential opinions presented by pairwise comparison matrices. This step also had a consistency check for each decision-maker’s answers; if the check result is inconsistent, this step will re-interview the decision-maker to fix his/her preferential opinions. Following the decision-maker’s preferential opinion survey, this step performed the decision criteria prioritizing phase of the AHP method to assess the relative weights of the constructs w.r.t. the total decision goal, and the relative weights of the criteria with respect to (w.r.t.) each construct, for each decision-maker. Finally, this step received the absolute weights of the criteria w.r.t. the total decision goal for all decision-makers with the AHP method.
Step four consisted of all the decision-makers’ preferential opinions analysis with two data analytical (statistical and geometrical) methods in the data-driven decision-making field. The purpose of this step is to comprehensively understand the individual preferential opinions of all decision-making experts and discover the correlations and similarities of preferential opinions of all decision-makers. This step applied the Pearson correlation and cosine distance to analyze the preferential opinions of all decision-maker experts.

3.2. The Literature Study Method

A literature review can let readers understand a researcher’s study ideas, where those study ideas include all the main aspects of a research topic and the researcher’s different viewpoints. Besides, a literature review should present all the critical and relevant thinking on certain specific study topics, and it can provide obvious evidence that the researcher has understood the previously discussed contents of literature and the researcher has made unique contributions to this research field [56]. Usually, the literature review has four purposes, as described below. First of all, a literature review helps researchers to establish the credibility of the research. Next, it allows researchers to set their research work on the research results of other researchers. Third, the citation of other researchers’ studies will make a wide variety of readers accept the researcher’s study results. Finally, the literature review determines the theoretical orientation of the study [57]. Kruse and Warbel presented a comprehensive literature study that summarizes the current research of a topic to provide new insights into the subject of a further study. In short, the purpose of a literature study is to form a framework for researchers to complete their research. That framework will provide a theoretical basis for the study, the previous studies, and the discovery of the same research topic. Researchers may adopt several different processes to write a literature review and produce a quality literature review [58]. About the literature review, Machi and McEvoy proposed six steps to help researchers successfully process a literature review [59], and the following paragraphs describe these six steps.
  • Step one: selecting the topic
Researchers should choose a study interest, then specify and focus the study interest. This step will emphasize the study topic’s description and the study framework’s setting.
  • Step two: searching the literature
Researchers should discover and select literary works through the Internet. For selected literature, the researchers may have a mapping of the study framework and refine/expand the subject of the study. The focus of this step is to explore and classify literature.
  • Step three: developing the argument
Researchers should base on the above two steps to build some arguments, evaluate them, and propose some claims for the study. The researchers may qualify and rationalize the proposed claims/arguments. The emphasis of this step is to propose the arguments/claims related to the study.
  • Step four: doing the literature survey
Researchers should assemble and record the searched literature first; next, they should integrate and analyze the literature to build evidence, claims, and reason patterns. Then, the researchers may have mappings among the arguments of discovery and analyze these arguments. Providing the arguments’ supporting profile related to the study and discovering the research’s results is the focus of this step.
  • Step five: the literature critique
Researchers should look for consensus, dissent, inconsistencies, limitations, or gaps among the searched literature, and researchers can explore the support for the study and find out the fallacy with the searched literature. This step focuses on identifying useful arguments for research and disclosing some research problems in the searched literature.
  • Step six: writing the review
After completing the survey and the searched literature’s critique, researchers can write the literature review. In general, a literature review may include several parts, such as an introduction and a body of the literature review, a background about the research, the study’s arguments, and a summary of the literature review.

3.3. The Delphi Method

In the US-sponsored military program, Norman Dalkey of the RAND Corporation developed the Delphi method in the 1950s [60]. Dalki and Helmer described the project as seeking expert advice to select the best industrial target system in the United States and estimate the number of atomic bombs needed to reduce the production of a specific quantity of ammunition [61]. The Delphi method is an iterative process, and researchers use it to collect and extract experts’ judgments with a series of questionnaires and responses. Typically, for the study design questionnaire, each subsequent questionnaire will be based on the results of the last questionnaire, and when the study gets the question’s answer, the process stops. Many industries, including medical, defense, commerce, education, information technology, transportation, and engineering, have accepted the Delphi method [60]. The Delphi method is a way to construct a group communication process that effectively allows a group of individuals to deal with complex problems as a whole. For completing this “structured communication”, the Delphi method provides several ways to deal with it: some feedback on personal information and knowledge contribution, some evaluations on group judgment or opinion, some opportunities for individuals to modify his/her views, and a certain degree of anonymity for individual reactions [62].
Reference [63] described the classical Delphi method with four main features:
  • The anonymity of Delphi participants: it allows participants to express their opinions freely without undue social pressure to conform to others’ views in the group.
  • Iteration: based on the progress of the group’s work from one round to another, it allows participants to refine their views.
  • Controlled feedback: it informs participants of other participants’ views and provides Delphi participants with an opportunity to clarify or change their views.
  • Statistical aggregation of group responses: it allows quantitative analysis and data interpretation.
Typically, the Delphi method should be adopted when an application issue has one or more of the following properties [62]:
  • The question is not suitable for precise analytical technology but can benefit from collective subjective judgment.
  • Individuals who need to contribute to the study do not have a well-communicated history and may represent different backgrounds in terms of experience or expertise.
  • In face-to-face communication, more people need to interact effectively.
  • Time and cost make frequent group meetings infeasible.
  • Supplementing the group communication process can improve the efficiency of face-to-face meetings.
  • Differences among individuals are very serious or politically unpopular; thus, it is necessary to adjudicate the communication process and (or) be anonymous.
  • It is necessary to maintain the heterogeneity of the participants to ensure the effectiveness of the outcome.
The Delphi method’s research process will be done through data collection, data analysis (based on nonparametric statistical technology), and result reporting. The Delphi method’s application scope in a research process includes research topic determination, research issue specifications, research theoretical perspective determination, interest variable selection/proposition generation, preliminary causality determination, and constructs definition and creation of a common language for discourse. A primary advantage of this method is that it avoids confrontation among experts [64].

3.4. The AHP Method

The AHP method [65] is a well-known multiple attribute decision-making research method, proposed by Saaty. The standard AHP method allows researchers to use a hierarchical organization to present the overall decision-making goals and related decision constructs with decision evaluation criteria. The popularity of the AHP method is mainly due to its effectiveness in solving real-world decision-making issues, and many hybrid models also involve the use of AHP. Recent related studies have also expanded hierarchical analysis with fuzzy set logic, for example, intuitionistic fuzzy sets.
For evaluating the preferential structure of the entire opinion group, the AHP method performs several procedures for each decision-maker, including an expert questionnaire survey, a standard criterion weight vector determination, and a consistency analysis of the decision criteria. In general, AHP assumes that comparing two criteria pairwise at one time during a questionnaire survey can state the relative importance of the involved criteria, which can be used to represent a decision construct or decision goal [66]. Therefore, users can follow the following four steps to obtain the criterion weight vectors in a pairwise comparison matrix.
Step one, the evaluation results will form a pair of comparison matrices, Mnxn, where n is the number of decision evaluation criteria, as shown in Equation (1):
M = m 11 = 1 m 12 m 1 n m 21 m 22 = 1 m n 1 m n n = 1 , i , j , i j , m i j 1 9 , 1 7 , 1 5 , 1 3 , 1 , 3 , 5 , 7 , 9
Step two, users can use the following process to determine the criterion weight vector (i.e., where the element is a standard weight of a criterion concerning the constructs/goal). From the data shown in the above-mentioned square matrix, M, the expression shown in Equation (2) can calculate the columns and vectors of this matrix [66]:
V = i = 1 n m i 1 i = 1 n m i 2 i = 1 n m i n ( 1 × n )
Step three, users can use these vector elements to divide each column in the square matrix, M, to get another square matrix, M’, as shown in Equation (3):
M = m 11 = 1 / i = 1 n m i 1 m 12 = m 12 / i = 1 n m i 2 m 1 n = m 1 n / i = 1 n m i n m 21 = m 21 / i = 1 n m i 1 m 22 = 1 / i = 1 n m i 2 m n 1 = m n 1 / i = 1 n m i 1 m n n = m n n / i = 1 n m i n
Step four, users can obtain the criterion weight vector of a pairwise comparison matrix, M, by calculating the row sum vector of M’ [66]. Equation (4) shows the expression of the criterion weight vector:
C W V = j = 1 n m 1 j j = 2 n m 2 j j = 1 n m n j T
Also, consistency analysis is a critical part of the AHP method. It checks whether the decision-maker’s opinions on the expert questionnaire are consistent or not; through the transitive logic, we can check the consistency of the surveyed expert questionnaire. If the decision-maker states that C1 > C2 and C2 > C3 on the questionnaire and the pairwise comparison matrix records these decision-making results, we will hope that we can find in the matrix that C1 > C3, that preserves the transitive property, where C1, C2, and C3 are some decision criteria to be compared. If we find C3 > C1, then this situation would be called inconsistent [67].
About AHP consistency analysis, Saaty only accepted a pairwise comparison matrix as consistent if the consistency ratio (CR) < 0.1 (CR < 10%) of the pairwise comparison matrix. For calculating decision-maker opinion consistency, Saaty suggested that users can use the right eigenvector to measure the consistency with the following equations [68]:
C R = C I R I
C I =   λ m a x     N N 1
where CR is the consistency ratio,
CI is the consistency index,
RI is the random index,
λmax is the maximum eigenvalue of the pairwise comparison matrix,
N is the number of elements being compared to the pairwise comparison matrix,
RI is the average value of CI for randomly generated matrixes of the same order.
Although the AHP method has been proposed for 50 years, it is still one of the primary methods for multiple attribute decision-making types of research in recent years because of the method’s long-lasting popularity. Therefore, the AHP method remains an appropriate method for this study to explore the primary quantitative knowledge of information security monitoring functionality, as it has been and remains a reliable method.

3.5. The Pearson Correlation Coefficient and the Cosine Distance

In the multiple criteria decision-making studies, the Pearson correlation coefficient and the cosine distance are well-known tools to explore correlation and similarity among decision-makers’ decision opinions. This study used these two analytical tools to explore correlation and similarity among decision-makers’ decision opinions in a Windows-based information security monitoring tool.

3.5.1. The Pearson Correlation Coefficient

Pearson correlation coefficient, also known as Pearson r, is a statistical data tool used to measure the linear correlation between two variables, X and Y, with values between 1 and –1, 1 for total positive linear correlation, 0 for no linear correlation, and –1 for totally negative linear correlation. The Pearson correlation coefficient was defined by Karl Pearson in 1895 [69]. The Pearson correlation coefficient's definition is the product of two variables’ covariance divided by their standard deviation. When applying the Pearson correlation coefficient to a sample, we use rxy to represent a sample correlation coefficient (Pearson correlation coefficient). We can obtain formula rxy by replacing the sample-based covariance and variance estimates in the following formula. Given that the paired data {(x1, Y1),..., (Xn, Yn)} consists of n pairs, Equation (7) shows the definition of rxy:
r x y =   i = 1 n x i x ¯ y i y ¯ i = 1 n x i x ¯ 2   i = 1 n y i y ¯ 2
where {\displaystyle n}n is sample size,
xi, yi{\displaystyle x_{i},y_{i}} are the individual sample points indexed with I,
  x   ¯ = i = 1 n x i n {\displaystyle {\bar {x}}={\frac {1}{n}}\sum _{i=1}^{n}x_{i}} x ,   y   ¯ = i = 1 n y i n (the sample mean).
Zhou et al. mention that the value of the Pearson correlation coefficient is between –1 and 1. Y increases with X when the Pearson correlation coefficient value is equal to 1, Y decreases with X when the Pearson correlation coefficient value is equal to –1, and there is no linear relationship between X and Y when its value is equal to 0 [70]. Furthermore, Pearson correlation coefficients are positive if Xi and Yi fall on the same side of their respective averages. Pearson's correlation coefficients are negative if Xi and Yi tend to fall on opposite sides of their respective averages. Therefore, if the Pearson correlation coefficient sign is positive, there is a positive correlation between X and Y, and if the Pearson correlation coefficient sign is negative, there is a negative correlation between X and Y [71]. Table 2 lists the Pearson correlations’ strength.

3.5.2. The Cosine Distance

The cosine distance is one of the similarity measures widely used in information retrieval applications, and it also measures cohesion within clusters in the data-mining field. Cosine similarity is an indicator of distance measurement, and cosine matching measures the similarity of two non-zero vectors. The parametric cosine model is a similarity function, not a distance function. In general, a higher value of a cosine model means closer similarity among the two vectors. The basic concept behind the parametric cosine model comes from the cosine function used in the text database [73]. The principle of cosine measurement is that two vectors in the same direction have a cosine similarity of 1, two vectors with a relative 90 degrees have a similarity of 0, and two opposed vectors have a similarity of −1. Therefore, when measuring 0 or no angle, the highest value of cosine is 1. If it has an angle, its value is lower than 1. When two values are parallel, the angle difference is 0, the two vectors have similarities, and there is no similarity when they are vertical. In some studies, they used the cosine method to compare the data impostor with the real data generated from test data or evaluation data [74]. The following equation displays the formula of cosine distance:
C o s i n e X ,   Y =   X · Y X Y   =   i = 1 n X i Y i i = 1 n X i 2 i = 1 n Y i 2
where X = (x1 . . . xn) and Y = (y1 . . . yn).
In general, cosine distance is an indicator that considers the relevance of feature vectors; it is a similarity function, where a higher value implies a closer similarity [75]. Therefore, the cosine similarity is close to 1.0 when the two feature vectors become more similar; otherwise, the cosine distance is close to 0.0 when the two feature vectors become less similar [76].

4. Study Results of the Assessment Model for Development of an Information Security Tool

With decision-makers’ preferential opinions, this study follows the study steps of the proposed assessment model in Section 3 to explore functionalities in a Windows-based information security monitoring tool. In the following subsections, we will present the study results of the proposed assessment model’s steps.

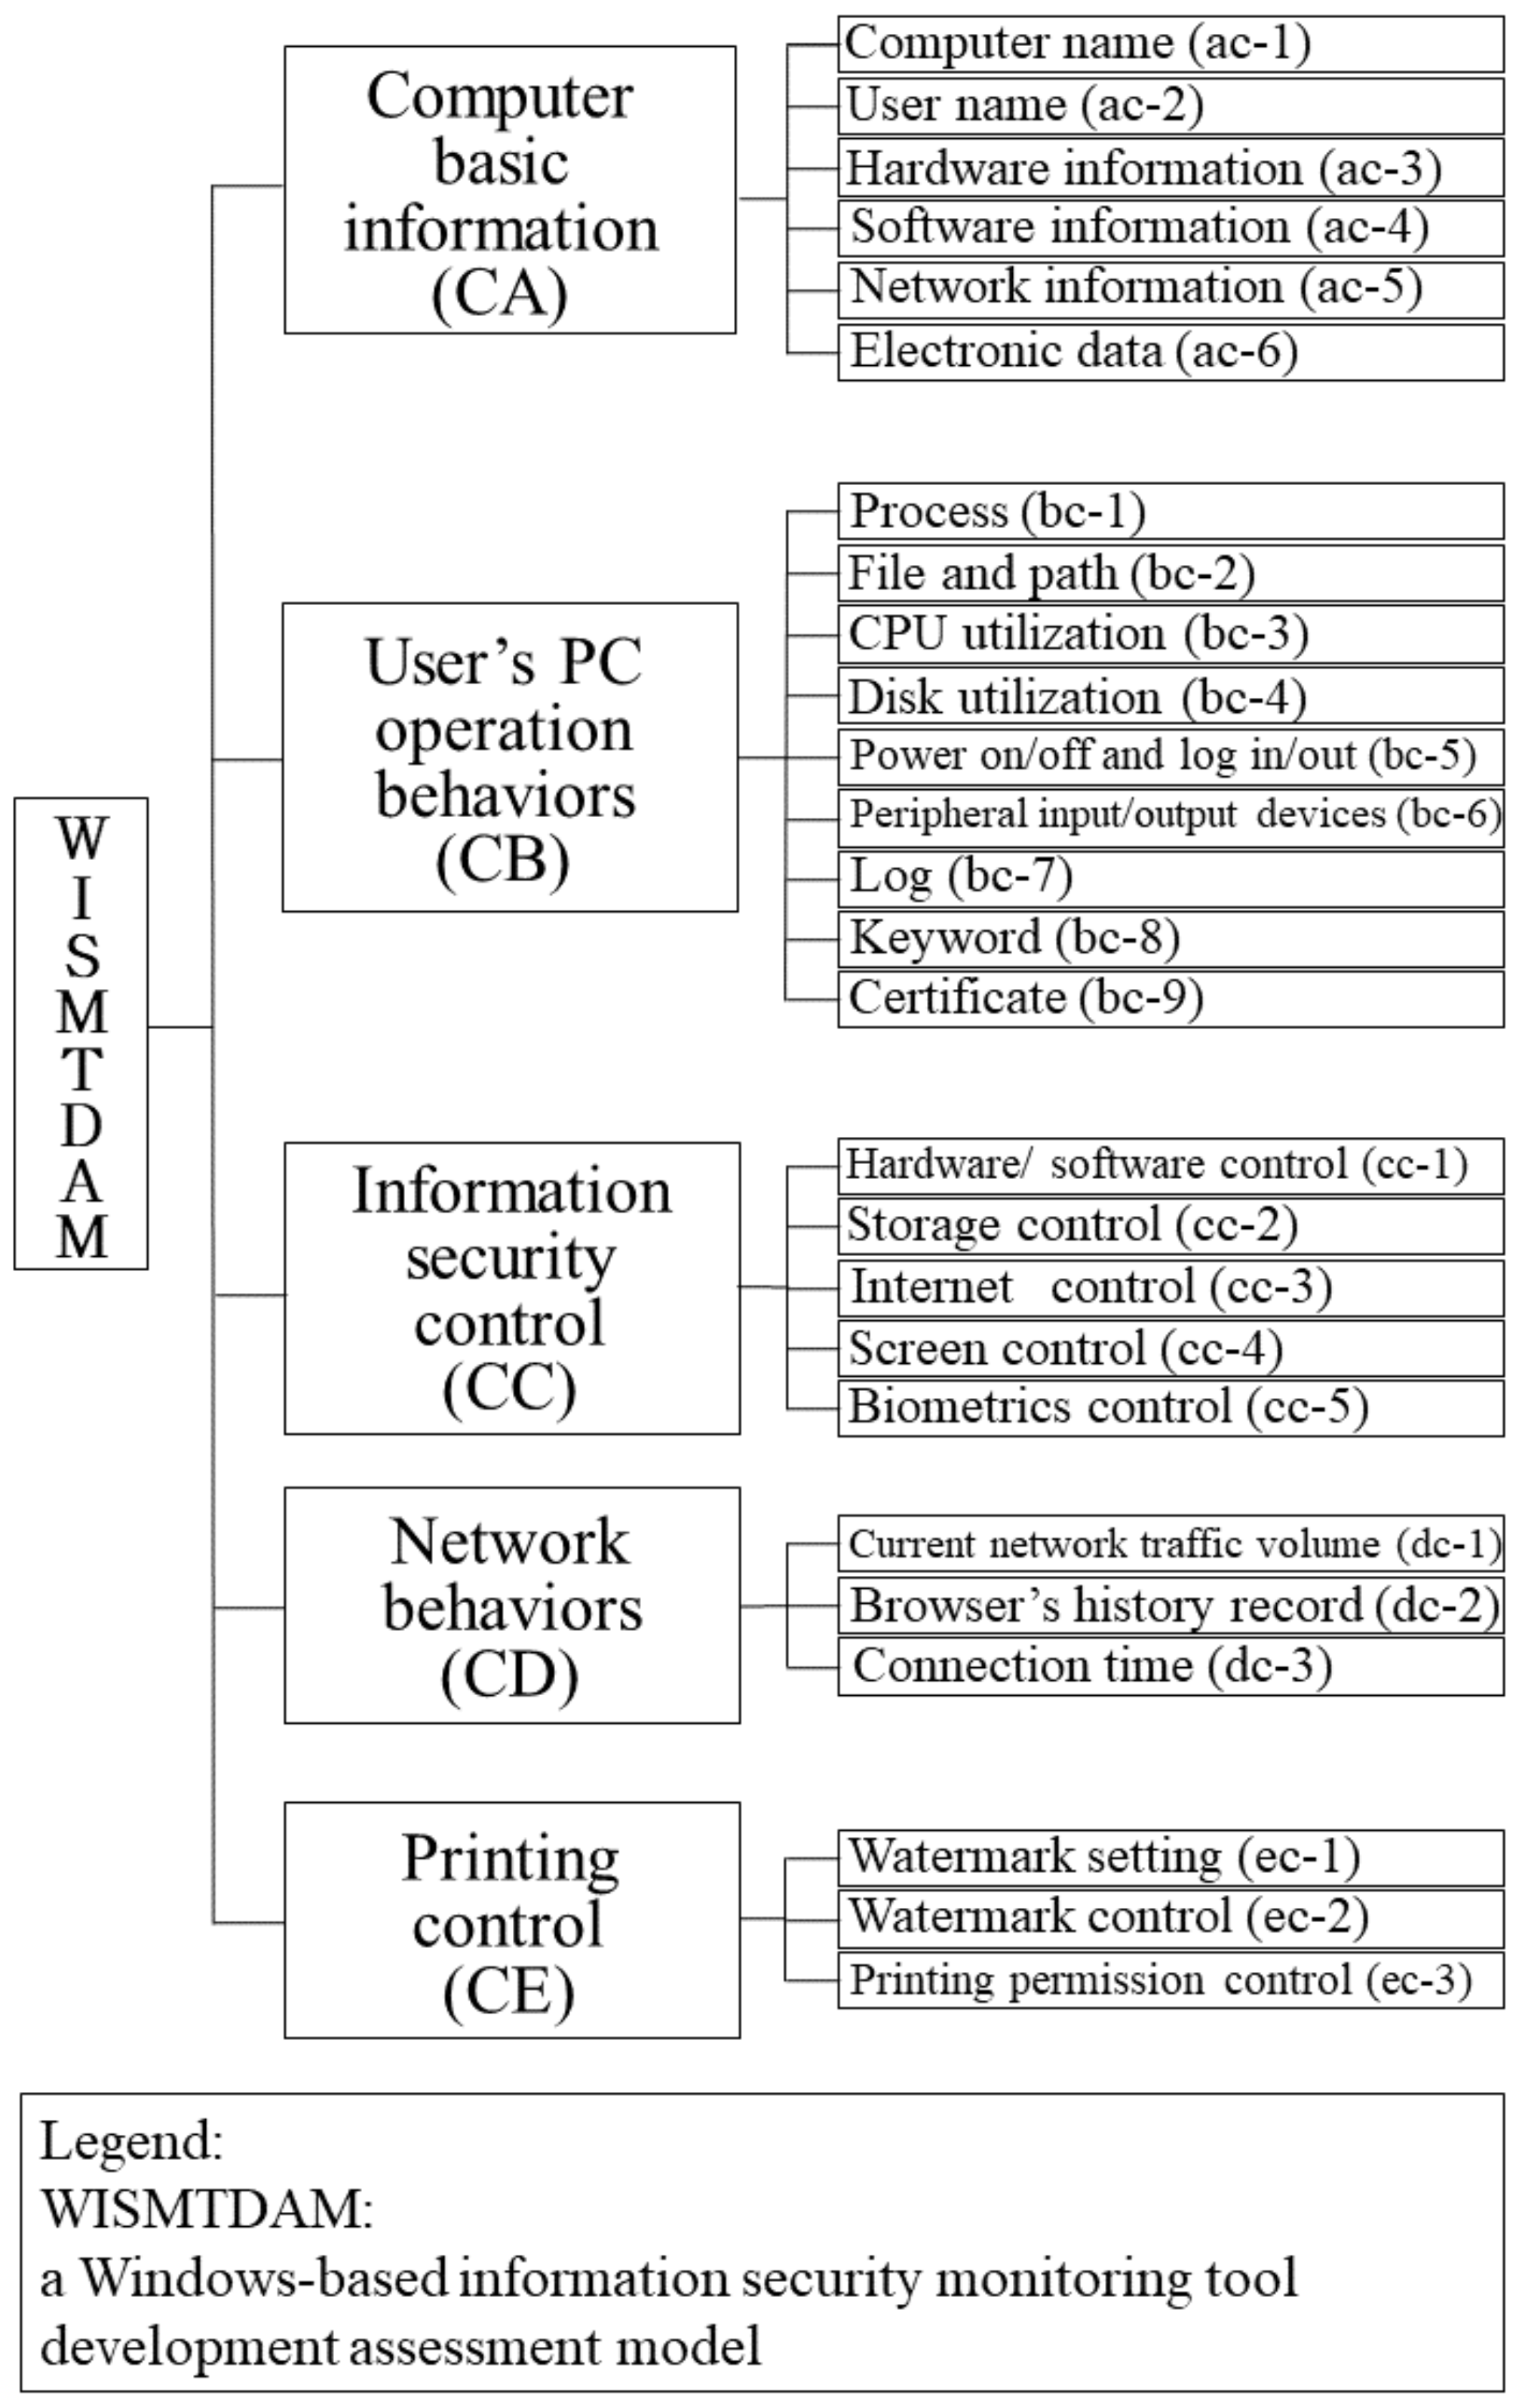
4.1. The Decision Criteria Hierarchy Establishment in the Proposed Assessment Model

In this subsection, this study followed steps one and two in the proposed assessment model to establish the decision criteria hierarchy for the proposed assessment model with the literature study method and the Delphi method. First, this study depended on the literature study method to collect the literature related to information security monitoring functionality. Through the literature survey, this study found that the Windows-based information security monitoring tool should implement twenty-six critical monitoring functions to monitor the computer use behavior of employees in enterprises/organizations. The study then used the Delphi method to consult several experts/potential decision-makers on 26 monitoring functions in a literature survey to see if they could become a set of decision criteria in the proposed assessment model. This study identified that the Windows-based information security monitoring tool should cover the five main functions, “computer basic information”, “user’s PC operation behavior”, “information security control”, “network behavior”, and “printing control”. Those five main functions would be the decision constructs in the proposed assessment model. Finally, this study used the Delphi method to determine the corresponding relationship between the five main functions and the twenty-six monitoring functions. According to this mapping relationship, this study organized the decision criteria hierarchy for the proposed assessment model. Table 3 lists the operational definitions of these 26 decision criteria, and Figure 2 shows the decision criteria hierarchy diagram in the proposed assessment model.

4.2. The AHP Survey Works in the Proposed Assessment Model

This study followed step three in the proposed assessment model to survey decision-makers’ preferential opinions of the decision criteria. First, this study depended on the confirmed decision criteria hierarchy to design an AHP expert questionnaire. This study used the AHP expert questionnaire to survey all decision-makers and fill in the two by two comparison matrix of decision criteria as the source of the analysis dataset, and analyze the consistency of each decision-maker’s preferential opinions. From 17 June to 20 July 2020, this study interviewed twelve decision-makers to answer the AHP expert questionnaire. The twelve decision-makers work in the government, academic, research and development (R&D) institutions, and the information industry. They all have a Ph.D. in information-related fields and have professional knowledge and background in information security. Therefore, those decision-makers can provide professional preferential opinions for the proposed assessment model to explore the decision-making structure and decision-making criteria for a Windows-based information security monitoring tool’s development. Eight of them are male and four are female. One is a supervisor in an information department, five are professors, and six are information professionals, and their ages are between 31 and 65. Finally, as for service time, seven of them have between 1 and 21 years, and five have over 21 years. Table 4 lists the background statistics of the twelve interviewed decision-makers.
In each interview, this study asked each decision-maker to answer the six designed AHP-style expert questionnaires, one for comparing the importance in the main decision constructs set, while five for comparing the significance in the decision criteria under each decision construct. In each face-to-face interview, this study brought a notebook computer with the Expert Choice software installed. In each round of interviews, this study recorded the pairwise comparison questions’ answers in the AHP expert questionnaires directly with the Expert Choice. After receiving six pairwise comparison matrixes from each decision-maker in each round of interviews, this study used the Expert Choice to perform a consistency analysis for each pairwise comparison matrix. If there was inconsistency in a pairwise comparison matrix, i.e., inconsistency index > 0.10 (default threshold), this study would ask the decision-maker to adjust his/her decision criteria preferential opinions and have a consistency test with the Expert Choice again. This adjusting decision criteria preferential opinion process would continue with the decision-maker until we got a consistent result for each pairwise comparison matrix. In each decision-maker interview, the pairwise comparison matrices of the six designed AHP-style expert questionnaires should have passed the consistency check.
The interview result showed that all decision-makers had 1~5 rounds of interviews to pass all AHP questionnaires’ consistency checks. After reviewing all decision-makers interview processes, we can find that most decision-makers could pass the consistency check easily in a round of interviews when they answered their preferential opinions with less than five decision criteria. Otherwise, most decision-makers passed the consistency check in 2~5 rounds of interviews, especially for the “user’s PC operation behavior” construct (9 decision criteria in this construct).

4.3. The AHP Analysis Results

This study obtained the priority vectors of the construction and decision criteria under each decision construct in the proposed evaluation model’s decision criteria hierarchy after the AHP investigation. In this step, the study used the “synthesize” function in the Expert Choice to aggregate all decision-makers’ individual preferential opinions. This study received the relative weight value of decision criteria in the decision criteria hierarchy of the proposed evaluation model, and the relative weight value of decision criteria under each decision construct, as well as the overall priority and absolute weight value of all decision criteria in the proposed assessment model’s decision criteria hierarchy.

4.3.1. The AHP Analytical Result about the Main Decision Constructs

This study received the aggregated criterion weight vectors for/among the five decision constructs under the total design decision goal. Table 5 lists the relative weights of these five decision constructs (i.e., decision construct CA, CB, CC, CD, and CE).
Examining Table 5, we can find that the CC, CD, and CB are the three most significant decision constructs for the proposed assessment model—the relative weight sum of those three decision constructs is over 86%. Relatively, the CE and CA are less critical decision constructs for the proposed assessment model—the relative weight sum of those two constructs is less than 14%. From this analytical assessment result, we can see that the three main functions, “information security control”, “network behavior”, and “user’s PC operation behavior”, should get higher developing priorities in the development of a Windows-based information security monitoring tool.

4.3.2. The AHP Analytical Result about the Decision Criteria under the Construct CA

This study obtained the aggregated criterion weight vectors for/among the six decision criteria under the construct CA. Table 6 lists the relative weights of these six decision criteria (i.e., ac−1, ac−2, ac−3, ac−4, ac−5, and ac−6).
Looking over Table 6, we can find that the ac-5, ac-4, ac-3, and ac-1 are the four most significant decision criteria, and the relative weight sum of those four decision criteria is 89.7%, and the ac-6 and ac-2 are less critical decision criteria, and the relative weight sum of those two decision criteria is 10.3%. This result shows that the functionalities related to “network information”, “software information”, “hardware information”, and “computer name” should receive higher development priority in the “computer basic information” main function.

4.3.3. The AHP Analytical Result about the Decision Criteria under the Construct CB

This study obtained the aggregated criterion weight vectors for/among the nine decision criteria under the construct CB. Table 7 lists the relative weights among these nine decision criteria (i.e., bc-1, bc-2, bc-3, bc-4, bc-5, bc-6, bc-7, bc-8, and bc-6).
Examining Table 7, we can find that the bc-7, bc-1, bc-2, bc-9, bc-5, and bc-6 are the six most significant decision criteria, and the relative weight sum of those six decision criteria is 89.4%, and the bc-8, bc-3, and bc-4 are less critical decision criteria, and the relative weight sum of those three decision criteria is 10.6%. This result means that the functionalities, “log”, “process”, “file and path”, “certificate”, “power on/off and log in/out”, and “peripheral input/output devices”, should get a higher developing priority in the “user’s PC operation behavior” main function.

4.3.4. The AHP Analytical Result about the Decision Criteria under the Construct CC

This study obtained the aggregated criterion weight vectors for/among the five decision criteria under the construct CC. Table 8 lists the relative weights of these five decision criteria (i.e., cc-1, cc-2, cc-3, cc-4, and cc-5).
Looking over Table 8, we can see that the cc-3, cc-1, cc-2, and cc-4 are the top four significant decision criteria, and the relative weight sum of those four decision criteria is 94.6%, and the cc-5 is less critical decision criterion, and the relative weight of this decision criterion is 5.4%. This result reveals that the “Internet control”, “hardware/software control”, “storage control”, and “screen control” decision criteria should receive higher developing priorities in the “information security control” main function.

4.3.5. The AHP Analytical Result about the Decision Criteria under the Construct CD

This study obtained the aggregated criterion weight vectors for/among the three decision criteria under the construct CD. Table 9 lists the relative weights of these three decision criteria (i.e., dc-1, dc-2, and dc-3).
Looking over Table 9, we can find that the dc-2 and dc-1 decision criteria are the top two significant decision criteria, and the relative weight sum of these two decision criteria is 91.7%, and the dc-3 is the least significant decision criterion, and the relative weight of this decision criterion is 8.3%. This result means that the functionalities, “browser’s history record” and “current network traffic volume”, should receive a higher developing priority in the “network behaviors” main function.

4.3.6. The AHP Analytical Result about the Decision Criteria under the Construct CE

This study obtained the aggregated criterion weight vectors for/among the three decision criteria under the construct CE. Table 10 lists the relative weights of these three decision criteria (i.e., ec-1, ec-2, and ec-3).
Examining Table 10, we can find that the ec-2 and ec-1 are the two most significant decision criteria, and the relative weight sum of those two decision criteria is 88.3%, and the ec-3 is the least critical decision criterion, and the relative weight of this decision criterion is 11.7%. This result means that the functionalities, “watermark control” and “watermark setting”, should get higher developing priorities in the “printing control” main function.

4.3.7. The AHP Analytical Result about the Overall Decision Criteria Priority

This study used the “synthesize” function in the Expert Choice to obtain the aggregated criterion weight vectors for/among the overall decision criteria under the decision goal. Table 11 shows the sorted absolute weights of the total decision criteria under the decision goal.
Depending on the decision criteria’s absolute weights shown in Table 11, we divide all decision criteria into five groups. The dc-2, cc-3, cc-1, bc-7, and cc-2 decision criteria are the most critical group—all the absolute weights of these five decision criteria are >7%, and the absolute weight sum of these five decision criteria is 54.5%. The functionalities (“browser’s history record”, “Internet control”, “hardware/software control”, “log”, and “process”) related to these five decision criteria should receive the first developing priority. The dc-1, bc-1, cc-4, bc-2, and ec-2 decision criteria are the second most significant group—all the absolute weights of these five decision criteria are >3%, and the absolute weight sum of these five decision criteria is 21.0%. The functionalities (“current network traffic volume”, “process, screen control”, “file and path”, and “watermark control”) related to these five decision criteria should receive the second developing priority. The ac-5, bc-9, ac-4, dc-3, bc-5, and bc-6 decision criteria are the third most significant group—all the absolute weights of these six decision criteria are >2%, and the absolute weight sum of these six decision criteria is 14.5%. The functionalities (“network information”, “certificate”, “software information”, “connection time”, “power on/off and log in/out”, and “peripheral input/output devices”) related to these six decision criteria should receive the third developing priority. The ec-1, cc-5, bc-8, and ac-3 decision criteria are the second least significant group—all the absolute weights of these four decision criteria are >1%, and the absolute weight sum of these four decision criteria is 6.4%. The ac-1, bc-3, bc-4, ac-6, ec-3, ac-6, and ac-2 decision criteria are the least significant group—all the absolute weights of these six decision criteria are <1%, and the absolute weight sum of these five decision criteria is 3.9%. The functionalities related to the less critical groups should receive a lower developing priority. Therefore, for a Windows-based information security monitoring tool, the functionalities should be based on their significances, i.e., the absolute weights of the decision criteria, to receive their corresponding developing priorities.

4.4. The Decision Opinion Correlation and Similarity Analysis

In this subsection, this study depended on the criterion weight vectors of decision-makers (i.e., the priorities of decision constructs and the priorities of relevant decision criteria in the five decision constructs) to analyze the similarities and differences among decision-makers. First, this study took the AHP analysis results of all decision-makers (shown in Table 12) recorded in the Expert Choice to convert the xlsx file type. Then, this study received six xlsx files about whole decision-makers’ criterion weight vectors: one is about the decision goal and the other five are about the CA~CE decision constructs. With these six xlsx files, this study used the Orange software tool, a well-known data-mining software, to perform correlation and similarity analysis in the decision-makers’ decision opinions and visually present the analytical results.

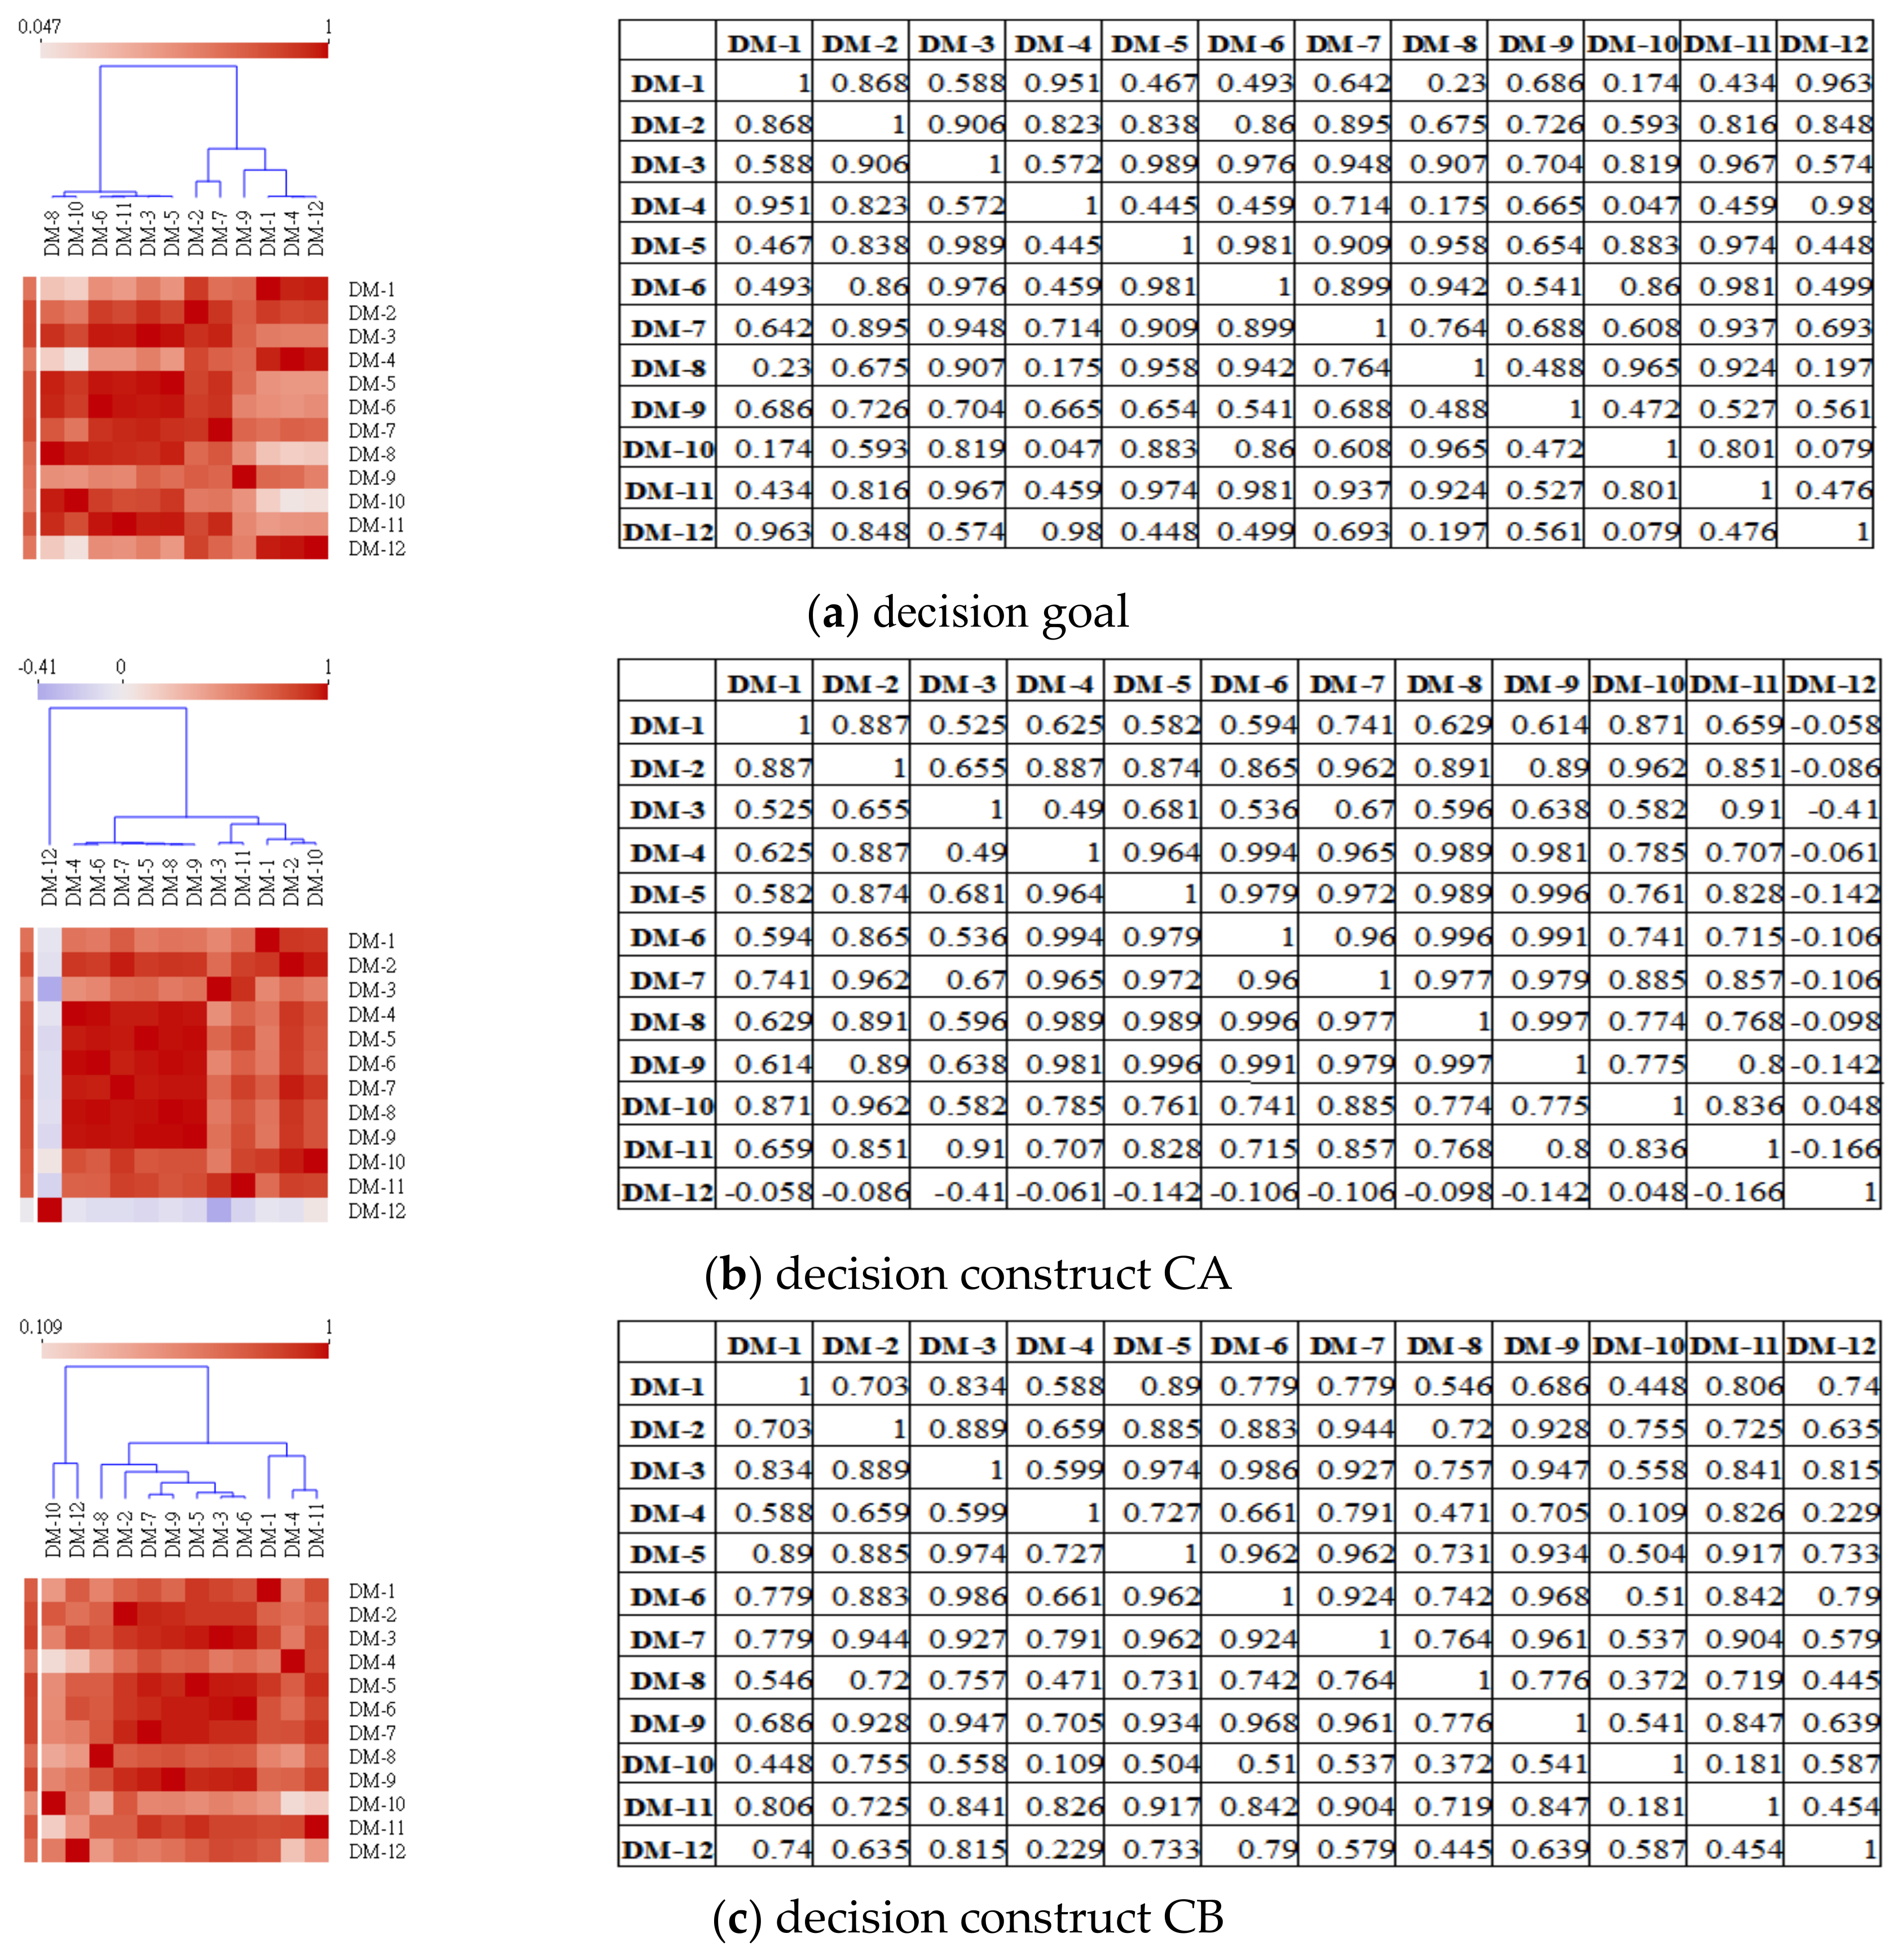
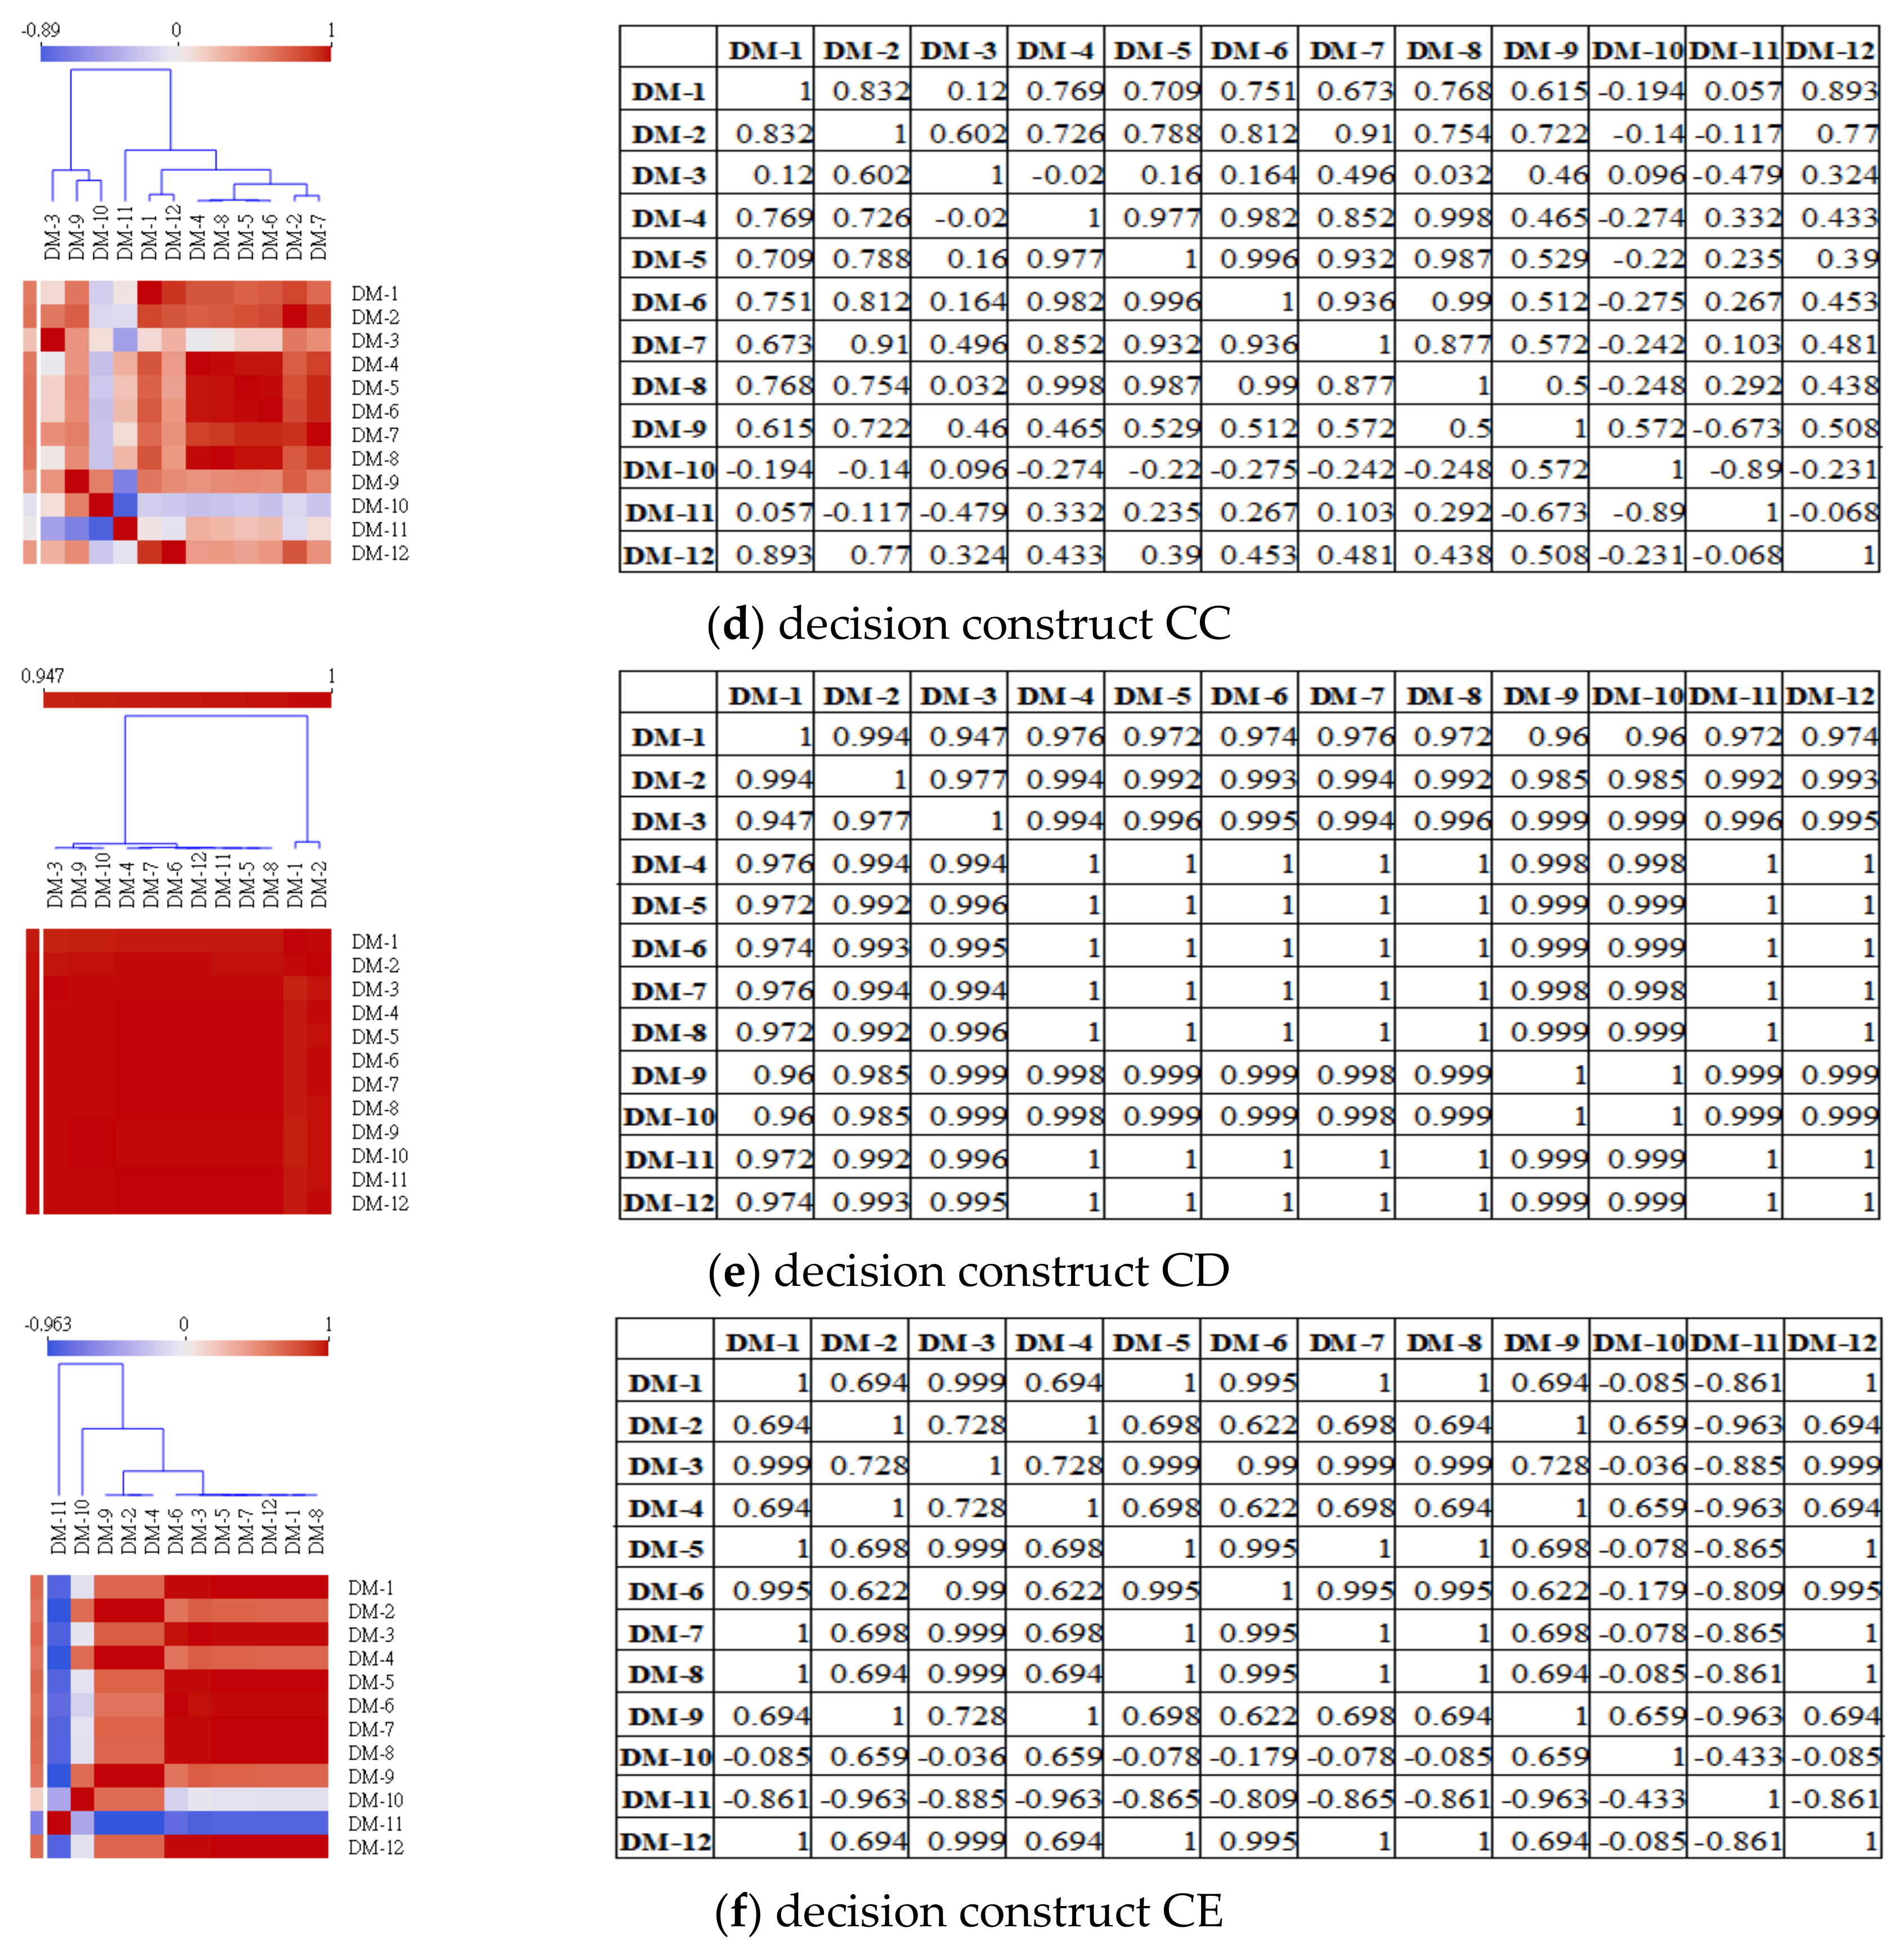
4.4.1. The Correlation Analysis for the Decision-Makers’ Decision Opinions

In this subsection, this study was based on six xlsx files shown in Table 12 to analyze all decision-maker decision-making opinions. First, this study used the “correlation” function in Orange to obtain the Pearson correlation coefficients of all decision-makers’ decision opinions related to the decision goal and the five decision constructs. Then, this study used the “heat map” function in Orange to show the correlation between the decision-making opinions of the decision-makers on the decision goal and the five decision constructs.
Figure 3 shows the heat maps and the Pearson correlation coefficients upon the correlations between decision-makers’ opinions (criterion weight vectors) in the decision goal and under the five decision constructs. Looking at Figure 3a, we can find that all decision-makers’ decision opinions in the decision goal are positively correlated, and there exist two decision opinion groups: group 1 contains the DM-8, DM-10, DM-6, DM-11, DM- 3, and DM-5, and group 2 includes the DM-2, DM-7, DM-9, DM-1, DM-4, and DM-12. Table 13 lists the correlation proportion among all the decision-makers’ decision opinions in the decision goal. It shows that all the decision-makers’ decision opinions are positively correlated in the decision goal, and very high/high/moderate positive correlations exist among nearly three-quarters of decision-makers’ decision opinions. Finally, the top five Pearson correlation coefficient rankings of pairs of decision-makers in the decision goal are the (3,5), (6,11), (5,6), (4,12), and (3,6).
Examining Figure 3b, we can see that only the DM-12′s decision opinions are negative in a correlation, while the other eleven decision-makers’ decision opinions are positively correlated under the decision construct CA. There exist two decision opinion groups among the eleven decision-makers: group 1 contains the DM4, DM-6, DM-7, DM-5, DM-8, and DM-9, and group 2 contains the DM-3, DM-11, DM-1, DM-2, and DM-10. Table 14 lists the correlation proportion among all decision-makers’ decision opinions under the decision construct CA. It shows that only one decision-maker (the DM-12) has little/low negative correlation with the other eleven decision-makers, while there are very high/high/moderate positive correlations among those eleven decision-makers. Finally, the top five Pearson correlation coefficient rankings of pairs of decision-makers under the decision construct CA are the (8,9), (5,9), (6,8), (4,6), and (6,9).
Looking over Figure 3c, we can find that all the decision-makers’ decision opinions under the decision construct CB are positively correlated, and there exist two decision opinion groups: group 1 contains the DM-10 and DM-12, and group 2 contains the DM-8, DM-2, DM-7, DM-9, DM-5, DM-3, DM-6, DM-1, DM-4, and DM-11. Table 15 lists the correlation proportion among all the decision-makers’ decision opinions under the decision construct CB. It shows that all the decision-makers’ decision opinions are positively correlated under the decision construct CB, and very high/high/moderate positive correlations exist among most of the decision-makers’ decision opinions. Finally, the top five Pearson correlation coefficient rankings of pairs of decision-makers under the decision construct CB are the (3,6), (3,5), (6,9), (5,7), and (5,6).
Viewing Figure 3d, we can see that positive correlations exist among some of the decision-makers’ decision opinions under the decision construct CC, and that negative correlations exist in some of the decision-makers’ decision opinions. There are two decision opinion groups: group one contains the DM-3, DM-9, and DM-10, and group two contains DM-11, DM-1, DM-12, DM-4, DM-8, DM-5, DM-6, DM-2, and DM-7. Table 16 lists the correlation proportion among all the decision-makers’ decision opinions under the decision construct CC. Table 16 shows that under the decision dimension CC, nearly 80% of the decision-makers’ decision opinions have positive correlations, and more than 20% of the decision-makers’ decision opinions have negative correlations. Especially in the decision-making opinions of the decision-makers, the decision-making opinions of the two decision-makers (DM-10 and DM-11) are mostly different from those of other decision-makers. Finally, the top five Pearson correlation coefficient rankings of pairs of decision-makers under the decision construct CC are the (4,8), (5,6), (6,8), (5,8), and (4,6).
Looking over Figure 3e, we can find that all the decision-makers’ decision opinions under the decision construct CD are very positively correlated, and there exist two decision opinion groups: group one contains the DM-3, DM-9, DM-10, DM-4, DM-7, DM-6, DM-12, DM-11, DM-5, and DM-8, and group two contains DM-1 and DM-2. Table 17 lists the correlation proportion among all the decision-makers’ decision opinions under the decision construct CD, and it shows that all the decision-makers’ decision opinions have very high positive correlation strength under the decision construct CD. Besides, further examining the pairs of decision-makers’ Pearson correlation coefficients, we can find that twenty-two pairs of decision-makers received the closest correlations with the Pearson correlation coefficients = 1. A total positive linear correlation exists in their decision opinion sets. These twenty-two pairs of decision-makers are the (9,10), (4,5), (4,5), (4,7), (4,8), (5,6), (5,7), (5,8), (6,7), (6,8), (7,8), (4,11), (5,11), (6,11), (7,11), (8,11), (4,12), (5,12), (6,12), (7,12), (8,12), and (11,12). Moreover, the decision opinions’ correlations among the other decision-makers are also very close under the decision construct CD.
Examining Figure 3f, we can see that most of the decision-makers’ decision opinions under the decision construct CE are positively correlated, though a few of the decision-makers’ decision opinions are negatively correlated. The two decision-makers (DM-10 and DM-11) have more discriminations with other decision-makers in the decision opinions. Also, there exist two decision opinion groups among the other ten decision-makers: group one has three decision-makers (DM-9, DM-2, and DM-4), and group two has seven decision-makers (DM-6, DM-3, DM-5, DM-7, DM-12, DM-1, and DM-8). Table 18 lists the correlation proportion among all the decision-makers’ decision opinions under the decision construct CE. It shows that in over 72% of decision-makers’ decision opinions exist positive correlations, in over 27% of decision-makers’ decision opinions exist negative correlations, and most of the decision opinions of the two decision-makers (the DM-10 and DM-11) are different from the other decision-makers’ decision opinions. Besides, further examining the Pearson correlation coefficients of pairs of decision-makers, we can find that thirteen pairs of decision-makers have the closest correlations, and their Pearson correlation coefficients are equal to 1—they have a total positive linear correlation in their decision opinion sets. Those thirteen pairs of decision-makers are the (1,5), (1,7), (1,8), (1,12), (2,4), (2,9), (4,9), (5,7), (5,8), (5,12), (7,8), (7,12), and (8,12); moreover, the Pearson correlation coefficients of another eleven pairs of decision-makers are also >= 0.99. Therefore, 36.36% of decision-makers’ decision opinions have a very close correlation under the decision construct CE.

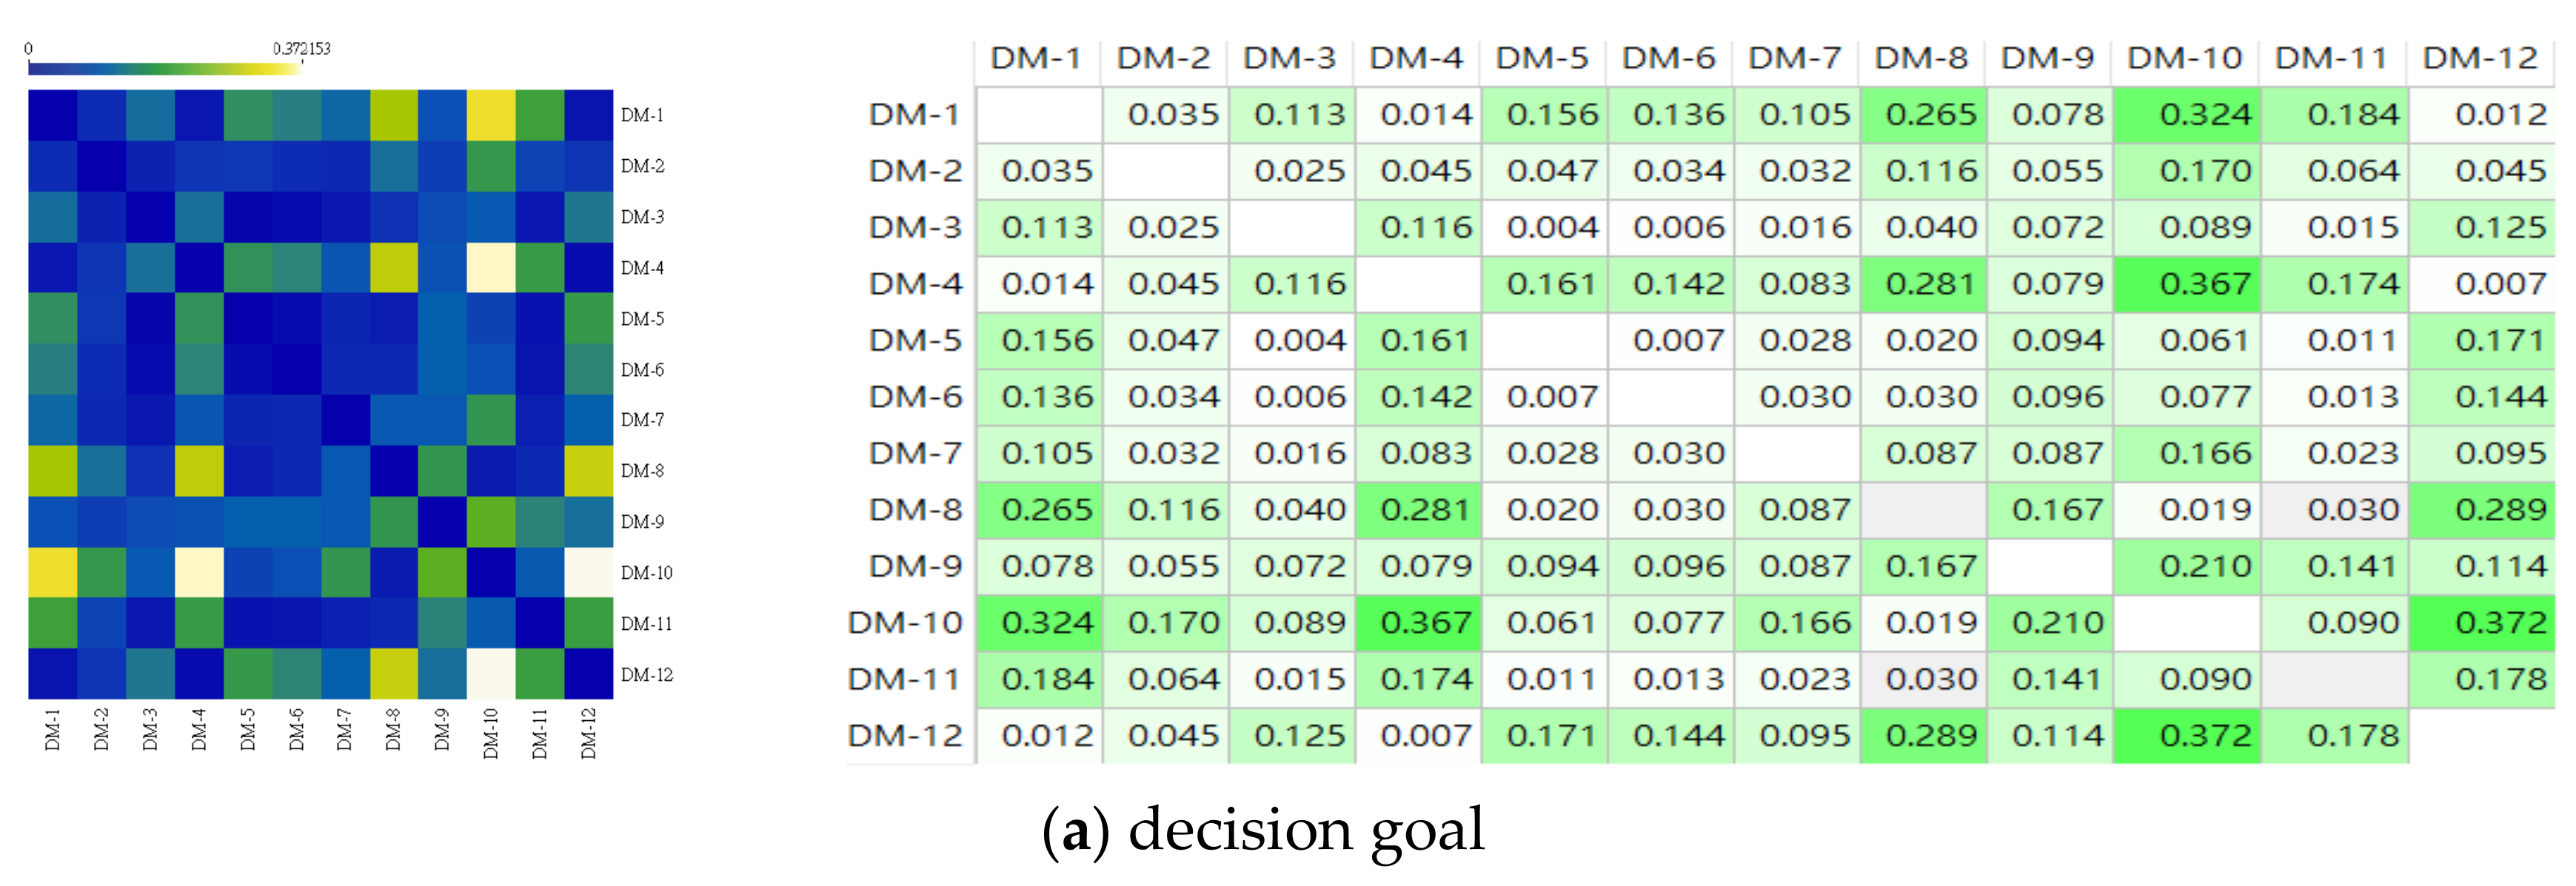
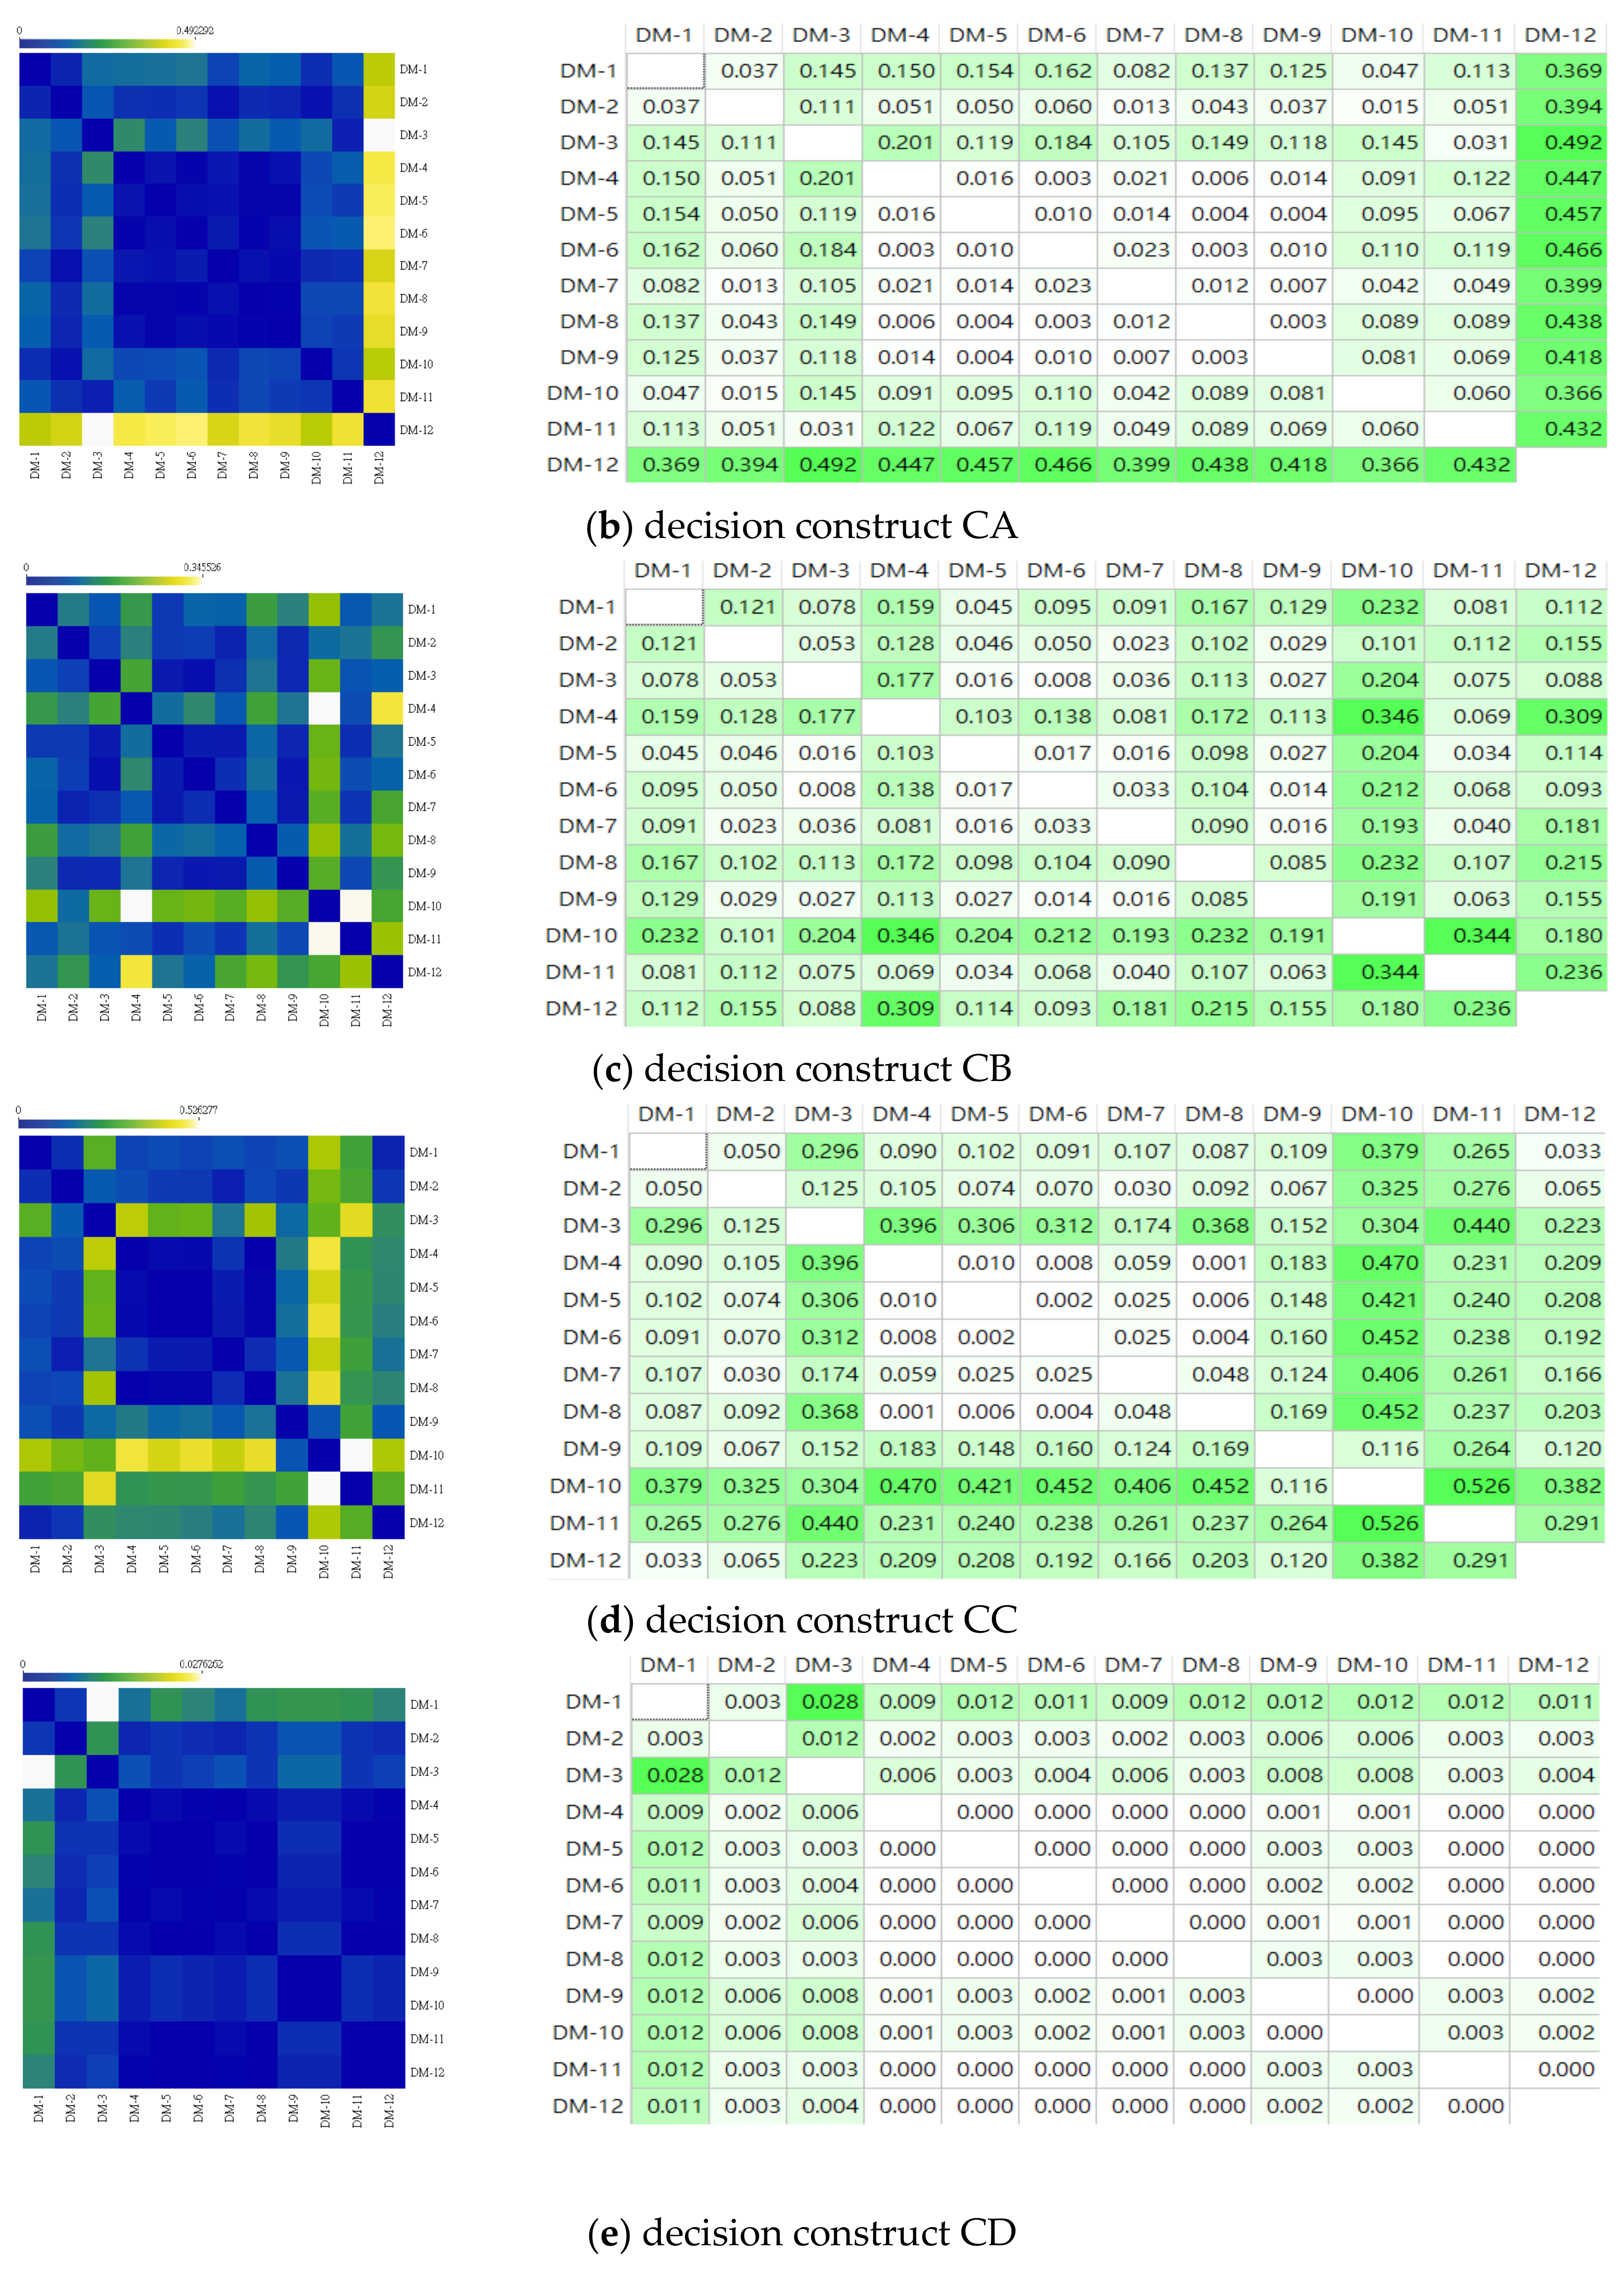
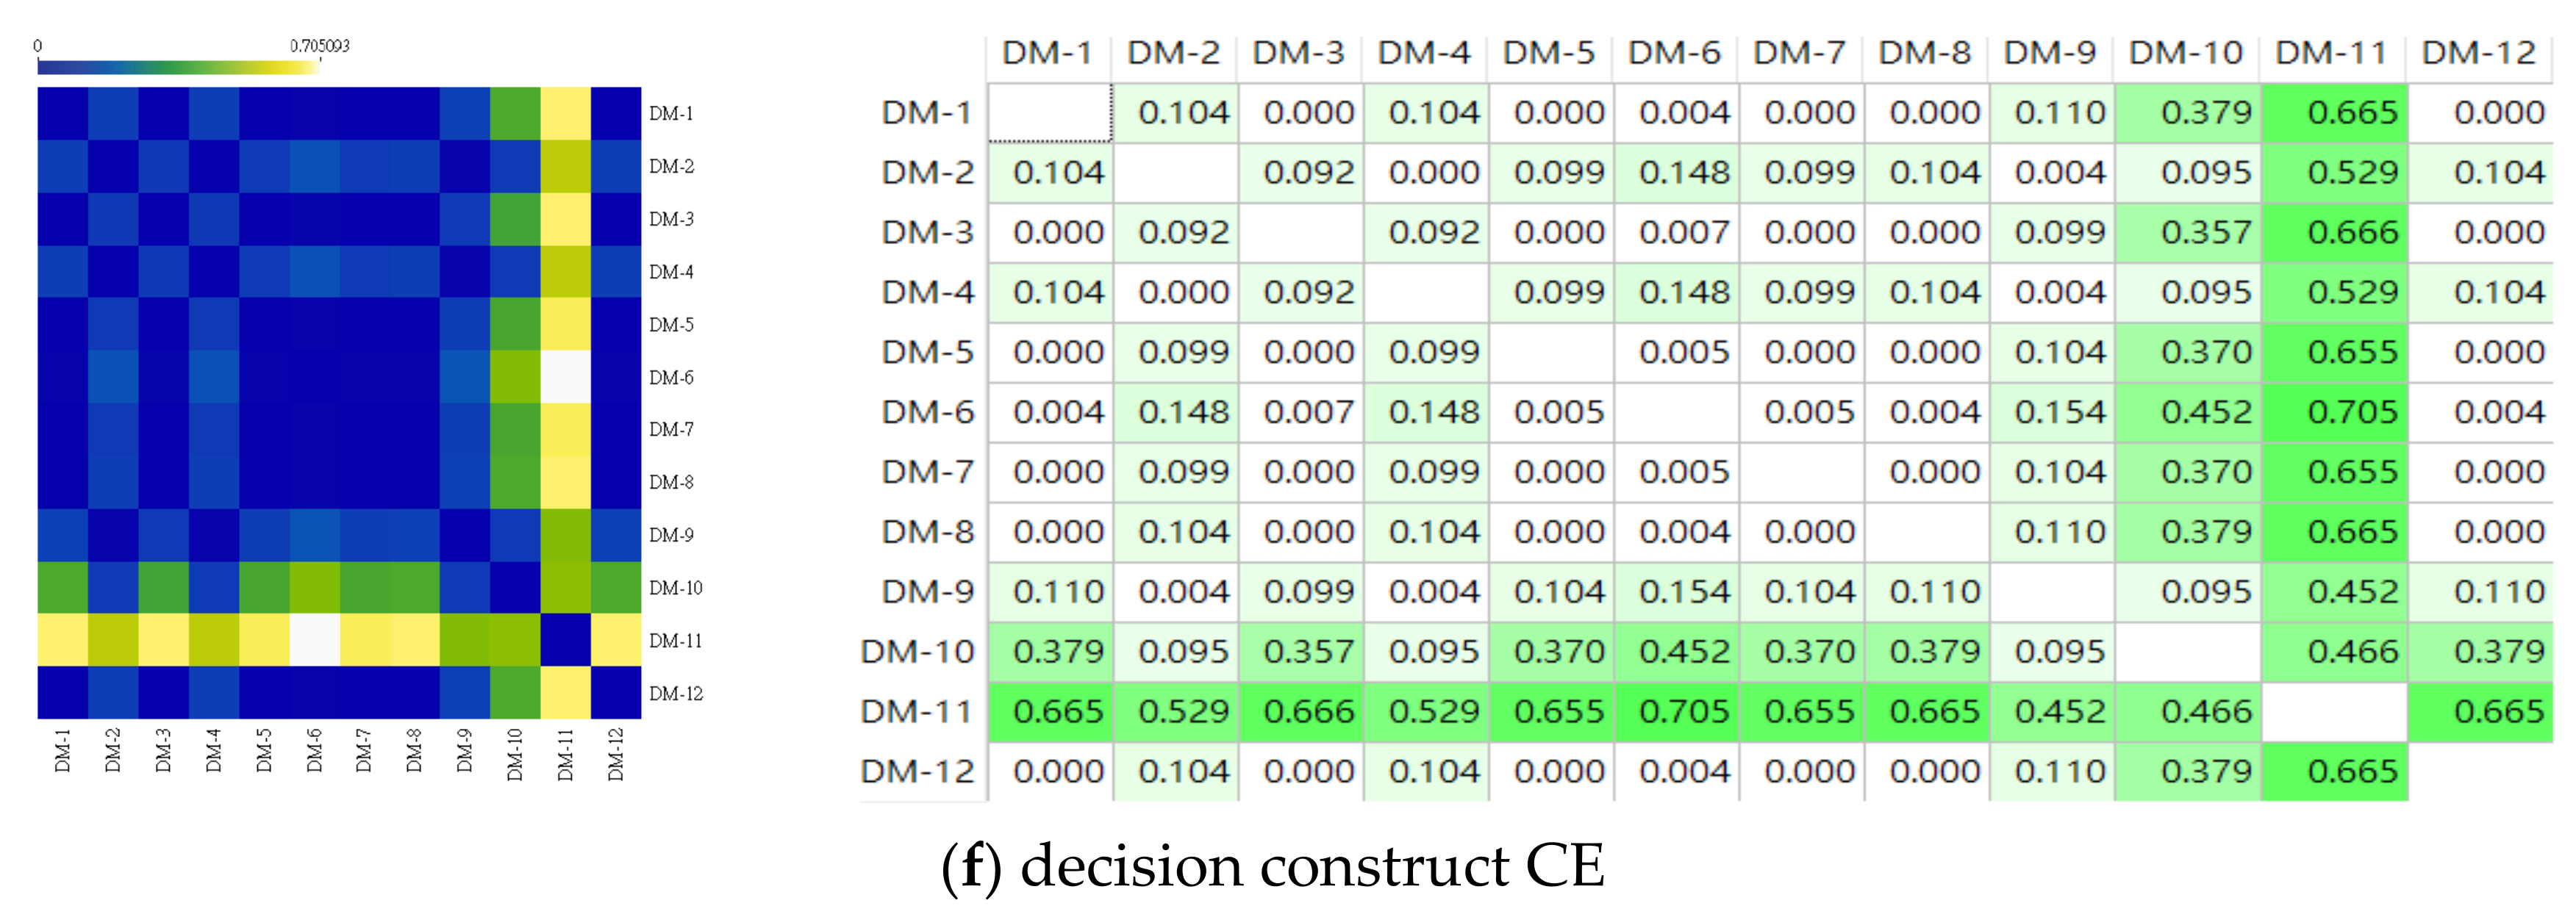
4.4.2. The Similarity Analysis for the DMs’ Decision Opinions

In this subsection, this study depended on the six xlsx files shown in Table 12 to analyze cosine similarity in all decision-makers’ decision opinions. First, this study used the “distance” function in Orange to get the cosine distance coefficient matrix of all decision-makers’ decision opinions related to the decision goal and the five decision constructs. Also, this study used the “distance map” function in Orange to display the cosine distances among all decision-makers’ decision opinions about the decision goal and the five decision constructs in a visual way.
Figure 4 shows the distance maps and distance matrix upon the cosine distances among pairs of decision-makers’ decision opinions (criterion weight vectors) in the decision goal and under the five decision constructs. Examining Figure 4a, we can find that the cosine distance range among all pairs of decision-makers decision opinions in the decision goal is from 0 to 0.372—this cosine distance range is relatively narrow. It shows that all pairs of the decision-makers’ decision opinions are positive similarities and the cosine similarities among all decision-makers’ decision opinions are relatively close in the decision goal. This means that the cosine similarities of most of the decision-makers’ decision opinions in the decision goal are relatively convergent. Table 19 lists the closest and farthest cosine distances among pairs of decision-makers’ decision opinions in the decision goal.
Looking over Figure 4b, under the decision construct CA, we can find that the cosine distance range of all pairs of decision-makers’ decision opinions is from 0 to 0.492. This cosine distance range is relatively narrow and shows that the decision opinions of all pairs of the decision-makers are positive similarities under the decision construct CA. We also can see that, except the pairs of the DM-12′s decision opinions, the pairs of the other eleven decision-makers’ decision opinions received closer cosine distances. That means that the cosine similarities of all pairs of the eleven decision-makers’ decision opinions are closer than the pairs of the DM-12′s decision opinions. Table 20 lists the closest and farthest cosine similarities among pairs of decision-makers’ decision opinions under the decision construct CA.
Examining Figure 4c, under the decision construct CB, we can see that the cosine distance range among all pairs of decision-makers’ decision opinions is from 0 to 0.346—this cosine distance range is also relatively narrow. This cosine distance range shows that the decision opinions of all pairs of the decision-makers are positive similarities, and the cosine similarities among all decision-makers’ decision opinions are relatively close. That means that the cosine similarities of most decision-makers’ decision opinions under the decision construct CB are relatively convergent. We can also see that, except the decision opinions of the DM-10 and DM-12, the pairs of the other ten decision-makers’ decision opinions receive closer cosine distances. That means that the cosine similarities of all pairs of the ten decision-makers’ decision opinions are closer than the pairs of the decision opinions of the DM-10 and DM-12. Table 21 lists the closest and farthest cosine distances among pairs of decision-makers’ decision opinions under the decision construct CB.
Examining Figure 4d, under the decision construct CC, we can find that the cosine distance range among all pairs of decision-makers’ decision opinions is from 0 to 0.526. This cosine distance range is relatively wide, which shows that all pairs of the decision-makers’ decision opinions under the decision construct CC are positive similarities and the cosine similarities among all decision-makers’ decision opinions are relatively far. That means that the cosine similarities of most of the decision-makers’ decision opinions under the decision construct CC are relatively divergent. Also, looking at the distance map in Figure 4d, in addition to the decision-making opinions of the DM-3, DM-10, and DM-11, we can see that the decision-making opinions of the other nine decision-makers receive closer cosine distances. That means that the cosine similarity of nine decision-makers’ decision opinions is closer than that of DM-3, DM-10, and DM-11 decision opinions. Table 22 shows the closest and farthest cosine distance between decision-making opinion pairs under decision structure CC.
Looking over Figure 4e, we can see that the cosine distance range among all pairs of decision-makers’ decision opinions under the decision construct CD is from 0 to 0.028—this cosine distance range is very narrow. This cosine distance range shows that the decision opinions of all pairs of the decision-makers under the decision construct CD are positive similarities. The cosine similarities among all decision-makers’ decision opinions are relatively very close, which means that the cosine similarities of most of the decision-makers’ decision opinions under the decision construct CD are relatively very convergent. In addition, we can find that the cosine distances of the twenty-two pairs of decision opinions of decision-makers ((4,5), (4,6), (4,7), (4,8), (4,11), (4,12), (5,6), (5,7), (5,8), (5,11), (5,12), (6,7), (6,8), (6,11), (6,12), (7,8), (7,11), (7,12), (8,11), (8,12), (9,10), and (11,12)) are 0 and the decision opinions of those pairs of DMs have a similarity.
Examining Figure 4f, we can see that the cosine distance range among all pairs of decision-makers’ decision opinions under the decision construct CE is from 0 to 0.705, which is relatively wide. This cosine distance range shows that the decision opinions of all pairs of the decision-makers under the decision construct CE are positive similarities but comparatively farther. That means that the cosine similarities of most of the decision-makers’ decision opinions under the decision construct CE are relatively more divergent. Except for the decision opinions of the DM-10 and DM-11, we can also find that the pairs of the other ten decision-makers’ decision opinions received closer cosine distances. That means that the cosine similarities of all pairs of the ten decision-makers’ decision opinions are closer than the pairs of the decision opinions of the DM-10 and DM-11. Table 23 lists the closest and farthest cosine distances among pairs of decision-makers’ decision opinions under the decision construct CE.

5. Discussion

In this section, for developing a Windows-based information security monitoring tool, this study further explores the weights of the decision constructs and decision criteria; moreover, this study also discusses the Pearson correlations and cosine similarities among decision-makers’ decision opinions further.

5.1. Further Explorations on the Absolute Weights of Decision Criteria for the Development of a Windows-Based Information Security Monitoring Tool

The range of the decision criteria’s absolute weight is from 0.177 to 0.004 (please see Table 11), and the most significant decision criterion’s absolute weight is 44.25 times that of the least critical decision criterion. This study uses those absolute weights to divide the twenty-six decision criteria into five groups, and the absolute weight sum of these five groups separately is 54.5%, 21%, 14.5%, 6.4%, and 3.9% (see Section 4.3.7). There exist considerable differences among those five groups’ absolute weight sums. Looking over these five groups, we can find that the top three significant groups contain sixteen decision criteria, and the sum of these sixteen decision criteria’s absolute weights is 90%. Those sixteen decision criteria in those three groups cover the most critical features in a Windows-based information security monitoring tool. They should be based on their absolute weights to obtain their corresponding development priorities in the Windows-based information security monitoring tools. Therefore, more exploration would focus on these sixteen decision criteria, and we describe two analytical results in the following paragraphs:
  • The absolute weight sums of these sixteen decision criteria under the five decision constructs, CC, CD, CB, CA, and CE, are 32.2%, 26.2%, 23.2%, 5.3%, and 3.1%, respectively. We can find that the decision construct weight ranking based on the absolute weights of these sixteen decision criteria in the top three significant groups is the same as the ranking of the decision constructs’ relative weights (please see Table 5).
  • Looking over the distribution of these sixteen decision criteria under the five decision constructs, CC, CD, CB, CA, and CE, the ratios of decision criteria to decision construct are 4/5, 3/3, 2/3, 2/6, and 1/3, respectively. Those ratios imply that the decision constructs CC, CD, and CB should receive more developing priorities in a Windows-based information security monitoring tool.

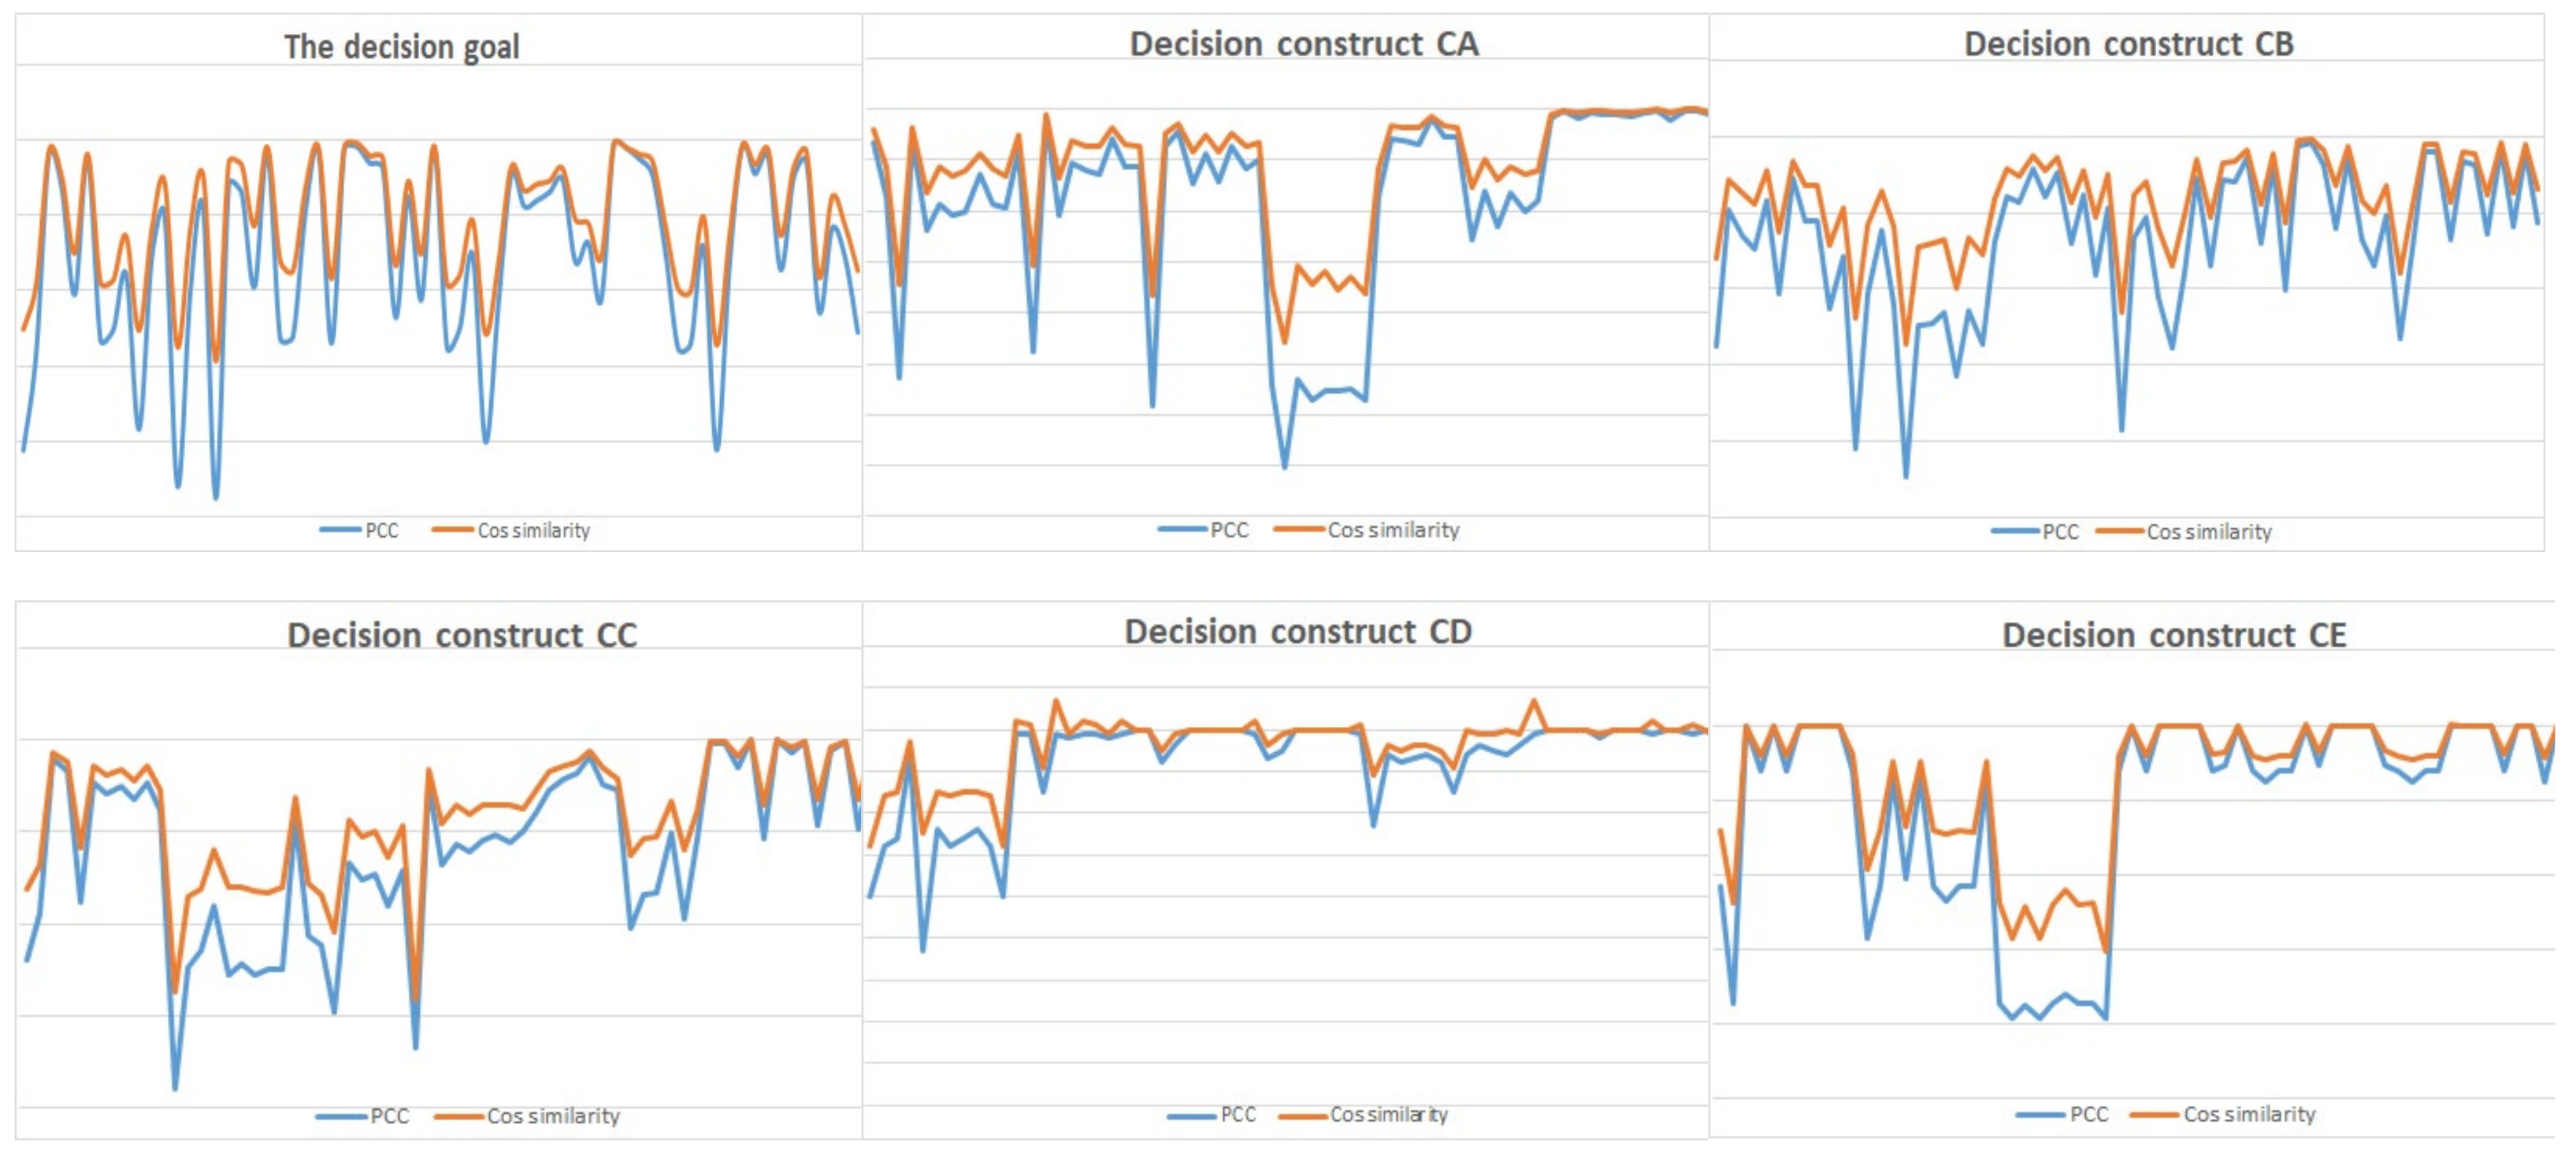
5.2. Further Discussions on the Pearson Correlations and Cosine Similarities among Decision-Makers’ Decision Opinions

Table 24 summarizes the Pearson correlation coefficients and cosine distances among all pairs of decision-makers’ decision opinions shown in Figure 3 and Figure 4. Examining Table 24, we can see that the decision construct CD obtained the maximum Pearson correlation coefficient and the minimum cosine distance, and the decision goal and the two decision constructs, CB and CA, also received larger Pearson correlation coefficients and closer cosine distances. Relatively, the decision constructs CC and CE obtained smaller Pearson correlation coefficients and the farther cosine distances. This result means that the pairs of decision-makers’ decision opinions under the decision goal and the decision constructs CA, CB, and CD are more convergent than the pairs of decision-makers’ decision opinions under the decision constructs CC and CE. Furthermore, we also found that there does not exist a positive correlation between the size of the decision criterion set and the Pearson correlation coefficients/cosine distances among all pairs of decision-makers’ decision opinions. That means that the pairs of decision-makers’ decision opinions do not necessarily receive larger Pearson correlation coefficients or closer cosine distances in a smaller decision criterion set.
Looking over all tables and figures in Section 4.4, we can see that most of the pairs of decision-makers’ decision opinions have positive Pearson correlation coefficients and all the pairs of decision-makers’ decision opinions also have positive cosine distances under the decision goal and all decisions constructs. However, we examined the Pearson correlation coefficients and cosine distances among all the decision-makers’ decision opinions in detail, under the decision goal and all decision constructs, and we did not find that the two decision-makers’ decision opinions always received very high/high Pearson correlation coefficients and closer cosine distance. That means that no two or more decision-makers have very close decision opinions under the decision goal and all decision constructs.
Next, this study tries to understand the relationship between the Pearson correlation coefficients and cosine similarities among all pairs of decision-makers’ decision opinions. Figure 5 shows six diagrams that show the changes between the Pearson correlation coefficients and cosine similarities among all pairs of decision-makers’ decision opinions under the decision goal and decision constructs CA, CB, CC, CD, and CE. Looking over the six diagrams in Figure 5, we can see a corresponding change between Pearson correlation coefficient and cosine similarity. That means that when a pair of decision-makers’ decision opinions get a large Pearson correlation coefficient; then, this pair of decision-makers’ decision opinions would also receive a close cosine similarity. Relatively, a pair of decision-makers’ decision opinions would receive a far cosine similarity when this pair of decision-makers’ decision opinions have a small Pearson correlation coefficient.

6. Conclusions and Recommendations

6.1. Conclusions

In the era of information technology, information assurance is a key issue for enterprises/organizations. Information security monitoring tools are critical tools for enterprises/organizations to improve their information security performance. Since most computer operating systems are Windows-based operating systems; thus, developing a Windows-based information security monitoring tool is an important study topic. This study proposed an assessment model to explore the development of a Windows-based information security monitoring tool and all decision-makers’ decision opinions. First, this study collected literature related to information security monitoring to identify the twenty-six functionalities that a Windows-based information security monitoring tool might have. Those twenty-six functionalities were also treated as the decision criteria in the proposed assessment model. Then, this study used the Delphi method to consult the potential decision-makers with the twenty-six decision criteria. After consulting potential decision-makers, this study identified that the twenty-six decision criteria can be divided into five decision constructs, “computer basic information”, “user’s PC operation behavior”, “information security control”, “network behavior”, and “printing control”. This study also confirmed the decision criteria hierarchy for the development of a Windows-based information security monitoring tool (see Figure 2). This study designed the AHP questionnaire with the decision criteria hierarchy and interviewed the twelve decision-makers to obtain their preference opinions. With the AHP analytical method, this study found that the “information security control”, “network behavior”, and “user’s PC operation behavior” are more significant decision constructs for developing Windows-based information security monitoring tools; moreover, this study also found that the “browser’s history record”, “Internet control”, “hardware/software control”, “log”, “storage control”, “current network traffic volume”, “process”, “screen control”, “file and path”, “watermark control”, “network information”, “certificate”, “software information”, “connection time”, “power on/off and log in/out”, and “peripheral input/output devices” are the more significant decision criteria for developing a Windows-based information security monitoring tool, which are given an absolute weighting of 90%, and the functionalities related to these sixteen decision criteria should receive developing priorities in a Windows-based information security monitoring tool; especially, functionalities related to “browser’s history record”, “Internet control”, “hardware/software control”, “log”, and “storage control” should obtain the first developing priority in a Windows-based information security monitoring tool.
This study explored the correlations and similarities among decision-makers’ decision opinions with the Pearson correlation coefficient and cosine distance. We summarize the Pearson correlation coefficients and cosine distances of decision-makers’ decision opinions in the following paragraphs:
  • The decision-makers’ decision opinions under the decision construct CD have the closest Pearson correlation coefficients and cosine similarity. The decision-makers’ decision opinions have larger Pearson correlation coefficients and closer cosine similarities in the decision goal and decision constructs CB and CA, but the decision-makers’ decision opinions in decision constructs CC and CE have smaller Pearson correlation coefficients and far cosine similarities. Therefore, the decision-makers’ decision opinions under the decision goal and the decision constructs CD, CB, and CA are more convergent than the decision-makers’ decision opinions under the decision constructs CD and CB.
  • In the decision goal and the five decision constructs, no two or more decision-makers had very close decision opinions in the Pearson correlation coefficient and cosine similarity.
  • Among all pairs of decision-makers’ decision opinions, there does not exist a positive correlation between the size of the decision criterion set and Pearson correlation coefficients/cosine similarities. However, a corresponding change exists between the Pearson correlation coefficients and cosine similarities (see Figure 5).
Informatization is the cornerstone of the sustainable operation and growth of modern enterprises/organizations. Information security is the necessary mechanism to ensure that information systems in enterprises/organizations can operate normally and continuously. For enterprises/organizations, an information security monitoring tool is an important measure to strengthen their information security protection. For improving enterprise/organization’s information security for effective and sustainable operation, this study understands the importance of developing an information security monitoring tool. Therefore, this paper proposed an assessment model of information security tool development, through the systematic study steps, to assist information security professional personnel in effectively completing the development of information security monitoring tools. Through the proposed assessment model, R&D personnel can also understand the similarities and differences among decision-making opinions, which can help the R&D personnel to explore decision-making opinions deeply to ensure the effectiveness of information security monitoring tools and also enhance the sustainability of enterprise/organizational operation.

6.2. Recommendations

This study explored the functionalities developed in a Windows-based information security monitoring tool, and it also analyzed decision-makers’ decision opinions using the steps in the proposed assessment model. Researchers can explore many issues related to the multi-criteria decision-making field according to the main steps, including the literature study method, the Delphi method, the AHP method, and some data-driven decision-making methods, in the proposed assessment model. First, with the literature study method, researchers can collect the literature in a specific professional field, and by studying the collected literature, researchers can understand the domain knowledge and discover possible decision criteria for their studies. Second, with the Delphi method, the researchers can consult domain experts or potential decision-makers to identify the decision criterion set for their studies and organize a decision criteria hierarchy with the confirmed decision criteria. Third, with the constructed decision criteria hierarchy, the researchers can design an AHP questionnaire for their study and interview the decision-makers with the designed AHP questionnaire to obtain decision-makers’ decision opinions. With the AHP analytical method, the researchers can receive the criterion weight vectors of decision criteria; then, the researchers can depend on the decision criteria’s priority weights to receive possible solutions for their study. Finally, the researchers can use some data-driven decision-making measures to analyze the criterion weight vectors in detail if they want to explore the decision-makers’ decision opinions further. In general, researchers should present the results of data-driven decision-making analysis intuitively, and visual analysis results will help them to explore the decision-makers’ opinions and find more exploration results in their research.
We found that the above study steps can be used as a study template to explore some multi-criteria decision-making research issues from the above description. Especially, for the study issues related to multiple choices required to implement but only with limited resources, which is quite common in some large-scale research and development cases. Usually, with limited budgets and human resources, these R&D cases cannot implement all possible choices, and they need to invest their valuable limited resources to the more significant R&D choices; then, they can receive better R&D results with limited R&D resources. However, for those R&D cases, it is difficult for R&D staff to determine the significant R&D choices in their R&D case. The above study steps can help R&D staff to identify the critical R&D choices in their R&D case. Then, those R&D staff can receive better R&D results with limited R&D resources. Finally, many data-driven decision-making methods are available for researchers to explore relationships among data. Researchers can depend on their requirements to choose proper data-driven decision-making methods and receive better exploration results that they want. Generally speaking, data-driven decision-making methods usually need a large amount of data for analysis. Therefore, it is helpful for researchers to use data-driven decision-making methods to explore the relationship between data quickly and conveniently through proper data visualization.

Author Contributions

Conceptualization, methodology, investigation, visualization, and writing, Chen-Hua Fu; Validation, project administration, writing (review and editing), and supervision, Chih-Yung Chen. All authors have read and agreed to the published version of the manuscript.

Funding

The funding institutions of this study are temporarily blinded.

Institutional Review Board Statement

Not applicable.

Informed Consent Statement

Not applicable.

Data Availability Statement

Not applicable.

Acknowledgments

The authors thank Zheng-Yun Zhuang for his suggestions about decision-makers’ decision opinion analysis in Section 4.

Conflicts of Interest

The authors declare no conflict of interest.

References

  1. References Data-Exposure-Report-G (2019). Available online: https://www.code42.com/resources/report-2019-data-exposure// (accessed on 5 July 2020).
  2. 2020 Insider Threat Report (2020). Available online: https://www.cybersecurity-insiders.com/portfolio/2020-insider-threat-report-gurucul/ (accessed on 5 July 2020).
  3. Desktop Operating System Market Share Worldwide (2020). Available online: https://gs.statcounter.com/os-market-share/desktop/worldwide (accessed on 8 July 2020).
  4. Hazra, S. Development of an IT Asset Management Tool for Enterprise Information System. Asian J. Converg. Technol. 2018, 4. [Google Scholar]
  5. Dey, M. Information security management-a practical approach. In Proceedings of the AFRICON 2007, Windhoek, South Africa, 26–28 September 2007; IEEE: New York, NY, USA, 2007. [Google Scholar]
  6. Karjalainen, M. Developing an Information Security Management System. Bachelor’s Thesis, Laurea University of Applied Sciences, Vantaa, Finland, May 2014. [Google Scholar]
  7. Stanton, J.M.; Stam, K.R.; Mastrangelo, P.; Jolton, J. Analysis of end user security behaviors. Comput. Secur. 2005, 24, 124–133. [Google Scholar] [CrossRef]
  8. Shropshire, J.; Warkentin, M.; Sharma, S. Personality, attitudes, and intentions: Predicting initial adoption of information security behavior. Comput. Secur. 2015, 49, 177–191. [Google Scholar] [CrossRef]
  9. Otero, R.A.; Otero, C.E.; QureshI, A. A multi-criteria evaluation of information security controls using boolean features. Int. J. Netw. Secur. Appl. 2010, 2, 1–11. [Google Scholar]
  10. Stoll, M.; Felderer, M.; Breu, R. Information management for holistic, collaborative information security management. In Emerging Trends in Computing, Informatics, Systems Sciences, and Engineering; Springer: New York, NY, USA, 2013; pp. 211–224. [Google Scholar]
  11. Otero, A.R. An Information Security Control Assessment Methodology for Organizations. Ph.D. Thesis, Nova Southeastern University, Fort Lauderdale, FL, USA, 2014. [Google Scholar]
  12. Ahmad, A.; Maynard, B.S.; Park, S. Information security strategies: Towards an organizational multi-strategy perspective. J. Intell. Manuf. 2014, 25, 357–370. [Google Scholar] [CrossRef]
  13. Kurundkar, G.D.; Naik, N.A.; Khamitkar, S.D. Network intrusion detection using Snort. Int. J. Eng. Res. Appl. 2012, 2, 1288–1296. [Google Scholar]
  14. Yamada, T.; Fujii, Y.; Echizen, I.; Tanimoto, K.; Tezuka, S. Print traceability systems framework using digital watermarks for binary images. In Proceedings of the 2004 IEEE International Conference on Systems, Man and Cybernetics (IEEE Cat. No. 04CH37583); The Hague, The Netherlands, 10–13 October 2004, IEEE: New York, NY, USA, 2004; Volume 4. [Google Scholar]
  15. Chen, J.; Li, S. Design of paper CPU project to improve student understanding of CPU working principle. In Proceedings of the ACM Turing Celebration Conference-China, Shanghai, China, 19–10 May 2018. [Google Scholar]
  16. Sanders, A.D. Teaching tip: Utilizing simple hacking techniques to teach system security and hacker identification. J. Inf. Syst. Educ. 2003, 14, 5. [Google Scholar]
  17. Soubramanien, V.; Wei, S.P.; Ektare, M.; Chen, H. Method and Apparatus for Security Information Visualization. U.S. Patent No. 8,874,550, 28 October 2014. [Google Scholar]
  18. Al-Shehri, Y.; Clarke, N.L. Information security awareness and culture. In Advances in Communications, Computing, Networks and Security, Proceedings of the MSc/MRes Programmes from the School of Computing, Communications and Electronics, Plymouth, UK, 2008–2009; Lulu Press: Morrisville, NC, USA, 2009; Volume 6, p. 12. [Google Scholar]
  19. Itradat, A.; Sultan, S.; Al-Junaidi, M.; Qaffaf, R.; Mashal, F.; Daas, F. Developing an ISO27001 Information Security Management System for an Educational Institute: Hashemite University as a Case Study. Jordan J. Mech. Ind. Eng. 2014, 8, 102–118. [Google Scholar]
  20. Englander, I.; Englander, A. The Architecture of Computer Hardware and Systems Software: An Information Technology Approach; Wiley: Hoboken, NJ, USA, 2003. [Google Scholar]
  21. Fawcett, P.E. Method and System for Identifying and Obtaining Computer Software from a Remote Computer. U.S. Patent No. 6,073,214, 6 June 2000. [Google Scholar]
  22. Folco, R.C.S.; Breno, H.L.; Santos, T.N.D. Network Efficiency and Power Savings. U.S. Patent No. 9,170,976, 27 October 2015. [Google Scholar]
  23. Nabae, T. Communication Network System. U.S. Patent No. 7,551,634, 23 June 2009. [Google Scholar]
  24. Fenz, S.; Pruckner, T.; Manutscheri, A. Ontological mapping of information security best-practice guidelines. In Proceedings of the International Conference on Business Information Systems, Poznan, Poland, 27–29 April 2009; Springer: Berlin/Heidelberg, Germany, 2009. [Google Scholar]
  25. Munson, J.C.; Wimer, S. Watcher: The missing piece of the security puzzle. In Proceedings of the Seventeenth Annual Computer Security Applications Conference, New Orleans, LA, USA, 10–14 December 2001; IEEE: New York, NY, USA, 2001. [Google Scholar]
  26. Simbolon, N.; Hardiyanti, D.Y. Security Audit on Loan Debit Network Corporation System Using Cobit 5 and ISO 27001: 2013. J. Phys. Conf. Ser. 2019, 1196, 012033. [Google Scholar]
  27. Payer, M.; Gross, T.R. Protecting applications against TOCTTOU races by user-space caching of file metadata. In Proceedings of the 8th ACM SIGPLAN/SIGOPS Conference on Virtual Execution Environments, London, UK; 3-4 March 2012. [Google Scholar]
  28. Wang, X.; Wang, Y.; Liu, Q.; Sun, Y.; Xie, P. Insider detection by analyzing process behaviors of file access. In Advances in Parallel and Distributed Computing and Ubiquitous Services; Springer: Singapore, 2016; pp. 209–219. [Google Scholar]
  29. Ben-Menahem, A.; Ben-Zvi, N.; Miller, R.W. Software Licensing Using Certificate Issued by Authorized Authority. U.S. Patent No. 7,788,181, 31 August 2010. [Google Scholar]
  30. Yu, Q.; Li, J.; Zhang, Y.; Wu, W.; Huang, X.; Xiang, Y. Certificate-based encryption resilient to key leakage. J. Syst. Softw. 2016, 116, 101–112. [Google Scholar] [CrossRef]
  31. Thakare, S.; Pankaj, I.; Meshram, B.B. IDS: Intrusion detection system the survey of information security. Int. J. Emerg. Technol. Adv. Eng. 2012, 2, 86–90. [Google Scholar]
  32. Shang, T.; Zhuang, H.; Liu, J. Comprehensive security management system for Hadoop platforms. In Proceedings of the 2018 IEEE International Conference on Intelligence and Safety for Robotics (ISR), Shenyang, China, 24–27 August 2018; IEEE: New York, NY, USA, 2018. [Google Scholar]
  33. Lim, K.-S.; SeungBong, L.; Sangjin, L. Applying a stepwise forensic approach to incident response and computer usage analysis. In Proceedings of the 2009 2nd International Conference on Computer Science and Its Applications, Jeju, Korea, 10–12 December 2012; IEEE: New York, NY, USA, 2009. [Google Scholar]
  34. Sbeyti, H. Mobile user authentication based on user behavioral pattern (MOUBE). Int. J. Comput. Sci. Secur. 2016, 10, 1. [Google Scholar]
  35. Wang, Z.; Ma, P.; Chi, Y.; Zhang, J. Medical devices are at risk: Information security on diagnostic imaging system. In Proceedings of the 2018 ACM SIGSAC Conference on Computer and Communications Security, Toronto, ON, Canada, 15–19 October 2018. [Google Scholar]
  36. Cárdenas, A.A.; Manadhata, P.K.; Rajan, S.P. Big data analytics for security. IEEE Secur. Priv. 2013, 11, 74–76. [Google Scholar] [CrossRef]
  37. Yoshida, T. Communication Analysis Apparatus. U.S. Patent No. 7,337,155, 26 February 2008. [Google Scholar]
  38. Cavusoglu, H.; Cavusoglu, H.; Son, J.Y.l.; Benbasat, I. Institutional pressures in security management: Direct and indirect influences on organizational investment in information security control resources. Inf. Manag. 2015, 52, 385–400. [Google Scholar] [CrossRef]
  39. Mei, Z.; Yangqun, L. Internet of Things Experiment Platform Based on Open Source Ecosystem. In Proceedings of the 2019 International Conference on Smart Grid and Electrical Automation (ICSGEA), Xiangtan, China, 10–11 August 2019; IEEE: New York, NY, USA, 2019. [Google Scholar]
  40. He, J.; Li, K.; Chai, X. Method for Executing Managment Operation by Communication Terminal and a Terminal and System Thereof. U.S. Patent No. 7,953,836, 31 May 2011. [Google Scholar]
  41. Systems of Information Security Indicators for Industrial Enterprises. Autom. Doc. Math. Linguist. 2019, 53, 216–224. [CrossRef]
  42. Sulistyowati, I.; Ginardi, R.V.H. Information security risk management with octave method and iso/eic 27001: 2013 (case study: Airlangga university). IPTEK J. Proc. Ser. 2019, 1, 32–38. [Google Scholar]
  43. Vendrow, V.; Chau, V.D. Shared Directory System. U.S. Patent Application 13/399,343, 2014. [Google Scholar]
  44. Minh, Q.T.; Nguyen, K.; Yamada, S. DRANs: Resilient disaster recovery access networks. In Proceedings of the 2013 IEEE 37th Annual Computer Software and Applications Conference Workshops, Kyoto, Japan, 22–26 July 2013; IEEE: New York, NY, USA, 2013. [Google Scholar]
  45. Featherston, L.N.; Lee, D.M.; Getzinger, T.W. Dynamic WAN Port Detection. U.S. Patent No. 7,280,547, 9 October 2007. [Google Scholar]
  46. Payne, R.; Brown, P.; Ormston, C.; Garrett, A. Information Security. U.S. Patent Application No. 10/511,904, 15 August 2005. [Google Scholar]
  47. Abbas, J.; Mahmood, H.K.; Hussain, F. Information security management for small and medium size enterprises. Sci. Int. 2015, 27, 2393–2398. [Google Scholar]
  48. Vildjiounaite, E.; Mäkelä, S.M.; Lindholm, M.; Riihimäki, R.; Kyllönen, V.; Mäntyjärvi, J.; Ailisto, H. Unobtrusive multimodal biometrics for ensuring privacy and information security with personal devices. In Proceedings of the International Conference on Pervasive Computing; Pisa, Italy, 13–17 March 2006, Springer: Berlin/Heidelberg, Germany, 2006. [Google Scholar]
  49. Shabtai, A.; Tenenboim-Chekina, L.; Mimran, D.; Rokach, L.; Shapira, B.; Elovici, Y. Mobile malware detection through analysis of deviations in application network behavior. Comput. Secur. 2014, 43, 1–18. [Google Scholar] [CrossRef]
  50. Kind, A.; Stoecklin, M.P.; Dimitropoulos, X. Histogram-based traffic anomaly detection. IEEE Trans. Netw. Serv. Manag. 2009, 6, 110–121. [Google Scholar] [CrossRef]
  51. Aggarwal, A.; Kumar, S.; Shah, A.; Viswanath, B.; Zhang, L.; Kumaraguru, P. Spying Browser Extensions. Analysis and Detection. arXiv 2016, arXiv:1612.00766. [Google Scholar]
  52. Xue, L.; Guozi, S. Design and implementation of a malware detection system based on network behavior. Secur. Commun. Netw. 2015, 8, 459–470. [Google Scholar] [CrossRef]
  53. Momose, H.; Nimura, K. Printing Control Apparatus, Printing Control Method, and Computer Program Product for Realizing the Method. U.S. Patent No. 6,301,013, 9 October 2001. [Google Scholar]
  54. Yamada, K. Print Control Device and Recording Medium Containing Program for Controlling Printing Device. U.S. Patent No. 8,159,723, 17 April 2012. [Google Scholar]
  55. Ishige, T.; Kito, N.; Obi, H. Printing System, Printer and Print Request Control Server. U.S. Patent Application No. 13/482,766, 2012. [Google Scholar]
  56. Natriello, G. For the record: Reviewing literature. Teach. Coll. Rec. 2000, 102, 693–695. [Google Scholar] [CrossRef]
  57. Rankin, E. Changing the hollow conventions of academic writing. Chron. High. Educ. 1998, 44, A64. [Google Scholar]
  58. Kruse, S.D.; Warbel, A. Developing a Comprehensive Literature Review: An Inquiry into Method. Bachelor’s Thesis, University of Akron, Akron, OH, USA, 2010. [Google Scholar]
  59. Machi, L.A.; McEvoy, B.T. The Literature Review: Six Steps to Success; Corwin Press: Thousand Oaks, CA, USA, 2016. [Google Scholar]
  60. Skulmoski, G.J.; Hartman, F.T.; Krahn, J. The Delphi method for graduate research. J. Inf. Technol. Educ. Res. 2007, 6, 1–21. [Google Scholar] [CrossRef]
  61. Norman, D.; Helmer, O. An experimental application of the Delphi method to the use of experts. Manag. Sci. 1963, 9, 458–467. [Google Scholar]
  62. Linstone, H.A.; Turoff, M. (Eds.) The Delphi Method; Addison-Wesley: Reading, MA, USA, 1975. [Google Scholar]
  63. Rowe, G.; Wright, G. The Delphi technique as a forecasting tool: Issues and analysis. Int. J. Forecast. 1999, 15, 353–375. [Google Scholar] [CrossRef]
  64. Okoli, C.; Pawlowski, S.D. The Delphi method as a research tool: An example, design considerations and applications. Inf. Manag. 2004, 42, 15–29. [Google Scholar] [CrossRef] [Green Version]
  65. Saaty, T.L. A scaling method for priorities in hierarchical structures. J. Math. Psychol. 1977, 15, 234–281. [Google Scholar] [CrossRef]
  66. Chi, L.-P.; Zhuang, Z.Y.; Fu, C.H.; Huang, J.H. A knowledge discovery education framework targeting the effective budget use and opinion explorations in designing specific high cost product. Sustainability 2018, 10, 2742. [Google Scholar] [CrossRef] [Green Version]
  67. Zhuang, Z.-Y.; Chiang, I.J.; Su, C.R.; Chen, C.Y. Modelling the decision of paper shredder selection using analytic hierarchy process and graph theory and matrix approach. Adv. Mech. Eng. 2017, 9, 1687814017737668. [Google Scholar] [CrossRef]
  68. Abbas, M.S. Consistency Analysis for Judgment Quantification in Hierarchical Decision Model. Ph.D. Thesis, Portland State University, Portlnad, OR, USA, 2016. [Google Scholar]
  69. Rodgers, L.J.; Nicewander, W.A. Thirteen ways to look at the correlation coefficient. Am. Stat. 1988, 42, 59–66. [Google Scholar] [CrossRef]
  70. Zhou, H.; Deng, Z.; Xia, Y.; Fu, M. A new sampling method in particle filter based on Pearson correlation coefficient. Neurocomputing 2016, 216, 208–215. [Google Scholar] [CrossRef]
  71. Sedgwick, P. Pearson’s correlation coefficient. BMJ 2012, 345, e4483. [Google Scholar] [CrossRef] [Green Version]
  72. Garcia, A.A.; Sayago, A.; Gonzalez, A.G. The correlation coefficient: An overview. Crit. Rev. Anal. Chem. 2006, 36, 41–59. [Google Scholar]
  73. Chowdhury, G.G. Introduction to Modern Information Retrieval; Facet Publishing: London, UK, 2010. [Google Scholar]
  74. Kusban, M.; Budiman, A. Palmprint recognition using the cosine method. In Proceedings of the IOP Conference Series: Materials Science and Engineering, Kazimierz Dolny, Poland, 21–23 November 2019; IOP Publishing: Bristol, UK, 2019; Volume 674. [Google Scholar]
  75. Aggarwal, C.C. Towards systematic design of distance functions for data mining applications. In Proceedings of the Ninth ACM SIGKDD International Conference on Knowledge Discovery and Data Mining, Washington, DC, USA, 24–27 August 2003. [Google Scholar]
  76. Zou, B.-J.; Umugwaneza, M.P. Shape-based trademark retrieval using cosine distance method. In Proceedings of the 2008 Eighth International Conference on Intelligent Systems Design and Applications, Kaohsiung, Taiwan, 26–28 November 2008; IEEE: New York, NY, USA, 2008; Volume 2. [Google Scholar]
Figure 1. The systematic process diagram of the assessment model for an information security monitoring tool development.
Sustainability 13 03815 g001
Figure 2. The decision criteria hierarchy diagram of development of a Windows-based information security monitoring tool in the proposed assessment model.
Sustainability 13 03815 g002
Figure 3. The heat maps and Pearson correlation coefficient matrix upon the correlations between decision-makers decision opinions (criterion weight vectors).
Sustainability 13 03815 g003aSustainability 13 03815 g003b
Figure 4. The distance maps/matrixes upon the cosine distances between decision-makers’ decision opinions.
Sustainability 13 03815 g004aSustainability 13 03815 g004bSustainability 13 03815 g004c
Figure 5. The changes of the Pearson correlation coefficients and cosine similarities of decision opinions among all pairs of decision-makers under the decision goal and all decision constructs.
Sustainability 13 03815 g005
Table 1. A list of the methods adopted in the assessment model for development of an information security monitoring tool.
StepAdopted MethodExpected Results
1Literature study methodTo find the decision constructs and the possible decision criteria set for the assessment model for development of an information security monitoring tool
2Delphi method:
Consulting with potential decision-makers
To identify the decision criteria under each decision construct for the assessment model for development of an information security monitoring tool
Delphi method:
Consulting with decision-makers via email/instant message apps/face-to-face interviews several times
To confirm a suitable decision hierarchy for the assessment model for development of an information security monitoring tool
3AHP method:
Receiving pairwise comparison matrices with consistency check
To receive decision-makers’ preferential opinions for the assessment model for development of an information security monitoring tool with the consistency verification
Receiving group opinion assessment in the multiple criteria decision-making fieldTo receive group opinion assessment of all decision-makers for the assessment model for development of an information security monitoring tool
4Two data-driven decision-making analytical (Pearson correlation and cosine similarity) methodsTo understand the correlations and similarities among all decision-makers’ preferential decision opinions
Table 2. The list of correlations’ strength.
Pearson Correlation Coefficient ValueInterpretation
0.90 to 1.00Very high correlation
0.70 to 0.89High correlation
0.50 to 0.69Moderate correlation
0.30 to 0.49Low correlation
0.00 to 0.29Little if any correlation
Data source: Reference [72].
Table 3. The operational definitions of the decision criteria set for development of a Windows-based information security monitoring tool.
CriteriaOperational Definition
Computer nameTo get the name of a computer
User nameTo get information of users’ accounts, which can be used by users to log in to the computer
Hardware informationTo get information of CPU, memory, physical disk drive, logical disk drive, and setting of network interface card
Software informationTo get information of operating system version, installed software, services, and update with Windows Update Agent
Network informationTo get computer’s network interface card configuration and routing setting information
Electronic dataTo get information of data stored in the computer
ProcessTo list processes of normal software and green software
File and pathTo list files change in specific path, to get protected path,
to set path of monitored REGISTRY and to get path of monitored REGISTRY
CPU utilizationTo get information of CPU utilization rate
Disk utilizationTo get information of disk capacity utilization rate
Power on/off and log in/outTo get records of power on/off and users’ login/logout from system log
Peripheral input/output devicesTo operate/get current media devices (such as compact disc-read only memory (CD-ROM) drive, etc.) and USB devices
LogTo get the latest system log and read specific types of system log
To get a setting of POWERSHELL log execution or enable/disable log execution
KeywordTo monitor and operate strings in clipper
-
To set monitoring string and save path of monitoring results
-
To get current monitoring string
CertificateTo get records of installed certificates from system log
Hardware/software controlComputer hardware devices operations
-
To get a specified type of device, to enable/disable a specific device
Computer software devices operations
-
To list installed software, to use third-party tool or Windows management instrumentation (WMI) to uninstall specified software
Storage controlTo list/remove computer disk drive,
to get/remove current shared directory in a computer
Internet controlComputer network connection operations
-
To get number of network interface card, to list computer current enable and disable online ports, to enable/disable a specific port
The Internet online detection
-
To detect if the Internet is online or not, to detect a specific Internet protocol (IP) address with ping command, to query a specific domain with nslookup command
Screen controlTo detect if screen saver is installed
To capture screen picture, save the captured picture in computer, and return the path of the captured picture
Biometrics controlTo log in to the computer with voice, fingerprint, iris, or face recognition
Current network traffic volume To get a record of current network traffic volume
Browser’s history recordTo get current browser’s browsing history
Connection timeTo get length of time that the computer connects to the network
Watermark settingTo get/modify current watermark setting
Watermark controlTo enable/disable watermark module
Printing permission controlTo enable/disable printing permissions for a specific user account
Table 4. The background statistics of the interviewed decision-makers.
Type#Decision-MakersPercentage
GenderMale866.67%
Female433.33%
DegreePh.D.12100.00%
Industry categoryGovernment18.33%
Academy541.67%
R&D institute18.33%
Information industry541.67%
PositionSupervisor (information department)18.33%
Professor541.67%
Information professional650.00%
Age31–40325.00%
41–50541.67%
51–65433.33%
Service time (years)1~10325.00%
11~20433.33%
21+541.67%
Table 5. The relative weights of the decision constructs.
Decision ConstructsRelative WeightRankingConsistency Analysis
Information security control (CC)0.3401Inconsistency = 0.02 with 0 missing judgments.
Network behavior (CD)0.2622
User’s PC operation behavior (CB)0.2603
Computer basic information (CA)0.0834
Printing control (CE)0.0565
Table 6. The relative weights of the decision criteria under the construct CA.
Decision ConstructsRelative WeightRankingConsistency Analysis
Network information (ac−5)0.3451Inconsistency = 0.02 with 0 missing judgments.
Software information (ac-4)0.2842
Hardware information (ac-3)0.1613
Computer name (ac-1)0.1074
Electronic data (ac-6)0.0565
Username (ac-2)0.0476
Table 7. The relative weights of the decision criteria under the construct CB.
Decision ConstructsRelative WeightRankingConsistency Analysis
Log (bc-7)0.3121Inconsistency = 0.02 with 0 missing judgments.
Process (bc-1)0.1932
File and path (bc-2)0.1203
Certificate (bc-9)0.1094
Power on/off and log in/out (bc-5)0.0805
Peripheral input/output devices (bc-6)0.0806
Keyword (bc-8)0.0557
CPU utilization (bc-3)0.0268
Disk utilization (bc-4)0.0259
Table 8. The relative weights of the decision criteria under the construct CC.
Decision ConstructsRelative WeightRankingConsistency Analysis
Internet control (cc-3)0.3811Inconsistency = 0.01 with 0 missing judgments.
Hardware/software control (cc-1)0.2512
Storage control (cc-2)0.2103
Screen control (cc-4)0.1034
Biometrics control (cc-5)0.0545
Table 9. The relative weights of the decision criteria under the construct CD.
Decision ConstructsRelative WeightRankingConsistency Analysis
Browser’s history record (dc-2)0.6771Inconsistency = 0.00471 with 0 missing judgments.
Current network traffic volume (dc-1)0.2402
Connection time (dc-3)0.0833
Table 10. The priority of the decision criteria under the construct CE.
Decision ConstructsRelative WeightRankingConsistency Analysis
Watermark control (ec-2)0.5471Inconsistency = 0.00471 with 0 missing judgments.
Watermark setting (ec-1)0.3362
Printing permission control (ec-3)0.1173
Table 11. The absolute weights of the overall decision criteria under the decision goal.
Decision ConstructsRelative WeightRankingConsistency Analysis
Browser’s history record (dc-2)0.1771Inconsistency = 0.01 with 0 missing judgments.
Internet control (cc-3)0.1302
Hardware/software control (cc-1)0.0853
Log (bc-7)0.0814
Storage control (cc-2)0.0725
Current network traffic volume (dc-1)0.0636
Process (bc-1)0.0507
Screen control (cc-4)0.0358
File and path (bc-2)0.0319
Watermark control (ec-2)0.03110
Network information (ac-5)0.02911
Certificate (bc-9)0.02812
Software information (ac-4)0.02413
Connection time (dc-3)0.02214
Power on/off and log in/out (bc-5)0.02115
Peripheral input/output devices (bc-6)0.02116
Watermark setting (ec-1)0.01917
Biometrics control (cc-5)0.01818
Keyword (bc-8)0.01419
Hardware information (ac-3)0.01320
Computer name (ac-1)0.00921
CPU utilization (bc-3)0.00722
Disk utilization (bc-4)0.00723
Printing permission control (ec-3)0.00724
Electronic data (ac-6)0.00525
Username (ac-2)0.00426
Table 12. The compiled matrixes of criterion weight vectors.
(a) The Matrix of Criterion Weight Vectors under the Decision Goal
CSDM-1DM-2DM-3DM-4DM-5DM-6DM-7DM-8DM-9DM-10DM-11DM-12Aggr.
CA0.0890.0750.0870.0950.0880.0630.0690.0800.220.1030.0340.0420.083
CB0.3700.2930.2260.3040.2070.2200.1960.1810.2420.2300.1740.3380.260
CC0.1860.2930.3830.1730.4230.3920.3560.5120.2420.5610.4460.1760.340
CD0.3190.2780.2590.3740.2380.2330.3430.1680.2420.0720.2820.3730.262
CE0.0470.0620.0460.0540.0430.0920.0360.0580.0540.0340.0640.0700.056
(b) The Matrix of Criterion Weight Vectors under the CA construct
CRDM-1DM-2DM-3DM-4DM-5DM-6DM-7DM-8DM-9DM-10DM-11DM-12Aggr.
ac-10.2170.1270.1210.0880.0750.0980.1010.10.0990.0820.0550.0910.107
ac-20.0340.0440.0430.0520.0360.0410.0520.0350.0590.0510.0330.0550.047
ac-30.1390.1540.3440.0990.1860.1220.1630.1450.1640.1470.2890.0450.161
ac-40.3460.3240.2120.2540.2230.2260.2690.2330.2220.3920.2890.2510.284
ac-50.2250.320.2440.4650.4350.4750.3660.440.4010.2870.2890.1350.345
ac-60.0390.0310.0360.0410.0450.0390.0480.0490.0560.0420.0450.4230.056
(c) The Matrix of Criterion Weight Vectors under the CB construct
CRDM-1DM-2DM-3DM-4DM-5DM-6DM-7DM-8DM-9DM-10DM-11DM-12Aggr.
bc-10.2560.1730.2060.2670.2330.1920.2390.2190.1970.0480.3110.0790.193
bc-20.140.1860.0920.1030.1040.0710.1320.1170.090.2770.0570.1070.12
bc-30.0160.0220.0240.0230.0210.0210.0260.0270.0340.0190.0420.0220.026
bc-40.0170.0220.0190.0210.0190.0210.0210.210.0270.0230.0420.0320.025
bc-50.0470.0660.0620.1080.0850.0730.0890.0760.080.0770.0820.0650.08
bc-60.040.0960.0540.1960.0690.0980.0860.0780.10.0350.0810.0720.08
bc-70.2260.3130.3730.1790.2960.3510.3030.3060.3370.2720.2520.3110.312
bc-80.0390.0610.0280.0440.0410.0470.040.0810.0720.1430.0390.040.055
bc-90.2190.0620.1430.0580.1310.1270.0630.0750.0630.1060.0930.2710.109
(d) The Matrix of Criterion Weight Vectors under the CC construct
CRDM-1DM-2DM-3DM-4DM-5DM-6DM-7DM-8DM-9DM-10DM-11DM-12Aggr.
cc-10.1710.3070.2520.2080.270.2680.350.2240.2310.1950.1410.20.251
cc-20.3420.2660.1310.1510.1320.150.1650.1510.2310.1950.1410.4110.21
cc-30.3740.3070.05160.520.4680.4780.3820.5040.2310.1170.3120.2640.381
cc-40.0820.0890.0670.0790.0940.0690.0660.0850.2310.4480.0550.0580.103
cc-50.0320.0320.0340.0420.0370.0360.0370.0350.0770.0440.3520.0660.054
(e) The Matrix of Criterion Weight Vectors under the CD construct
CRDM-1DM-2DM-3DM-4DM-5DM-6DM-7DM-8DM-9DM-10DM-11DM-12Aggr.
dc-10.3190.2780.1830.2430.2310.2360.2430.2310.230.230.2310.2360.24
dc-20.6150.6630.7420.6690.6920.6820.6690.6920.6480.6480.6920.6820.677
dc-30.0660.0580.0750.0880.0770.0820.0880.0770.1220.1220.0770.0820.083
(f) The Matrix of Criterion Weight Vectors under the CE construct
CRDM-1DM-2DM-3DM-4DM-5DM-6DM-7DM-8DM-9DM-10DM-11DM-12Aggr.
ec-10.2310.4550.250.4550.2360.1780.2360.2310.4290.6480.250.2310.336
ec-20.6920.4550.6810.4550.6820.7510.6820.6920.4290.230.0950.6920.547
ec-30.0770.0910.0690.0910.0820.070.0820.0770.1430.1220.6550.0770.117
Legend: CS: construct, CR: criteria, DM: decision-maker, Aggr.: Aggregated.
Table 13. The correlation strength proportion among all the decision-makers’ decision opinions in the decision goal.
ClassificationStrength%Pairs of Decision-Makers
PositiveVery high27.27(3,5), (6,11), (5,6), (4,12), (3,6), (5,11), (3,11), (8,10), (1,12), (5,8), (1,4), (3,7), (6,8), (7,11),(8,11), (5,7), (3,8), (2,3)
High24.24(6,7), (2,7), (5,10), (1,2), (6,10), (2,6), (2,12), (2,5), (2,4), (3,10), (2,11), (10,11), (7,8), (2,9), (4,7), (3,9)
Moderate22.73(7,12), (7,9), (1,9), (2,8), (4,9), (5,9), (1,7), (7,10), (2,10), (1,3), (3,12), (3,4), (9,12), (6,9),(9,11)
Low16.67(6,12), (1,6), (8,9), (11,12), (9,10), (1,5), (4,11), (4,6), (5,12), (4,5), (1,11)
Little9.09(1,8), (8,12), (4,8), (1,10), (10,12), (1,4)
Table 14. The correlation strength proportion among all the decision-makers’ decision opinions under the decision construct CA.
ClassificationStrength%Pairs of Decision-Makers
PositiveVery high27.27(8,9), (5,9), (6,8), (4,6), (6,9), (4,8), (5,8), (4,9), (5,6), (7,9), (7,8), (5,7), (4,7), (4,5), (2,10), (2,7), (6,7), (3,11)
High33.33(2,8), (2,9), (1,2), (2,4), (7,10), (2,5), (1,10), (2,6), (7,11), (211), (10,11), (5,11), (9,11), (4,10), (9,10), (8,10), (8,11), (5,10), (1,7), (6,10), (6,11), (4,11)
Moderate21.21(3,5), (3,7), (1,11), (2,3), (3,9), (1,8), (1,4), (1,9), (3,8), (1,6), (1,5), (3,10), (3,6), (1,3)
Low01.52(3,4)
Little01.52(10,12)
NegativeLittle13.64(1,12), (4,12), (2,12), (8,12), (6,12), (7,12), (9,12), (5,12), (11,12)
Low01.52(3,12)
Table 15. The correlation strength proportion among all the decision-makers’ decision opinions under the decision construct CB.
ClassificationStrength%Pairs of Decision-Makers
PositiveVery high21.21(3,6), (3,5), (6,9), (5,7), (5,6), (7,9), (3,9), (2,7), (5,9), (2,9), (3,7), (6,7), (5,11), (7,11)
High43.94(1,5), (2,3), (2,5), (2,6), (9,11), (6,11), (3,11), (1,3), (4,11), (3,12), (1,11), (4,7), (6,12), (1,6), (1,7), (8,9), (7,8), (3,8), (2,10), (6,8), (1,12), (5,12), (5,8), (4,5), (2,11), (2,8), (8,11), (4,9), (1,2)
Moderate22.73(1,9), (4,6), (2,4), (9,12), (2,12), (3,4), (1,4), (10,12), (7,12), (3,10), (1,8), (9,10), (7,10), (6,10), (5,10)
Low7.58(4,8), (11,12), (1,10), (8,12), (8,10)
Little4.55(4,12), (10,11), (4,10)
Table 16. The correlation strength proportion among all the decision-makers’ decision opinions under the decision construct CC.
ClassificationStrength%Pairs of Decision-Makers
PositiveVery high13.64(4,8), (5,6), (6,8), (5,8), (4,6), (4,5), (6,7), (5,7), (2,7)
High21.21(1,12), (7,8), (4,7), (1,2), (2,6), (2,5), (2,12), (1,4), (1,8), (2,8), (1,6), (2,4), (2,9), (1,5)
Moderate13.64(1,7), (1,9), (2,3), (7,9), (9,10), (5,9), (6,9), (9,12), (8,9)
Low15.15(3,7), (7,12), (4,9), (3,9), (6,12), (8,12), (4,12), (5,12), (4,11), (3,12)
Little15.15(8,11), (6,11), (5,11), (3,6), (3,5), (1,3), (7,11), (3,10), (1,11), (3,8)
NegativeLittle16.67(3,4), (11,12), (2,11), (2,10), (1,10), (5,10), (10,12), (7,10), (8,10), (4,10), (6,10)
Low1.52(3,11)
Moderate1.52(9,11)
High1.52(10,11)
Table 17. The correlation strength proportion among all the decision-makers’ decision opinions under the decision construct CD.
ClassificationStrength%Pairs of Decision-Makers
PositiveVery high100.0All pairs of 12 DMs
Table 18. The correlation strength proportion among all the decision-makers’ decision opinions under the decision construct CE.
ClassificationStrength%Pairs of Decision-Makers
PositiveVery high36.36(7,8), (5,7), (5,8), (4,9), (2,9), (2,4), (8,12), (7,12), (5,12), (112), (1,8), (1,7), (1,5), (3,7), (3,5), (3,8), (3,12), (1,3), (6,8), (6,7), (5,6), (6,12), (1,6), (3,6),
High4.55(3,4), (3,9), (2,3)
Moderate31.82(7,9), (5,9), (4,7), (4,5), (2,7), (2,5), (8,9), (4,8), (2,8), (9,12), (4,12), (2,12), (1,9), (1,4), (1,2), (9,10), (4,10), (2,10), (6,9), (4,6), (2,6)
NegativeLittle10.61(3,10), (7,10), (5,10), (10,12), (8,10), (1,10), (6,10)
Low1.52(10,11)
High10.61(6,11), (11,12), (8,11), (1,11), (7,11), (5,11), (3,11),
Very high4.55(4,11), (2,11), (9,11)
Table 19. The closest and farthest cosine similarities among pairs of decision-makers’ decision opinions in the decision goal.
ClosestFarthestRanking
Pair of Decision-MakersCosine DistancePair of Decision-MakersCosine Distance
(3,5)0.004(10,12)0.3721
(3,6)0.006(4,10)0.3672
(4,12), (5,6)0.007(1,10)0.3243
(5,11)0.011(8,12)0.2894
(1,12)0.012(4,8)0.2815
Table 20. The closest and farthest cosine similarities among pairs of decision-makers’ decision opinions under the decision construct CA.
ClosestFarthestRanking
Pair of Decision-MakersCosine DistancePair of Decision-MakersCosine Distance
(4,6), (6,8), (8,9)0.003(3,12)0.4921
(5,8), (5,9),0.004(6,12)0.4662
(4,8)0.006(5,12)0.4573
(7,9)0.007(4,12)0.4474
(5,6), (6,9)0.010(8,12)0.4385
Table 21. The closest and farthest cosine similarities among pairs of decision-makers’ decision opinions under the decision construct CB.
ClosestFarthestRanking
Pair of Decision-MakersCosine DistancePair of Decision-MakersCosine Distance
(3,6)0.008(4,10)0.3461
(6,9)0.014(10,11)0.3442
(3,5), (5,7), (7,9)0.016(4,12)0.3093
(5,6)0.017(11,12)0.2364
(2,7)0.023(1,10), (8,10)0.2325
Table 22. The closest and farthest cosine similarities among pairs of decision-makers’ decision opinions under the decision construct CC.
ClosestFarthestRanking
Pair of Decision-MakersCosine DistancePair of Decision-MakersCosine Distance
(4,8)0.001(10,11)0.5261
(5,6)0.002(4,10)0.4702
(6,8)0.004(6,10), (8,10)0.4523
(5,8)0.006(3,11)0.4404
(4,6)0.008(5,10)0.4215
Table 23. The closest and farthest cosine similarities among pairs of decision-makers’ decision opinions under the decision construct CE.
ClosestFarthestRanking
Pair of Decision-MakersCosine DistancePair of Decision-MakersCosine Distance
(1,3), (1,5), (1,7), (1,8), (1,12), (2,4), (3,5), (3,7), (3,8), (3,12), (5,7), (5,8), (5,12), (7,8), (7,12), (8,12)0.000(6,11)0.7051
(1,6), (2,9), (4,9), (6,8), (6,12)0.004(3,11)0.6662
(5,6), (6,7)0.005(1,11), (8,11), (11,12)0.6653
(3,6)0.007(5,11), (7,11)0.6554
(2,3), (3,4)0.092(2,11), (4,11)0.5295
Table 24. A summary of Pearson correlation coefficients and cosine distances among all pairs of decision-makers’ decision opinions.
Decision Goal/Decision ConstructRangeMean Value
Pearson
correlation
coefficients
decision goal0.989~0.0470.5180
decision construct CA0.997~−0.410.2935
decision construct CB0.986~0.1090.5475
decision construct CC0.998~−0.890.0540
decision construct CD1.000~0.9470.9735
decision construct CE1.000~−0.9630.0185
Cosine
distance
decision goal0.004~0.3720.1012
decision construct CA0.003~0.4920.1290
decision construct CB0.008~0.3460.1143
decision construct CC0.001~0.5260.1905
decision construct CD0.000~0.0280.0038
decision construct CE0.000~0.7050.1809
Publisher’s Note: MDPI stays neutral with regard to jurisdictional claims in published maps and institutional affiliations.

