Abstract
This paper presents research on a new type of fabricated steel–wood composite floor material in the style of a slab-embedded beam flange, using test methods and finite element numerical analysis to study the flexural load-bearing performance of the composite slabs. Through experimental phenomena, the failure process and mechanism of the composite floor are analyzed, and the deformation performance and ultimate bearing capacity of the composite floor material are assessed. Through numerical analysis of the finite element model, the influence of the connection mode of the floor and the composite beam, the type and number of connectors, and the width of the flange of the composite beam on the bending performance of the composite beam–slab system is studied. The research results show that the fabricated steel–wood composite floor slab has good load-bearing and deformation performance. The self-tapping screw connection of the floor slab is better than the ordinary steel nail connection, and the reasonable screw spacing is 100–150 mm. Increasing the flange width of the composite beam can significantly improve the load-bearing capacity of the steel–wood composite floor component.
1. Introduction
The production process of traditional building materials consumes a lot of energy and causes serious pollution problems. The development and promotion of environmentally friendly and energy-saving building materials are of great significance to the sustainable development of human society. Compared to other materials, wood has the advantages of lightweight, high strength, easy processing, low carbon, environmental protection, etc. It is a typical green building material and is favorably used in residential buildings.
Assembly timber structure refers to a structure constructed by factory-prefabricated wooden structure components and parts and using on-site assembly as the main method [1,2]. Cold-formed thin-walled steel is lightweight steel that is bent in a cold state to obtain a variety of economical cross-sections. Combining wood and cold-formed thin-walled steel in a certain way can form steel-wood composite components with various cross-sectional forms, which can not only obtain a larger section radius of gyration and moment of inertia and improve the rigidity and load-bearing capacity, but also, with the help of wood’s restraint on thin-walled steel, the problem of premature buckling of thin-walled steel can be effectively solved, and the good effect of saving steel and reducing cost can be realized, which reflects the superiority in a new high-performance combination structure [3].
Several studies have recently conducted research on steel–wood composite structures. Loss and Buick Davidson [4] conducted an experimental study on the failure modes of composite slabs under horizontal loads. The results show that the main deformation of the slab is concentrated at the beam–beam joints and the steel–wood composite material has good elastic properties without fracture. Xia Yonghui [5] studied the influence of steel plate thickness and other factors on the natural vibration and bending characteristics of composite slabs. The results show that increasing the thickness of steel and plywood can significantly improve the load-bearing capacity and vibration serviceability of composite panels. The test results of Li Yushun [6] show that the overall working performance of the profiled steel plate–bamboo plywood composite slab is excellent; the bamboo plywood board and the steel plate have a good combined effect and have higher load-bearing capacity and rigidity. Yang Yue [7] studied the flexural performance and failure mode of a steel–concrete composite slab and gave the calculation formula for the flexural bearing capacity. L. Xu and F.M. Tangorra [8] carried out a recent study on the vibration characteristics of cold-formed steel-supported lightweight residential floor systems. On-site tests were also conducted to evaluate the actual vibration performance of the cold-formed steel-supported lightweight residential floor systems. Zhou Xuhong [9] conducted a monotonic static load test on the bearing capacity of a thin-walled steel beam-oriented strand board (OSB) composite slab. The results show that the cold-formed steel joists-OSB composite floor has higher bearing capacity and lower deformation; reducing the screw spacing can improve the bearing capacity of the composite slab. The abovementioned scientific research and [10,11,12,13] have detailed beneficial explorations and obtained valuable conclusions on the combination methods, materials and bending performance of steel–wood composite structures.
The assembly and construction process of multi-story and high-rise wooden structure houses is column (wall) → beam → slab. The size of the floor lap and installation interface provided by ordinary rectangular cross-section wooden beams is small, and the assembly quality of the slab and beam is not easy to control. Under the action of large horizontal load, the shear force of the connecting parts (screws, bolts, etc.) between the plate and the beam is relatively large, which is likely to cause the failure of the force transmission of the beam and plate. This paper proposes a beam–slab system in the form of slab-embedded beams. The floor slab can be directly embedded into the board grid formed by prefabricated beams during assembly. The accuracy of installation is high, and the limiting effect of the beam on the floor can reduce the stress level of the assembly parts and provide the reliability of the beam–slab system. In the system, the prefabricated beam is a thin-walled steel–glulam composite beam, which can greatly reduce the weight of the beam. The lower part of the beam is a double “C”-shaped cold-formed thin-walled steel composite section, and the upper part adopts a special shaped cross-section with a middle protrusion (the height of the protrusion is the same as the thickness of the floor), which can form a groove between the beams during the installation of the floor. The wide and thick flanges of the composite beams provide sufficient space for the assembly and connection of the floor slabs and ensure good assembly performance of the floor slab and the composite beams. This form of beam can be adapted to medium- and small-span OSB floor slabs and large-span cross-laminated timber plate.
At present, there is no research on steel-wood composite beam–slab structure systems in the literature, and the performance of beam–slab collaboration in fabricated beam–slab systems is not clear. This paper uses the methods of experiments and finite element numerical analysis to study the assembly performance of composite beams and slabs; the flexural load-bearing capacity and the failure mode of the special shaped cross-section steel-wood composite beam and steel–wood composite slabs composed of composite beams and floor slabs. Moreover, this paper uses the finite element analysis method to explore the key factors affecting the bearing capacity of the steel-wood composite floor.
2. Test Overview
2.1. Specimen Design
The multi-span continuous slab–beam system in the project is shown in Figure 1a. Due to the limitation of the test loading equipment, the test piece shown in Figure 1a cannot be loaded in a laboratory. In the experimental research, the test model is correspondingly simplified. The simplified model shown in Figure 1b can characterize the stress state of the middle section of the continuous floor; therefore, the design and processing of the test model have been carried out.
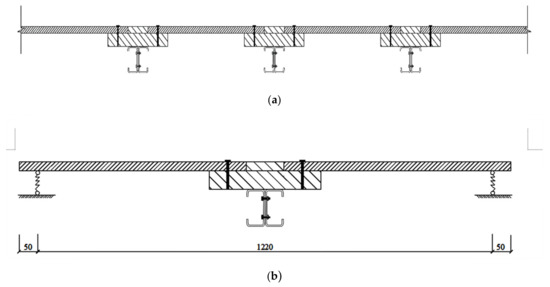
Figure 1.
Schematic diagram of multi-span continuous plate–beam system and simplified model. (a) 1-1 Multi-span continuous beam-and-slab system; (b) simplified model (mm).
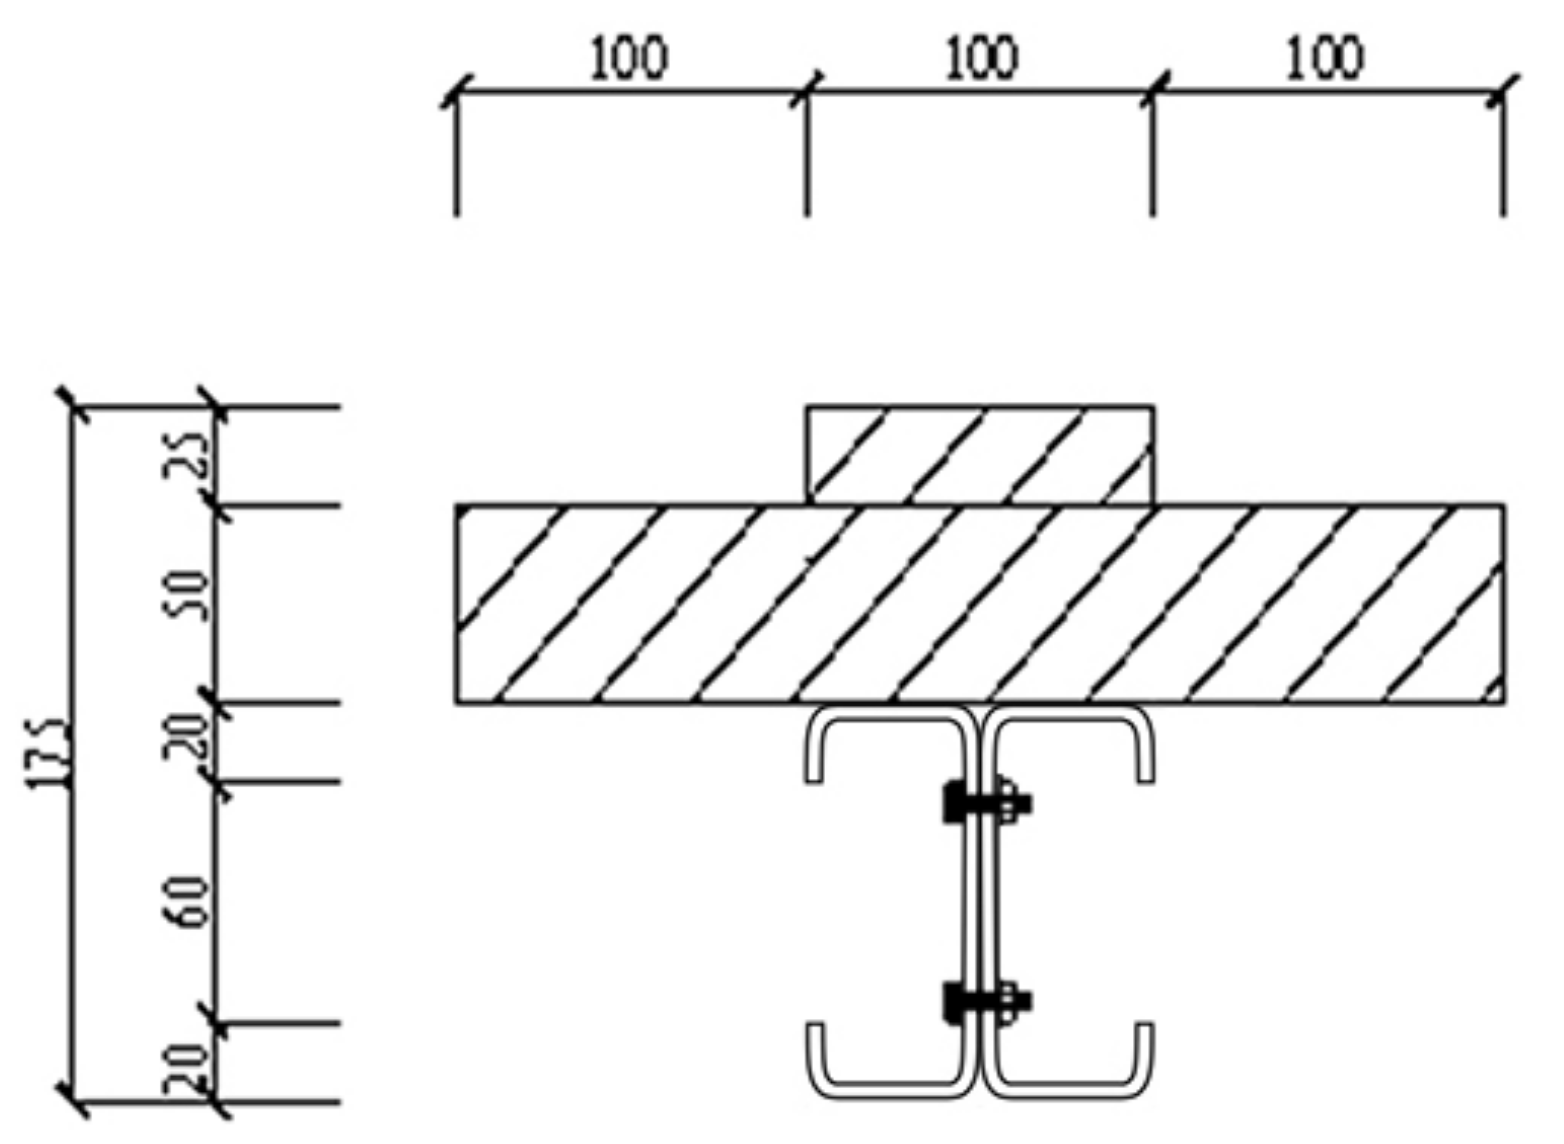
The cross-section design of the steel–wood composite beam used in the test and analysis is shown in Figure 2. The outer profile size of the lower double “C”-shaped cold-formed thin-walled steel composite cross-section was 100 × 100 mm, and the upper laminated material was 100 mm plywood (single layer thickness is 25 mm; 3 layers in total); the size of the partially protruding glulam (glued laminated timber) was 100 mm × 25 mm and the size of the extended flanges on both sides was 100 mm × 50 mm. The wooden floor choice was a 25-mm-thick OSB.

Figure 2.
Schematic diagram of steel–wood composite beam section (mm).
The two composed sets of experimental samples were processed and made by professional factories; the dimensions of the parts are shown in Table 1. The two groups of specimens were named ZHLB-1 and ZHLB-2. Between them, ZHLB-1 utilized iron nails with a length of 80mm as the fixing parts of the slab on the flange of the composite beam; ZHLB-2 used 80mm self-tapping screws produced by Shanghai Meigu Chengfan Fasteners Co., Ltd. as the fixing parts of the slab on the flange of the laminated beam. The grouping of test pieces is shown in Table 1.

Table 1.
Grouping table of composite floor test pieces. OSB—oriented strand board.
To implement the test and meet the boundary conditions of vertical free deformation of the unconnected section of the floor slab in Figure 3b, an elasticity support composed of a rectangular extruded foam board and glulam with a cross-sectional size of 100 mm × 50 mm was set in the test. During the test, the elastic support did not produce an excessive reaction force to the floor slab that hinders the loading of the floor slab. The test pieces of the composite floor are shown in Figure 3.
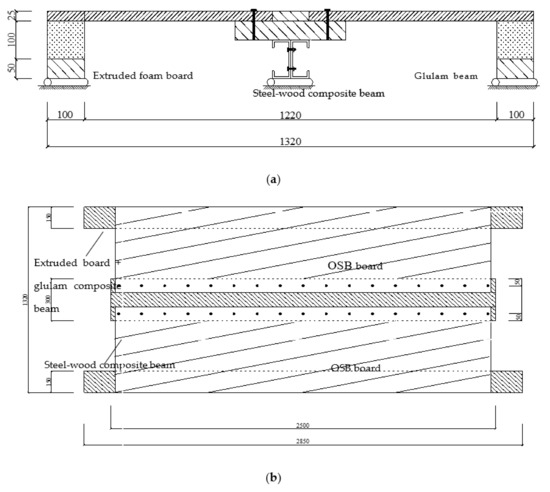
Figure 3.
(a) 1-1 section picture of the prefabricated steel–wood composite floor test piece; (b) structure drawing of the composite floor test piece (mm).
According to the calculation of “Wood Structure Design Standard” (GB/T50005-2017) [14], the distance between the connecting pieces was 150mm; the size and structure of the test pieces are shown in Figure 3b.
2.2. Material Properties Text
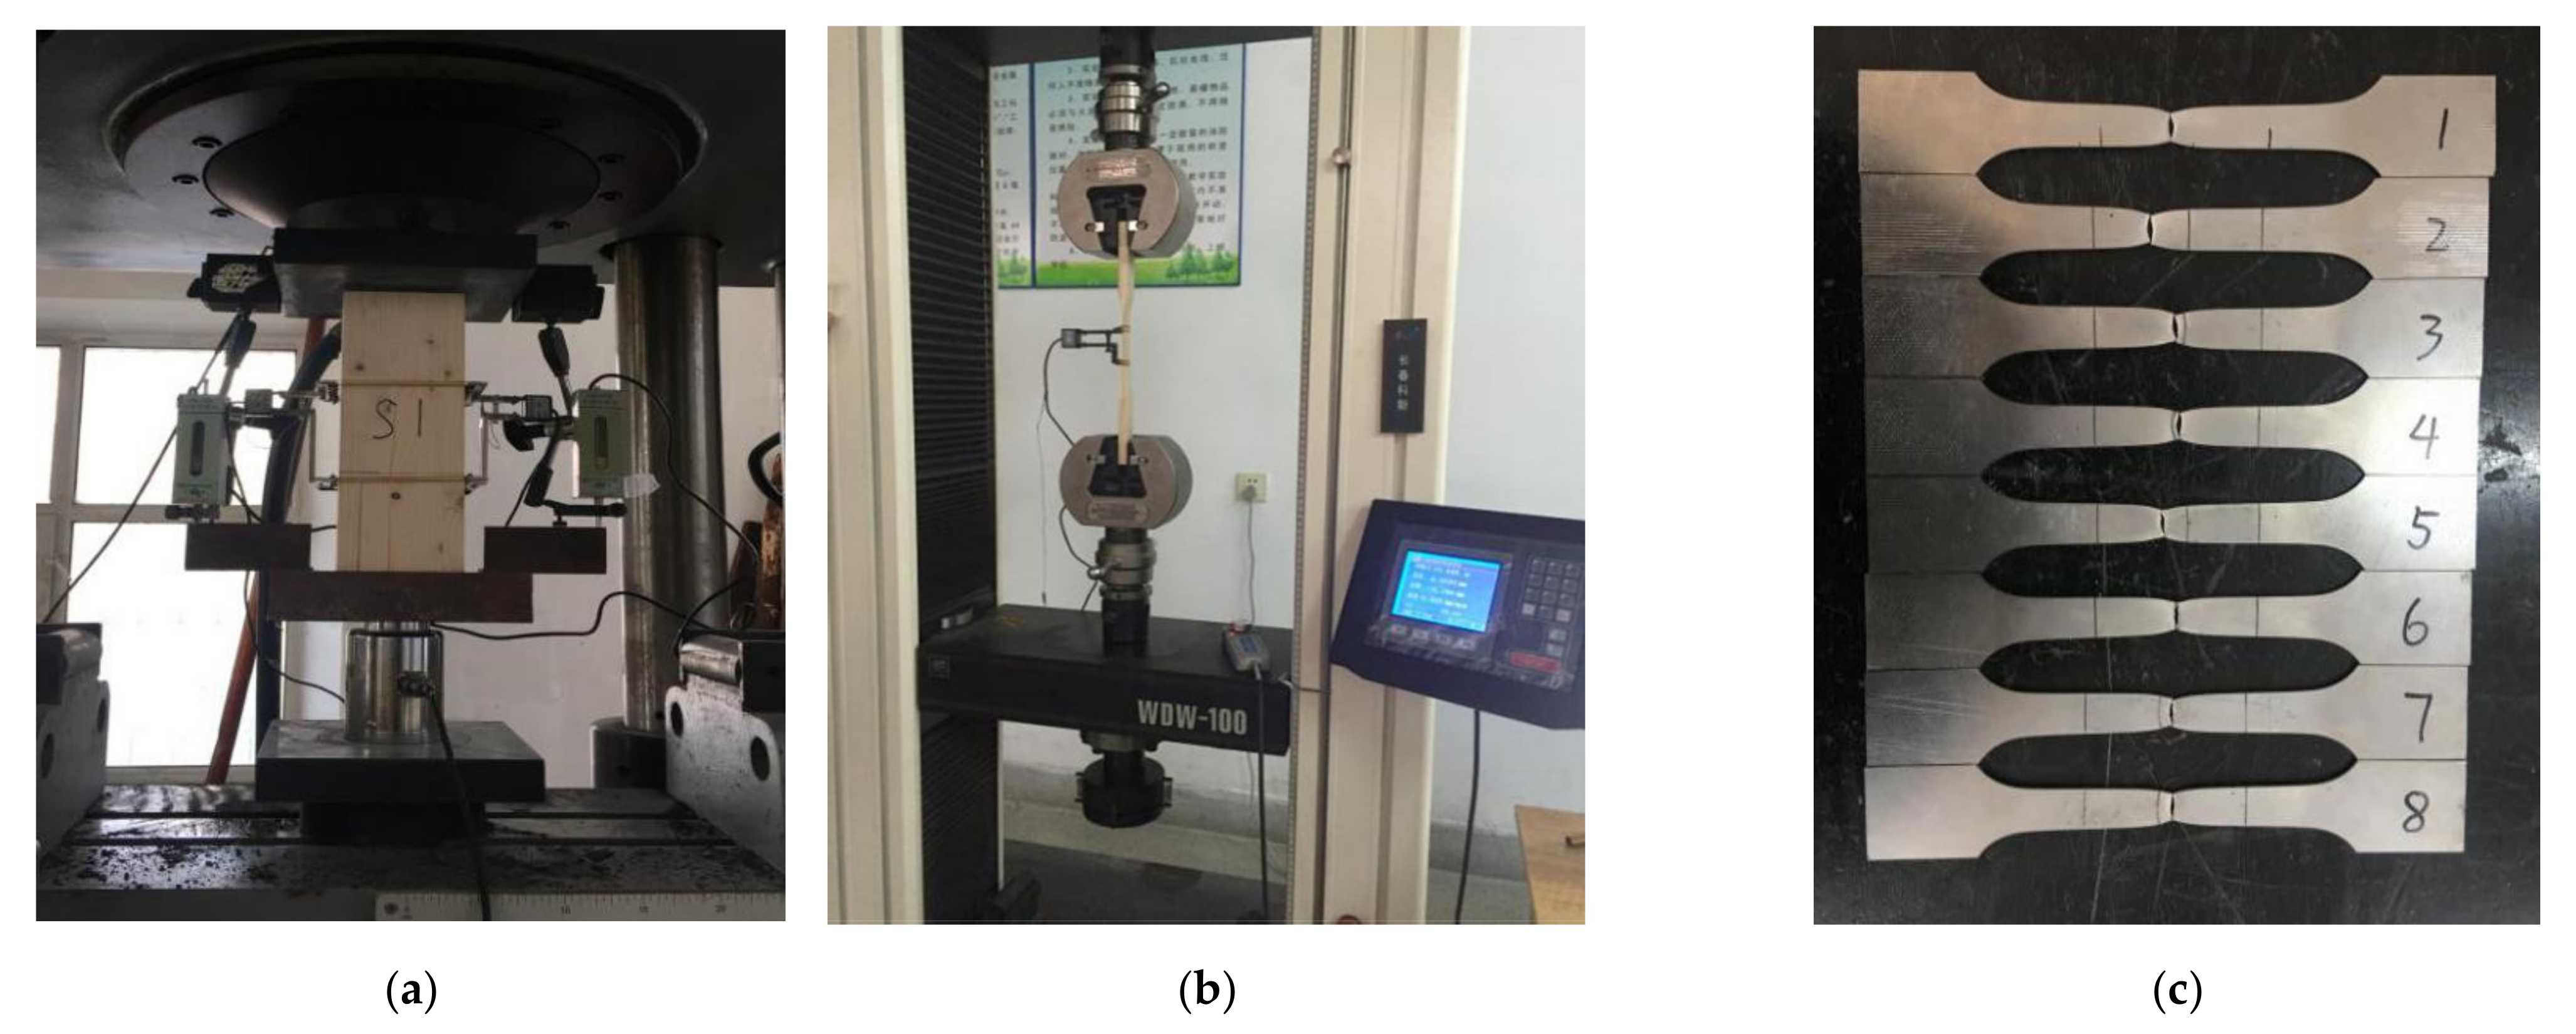
In accordance with the “Test Method for Tensile Strength of Wood Along the Grain” (GB/T 1938-2009) and the “Metallic Material Tensile Test-Part 1 Room Temperature Test Method” (GB/T 228.1-2010), the wood and steel used to make the test pieces were tested. According to the along-grain compression test of 15 prismatic glulam specimens (Figure 4a), the along-grain compressive strength of the glulam was 50.10 MPa, and the compressive elastic modulus of the glulam was 10,722.13 MPa. According to the along-grain tensile test of the glulam specimens (Figure 4b), the tensile strength along the grain was 74.61 MPa, and the tensile elastic modulus was 9912.00 MPa. According to the material property test of the steel (Figure 4c), the elastic modulus was taken as 195,687.65 MPa; the Poisson’s ratio was taken as 0.3; the yield stress was taken as 225.41 MPa and the tensile strength was 332.72 MPa. The material parameters of OSB [15], extruded board [16], steel glue [17] and other components are shown in Table 2.

Figure 4.
(a) Diagram of loading device for compression test of glulam prism. (b) Tensile test of glulam specimen. (c) Destruction phenomenon of steel tensile test.
Table 2.
Material parameters of OSB, extruded board and steel glue.
The test adopted the symmetrical four-point loading method. The loading equipment required was a 32t jack and a distribution beam, 1000 mm long. I-beams were arranged at the three points of the specimen for uniform loading. This test was a simple support test piece. For failure loading, loading started from F0 and increased step by step with 10% of the estimated ultimate load. After loading to 50% of the estimated ultimate load, the load of each level increased by 5% of the estimated ultimate load until the specimen failed. After stopping the loading, the damage pattern was observed and recorded.
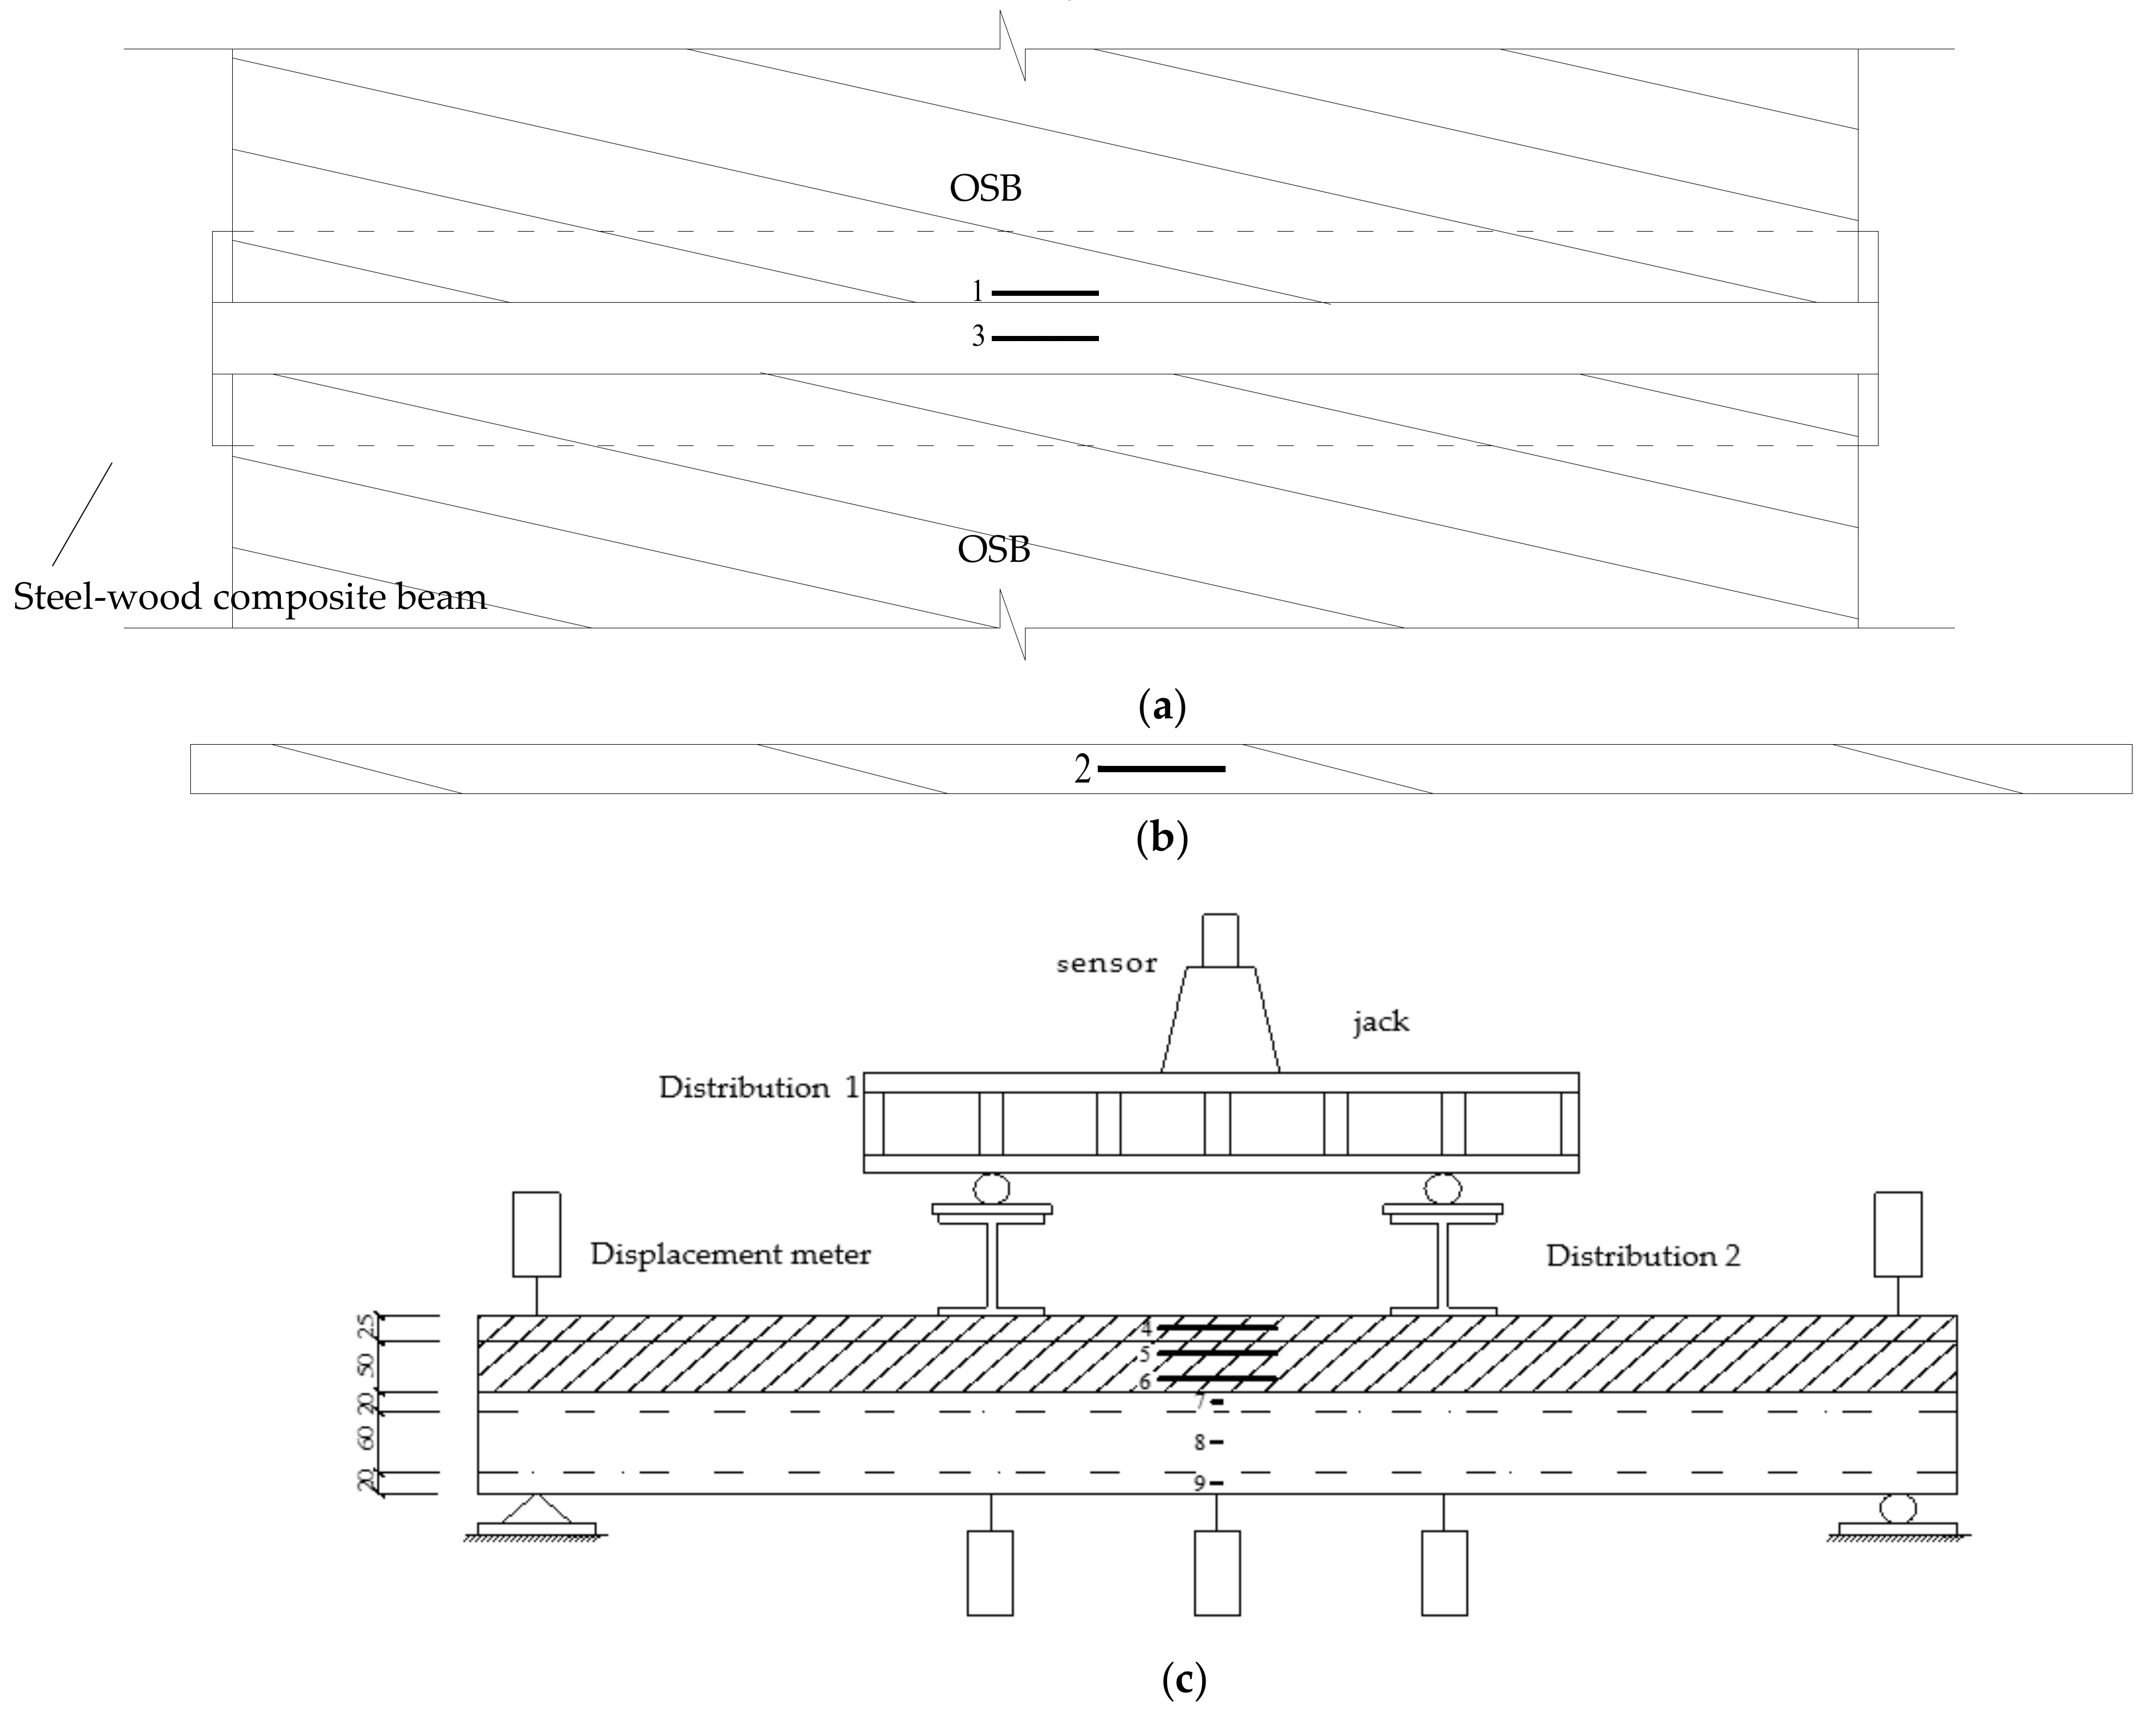
Two strain sensors with a size of 100 mm × 3 mm were set at the top of the OSB plate in the middle of the span and the middle of the height along the section in the middle of the span. In order to measure the strain change of the mid-span section of the thin-walled steel–glulam composite beam, 1 strain sensor was set on the top of the mid-span beam and 3 strain sensors with a specification of 100 mm × 3 mm were set on the three-layer glued laminate. Three strain sensors were set along the height of the steel beam section on the I-beam on the same side, sized 2 mm × 3 mm, to measure the strain of the mid-span section of the composite beam. These strain sensors were in the middle, upper edge and lower edge of the web. At the same time, the corresponding temperature compensation sheet was set for OSB, glulam and thin-walled steel. Displacement sensors were set at the mid-span of the laminated beam with a displacement sensor with a range of 200 mm, two displacement sensors with a range of 150 mm at the third point and two displacement sensors with a range of 100 mm at the support. The specific location and loading device are shown in Figure 5. The measuring instrument used a 50t pressure sensor, a 60-channel JM3813 static strain test system and a 10-channel DH3818 static strain tester.
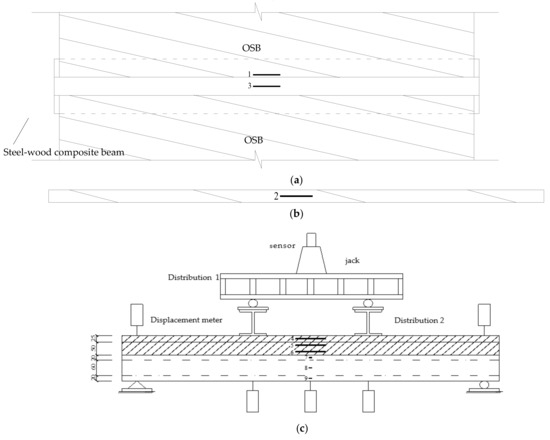
Figure 5.
Layout of measuring points for bending test of steel–wood composite floor. The strain sensors were attached to the measuring point tightly and the displacement sensors were fixed at the measuring point. (a) Plan view of combined floor measuring points; (b) elevation view of OSB measuring points. (c) Elevation view of composite beam measuring point (mm).
3. Test Results and Analysis
3.1. Test Phenomenon
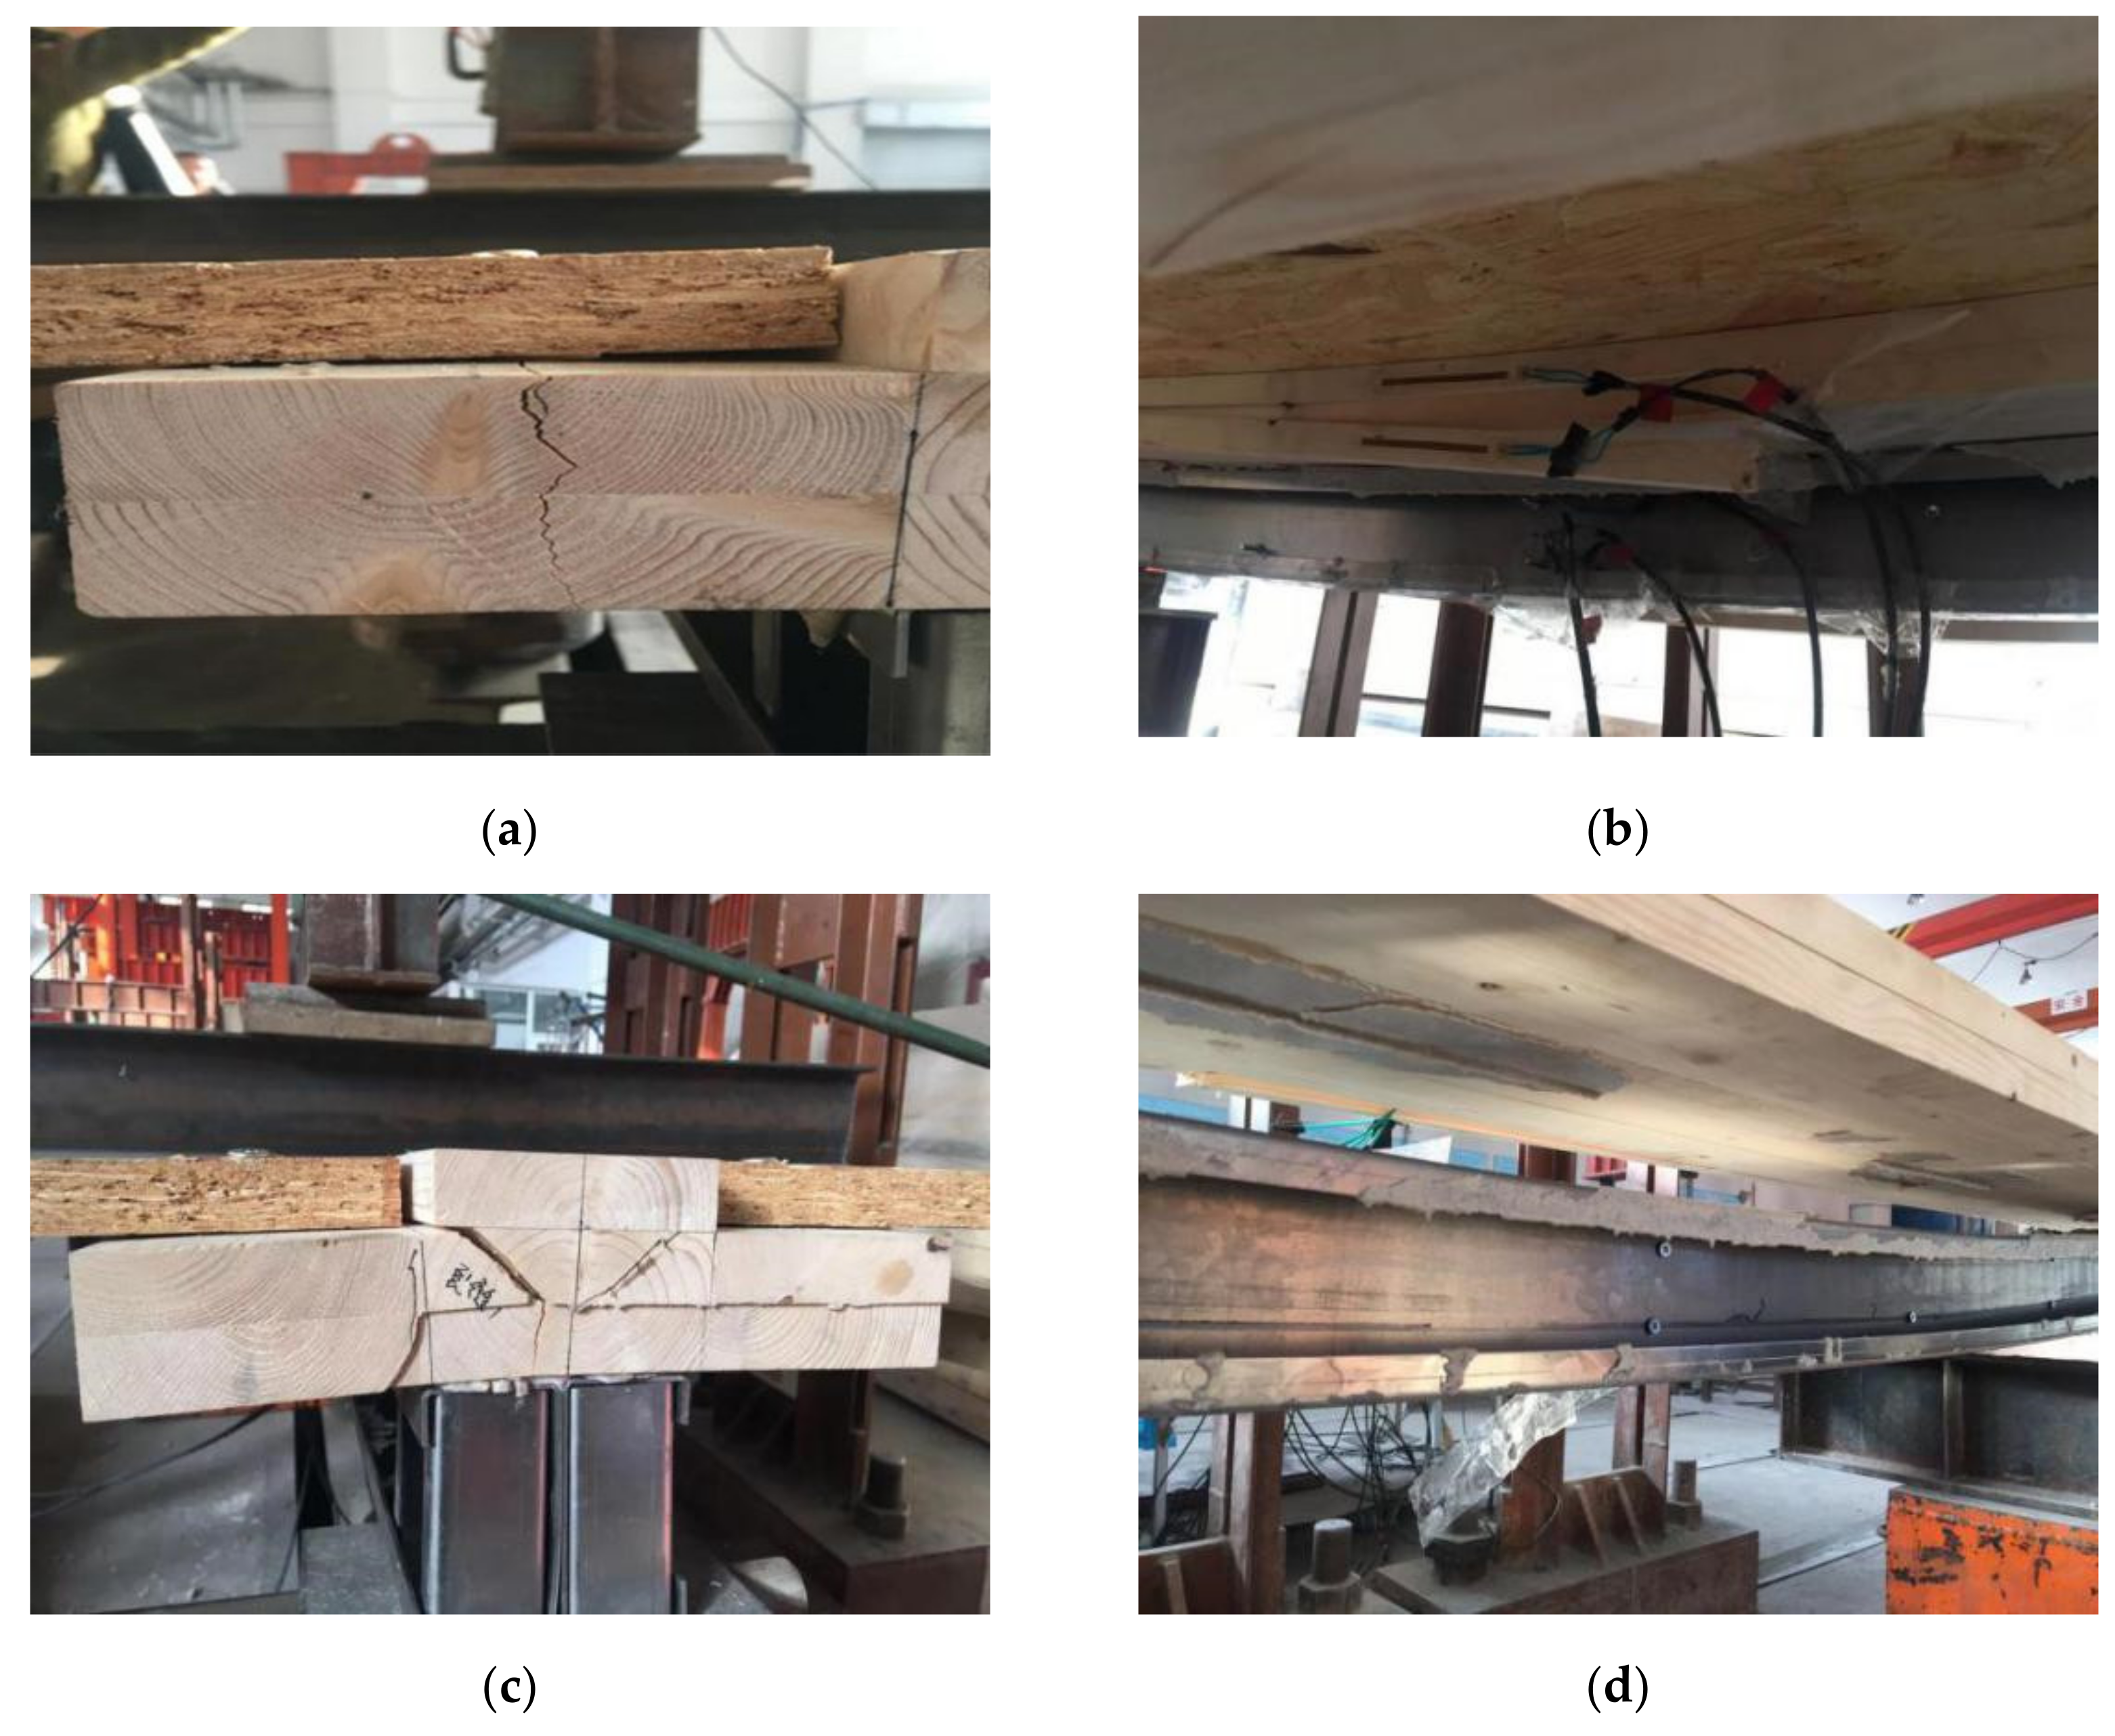
The failure mode of the ZHLB-1 group of specimens can be roughly divided into the cracking of the glue layer of the glulam laminate and the fracture of the upper flange of the steel–wood beam, as shown in Figure 6. In the failure loading stage, as the load increases, the bending deformation of the composite beam gradually increases (as shown in Figure 6a) and vertical cracks appear on one flange of the transverse tension glulam (as shown in Figure 6b). When the load reaches about 80% of the maximum bearing capacity, the vertical crack width here gradually expands, and the glued wood laminate is opened at the mid-span part and extends to the support part (as shown in Figure 6c). When the load reaches the ultimate bearing capacity, the glulam laminate is completely degummed along the length of the beam and the iron nails are pulled out (as shown in Figure 6d). Finally, the entire glulam laminate is completely degummed and destroyed along the length of the beam. At this time, the pressure sensor indicator drops below 50% of the maximum bearing capacity, and the bearing capacity of the composite floor is reduced and the load cannot be continued. At this time, the composite floor is regarded as broken.
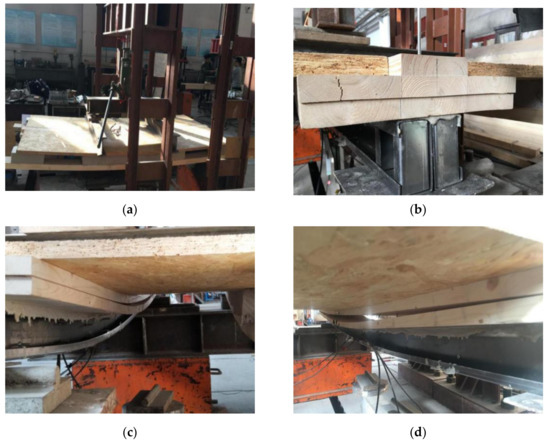
Figure 6.
Failure phenomenon of ZHLB-1 test. (a) Bending deformation of steel–wood composite floor; (b) vertical cracks appear on the left flange of glulam; (c) glued wood laminates are broken; (d) the iron nails connected to the glulam laminate are pulled out.
The failure mode of the ZHLB-2 specimen is roughly that the glued surface of the thin-walled steel and glulam is broken and the flange on one side of the glulam is broken, as shown in Figure 7. In the failure loading stage, as the load increases, the bending deformation of the composite floor gradually increases. The cemented surface of the steel–wood beam mid-span is broken, and the flange on the side of the glulam has vertical cracks (as shown in Figure 7a). The OSB above the foam beam of the plastic board is sinking and deformed downward. When the load reaches about 60 kN, the cemented surface of the mid-span part of the laminated beam is degummed, and the bottom of the glulam beam changes from a compressed state to a tensioned state, causing the bottom of the glulam beam to be broken (as shown in Figure 7b). When the load reaches about 80% of the maximum bearing capacity, an oblique crack appears at the glulam bearing position; the load continues to increase, and the oblique crack gradually expands laterally (as shown in Figure 7c). This is because when the specimen is approaching the ultimate load, the surface load on the OSB plate is transformed into a larger linear load and added to the flange of the composite beam; the shear stress in the flange of the laminated beam gradually increases until the main tensile stress in the beam exceeds the tensile strength of the wood’s transverse grain, forming a beam crack of about 45°. At this time, the glued layer of glulam and the glued surface of thin-walled steel also experienced degumming failure, which accelerated the lateral expansion of diagonal cracks. When an oblique crack appeared on the flange of the composite beam, damage occurred on the composite beam from the middle of the span to the bonding surface between the glulam and the thin-walled steel of the support, and finally, the thin-walled steel and the glulam were completely peeled off. At this time, the pressure sensor reading suddenly dropped to about 50% of the maximum bearing capacity, the composite floor could not continue to be loaded and the steel beam underwent very large plastic bending deformation after unloading (as shown in Figure 7d).

Figure 7.
Failure phenomenon of ZHLB-2 test. (a) Vertical cracks appear in the flange of glued wood; (b) the flange on one side of the glulam span is pulled off along the plywood; (c) cracks and deformation of glulam bearings; (d) gluing failure of steel-wood cementing surface as a whole.
3.2. Mid-Span Load–Deflection Curve
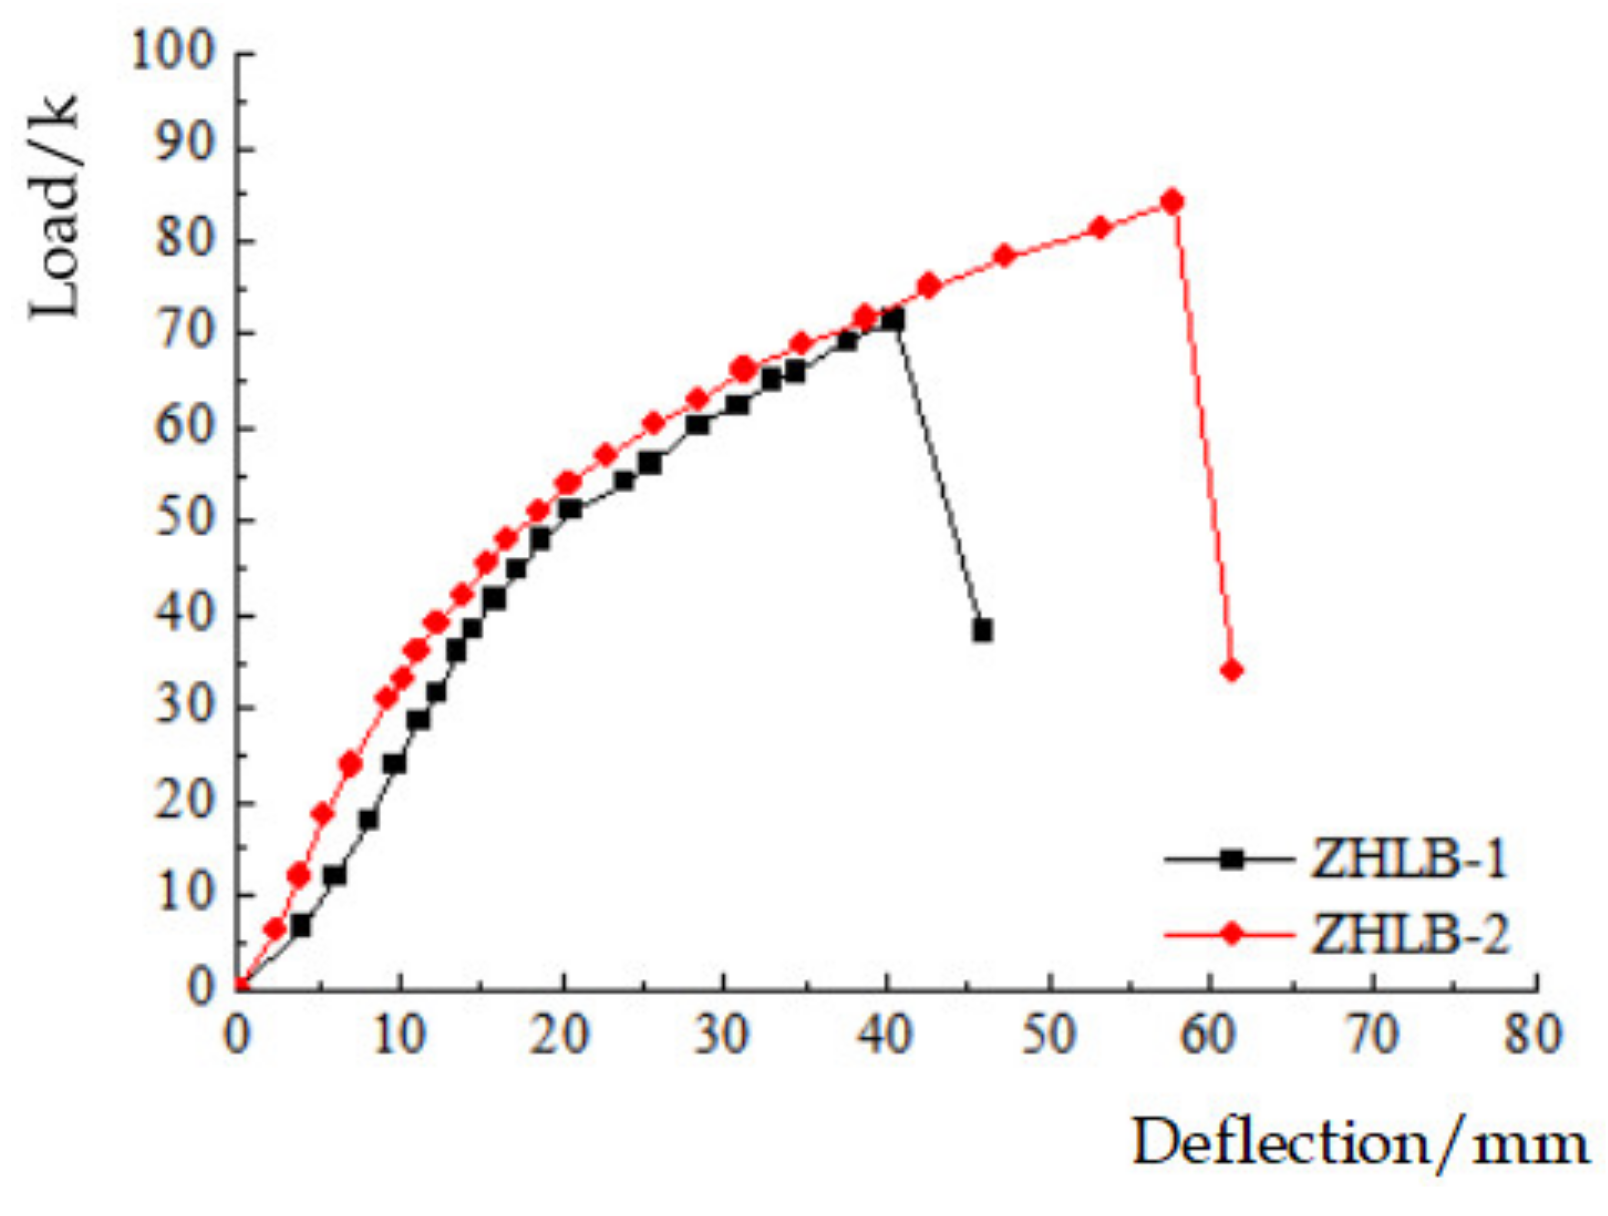
By analyzing the experimental data, it can be concluded that the ultimate bearing capacity of the specimen ZHLB-2 is 18.31% higher than that of the specimen ZHLB-1; the corresponding mid-span deflection deformation is 42.41% higher and the ultimate bending moment is 21.43% higher. After the two groups of tests were completed, the mid-span deflection limit, ultimate load and bending moment of each group of specimens were summarized and are presented in Table 3.
Table 3.
Test results of composite floor specimens.
It can be seen from Figure 8 that the deformation of the test beam with the increase in the load manifests in two stages: (1) The elastic stage, where the load value in this stage reaches 2/3~1/2 of the ultimate bearing capacity and its mid-span deflection value increases linearly with the increase in the load; (2) The elastic–plastic stage—With the increase in the load value, the slope of the mid-span load–strain curve changes nonlinearly, and the stiffness of the member gradually decreases until the member fails. When the specimen finally fails, the composite floor shows good ductility. When the ultimate load is reached, the load drops to less than 50% of the maximum bearing capacity. At the initial stage of loading, the composite floor works well, the load–deflection curve maintains a linear relationship growth and the composite floor is in an elastic working state; when the load of the ZHLB-1 specimen reaches about 65% of the ultimate load, the ZHLB-2 specimen reaches about 60% of the ultimate load, the lower flange of the steel beam yields, the load–deflection curve grows nonlinearly and the composite floor is in the elasto-plastic stage; as the load continues to increase, the deflection growth rate of the composite floor becomes larger and the slope of the mid-span load–deflection curve decreases continuously, the stiffness of the specimen gradually decreases. When the load reached the maximum value, a full-length crack along the length of the beam was observed on the top of the glulam beam, indicating that as the deflection of the top of the glulam beam increases, the beam eventually reaches the ultimate compressive strain and brittle failure occurs. The cemented surface of the steel–wood beam also undergoes brittle failure due to the accumulation of deformation; the thin-walled steel undergoes plastic deformation. At this time, the bearing capacity drops below 50% of the maximum, and the destruction shows obvious brittleness.

Figure 8.
Mid-span load–deflection curve of composite floor specimen.
3.3. Section Mid-Span Height–Strain Curve
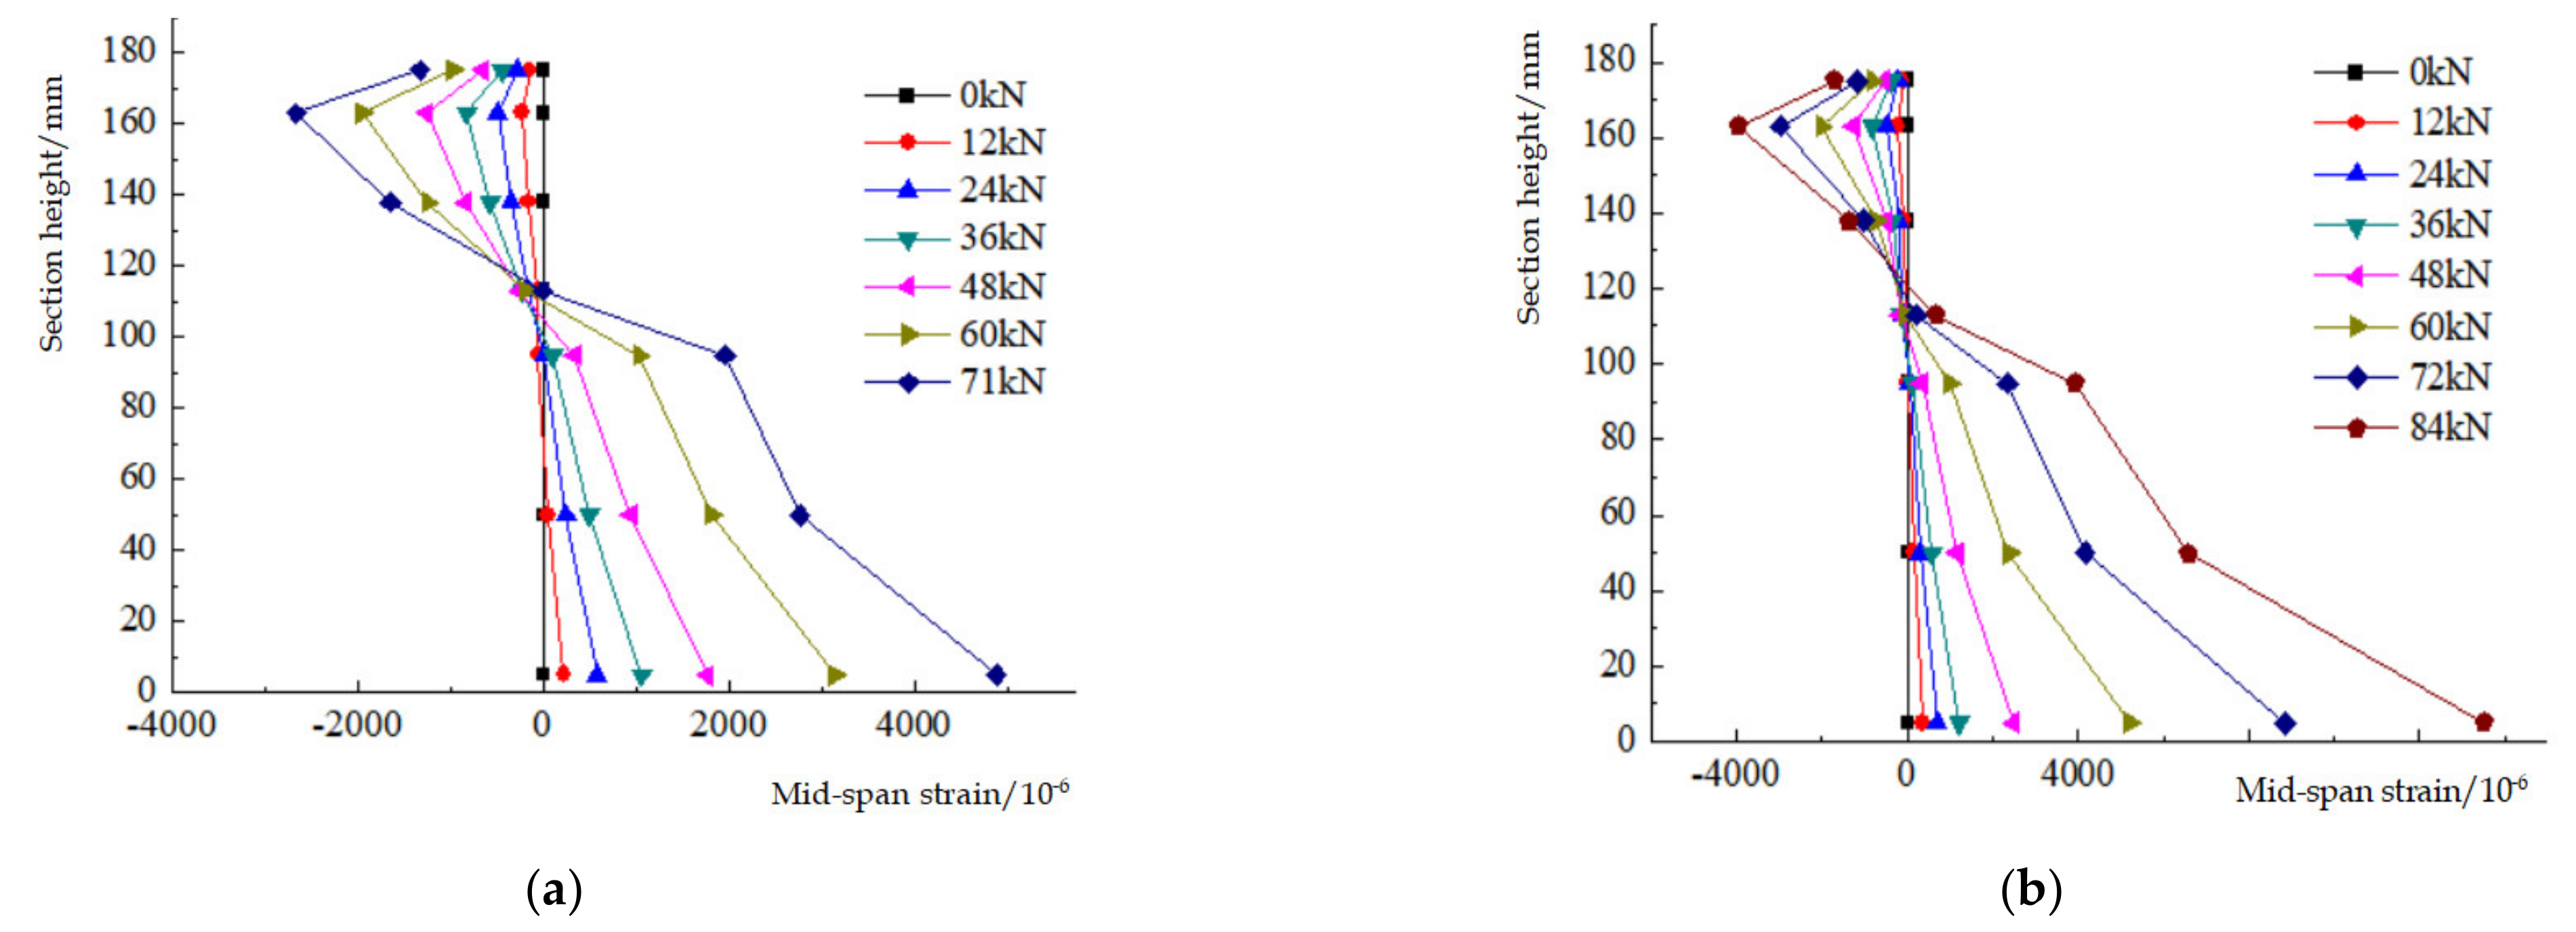
The changes in the strain distribution of the mid-span section of the two specimens ZHLB-1 and ZHLB-2 along the section height are shown in Figure 9. Analysis of the data in the figure shows that during the test, the OSB and glulam are mainly compressed, and the thin-walled steel is mainly tensioned. There is only one neutral axis in the cross-section of the composite beam of ZHLB-1 and ZHLB-2 before failure. The strain value has a linear relationship with the section height. At the beginning of loading, the neutral axis of ZHLB-1 and ZHLB-2 is located in the section of thin-walled steel. As the load increases, the central axis slowly moves up, and at the end of the loading stage, the neutral axis moves up to the glulam section. The height of the mid-span section of the composite slab is linearly distributed, and the OSB slab and the thin-walled steel–glulam composite beam also have a gradient change. A few curves have abrupt changes, which are caused by the warping of the strain gauges during the test.
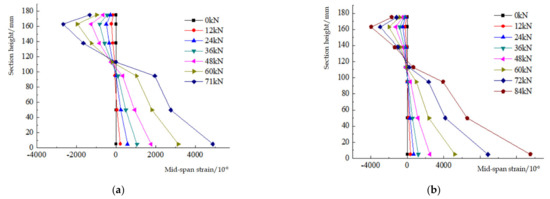
Figure 9.
Steel–wood composite floor section mid–span height–strain curve. (a) ZHLB–1 section mid–span height–strain curve; (b) ZHLB–2 section mid–span height–strain curve.
3.4. Load–Strain Curve
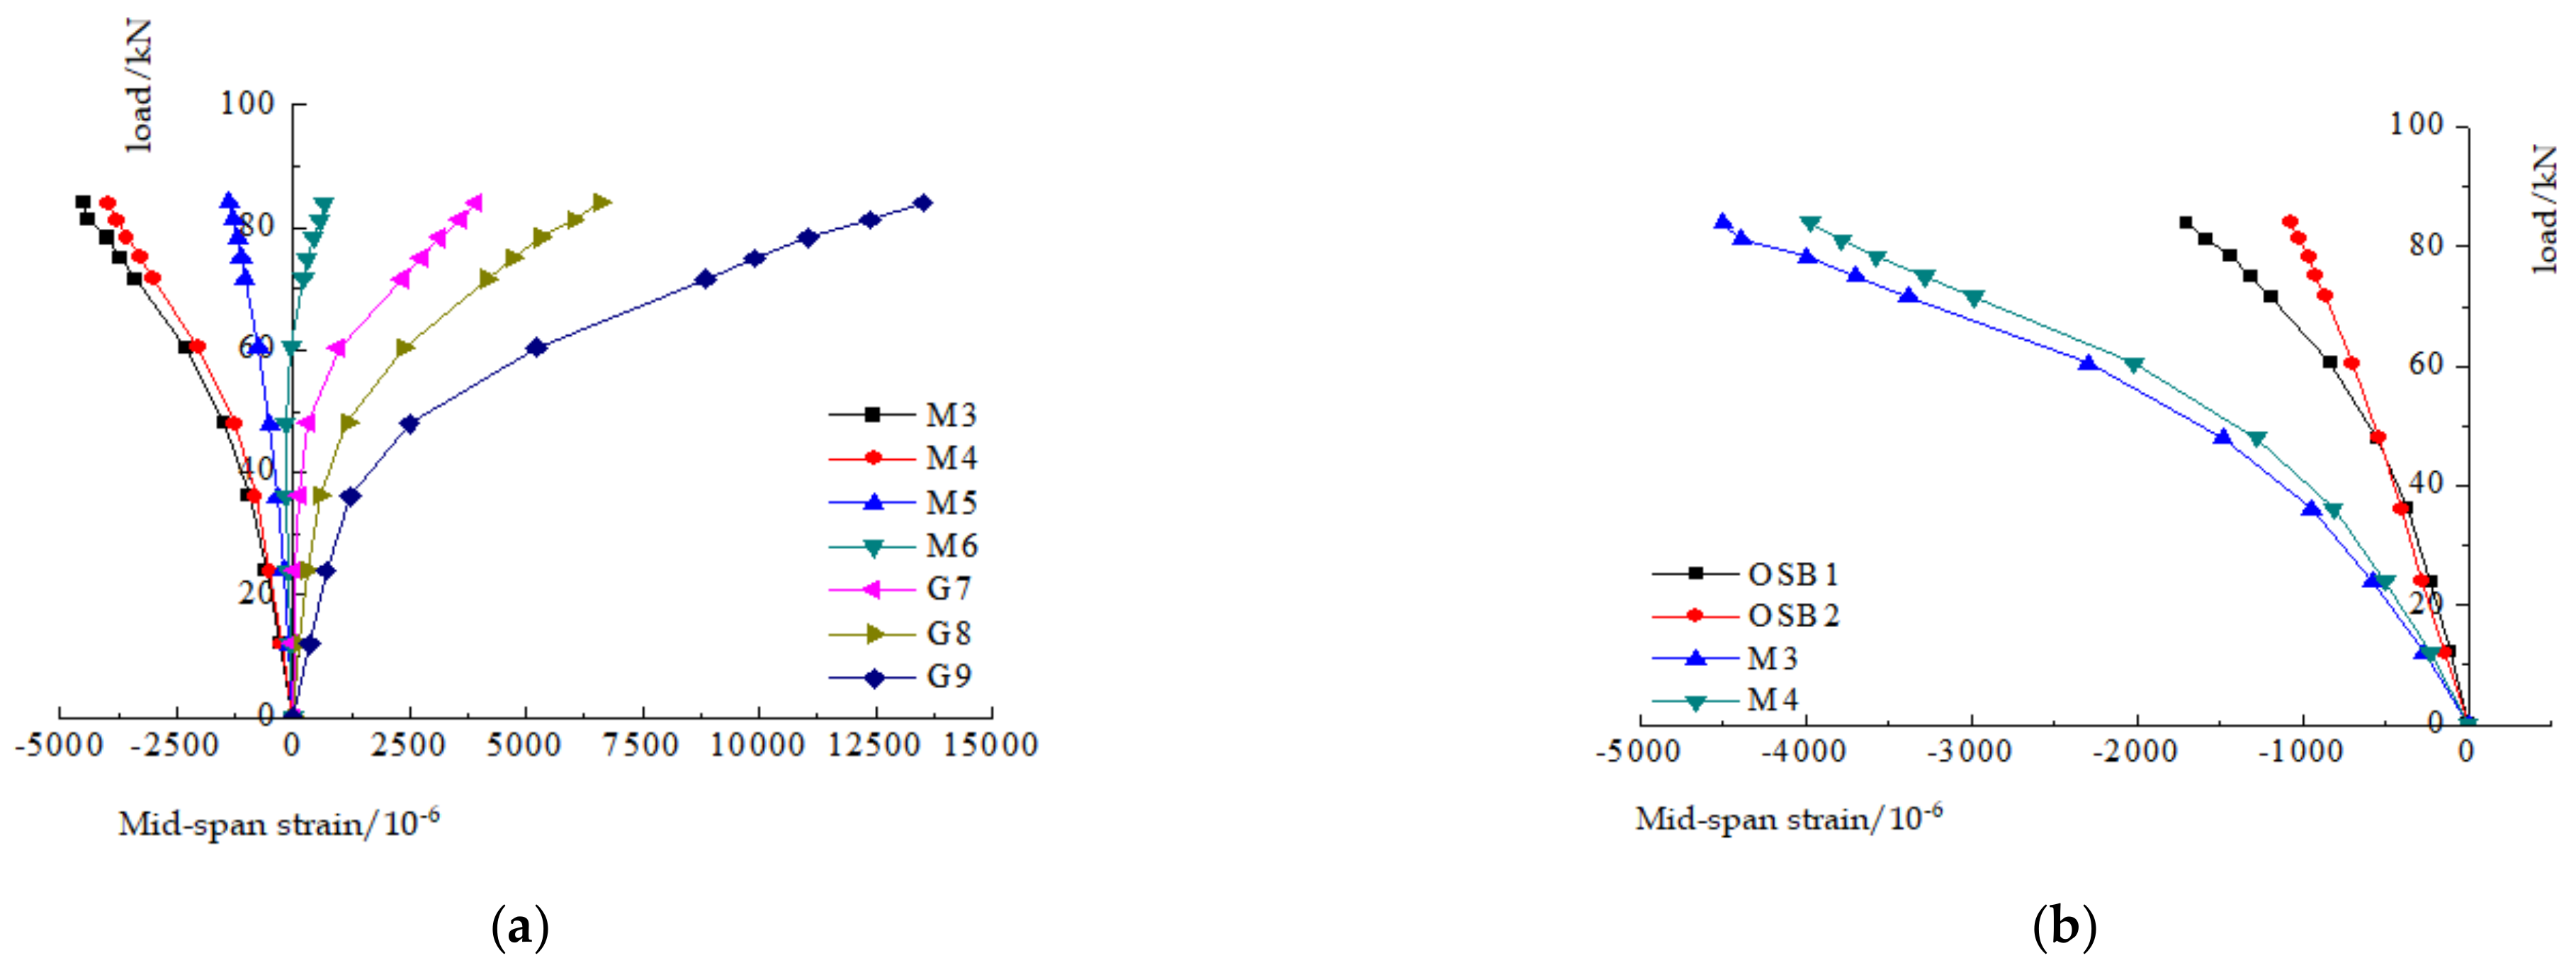
According to the two sets of test data, the load–strain curve of the composite floor was drawn as shown in Figure 10 and Figure 11. The analysis of the data shows that the strain value of each measuring point at the initial stage of loading increases linearly with the increase in the load. As the load increases, there is a tendency to deviate outwards. This is due to the elastoplastic deformation of OSB panels, glulam and thin-walled steel, which presents nonlinear changes. When the two sets of steel–wood composite slabs fail, the compressive strains on top of the OSB slab are 1332 and 1702 µɛ, respectively; the compressive strains on the top of the glulam beam are 3275 and 4498 µɛ; the tensile strains of the thin-walled steel are 4884 and 13,503 µɛ, respectively. When the ZHLB-1 and ZHLB-2 specimens are damaged, the full cross-section of the OSB is compressed, the amount of plywood in the compression zone reaches two layers and the full cross-section of the thin-walled steel is tensioned. Measuring point OSB2 and measuring point M4 are the OSB plate strain change measuring point and the glulam strain change measuring point, respectively, located at the same section height. The deformation of the two measuring points is similar at the beginning of loading, but as the load increases, because the OSB plate has vertical deformation, the deformation of the two members is inconsistent, and the strain of the two members with the same section height is quite different.
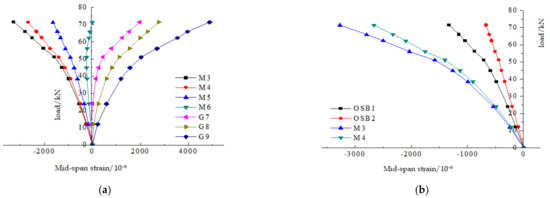
Figure 10.
ZHLB–1 mid–span load–strain curve. (a) Load–strain curve of steel–wood composite beam; (b) load–strain curve of OSB and glulam beam. G7, G8, G9: Corresponding curves of strain measuring points 7, 8 and 9 for thin–walled steel; M3, M4, M5, M6: Corresponding curve of glulam strain measuring points 3, 4, 5 and 6; OSB1, OSB2: Corresponding curve of OSB plate strain measuring points 1 and 2.
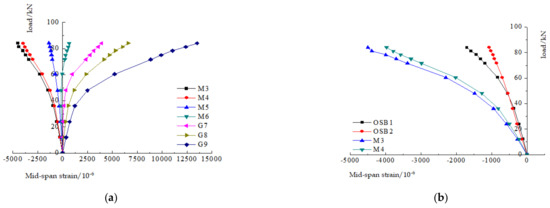
Figure 11.
ZHLB–2 mid–span load–strain curve. (a) Mid–span load–strain curve of steel and wood composite beams; (b) mid–span load–strain curve of OSB slab and glued timber beam. G7, G8, G9: Corresponding curves of strain measuring points 7, 8 and 9 for thin–walled steel; M3, M4, M5, M6: Corresponding curve of glulam strain measuring points 3, 4, 5 and 6; OSB1, OSB2: Corresponding curve of OSB plate strain measuring points 1 and 2.
4. Finite Element Model Analysis
4.1. Establishment of Finite Element Model
On the basis of the material property test and the test of the composite floor test piece, a finite element model of the test piece was established using ABAQUS software, and in the modeling of the component, the finite element numerical model was processed as follows: (1) The glulam beam is glued by SPF (Spruce-Pine-Fir) boards, so first, build a model of 25-mm glulam laminates for each layer, and then, assemble to obtain it; (2) Assume that the glue layer thickness in the glue layer model of the steel sticking glue is 2mm; (3) According to the literature [15], the joints of the OSB and the glulam flange are treated by coupling degrees of freedom at the joint.
Wood is an anisotropic material. In the finite element analysis, wood was defined as an orthotropic material. According to the compression test results of prismatic glulam, nine engineering constants in the orthotropic stiffness matrix of the glulam material were calculated. For details, see Table 4. The material properties of other parts were obtained based on experimental data. The elastic modulus of steel was taken as 195,687.65 MPa; Poisson’s ratio was taken as 0.3; the yield stress was taken as 225.41 MPa and the tensile strength was 332.72 MPa. For rigid parts such as self-tapping screws, iron nails and cushion blocks, since the elastic deformation during the finite element simulation process is not considered, the elastic modulus was taken as 2.1 × 10¹¹ N/m2, and Poisson’s ratio was 0.3. These data generally conform to the ideal elastoplastic constitutive law that we set in the finite element.
Table 4.
Nine engineering constants in the elastic stage of glulam.
According to the experimental phenomenon and the actual force characteristics of the steel-wood composite beam, the interaction of the finite element components is reasonably defined: (1) Assuming that the glulam laminate does not undergo relative slippage, the interaction between the laminates is set as a “binding” constraint; (2) The interaction of thin-walled steel and steel glue layer, glulam and steel glue layer is set as a “binding” constraint; (3) A C-shaped steel web splits the area of the same size as the bolt, and the bolt position is defined by the “binding” constraint relationship when modeling; (4) For the self-tapping screw connecting the OSB and the glulam flange, the connection is handled by the method of joint coupling degree of freedom; (5) Set the lower surface of OSB to “contact” with the upper surface of the extruded board; the contact surface of the elastic bearing extruded plate and glulam, I-beam and the contact surface of the cushion block is set as the “binding” constraint.
The element type of this model adopts the reduced integral of the C3D20R 20-node quadratic hexahedron element. The grid seed density of glulam, OSB and extruded board is 0.02, the grid seed density of thin-walled steel is 0.01 and the grid seed density of I-beam and steel pad is 0.05. The grid division of the composite slab is shown in Figure 12.
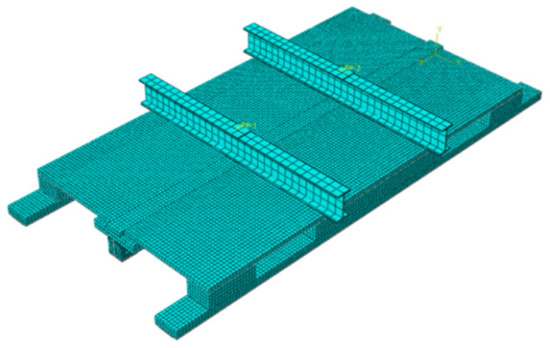
Figure 12.
Grid division of composite floor.
4.2. Verification of Finite Element Model of ZHLB-2 Specimen
4.2.1. Comparison of Test Phenomena of ZHLB-2 Specimen
The along-grain stress cloud diagram of “S33” wood is shown in Figure 13. It can be seen from Figure 13 that when the ultimate load is reached, most of the glulam at the pure bending section enters plasticity, and the maximum compressive stress at the top of the glulam beam in the middle span is 37.84 MPa, while the maximum tensile stress at the bottom reaches 14 MPa. Most thin-walled sections located in the pure bending section enter the plastic stage, and the bottom of the mid-span beam reached the ultimate tensile stress. The OSB plate also enters the yield state, and the maximum compressive stress located at the mid-span part of the connection with the glued wood flange is 11.45 mpa. Through calculation of the experimental data for ZHLB-2 test pieces, the two OSB slabs bear 8% of the bearing capacity of the composite floor. The adhesive layer is about to reach the plastic state, which corresponds to the opening of the bonding surface of the steel and wood of the ZHLB-2 specimen. The extruded board + glulam composite beam does not yield, corresponding to the ZHLB-2 specimen; the elastic support is not damaged and is still in the elastic stage. From the stress cloud diagram of the finite element simulation analysis, the composite slab of the simulation analysis is basically consistent with the experimental phenomenon, which verifies the feasibility of the model.
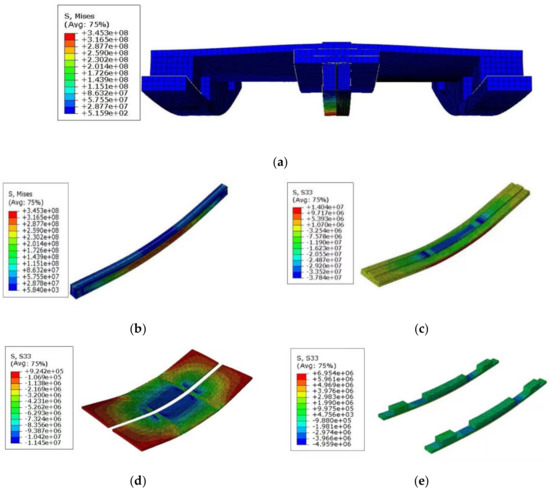
Figure 13.
Stress–field nephogram of ZHLB–2 specimen. (a) Combined floor deformation stress–field nephogram. (b) Stress–field nephogram of thin–walled steel beam; (c) stress–field nephogram of glulam beams; (d) OSB plate stress–field nephogram; (e) extruded board + glued wood stress–field nephogram.
4.2.2. Comparison of Test Results of ZHLB–2 Specimen
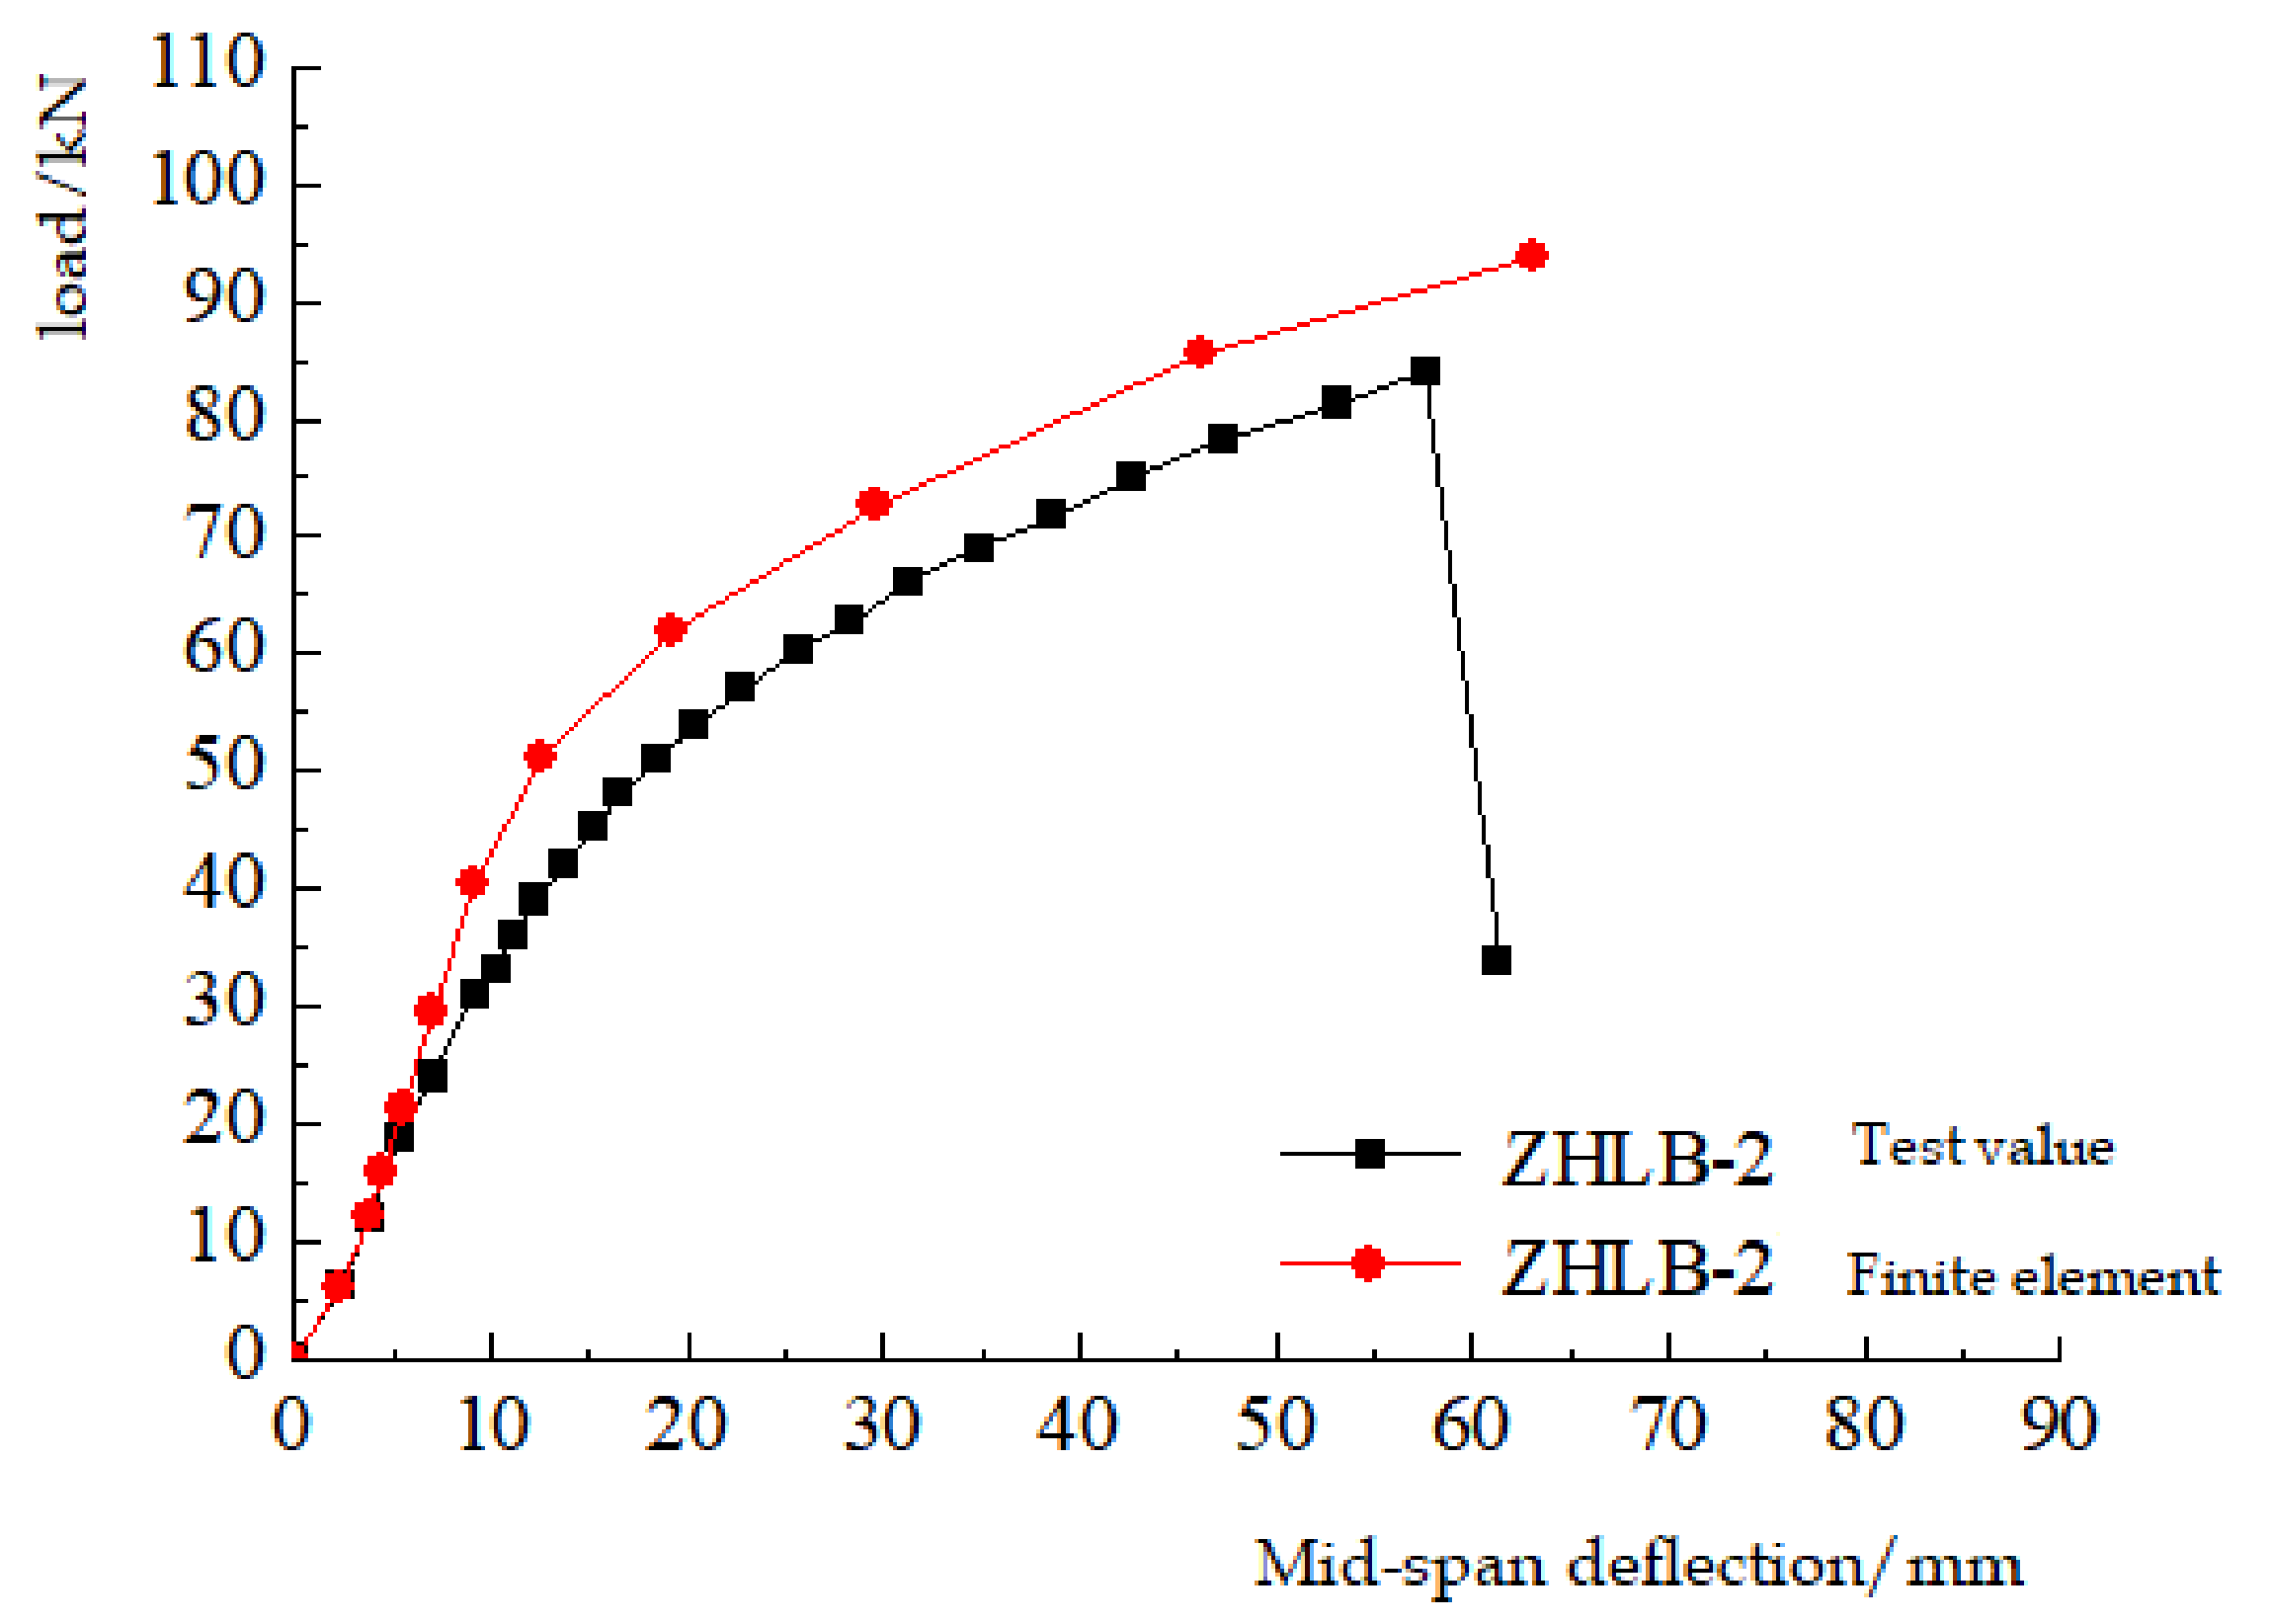
The comparison between the finite element analysis results and the test results is shown in Table 5. The data were extracted from the model and a load–deflection curve was drawn for comparison with the test results, as shown in Figure 14.
Table 5.
ZHLB-2 specimen test value and finite element comparison.
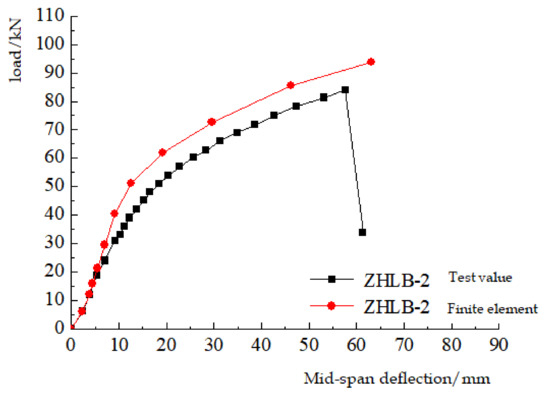
Figure 14.
Comparison of ZHLB-2 specimen and finite element test results.
Analyzing Figure 14, it can be seen that the finite element simulation results are basically close to the initial slope and curve trend of the test results, indicating that the initial stiffness of the finite element and the force and deformation of the elastoplastic stage are comparable to the test. The bearing capacity error is small and the curves are in good agreement, which proves that the ZHLB-2 specimen model established by the finite element method is reasonable and feasible. Among them, the difference in ultimate load is 11.47%, and the difference in deflection and deformation at mid-span is 9.6%; the overall stiffness of the finite element model is greater than that of the ZHLB-2 specimen, and the bearing capacity and deformation capacity are greater than the test values. The main reasons for the error in the analysis and comparison test results are as follows: (1) The quality of the thin-walled steel–glulam composite beam during the test was affected by knots, cracks and the strength of the laminate glue layer; (2) the adhesive layer was subject to uncontrollable human factors such as the surrounding environment, the bonding strength and the time that the test plan is shelved after the production is completed. The above two factors will affect the bearing capacity and deformation of composite floor specimens, but they do not exist in the finite element analysis.
4.3. Factors Affecting the Bearing Capacity of Steel-Wood Composite Slabs
4.3.1. The Influence of Self-Tapping Screw Spacing
Under the condition that the steel-wood composite beams and OSB slabs remain unchanged, the spacing of the self-tapping screws connecting the composite slabs and the OSB slab was set to 100, 150 and 200 mm, and mid-span load–deflection curves were drawn and a comparative analysis performed for the composite floors with different screw spacings, as shown in Figure 15.
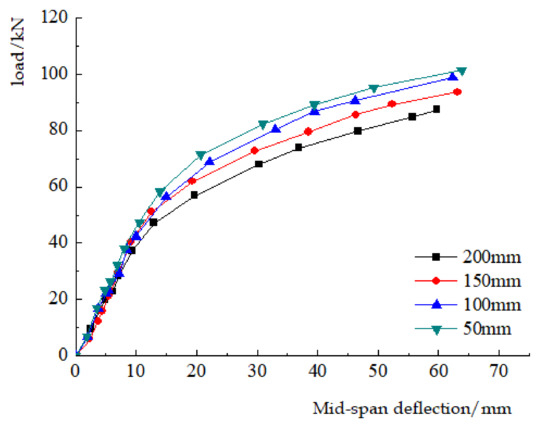
Figure 15.
Comparison of finite element test results of different self-tapping screw spacings.
The ultimate load simulation values of different self-tapping screw spacings are summarized in Table 6. From the table, it can be seen that when the self-tapping screw spacing is reduced from 200 to 150 mm, the bearing capacity of the composite floor is increased by 7.14%; when the tapping screw spacing is reduced from 100 to 50 mm, the bearing capacity of the composite floor is only increased by 2.5%. It can be seen that as the spacing of self-tapping screws continues to decrease, the increase in the bearing capacity of the steel–wood composite floor gradually decreases.
Table 6.
Finite element analysis results of composite floor with different self-tapping screw spacings.
4.3.2. The Influence of the Width of Laminated Beam Glulam
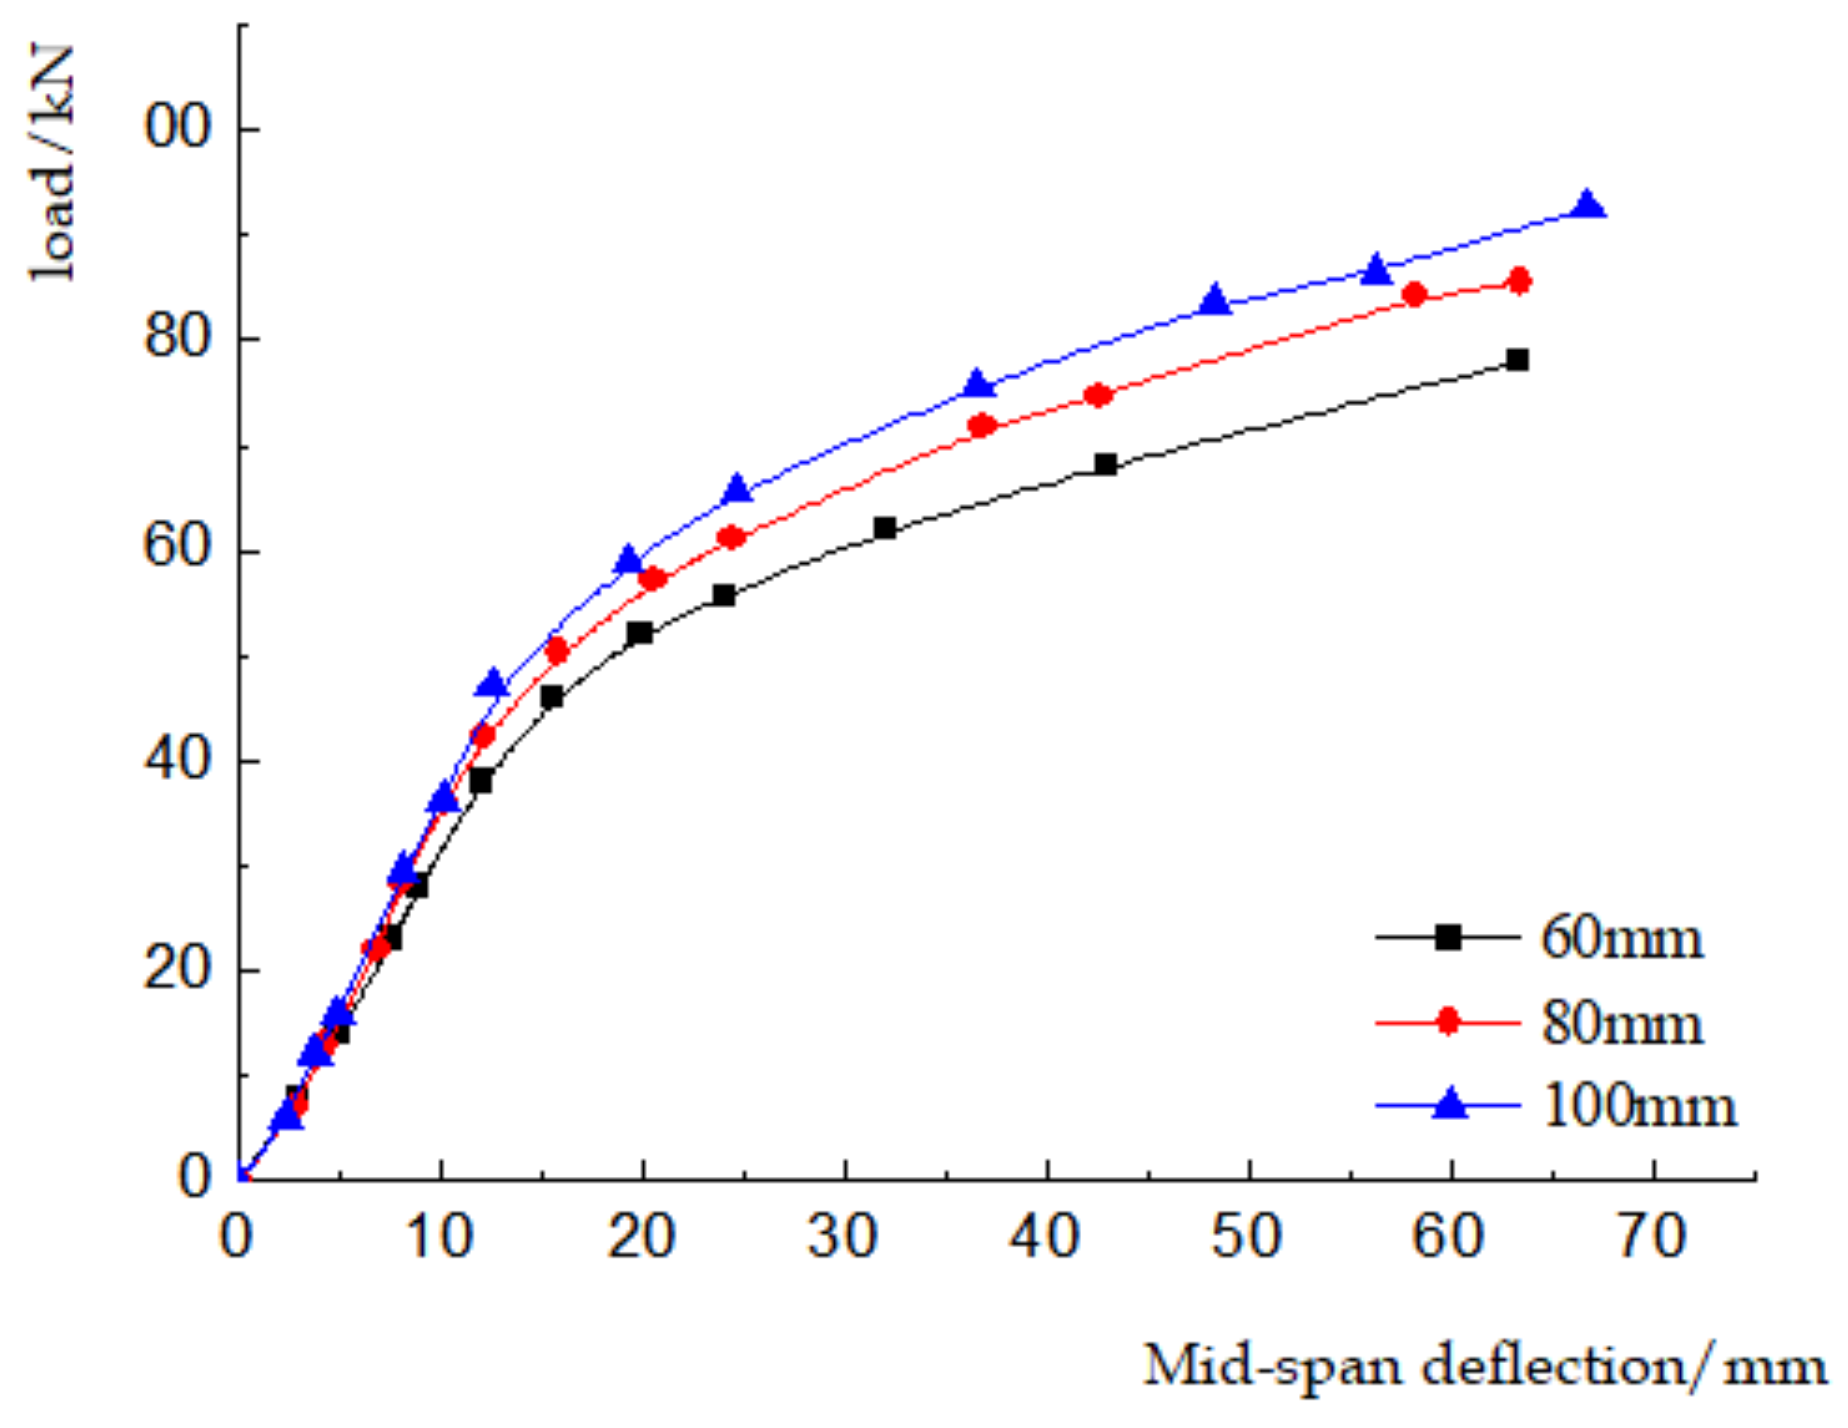
Under the condition that the screw spacing remains unchanged, the flange width of the laminated beam was set to 60 and 80 mm and mid-span load–deflection curves of different glulam flange widths were drawn, compared and analyzed, as shown in Figure 16.
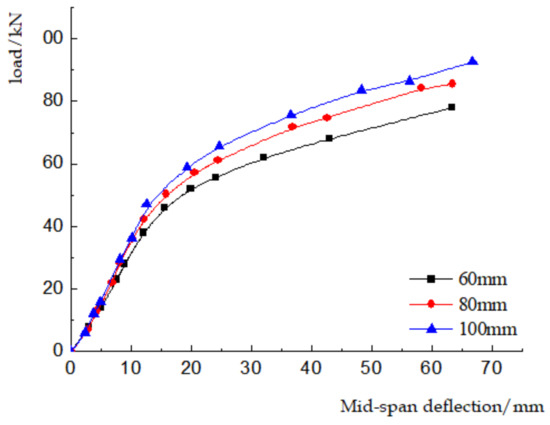
Figure 16.
Comparison of finite element test results of different glulam flange widths.
The ultimate load simulation values of different glulam flange widths are summarized in Table 7. The analysis data in the table show that when the glulam flange width is increased from 60 to 80 mm, the bearing capacity of the composite floor increases by 9.21%; when the glulam flange width is increased from 80 to 100 mm, the bearing capacity of the composite floor is increased by 9.90%. The analysis data in the table show that with every increase of 20 mm in the width of the glulam flange, the bending bearing capacity of the composite floor can be increased by about 10%, which verifies that the flange width of the glulam beam has a significant influence on the bearing capacity of the composite floor.
Table 7.
Finite element analysis results of composite slabs with different glulam flange widths.
5. Conclusions
In this paper, flexural performance tests of two groups of fabricated steel–wood composite slabs were carried out, and the failure modes, bearing capacity and stiffness of each specimen were compared and analyzed. The conclusions are as follows:
- (1)
- For the thin-walled steel–glulam composite beams connected by glue, the glulam was mainly compressed and the thin-walled steel was mainly tensioned during the test, and the two materials entered the plastic stage before the specimen was damaged, indicating that the steel and wood can work together, thereby increasing the material efficiency of the composite beam.
- (2)
- The ultimate bearing capacity of the composite slab assembled with self-tapping screws was 18.31% higher than that of the composite slab assembled with iron nails; the corresponding mid-span deflection deformation increased by 42.41% and the ultimate bending moment also increased by 21.43%. The steel–wood composite slab assembled using self-tapping screws can superimpose the OSB and the thin-walled steel–glulam so that the material strength can be fully utilized, thereby improving the bend-bearing capacity and overall rigidity of the composite floor.
- (3)
- Based on the finite element analysis, a comparative analysis of the self-tapping screw spacing and the flange width of the laminated beam glulam which affect the bearing capacity of the steel–wood composite floor was carried out. The analysis results show that reducing the spacing of self-tapping screws can improve the bearing capacity of the composite floor, and the reasonable screw spacing is between 100 and 150mm. Increasing the flange width of the steel–wood composite beam can significantly improve the bend-bearing capacity of the composite floor.
Author Contributions
Conceptualization, G.L. and W.T.; methodology, G.L. and W.T.; software, G.L. and W.T.; validation, G.L., W.T. and D.H.; formal analysis, G.L. and W.T.; investigation, G.L. and W.T.; resources, G.L., W.S.; data curation, G.L., W.T., Z.L. and Z.L.; writing—original draft preparation, G.L., W.T. and Z.L.; writing—review and editing, G.L.; visualization, G.L., W.T., Z.L. and D.H.; supervision, G.L.; project administration, G.L.; funding acquisition, G.L. All authors have read and agreed to the published version of the manuscript.
Funding
This research was funded by the Fundamental Research Funds for the Central Universities, grant number 2572019BJ03, the Harbin science and technology innovation talent fund project, grant number 2017RAQXJ086 and the Natural Science Foundation of Heilongjiang Province, grant numbers LH2019E005 and LH2020E009.
Institutional Review Board Statement
Not applicable.
Informed Consent Statement
Not applicable.
Data Availability Statement
Data available in a publicly accessible repository.
Conflicts of Interest
The authors declare no conflict of interest.
References
- Yang, X. Development and Application of Prefabricated Wood Structure Building System. Constr. Sci. Technol. 2017, 19, 57–62. [Google Scholar]
- GB/T 51233-2016. Technical Standards for Prefabricated Wood Structure Buildings; China Building Industry Press: Beijing, China, 2016. [Google Scholar]
- Wang, X.; Chen, Z.; Bai, J.; Li, S.; An, Q. Research status and development prospects of steel-wood composite structures. In Proceedings of the 2011 National Steel Structure Academic Year Conference, Yinchuan, China, 17 October 2011; pp. 654–657. [Google Scholar]
- Cristiano, L.; Buick, D. Innovative composite steel-timber floors with prefabricated modular components. Eng. Struct. 2017, 132, 695–713. [Google Scholar]
- Xia, Y.; Zheng, X.; Wei, J. Study on vibration and bending performance of plywood-thin-walled steel composite floor. Wood Ind. 2020, 34, 18–22. [Google Scholar]
- Li, Y.; Shan, W.; Huang, Z.; Ge, B.; Wu, Y. Experimental study on mechanical properties of profiled steel sheet-bamboo sheet composite slab. J. Build. Struct. 2008, 96, 102–111. [Google Scholar]
- Yang, Y.; Liu, J.; Fan, J.; Nie, X. Experimental study on flexural performance of steel plate-concrete composite plate. J. Archit. Struct. Sci. 2013, 34, 24–31. [Google Scholar]
- Xu, L.; Tangorra, F.M. Experimental investigation of lightweight residential floors supported by cold-formed steel C-shape joists. J. Constr. Steel Res. 2006, 63, 422–435. [Google Scholar] [CrossRef]
- Zhou, X.; Li, Z.; Wang, R.; Shi, Y. Research on the Flexural Bearing Capacity of Cold-formed Thin-walled Steel Beam-OSB Slate Composite Floor. China Civ. Eng. J. 2013, 46, 1–11. [Google Scholar]
- Li, G.; Yang, B.; Shan, W.; Guo, N. Experimental research on the cold-formed thin-walled steel-laminated timber composite beam. Prog. Eng. Sci. 2017, 8, 177–181. [Google Scholar]
- Guo, N.; Zhang, P.; Zuo, Y.; Zuo, H. Bending performance of glue-lumber beam reinforced by bamboo plyboard. J. Jilin Univ. (Eng. Technol. Ed.) 2017, 47, 778–788. [Google Scholar]
- Zuo, H.; Liu, H.; Lu, J. Effect of New Self-tapping Screw Reinforcement Measures on Bending Performance of Glulam Beams. J. Northeast. Univ. 2020, 48, 112–116, 121. [Google Scholar]
- Guo, N.; Chen, H.; Zhang, P.; Zuo, H. The research of parallel to the grain compression performance test of laminated glued bamboo-wood composites. Tech. Gaz. 2016, 23, 129–135. [Google Scholar]
- GB/T 50005-2017. Wood Structure Design Standard; China Building Industry Press: Beijing, China, 2017. [Google Scholar]
- Jiang, H. Research on the Control Effect of Prestressed Glulam String Beams. Master’s Thesis, Northeast Forestry University, Harbin, China, 2018. [Google Scholar]
- Yang, X. Research on Bending Performance and Design Method of Steel Plate Reinforced Glulam Beam. Ph.D. Thesis, Northeast Forestry University, Harbin, China, 2016. [Google Scholar]
- GB 50009-2012. Building Structure Load Code; China Building Industry Press: Beijing, China, 2012. [Google Scholar]


Publisher’s Note: MDPI stays neutral with regard to jurisdictional claims in published maps and institutional affiliations. |
© 2021 by the authors. Licensee MDPI, Basel, Switzerland. This article is an open access article distributed under the terms and conditions of the Creative Commons Attribution (CC BY) license (https://creativecommons.org/licenses/by/4.0/).