Abstract
This study discusses the problem of determining which container port should be developed within an existing network and when this should be carried out. A case study of Indonesia’s port network is presented, where several new ports are to be improved to ensure smooth interisland transportation flows of goods. The effects of the investment on economic consequences and increased network connectivity are assessed. When improving the ports, we consider that the available budget limits the investment. The network connectivity is evaluated by considering the number of reachable ports from the developed ports or transportation time required from other ports within the same port cluster. Based on our knowledge, our study is the first one that discusses the investment problem in multiple container ports under single management, as well as its effects regarding the increase in container flows. The problem is introduced and three mathematical models are proposed and used to solve a real problem. The results show that different models have different improved aspects of container transportation flows—e.g., a balanced improvement of the whole port network (Model 2) and appropriate investment priority for port clusters (Model 3).
1. Introduction
Global economic activity involves manufacturing processes that are performed in many countries as well as shipping to other consumer countries. A smooth goods transportation between countries must be supported through a good transportation connection within each country. In other words, global manufacturing activities have a strong relationship with regional port development [1]. Such good transportation connections must be ensured in land, water, and air transportation networks. In our study, we focus on developing the connectivity of the water transportation network. Such connectivity highly depends on the container ports with good infrastructure, routine vessel sailing schedule, and sufficient supply of goods. Characteristics of well-developed ports are sufficiently installed port capacity, good information systems [2], and strong access from/to the hinterland [3]. The port capacity development itself includes the appropriate port draft setting to match the visiting vessels’ requirements, suitable hub and feeder port network design, and advanced equipment operations. We focus on improving the capacity and connectivity of ports in the hub and feeder port network by allocating the available budget for investment.
Logistics planning and control issues in container ports were classified into three levels [4]: terminal design, operations planning, and real-time control, with details as follows:
- Terminal design:
- multimodal interfaces;
- terminal layout;
- equipment selection;
- berthing capacity;
- IT systems and control software.
- Operations planning:
- storage and stacking policies in container yard;
- quay crane assignment and split;
- berth allocation;
- stowage planning.
- Real-time control:
- landside transport;
- quayside transport;
- slot management in storage yard;
- crane scheduling and operation sequencing for yard cranes and quay cranes.
Our investment problem is classified at the terminal design level. In a similar terminal management issue classification proposed in [5], our problem is classified into the terminal layout problem at the strategic and tactical levels. Decisions made at this strategic level determine the overall system’s capacity when solving operation planning and real-time control issues—e.g., the amount of investment in logistics infrastructure sets the upper bound for the possible flows within the network [6]. Dealing with the port investment problem at the terminal design level is related to increasing the terminal’s throughput, which depends on the relationships between ports. This differs from the operations planning and real-time control levels that exclusively attempt to directly increase the productivity of a single port, given the installed capacity at the terminal design level. Although development funds at container terminals can be invested in berths (seaside), container yards, and yard cranes (landside) [7], we focus on the investment in the seaside for the reasons stated above.
Our study has received investment for the purpose of increasing the processing capacity of the terminal’s seaside, which mainly depends on the designed and operational capacities of the berths [8,9,10] and the number of installed quay cranes. Many attempts have been made to ensure the quay cranes operate with high utilization through efficient quay crane assignment, quay crane scheduling, and double cycling operation to increase the terminal’s capability of handling more containers from/to the vessels [11]. The terminal’s productivity improvement from the increase in the length of the berth and the number of installed quay cranes might be limited by the noncrossing constraints between quay cranes [12] and the capacity of other related equipment in the terminal’s landside—e.g., yard crane and internal trucks [13,14]. Nevertheless, berths and quay cranes are considered the most significant resources for the terminal’s throughput [15,16].
Some studies that discussed the initial design of the whole or partial hub and spoke port network are [17,18,19,20], most of which address the port location problem. Unlike these studies, we found out how to improve the existing hub and spoke port networks by allocating the investment budget, which was not considered in most studies listed above. Some other papers deal with more issues at the tactical or operational level—e.g., demand estimation at origin and destination nodes [21], fleet size [22,23], ship routing [24,25,26], ship schedule generation [27], container transportation decisions [25], and empty container repositioning [28]. Our study differs from these studies by considering investment decisions at the strategic level.
Investment decisions for the development of existing ports are often considered complicated to make. These decisions require a holistic perspective, considering the port connectivity network and productivity improvement strategies for the ports [29]. Moreover, budget limitation and the effect of the time value of money are important to consider in allocating investments, which is accomplished gradually on a yearly basis.
Many previous studies used a mathematical modeling approach to find the best investment decisions. In general, the investment modeling approaches can be divided into two types: (1) studies that maximize the effects of the investments while considering the limited budget [30,31,32] and (2) studies that minimize the total investment costs, while ensuring a certain service level of the improved system [33,34]. Our study uses the earlier investment modeling approach and introduces a novel way to evaluate the investment effects in subsequent years after the investment period for the container port development case.
In this port development case, there has been much research investigating port investment models. Many of them emphasized the importance of competition between ports when making investment decisions. In this situation, the best investment decision was made while considering the trade-off of the developments of the ports. To obtain the best strategy for all ports, game theory [35] or methods pursuing equilibrium conditions [36,37,38] were proposed. In contrast, we discuss a case that emphasizes mutual improvements in all of the related ports when investing in any port. Our proposed methods are more suitable in a case in which the government manages the whole container port network, which allows maximum utilization of the investments to improve the performance of the whole network [39,40]. When the competition between ports is relaxed, there is a better possibility to improve and reduce the cost of the network [41].
After reviewing the studies above, the authors found out that there is still limited research considering port system connectivity and capacity, time value of money, budget allocation, and limitation for a multiyear port investment decision. Thus, we formulated our study’s research question as follows: How do we determine the amount of investment in each container port each year considering a limited budget to maximize the effects of the investments when the network is under single management? The effects of the investments are measured based on the amount of the investment multiplied by the years of how long the investments are active until the end of the planning horizon. This amount- and time-based evaluation has been considered in previous studies when calculating (1) the worth (money value) of the investments [42] or (2) the profit obtained from the investments [43] by incorporating them in the objective function of their proposed models. The related research hypothesis for our study is: investment decisions for multiple ports to improve the whole network’s productivity are dependent on the relationships between the ports—i.e., the number of connecting links between ports and distances between ports in each same cluster.
The closest studies with ours (that discussed the investment problem in container ports) are [44,45]. Allahviranloo and Afandizadeh [44] discussed a multiyear investment problem for a single port. In their study, they minimized the required total investment to improve the draft for the ships at the port. Allahviranloo and Afandizadeh [44] and Balliauw et al. [45] considered the investment effect of the investment on a single port; meanwhile, we discuss investment decisions on multiple ports while considering the existing connection between the ports. This research direction was supported by Chen and Yang [46], who expressed the necessity of more studies to consider the simultaneous improvement of the port network instead of individual ports. Based on the authors’ knowledge, our study is the first that discusses investment decisions on multiple ports under single management while considering relationships between the ports that are related to the container flows. Our proposed models can be a basis for further observation of port development strategies with detailed port characteristics related to the increase in container flows. The models ensure the development of a single container port and consider its effect on adjacent ports to maximize the whole system’s performance.
2. Mathematical Formulations
Our study deals with an investment problem with the following inputs, outputs, and objective:
- Input:
- A network of container ports with port nodes and connecting edges are provided.
- The available investment budget for each port cluster and all ports each year is provided.
- The total planned investment for each port (of all years) is provided.
- The time required for vessel travel between each pair of connected ports is provided.
- Output (decisions):
- The amount of investment in each port at each period is determined.
- Objective:
- The total effects of the investments in all ports during all years must be maximized.
Three mathematical models are developed to determine how much money must be invested for each container port every year. We assumed that the ports’ current capacities are sufficient for stable container flow management before any investment. Thus, we also assumed that the amount of investment placed from the starting year considered in this study is equivalent to increasing the ports’ capacities. We also discuss how to improve those capacities at the ports appropriately while observing the effects on the connected ports or ports located close within the same clusters. Characteristics of each model are listed and compared in Figure 1. Main changes in Models 2 and 3, compared with Model 1, are marked.
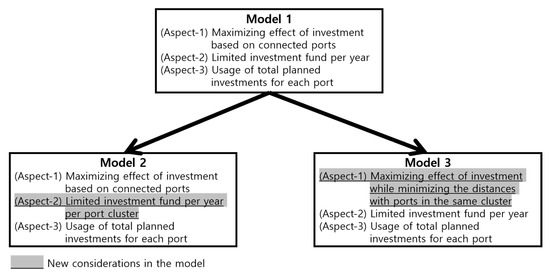
Figure 1.
Characteristics of proposed mathematical models.
The sets, parameters, and decision variables are as follows.
Sets:
- G
- set of container port clusters, g = 1, 2, 3, 4;
- P
- set of container ports, P = P1 ∪ P2 ∪ P3 ∪ P4;
- Pg
- set of container ports in area g, i ∈ Pg;
- P(i)
- area where container port i is located, i ∈ P(i);
- T
- set of years, t ∈ T, m = |T|.
Parameters:
- aij
- 1, if there is a direct link between container port i and container port j; 0, otherwise;
- bt
- available budget for improving container ports at year t;
- bgt
- available budget for improving container ports in cluster g at year t;
- dij
- required travel time between container port i and container port j;
- ei
- total investment amount planned for container port i;
- m
- number of investment years;
- r
- devaluation of currency.
Decision variables:
- xit
- number of investments made for developing container port i at year t.
Models 1, 2, and 3 are presented as follows:
Model 1:
subject to
Assuming that the investment amount has a linear relationship with the flow improvement between the developed container port and its connected container ports, objective Equation (1) maximizes the investment amount and years during which the investment has some effect. We increase the effects of the investment in terms of amount and time while considering the number of connected ports in the network. The connectivity index was developed based on [47]. The affected years were considered because earlier investment in the port capacity allows a bigger increase in the operational capacity of the system [45]. To convert the future investment amount to the present value, we used the following formula:
with P as the present value and F as the future value, as considered in [44].
The constraints in Equation (2) limits the total investment amount per year t with the available budget. The constraints in Equation (3) ensures that the total investment amount for each container port i is the same as the planned amount. The constraints in Equation (4) are non-negativity constraints.
Model 2:
Objective function (1)
subject to
Unlike Model 1, Model 2 considers the constraints of Equation (6) that limit the total investment amount per year t with the available budget for developing container ports in each cluster g.
Model 3:
subject to
With the same assumption about the linear relationship of the flow improvement, Model 3 considers a different objective (Equation (7)) that maximizes the effect of investment amount and the affected years while minimizing the required travel times between the improved container port and other ports in the same cluster. Such average travel time is stated in [48]. This model aims to improve ports that are closer to all other ports with more investment as soon as possible. Even though there are no links between the ports, such improvement effects can be considered through indirect connections from other ports (or by directly establishing such new connections in the future).
3. Data
Our study’s data are taken from a real case of Indonesia’s port network development plan [49]. Our study only considers 24 strategic container ports that are the main ports in Indonesia’s sea toll network. Other than these strategic ports, there are more than 80 commercial ports and 1400 noncommercial ones. The total allocated investment budget for the strategic ports is more than the one for the other ports; thus, we focus our study on the strategic ports. The network with connections between the container ports (Figure 2) is considered as input data.
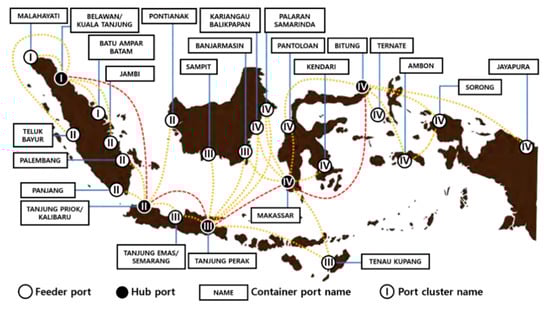
Figure 2.
Container port network in Indonesia.
The input data are also container ports and available budget data (Appendix A Table A1; taken from [49]) and travel time data between ports (Table A2; calculated from [50]). The detailed investment plan for Sampit port (No. 14 in Table A1) is not stated in [49], but the total investment is given; thus, we assumed that the investment is divided evenly for all years. When calculating the travel time data in Table A2, we set the vessel speed to 14 knots to match some initial data provided in [49].
Table A1 shows the investment plan for each port every year. The port listed in the table involves hub and feeder ports that are illustrated in Figure 2. The hub port name is written in italics and underlined, while the feeder port is written in regular letters (without italics and underlines). Using the data, we calculated the total available budget for investment every year. In Models 1 and 3, we considered the total investment for the whole year, but in Model 2, we considered the budget limit for each cluster every year. Our study aims to find the best investment plan that can increase the investment effects on the ports, assessed from the number of connections or required travel times between ports.
4. Results
We solved our proposed models using the CPLEX 12.9 commercial solver that has been used in many previous studies [51,52,53], including the ones that provided solutions for real company problems. Our codes are written in Python language with Python 3.7 version in the Microsoft Visual Studio Community Edition 2019 platform. All experiments were conducted on an Intel® Core™ i5-6600 CPU at 3.30 GHz with 16 GB RAM. The value of r was set to 8.6% based on Indonesia’s real interest rate in 2019 [54]. The solutions of Models 1–3 are presented in Table 1, Table A3 and Table A4, respectively. The total money invested each year is listed at the bottom of Table 1, Table A3 and Table A4.

Table 1.
Investment decision as the result of Model 1 (in trillion rupiahs).
As the results, the objective values for Models 1, 2, and 3 are 714,071, 668,197, and 5761 (in trillion rupiahs), respectively. All models obtained the optimal solutions for the considered port network size within a computational time of less than one second. This short computation time proves that port development problems with real cases can be solved by mathematical modeling with optimal solutions (e.g., there is no need to develop algorithms or simulations). For further analysis, we present Table 2, Table 3 and Table A5. The detailed calculations for obtaining the objective values in Models 1 and 2 are presented in Table 2 (an example of Model 1′s result is used). The amount of money invested in a container port at any period (Table 1) affects the container flow at the next year (Table 2), and the effect of the investments is accumulated for the subsequent years while considering the devaluation of the currency. The accumulated investment is multiplied by the total number of connected ports with the developed port, as listed in the last column of Table A5.
Table 2.
Estimated investment effect on container flow between ports based on Model 1’s result (in trillion rupiahs).
Table 3.
Sensitivity analysis result.
Some comparisons between Models 1, 2, and 3 are listed as follows:
- Model 1 has more investment effects than Model 2 because the investment budget is not limited to any cluster every year. Model 1 is appropriate for maximizing the container flow within a short term.
- When we want to ensure more balanced improvements between port clusters (as shown in the “Total Cluster” rows at the end of Table A2) and better long-term improvement within the whole port network, Model 2’s solution is better. Having a balanced improvement within port clusters allows better flows of goods between all regions in Indonesia, especially when there is an imbalanced amount of resource types produced in each area.
- Objective values of Models 1 and 3 are not comparable because different parameters are calculated, but some comparable values are provided in Figure 3 (which will be explained later at the end of Section 4).
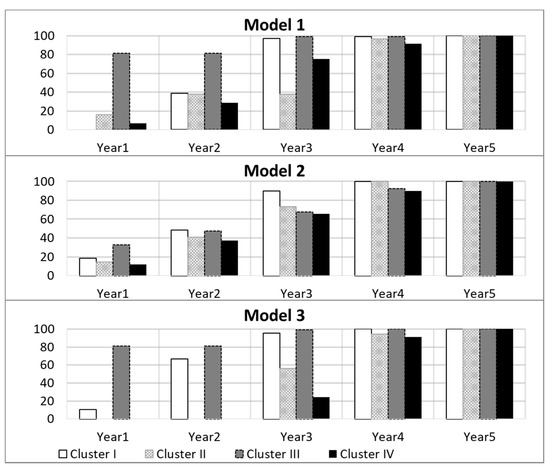 Figure 3. Accumulated investments for port clusters (in percentage).
Table A5 shows the average travel time required from each container port to all other ports in the same cluster, and the average travel time between all ports in each cluster is summarized at the bottom part of Table A5. In Model 3, we maximized the investment for ports with potential lower container transportation costs within each cluster. Such a transportation strategy focuses more on increasing the transportation effectiveness between the hub ports and the feeder ports. Given the current routes (Figure 2), some connections between ports in each cluster do not exist, but the links can be added after calculating the impact of the changes when implementing Model 3′s solution.
Using each cluster’s average travel time information leads us to the following port cluster development priority: Clusters III, I, II, then IV. This development priority follows the development strategy presented by objective Equation (7), which invests first in container ports that are located closer to each other within their cluster. The priority is based on a sequence of the average time travels to other ports within each cluster (in ascending order) in the bottom part of Table A5. In Model 3′s solution, the budget is allocated first to the prioritized clusters until their required investment amount is satisfied. The results confirmed that our research hypothesis was correct. The investment decisions for multiple ports were highly dependent on the connectivity of the ports and distances between ports in each port cluster.
5. Analysis
We propose basic models that can be used to assess the port development decisions and their effects on the increase in container flows. However, some other aspects should be considered for ensuring a more accurate performance estimation and evaluation, as stated below.
Our study assumes that the ports’ initial capacities are sufficient for smooth container flows between ports and port clusters. However, it is necessary to assess the exact capacities by observing the installed facilities, especially the quay cranes and berths that define the container transfer rate from a container port to the other ports. Considering such equipment’s limited capacity in the ports is important to ensure the ports’ accurate transfer rates. Thus, this existing equipment capacity information should be considered in future research. Additionally, having an accurate quay crane transfer rate can be combined with a detailed simulation that considers the container transportation behavior from/to the hinterland side [55].
The actual container flows between ports should be limited by the number of existing vessels (fleet size) and their installed routes [56]. Consideration of such information allows us to identify the bottleneck part in the container port network performance improvement analysis, which could be the improved port capacity or the vessel fleet’s existence. Up to now, there were only a few studies related to bottleneck assessment in maritime networks [57]. Given the information, decisions on improving the vessel fleet size and updating vessel routes can also be evaluated.
We assume that any amount of investment can directly affect the increase in container flows starting from the next year (or increase such potential for container flow growth). In a more realistic setting, we might consider the learning rate required to implement the investment, which depends on its amount. The learning curve was extensively studied in the field of manufacturing system operation management. It refers to the increase in workers’ performance after working for certain periods when a new production system is introduced—e.g., new process development [58] and production capacity expansion [59]. In our case, different port clusters might be managed under different management; thus, different areas might have various port development speeds—e.g., in the high-populated region compared with the less developed area.
We tested our models’ robustness by modifying the available budget for each container port and year in Table A1, with the values starting from 70%, increasing by 10% up to 130%. In the ideal situation, we expect that the change in the invested amount is as close as possible to the amount of change in the available budget. We observed some more change from that threshold, as shown in Table 3—i.e., −0.1% value in the second row—which means that the total invested amount in port cluster II at Year 4 is 0.6%; thus, the change is −0.1% (calculated from 0.6–0.7%). We categorized the changes into four types of ranges with a maximum value of 3.8%. It can be concluded that the obtained optimal solution is robust when observed from the viewpoint of improvement levels in each port cluster.
Using the proposed models, we can deal with investment plan changes after a certain number of years by solving the models several times using the rolling planning horizon approach. Solving the model several times is no problem because the solutions can be obtained within a short computational time.
Our current study focused on solving the investment problem for multiple ports considering the relationships between the ports. We modeled the effects of the investment amount at the seaside operation on the terminal’s throughput. The effect was generally observed by considering that the amount of the investment affects the throughput linearly. For future studies, it is necessary to assess (1) the detailed allocation of the investment to the measurable specific facilities at the seaside, e.g., length of berths and number of quay cranes, and (2) the investment or its effects at the landside of the terminal—e.g., yard capacity, yard cranes, connectivity with the hinterland, etc.
6. Managerial Insights
Mathematical models have been proven to provide good assistance to decision makers in making investment decisions. The reason for this is that quantitative information allows better information sharing and higher success rates than qualitative information [60]. Successful applications of the mathematical modeling approach for investment decisions in real companies (e.g., General Electric, Cities Service Company, and Grantham, May, Van Otterloo and Company LLC (GMO)) are presented in [51,61,62,63]. The applied models and produced the best combination of investment strategies that satisfy the objectives and constraints set in Cities Service Company [62]. Various cases were generated by modifying the objectives and constraints, allowing the company to consider some alternative investment decisions. The management accepted the models’ solutions, and the company became more reactive in terms of anticipating external events. As the users became more familiar with the models, they requested more improvements through the addition of new features in the models. Such success in utilizing the results of investment models above can also be applied to the container port network development case. This mathematical modeling can be used to formalize the knowledge of the decision makers, help to assess whether certain knowledge eventually has a great impact on the expected system’s performance, and assess the extent to how much the decision benefits the decision makers. In our case, the proposed models can be used for confirming the importance of port connectivity in the port investment problem [64].
The selection of the best investment decision enabled an opportunity for more detailed analysis by using simulation models or accounting procedures [63]. The models were used for (1) assessments in long-term analysis with estimated values and (2) short-term and detailed decision making [62]. In the example of GMO company, the company gained the following advantages through the investment model implementations: (1) keeping existing businesses, (2) increasing new growth opportunities, (3) improving the company’s operation, and (4) being able to track how close their investment decisions are to their target [51].
Our proposed methods are more suitable to optimize investment decisions when the government manages the whole container port network. In this situation, it is possible to allocate the investments to improve the whole network’s capacity without dealing with competition between ports. The proposed methods can perform more effectively when applied to port networks with more ports and high connectivity.
7. Conclusions
This study was the first to introduce the problem of making investment decisions on multiple ports under single management while considering relationships between the ports that are related to the container flows. We proposed three mathematical models to determine the appropriate investment amount for container ports within a network. Effects of the investment were observed based on the existing number of connected ports and the travel time between ports in the same cluster. The optimal amount of investment in each container port every year was determined optimally within a very short time. It was shown that the proposed solution method was robust enough to deal with changes in the available investment budget. The produced results could provide useful insights for the managers on how to allocate the investment budget well.
Future research topics should consider a better estimation of the port capacities based on the number of installed quay cranes, port network bottleneck analysis considering existing vessel fleet size and routes, and the increased learning curve in the container flow that applies when the capacities of the ports are increased every year. It is necessary to develop efficient heuristics to solve the problem, considering the potential increase in model complexity through the addition of such new parameters.
Author Contributions
Conceptualization, V.N.R., S.D.C. and I.K.S.; methodology, I.K.S.; software, I.K.S.; validation, V.N.R. and S.D.C.; formal analysis, I.K.S.; resources, V.N.R.; data curation, V.N.R., S.D.C. and I.K.S.; writing—original draft preparation, I.K.S.; writing—review and editing, V.N.R. and S.D.C.; visualization, I.K.S.; supervision, I.K.S. All authors have read and agreed to the published version of the manuscript.
Funding
This research received no external funding.
Data Availability Statement
The source code and input files are downloadable (https://github.com/ivanksinggih/PortImprovement_Adjacency accessed on 20 February 2021).
Conflicts of Interest
The authors declare no conflict of interest.
Appendix A. Input Data and Additional Results
In this section, we present the input data for the proposed models and some additional results obtained using the models.
Table A1.
Container ports and available budget data (budget in trillion rupiahs).
Table A1.
Container ports and available budget data (budget in trillion rupiahs).
| No. | Container Port | Cluster | Year 1 | Year 2 | Year 3 | Year 4 | Year 5 | Total |
|---|---|---|---|---|---|---|---|---|
| 1 | Belawan/Kuala Tanjung | I | 4280 | 6720 | 10,700 | 2700 | 0 | 24,400 |
| 2 | Malahayati | I | 549 | 1015 | 0 | 0 | 0 | 1564 |
| 3 | Batam (Batu Ampar) | I | 240 | 360 | 600 | 0 | 0 | 1200 |
| 4 | Tanjung Priok/Kalibaru | II | 1309 | 2181 | 2618 | 0 | 0 | 6108 |
| 5 | Pontianak/Kijing (Kalbar) | II | 291 | 582 | 727 | 1309 | 0 | 2909 |
| 6 | Palembang/Tanjung Carat (Sumsel) | II | 658 | 1316 | 1645 | 2962 | 0 | 6581 |
| 7 | Jambi/Muara Sabak | II | 0 | 100 | 100 | 100 | 0 | 300 |
| 8 | Teluk Bayur | II | 44 | 82 | 35 | 0 | 0 | 161 |
| 9 | Panjang (Lampung) | II | 24 | 37 | 61 | 0 | 0 | 122 |
| 10 | Tanjung Perak | III | 3024 | 1273 | 1638 | 2141 | 487 | 8563 |
| 11 | Tanjung Emas | III | 320 | 138 | 287 | 234 | 191 | 1170 |
| 12 | Banjarmasin | III | 76 | 108 | 139 | 198 | 104 | 625 |
| 13 | Tenau Kupang | III | 12 | 21 | 33 | 0 | 12 | 78 |
| 14 | Sampit | III | 20 | 20 | 20 | 20 | 20 | 100 |
| 15 | Samarinda dan TPK Palaran | IV | 0 | 99 | 149 | 249 | 0 | 497 |
| 16 | Balikpapan dan TP Kariangau | IV | 92 | 138 | 230 | 0 | 0 | 460 |
| 17 | Bitung (TPB) | IV | 150 | 166 | 132 | 249 | 444 | 1141 |
| 18 | Pantoloan | IV | 64 | 31 | 82 | 82 | 90 | 349 |
| 19 | Kendari (Kendari New Port) | IV | 6 | 139 | 206 | 338 | 0 | 689 |
| 20 | Makassar | IV | 132 | 131 | 36 | 46 | 0 | 345 |
| 21 | Ternate | IV | 8 | 21 | 68 | 44 | 0 | 141 |
| 22 | Ambon | IV | 135 | 53 | 112 | 44 | 0 | 344 |
| 23 | Sorong | IV | 13 | 439 | 171 | 176 | 0 | 799 |
| 24 | Jayapura | IV | 25 | 100 | 294 | 34 | 0 | 453 |
| Total Cluster I | 5069 | 8095 | 11,300 | 2700 | 0 | 27,164 | ||
| Total Cluster II | 2326 | 4298 | 5186 | 4371 | 0 | 16,181 | ||
| Total Cluster III | 3452 | 1560 | 2117 | 2593 | 814 | 10,536 | ||
| Total Cluster IV | 625 | 1317 | 1480 | 1262 | 534 | 5218 | ||
| Total Cluster I-IV | 11,472 | 15,270 | 20,083 | 10,926 | 1348 | 59,099 | ||
Note: <name> Hub port; <name> Feeder port.
Table A2.
Travel time data between ports (in minutes).
Table A2.
Travel time data between ports (in minutes).
| No. | Container Port | 1 | 2 | 3 | 4 | 5 | ... | 22 | 23 | 24 |
|---|---|---|---|---|---|---|---|---|---|---|
| 1 | Belawan/Kuala Tanjung | 17 | 25 | 58 | 46 | ... | 138 | 151 | 195 | |
| 2 | Malahayati | 52 | 74 | 64 | ... | 155 | 168 | 213 | ||
| 3 | Batam (Batu Ampar) | 33 | 21 | ... | 113 | 126 | 170 | |||
| 4 | Tanjung Priok/Kalibaru | 31 | ... | 93 | 107 | 151 | ||||
| 5 | Pontianak/Kijing (Kalbar) | ... | 98 | 112 | 154 | |||||
| 6 | Palembang/Tanjung Carat (Sumsel) | ... | 103 | 116 | 161 | |||||
| 7 | Jambi/Muara Sabak | ... | 112 | 125 | 169 | |||||
| 8 | Teluk Bayur | ... | 131 | 145 | 189 | |||||
| 9 | Panjang (Lampung) | ... | 123 | 108 | 171 | |||||
| 10 | Tanjung Perak | ... | 69 | 82 | 127 | |||||
| 11 | Tanjung Emas | ... | 79 | 92 | 137 | |||||
| 12 | Banjarmasin | ... | 65 | 78 | 122 | |||||
| 13 | Tenau Kupang | ... | 31 | 46 | 90 | |||||
| 14 | Sampit | ... | 71 | 84 | 129 | |||||
| 15 | Samarinda dan TPK Palaran | ... | 62 | 66 | 108 | |||||
| 16 | Balikpapan dan TP Kariangau | ... | 61 | 68 | 108 | |||||
| 17 | Bitung (TPB) | ... | 26 | 28 | 110 | |||||
| 18 | Pantoloan | ... | 57 | 59 | 100 | |||||
| 19 | Kendari (Kendari New Port) | ... | 25 | 55 | 82 | |||||
| 20 | Makassar | ... | 41 | 55 | 82 | |||||
| 21 | Ternate | ... | 21 | 20 | 63 | |||||
| 22 | Ambon | ... | 19 | 40 | ||||||
| 23 | Sorong | ... | 45 | |||||||
| 24 | Jayapura | ... |
Note: <name> Hub port; <name> Feeder port. Only the upper triangle is used to represent the travel times (symmetric travel times between any pair of container ports are considered).
Table A3.
Investment decision as the result of Model 2 (in trillion rupiahs).
Table A3.
Investment decision as the result of Model 2 (in trillion rupiahs).
| No. | Container Port | Cluster | Year 1 | Year 2 | Year 3 | Year 4 | Year 5 |
|---|---|---|---|---|---|---|---|
| 1 | Belawan/Kuala Tanjung | I | 5069 | 8095 | 11,236 | 0 | 0 |
| 2 | Malahayati | I | 0 | 0 | 0 | 1564 | 0 |
| 3 | Batam (Batu Ampar) | I | 0 | 0 | 64 | 1136 | 0 |
| 4 | Tanjung Priok/Kalibaru | II | 2326 | 3782 | 0 | 0 | 0 |
| 5 | Pontianak/Kijing (Kalbar) | II | 0 | 0 | 0 | 2909 | 0 |
| 6 | Palembang/Tanjung Carat (Sumsel) | II | 0 | 0 | 5186 | 1395 | 0 |
| 7 | Jambi/Muara Sabak | II | 0 | 300 | 0 | 0 | 0 |
| 8 | Teluk Bayur | II | 0 | 94 | 0 | 67 | 0 |
| 9 | Panjang (Lampung) | II | 0 | 122 | 0 | 0 | 0 |
| 10 | Tanjung Perak | III | 3452 | 1560 | 2117 | 1434 | 0 |
| 11 | Tanjung Emas | III | 0 | 0 | 0 | 456 | 714 |
| 12 | Banjarmasin | III | 0 | 0 | 0 | 625 | 0 |
| 13 | Tenau Kupang | III | 0 | 0 | 0 | 78 | 0 |
| 14 | Sampit | III | 0 | 0 | 0 | 0 | 100 |
| 15 | Samarinda dan TPK Palaran | IV | 0 | 0 | 0 | 497 | 0 |
| 16 | Balikpapan dan TP Kariangau | IV | 0 | 107 | 337 | 16 | 0 |
| 17 | Bitung (TPB) | IV | 280 | 861 | 0 | 0 | 0 |
| 18 | Pantoloan | IV | 0 | 349 | 0 | 0 | 0 |
| 19 | Kendari (Kendari New Port) | IV | 0 | 0 | 0 | 296 | 393 |
| 20 | Makassar | IV | 345 | 0 | 0 | 0 | 0 |
| 21 | Ternate | IV | 0 | 0 | 0 | 0 | 141 |
| 22 | Ambon | IV | 0 | 0 | 344 | 0 | 0 |
| 23 | Sorong | IV | 0 | 0 | 799 | 0 | 0 |
| 24 | Jayapura | IV | 0 | 0 | 0 | 453 | 0 |
| Total Cluster I | 5069 | 8095 | 11,300 | 2700 | 0 | ||
| Total Cluster II | 2326 | 4298 | 5186 | 4371 | 0 | ||
| Total Cluster III | 3452 | 1560 | 2117 | 2593 | 814 | ||
| Total Cluster IV | 625 | 1317 | 1480 | 1262 | 534 | ||
Note: <name> Hub port; <name> Feeder port.
Table A4.
Investment decision as the result of Model 3 (in trillion rupiahs).
Table A4.
Investment decision as the result of Model 3 (in trillion rupiahs).
| No. | Container Port | Cluster | Year 1 | Year 2 | Year 3 | Year 4 | Year 5 |
|---|---|---|---|---|---|---|---|
| 1 | Belawan/Kuala Tanjung | I | 2909 | 15,270 | 6221 | 0 | 0 |
| 2 | Malahayati | I | 0 | 0 | 1564 | 0 | 0 |
| 3 | Batam (Batu Ampar) | I | 0 | 0 | 0 | 1200 | 0 |
| 4 | Tanjung Priok/Kalibaru | II | 0 | 0 | 6108 | 0 | 0 |
| 5 | Pontianak/Kijing (Kalbar) | II | 0 | 0 | 2891 | 18 | 0 |
| 6 | Palembang/Tanjung Carat (Sumsel) | II | 0 | 0 | 0 | 5986 | 595 |
| 7 | Jambi/Muara Sabak | II | 0 | 0 | 0 | 0 | 300 |
| 8 | Teluk Bayur | II | 0 | 0 | 0 | 161 | 0 |
| 9 | Panjang (Lampung) | II | 0 | 0 | 122 | 0 | 0 |
| 10 | Tanjung Perak | III | 8563 | 0 | 0 | 0 | 0 |
| 11 | Tanjung Emas | III | 0 | 0 | 1170 | 0 | 0 |
| 12 | Banjarmasin | III | 0 | 0 | 625 | 0 | 0 |
| 13 | Tenau Kupang | III | 0 | 0 | 0 | 78 | 0 |
| 14 | Sampit | III | 0 | 0 | 100 | 0 | 0 |
| 15 | Samarinda dan TPK Palaran | IV | 0 | 0 | 0 | 497 | 0 |
| 16 | Balikpapan dan TP Kariangau | IV | 0 | 0 | 0 | 460 | 0 |
| 17 | Bitung (TPB) | IV | 0 | 0 | 1141 | 0 | 0 |
| 18 | Pantoloan | IV | 0 | 0 | 0 | 349 | 0 |
| 19 | Kendari (Kendari New Port) | IV | 0 | 0 | 0 | 689 | 0 |
| 20 | Makassar | IV | 0 | 0 | 0 | 345 | 0 |
| 21 | Ternate | IV | 0 | 0 | 141 | 0 | 0 |
| 22 | Ambon | IV | 0 | 0 | 0 | 344 | 0 |
| 23 | Sorong | IV | 0 | 0 | 0 | 799 | 0 |
| 24 | Jayapura | IV | 0 | 0 | 0 | 0 | 453 |
| Total Cluster I | 2909 | 15,270 | 7785 | 1200 | 0 | ||
| Total Cluster II | 0 | 0 | 9121 | 6165 | 895 | ||
| Total Cluster III | 8563 | 0 | 1895 | 78 | 0 | ||
| Total Cluster IV | 0 | 0 | 1282 | 3483 | 453 | ||
Note: <name> Hub port; <name> Feeder port.
Table A5.
Average time travels to other container ports.
Table A5.
Average time travels to other container ports.
| No. | Container Port | Cluster | Average Time Travels to Other Ports (in Minutes) | Number of Connected Ports |
|---|---|---|---|---|
| 1 | Belawan/Kuala Tanjung | I | 21.0 | 5 |
| 2 | Malahayati | I | 34.5 | 1 |
| 3 | Batam (Batu Ampar) | I | 38.5 | 1 |
| 4 | Tanjung Priok/Kalibaru | II | 25.0 | 6 |
| 5 | Pontianak/Kijing (Kalbar) | II | 35.4 | 1 |
| 6 | Palembang/Tanjung Carat (Sumsel) | II | 54.4 | 1 |
| 7 | Jambi/Muara Sabak | II | 61.4 | 1 |
| 8 | Teluk Bayur | II | 49.4 | 1 |
| 9 | Panjang (Lampung) | II | 25.2 | 1 |
| 10 | Tanjung Perak | III | 20.0 | 8 |
| 11 | Tanjung Emas | III | 34.5 | 2 |
| 12 | Banjarmasin | III | 28.5 | 2 |
| 13 | Tenau Kupang | III | 46.3 | 2 |
| 14 | Sampit | III | 25.3 | 1 |
| 15 | Samarinda dan TPK Palaran | IV | 39.6 | 2 |
| 16 | Balikpapan dan TP Kariangau | IV | 44.2 | 2 |
| 17 | Bitung (TPB) | IV | 34.9 | 6 |
| 18 | Pantoloan | IV | 40.3 | 2 |
| 19 | Kendari (Kendari New Port) | IV | 38.4 | 1 |
| 20 | Makassar | IV | 35.8 | 8 |
| 21 | Ternate | IV | 33.1 | 1 |
| 22 | Ambon | IV | 39.1 | 2 |
| 23 | Sorong | IV | 46.1 | 2 |
| 24 | Jayapura | IV | 82.0 | 1 |
| Ports in Cluster I | 31.3 | |||
| Ports in Cluster II | 41.8 | |||
| Ports in Cluster III | 30.9 | |||
| Ports in Cluster IV | 43.4 | |||
Note: <name> Hub port; <name> Feeder port.
References
- Zhang, A.; Loh, H.S.; Thai, V.V. Impacts of global manufacturing trends on port development: The case of Hong Kong. Asian J. Shipp. Logist. 2015, 31, 135–159. [Google Scholar] [CrossRef]
- Ha, M.-S. A comparison of service quality at major container ports: Implications for Korean ports. J. Transp. Geogr. 2003, 11, 131–137. [Google Scholar] [CrossRef]
- Shi, X.; Li, H. Developing the port hinterland: Different perspectives and their application to Shenzhen Port, China. Res. Transp. Bus. Manag. 2016, 19, 42–50. [Google Scholar] [CrossRef]
- Kim, K.H.; Günther, H.O. Container terminals and terminal operations. In Container Terminals and Cargo Systems; Kim, K.H., Günther, H.O., Eds.; Springer: Berlin, Germany, 2007; p. 7. [Google Scholar]
- Kastner, M.; Nellen, N.; Schwientek, A.; Jahn, C. Integrated simulation-based optimization of operational decisions at container terminals. Algorithms 2021, 14, 42. [Google Scholar] [CrossRef]
- Zhang, D.; Zhan, Q.; Chen, Y.; Li, S. Joint optimization of logistics infrastructure investments and subsidies in a regional logistics network with CO2 emission reduction targets. Transp. Res. D Transp. Environ. 2018, 60, 174–190. [Google Scholar] [CrossRef]
- Edmond, E.D.; Maggs, R.P. How useful are queue models in port investment decisions for container berths? J. Oper. Res. Soc. 1978, 29, 741–750. [Google Scholar] [CrossRef]
- Moorthy, R.; Teo, C.-P. Berth management in container terminal: The template design problem. OR Spectr. 2006, 28, 495–518. [Google Scholar] [CrossRef]
- Jin, J.G.; Lee, D.-H.; Hu, H. Tactical berth and yard template design at container transshipment terminals: A column generation based approach. Transport Res. Part E 2015, 73, 168–184. [Google Scholar] [CrossRef]
- Lin, Y.; Yan, L.; Wang, Y.-M. Performance evaluation and investment analysis for container port sustainable development in China: An inverse DEA approach. Sustainability 2019, 11, 4617. [Google Scholar] [CrossRef]
- Kizilay, D.; Eliiyi, D.T. A comprehensive review of quay crane scheduling, yard operations and integrations thereof in container terminals. Flex. Serv. Manuf. J. 2021, 33, 1–42. [Google Scholar] [CrossRef]
- Chu, Y.; Zhang, X.; Yang, Z. Multiple quay cranes scheduling for double cycling in container terminals. PLoS ONE 2017, 12, e0180370. [Google Scholar] [CrossRef] [PubMed]
- Wang, Y.; Kim, K.H. A quay crane scheduling algorithm considering the workload of yard cranes in a container yard. J. Intell. Manuf. 2011, 22, 459–470. [Google Scholar] [CrossRef]
- He, J.; Huang, Y.; Yan, W.; Wang, S. Integrated internal truck, yard crane and quay crane scheduling in a container terminal considering energy consumption. Expert Syst. Appl. 2015, 42, 2464–2487. [Google Scholar] [CrossRef]
- Kim, K.H.; Moon, K.C. Berth scheduling by simulated annealing. Transp. Res. Part B 2003, 37, 541–560. [Google Scholar] [CrossRef]
- Phan-Thi, M.-H.; Ryu, K.; Kim, K.H. Comparing cycle times of advanced quay cranes in container terminals. Ind. Eng. Manag. Syst. 2013, 12, 359–367. [Google Scholar] [CrossRef]
- Takano, K.; Arai, M. A genetic algorithm for the hub-and-spoke problem applied to containerized cargo transport. J. Mar. Sci. Technol. 2009, 14, 256–274. [Google Scholar] [CrossRef]
- Adiliya, A. Port maritime connectivity in South-East Indonesia: A new strategic positioning for transhipment port of Tenau Kupang. Asian J. Shipp. Logist. 2019, 35, 172–180. [Google Scholar]
- Chen, K.; Xu, S.; Haralambides, H. Determining hub port locations and feeder network designs: The case of China-West Africa trade. Transp. Policy 2020, 86, 9–22. [Google Scholar] [CrossRef]
- Gattuso, D.; Malara, M.; Cassone, G.C. Planning and simulation of intermodal freight transport on international networks. Hub and spoke system in Euro-Mediterranean area. Sustainability 2020, 12, 776. [Google Scholar] [CrossRef]
- Tu, N.; Adiputranto, D.; Fu, X.; Li, Z.-C. Shipping network design in a growth market: The case of Indonesia. Transp. Res. Part E 2018, 117, 108–125. [Google Scholar] [CrossRef]
- Konings, R.; Kreutzberger, E.; Maraš, V. Major considerations in developing a hub-and-spoke network to improve the cost performance of container barge transport in the hinterland: The case of the port of Rotterdam. J. Transp. Geogr. 2013, 29, 63–73. [Google Scholar] [CrossRef]
- Polat, O.; Günther, H.-O.; Kulak, O. The feeder network design problem: Application to container services in the Black Sea region. Marit. Econ. Logist. 2014, 16, 343–369. [Google Scholar] [CrossRef]
- Zheng, J.; Meng, Q.; Sun, Z. Liner hub-and-spoke shipping network design. Transp. Res. Part E 2015, 75, 32–48. [Google Scholar] [CrossRef]
- Zheng, J.; Yang, D. Hub-and-spoke network design for container shipping along the Yangtze River. J. Transp. Geogr. 2016, 55, 51–57. [Google Scholar] [CrossRef]
- Xing, J.; Zhong, M. A reactive container rerouting model for container flow recovery in a hub-and-spoke liner shipping network. Marit. Policy Manag. 2017, 44, 744–760. [Google Scholar] [CrossRef]
- Gelareh, S.; Maculan, N.; Mahey, P.; Monemi, R.N. Hub-and-spoke network design and fleet deployment for string planning of liner shipping. Appl. Math. Model. 2013, 37, 3307–3321. [Google Scholar] [CrossRef]
- Meng, Q.; Wang, S.; Liu, Z. Network design for shipping service of large-scale intermodal liners. Transp. Res. Rec. 2012, 2269, 42–50. [Google Scholar] [CrossRef]
- Lagoudis, I.N.; Rice, J.B.; Salminen, J.B. Port investment strategies under uncertainty: The case of a Southeast Asian multipurpose port. Asian J. Shipp. Logist. 2014, 30, 299–319. [Google Scholar] [CrossRef]
- Di Ruocco, G.; Nesticò, A. Archaeological site conservation and enhancement: An economic evaluation model for the selection of investment projects. Sustainability 2018, 10, 3907. [Google Scholar] [CrossRef]
- Tran, T.-H.; Mao, Y.; Siebers, P.-O. Optimising decarbonisation investment for firms towards environmental sustainability. Sustainability 2019, 11, 5718. [Google Scholar] [CrossRef]
- Viaggi, D.; Raggi, M.; Gomez y Paloma, S. An integer programming dynamic farm-household model to evaluate the impact of agricultural policy reforms on farm investment behaviour. Eur. J. Oper. Res. 2010, 207, 1130–1139. [Google Scholar] [CrossRef]
- Liu, J.; Guo, T.; Wang, Y.; Li, Y.; Xu, S. Multi-technical flexibility retrofit planning of thermal power units considering high penetration variable renewable energy: The case of China. Sustainability 2020, 12, 3543. [Google Scholar] [CrossRef]
- Saberi, S.; Cruz, J.M.; Sarkis, J.; Nagurney, A. A competitive multiperiod supply chain network model with freight carriers and green technology investment option. Eur. J. Oper. Res. 2018, 266, 934–949. [Google Scholar] [CrossRef]
- Zhuang, W.; Luo, M.; Fu, X. A game theory analysis of port specialization—implications to the Chinese port industry. Marit. Policy Manag. 2014, 41, 268–287. [Google Scholar] [CrossRef]
- Xiao, Y.; Ng, A.K.Y.; Yang, H.; Fu, X. An analysis of the dynamics of ownership, capacity investments and pricing structure of ports. Transp. Rev. 2012, 32, 629–652. [Google Scholar] [CrossRef]
- Balliauw, M.; Kort, P.M.; Zhang, A. Capacity investment decisions of two competing ports under uncertainty: A strategic real options approach. Transp. Res. Part B 2019, 122, 249–264. [Google Scholar] [CrossRef]
- Zheng, S.; Negenborn, R.R. Terminal investment timing decisions in a competitive setting with uncertainty using a real option approach. Marit. Policy Manag. 2017, 44, 392–411. [Google Scholar] [CrossRef]
- Fung, M.K. Does trigger point mechanism create monopoly power for Hong Kong container terminals? Marit. Policy Manag. 2009, 36, 325–336. [Google Scholar] [CrossRef]
- Wahyuni, S.; Taufik, A.A.; Hui, F.K.P. Exploring key variables of port competitiveness: Evidence from Indonesian ports. Compet. Rev. 2020, 30, 529–553. [Google Scholar] [CrossRef]
- Angeloudis, P.; Greco, L.; Bell, M.G.H. Strategic maritime container service design in oligopolistic market, China. Transp. Res. Part B 2016, 90, 22–37. [Google Scholar] [CrossRef]
- Ridier, A.; Chaib, K.; Roussy, C. A dynamic stochastic programming model of crop rotation choice to test the adoption of long rotation under price and production risk. Eur. J. Oper. Res. 2016, 252, 270–279. [Google Scholar] [CrossRef]
- Robert, M.; Bergez, J.-E.; Thomas, A. A stochastic dynamic programming approach to analyze adaptation to climate change—Application to groundwater irrigation in India. Eur. J. Oper. Res. 2018, 265, 1033–1045. [Google Scholar] [CrossRef]
- Allahviranloo, M.; Afandizadeh, S. Investment optimization on port’s development by fuzzy integer programming. Eur. J. Oper. Res. 2008, 186, 423–434. [Google Scholar] [CrossRef]
- Balliauw, M.; Kort, P.M.; Meersman, H.; de Voorde, E.V.; Vanelslander, T. The case of public and private ports with two actors: Capacity investment decisions under congestion and uncertainty. Case Stud. Transp. Policy 2020, 8, 403–415. [Google Scholar] [CrossRef]
- Chen, D.; Yang, Z. Systematic optimization of port clusters along the maritime silk road in the context of industry transfer and production capacity constraints. Marit. Policy Manag. 2018, 109, 174–189. [Google Scholar] [CrossRef]
- Tovar, B.; Hernández, R.; Rodríguez-Déniz, H. Container port competitiveness and connectivity: The Canary Islands main ports case. Transp. Policy 2015, 38, 40–51. [Google Scholar] [CrossRef]
- Wang, G.W.Y.; Zeng, Q.; Li, K.; Yang, J. Port connectivity in a logistic network: The case of Bohai Bay, China. Transp. Res. Part E 2016, 95, 341–354. [Google Scholar] [CrossRef]
- BPPN. Pengembangan Tol Laut dalam RPJMN 2015–2019 dan Implementasi 2015 (Sea Toll Development in 2015–2019 Long-term Construction Plan and Its Implementation in 2015). 2015. Available online: https://www.bappenas.go.id/files/Pengembangan%20Tol%20Laut%20Dalam%20RPJMN%202015-2019%20Dan%20Implementasi%202015.pdf (accessed on 10 September 2020).
- SeaRates. Distances & Time. 2020. Available online: https://www.searates.com/services/distances-time/ (accessed on 21 December 2020).
- Bertsimas, D.; Darnell, C.; Soucy, R. Portfolio construction through mixed-integer programming at Grantham, Mayo, Van Otterloo and Company. Interfaces 1999, 29, 49–66. [Google Scholar] [CrossRef]
- Singgih, I.K.; Lee, J.; Kim, B.-I. Node and edge drone surveillance problem with consideration of required observation quality and battery replacement. IEEE Access 2020, 8, 44125–44139. [Google Scholar] [CrossRef]
- Singgih, I.K.; Yu, O.; Kim, B.-I.; Koo, J.; Lee, S. Production scheduling problem in a factory of automobile component primer painting. J. Intell. Manuf. 2020, 31, 1483–1496. [Google Scholar] [CrossRef]
- Real Interest Rate. Available online: https://data.worldbank.org/indicator/FR.INR.RINR (accessed on 19 February 2021).
- Lin, J.; Gao, B.; Zhang, C. Simulation-based investment planning for Humen Port. Simul. Model. Pract. Theory 2014, 40, 161–175. [Google Scholar] [CrossRef]
- Christiansen, M.; Hellsten, E.; Pisinger, D.; Sacramento, D.; Vilhelmsen, C. Liner shipping network design. Eur. J. Oper. Res. 2020, 286, 1–20. [Google Scholar] [CrossRef]
- Pan, J.; Bell, M.G.H.; Cheung, K.-F.; Perera, S. Identifying container shipping network bottlenecks along China’s Maritime Silk Road based on a spectral analysis. Marit. Policy Manag. 2020, 1–13. [Google Scholar] [CrossRef]
- Hatch, N.W.; Mowery, D.C. Process innovation and learning by doing in semiconductor manufacturing. Manag. Sci. 1998, 44, 1461–1477. [Google Scholar] [CrossRef]
- Pedersen, P.-C.; Slepniov, D. Management of the learning curve: A case of overseas production capacity expansion. Int. J. Oper. Prod. Manag. 2016, 36, 42–60. [Google Scholar] [CrossRef]
- Ang, N.P.; Trotman, K.T. The utilization of quantitative and qualitative information in groups’ capital investment decisions. Behav. Res. Account. 2014, 27, 1–24. [Google Scholar] [CrossRef]
- Bollapragada, S.; Owens, B.; Taub, S. Practice summaries: An optimization model to support renewable energy investment decisions. Interfaces 2011, 41, 394–395. [Google Scholar] [CrossRef]
- Rychel, D.F. Capital budgeting with mixed integer linear programming: An application. Financ. Manag. 1977, 6, 11–19. [Google Scholar] [CrossRef]
- Hamilton, W.F.; Moses, M.A. An optimization model for corporate financial planning. Oper. Res. 1973, 21, 677–692. [Google Scholar] [CrossRef]
- Wiradanti, B.; Pettit, S.; Potter, A.; Abouarghoub, W. Willingnes to invest in peripheral ports: Perceptions of Indonesian port and maritime industry stakeholders. Marit. Econ. Logist. 2020, 22, 699–714. [Google Scholar] [CrossRef]
Short Biography of Authors
 | Veterina Nosadila Riaventin received a B.S degree in Industrial Engineering from the Bandung Institute of Technology, Indonesia, in 2012 and an M.Sc. degree in Industrial Engineering from Pusan National University, Busan, South Korea, in 2017. She is a lecturer in the Industrial Engineering Department, Bandung Institute of Technology. She teaches the course of Operation Research I and II, Quality Control and Assurance, Quantitative Modelling, and Quantitative Method. Her research interests include optimization in port container terminal and supply chain management and logistics. She is currently pursuing her PhD at Bandung Institute of Technology. |
 | Sofyan Dwi Cahyo received a B.S degree in Industrial Engineering from University of Gadjah Mada, Yogyakarta, Indonesia, in 2014, and an M.Sc. degree in Industrial Engineering from Pusan National University, Busan, South Korea, in 2017. He is a leader of Operations Development in Kuala Tanjung Multipurpose Terminal, Batu Bara, North Sumatera. He was a researcher who has actively participated in a project for technological development of low-carbon automated container terminals and a self-organizing logistics management in a smart logistics system at the Operations Analytics Laboratory, Department of Industrial Engineering, Pusan National University. His research interest includes material handling in container terminals and distribution centers. |
 | Ivan Kristianto Singgih received B.S. and M.S. degrees in industrial engineering from the Bandung Institute of Technology, Indonesia, in 2009 and 2010, respectively, and a Ph.D. degree in industrial engineering from Pusan National University, Busan, South Korea, in 2017. He was a Postdoctoral Researcher and a Research Assistant Professor with the Department of Industrial and Management Engineering, Pohang University of Science and Technology (POSTECH). He is a Postdoctoral Researcher with the Department of Industrial and Systems Engineering, Korea Advanced Institute of Science and Technology (KAIST), South Korea. His research interests include container terminal logistics, vehicle routing problems, scheduling, and serious game development. He is a member of KIIE, T-LOG, and Korean AI Association. He received the Best Student Paper Award at the IJIE 2013 Conference and the Korean Government Scholarship Excellent Academic Achievement Award in 2014. |


Publisher’s Note: MDPI stays neutral with regard to jurisdictional claims in published maps and institutional affiliations. |
© 2021 by the authors. Licensee MDPI, Basel, Switzerland. This article is an open access article distributed under the terms and conditions of the Creative Commons Attribution (CC BY) license (http://creativecommons.org/licenses/by/4.0/).