
Assessing the Prospects of Transboundary Multihazard Dynamics: The Case of Bhotekoshi–Sunkoshi Watershed in Sino–Nepal Border Region

 , ,
, ,  , ,
, ,  , , and
Abstract
1. Introduction
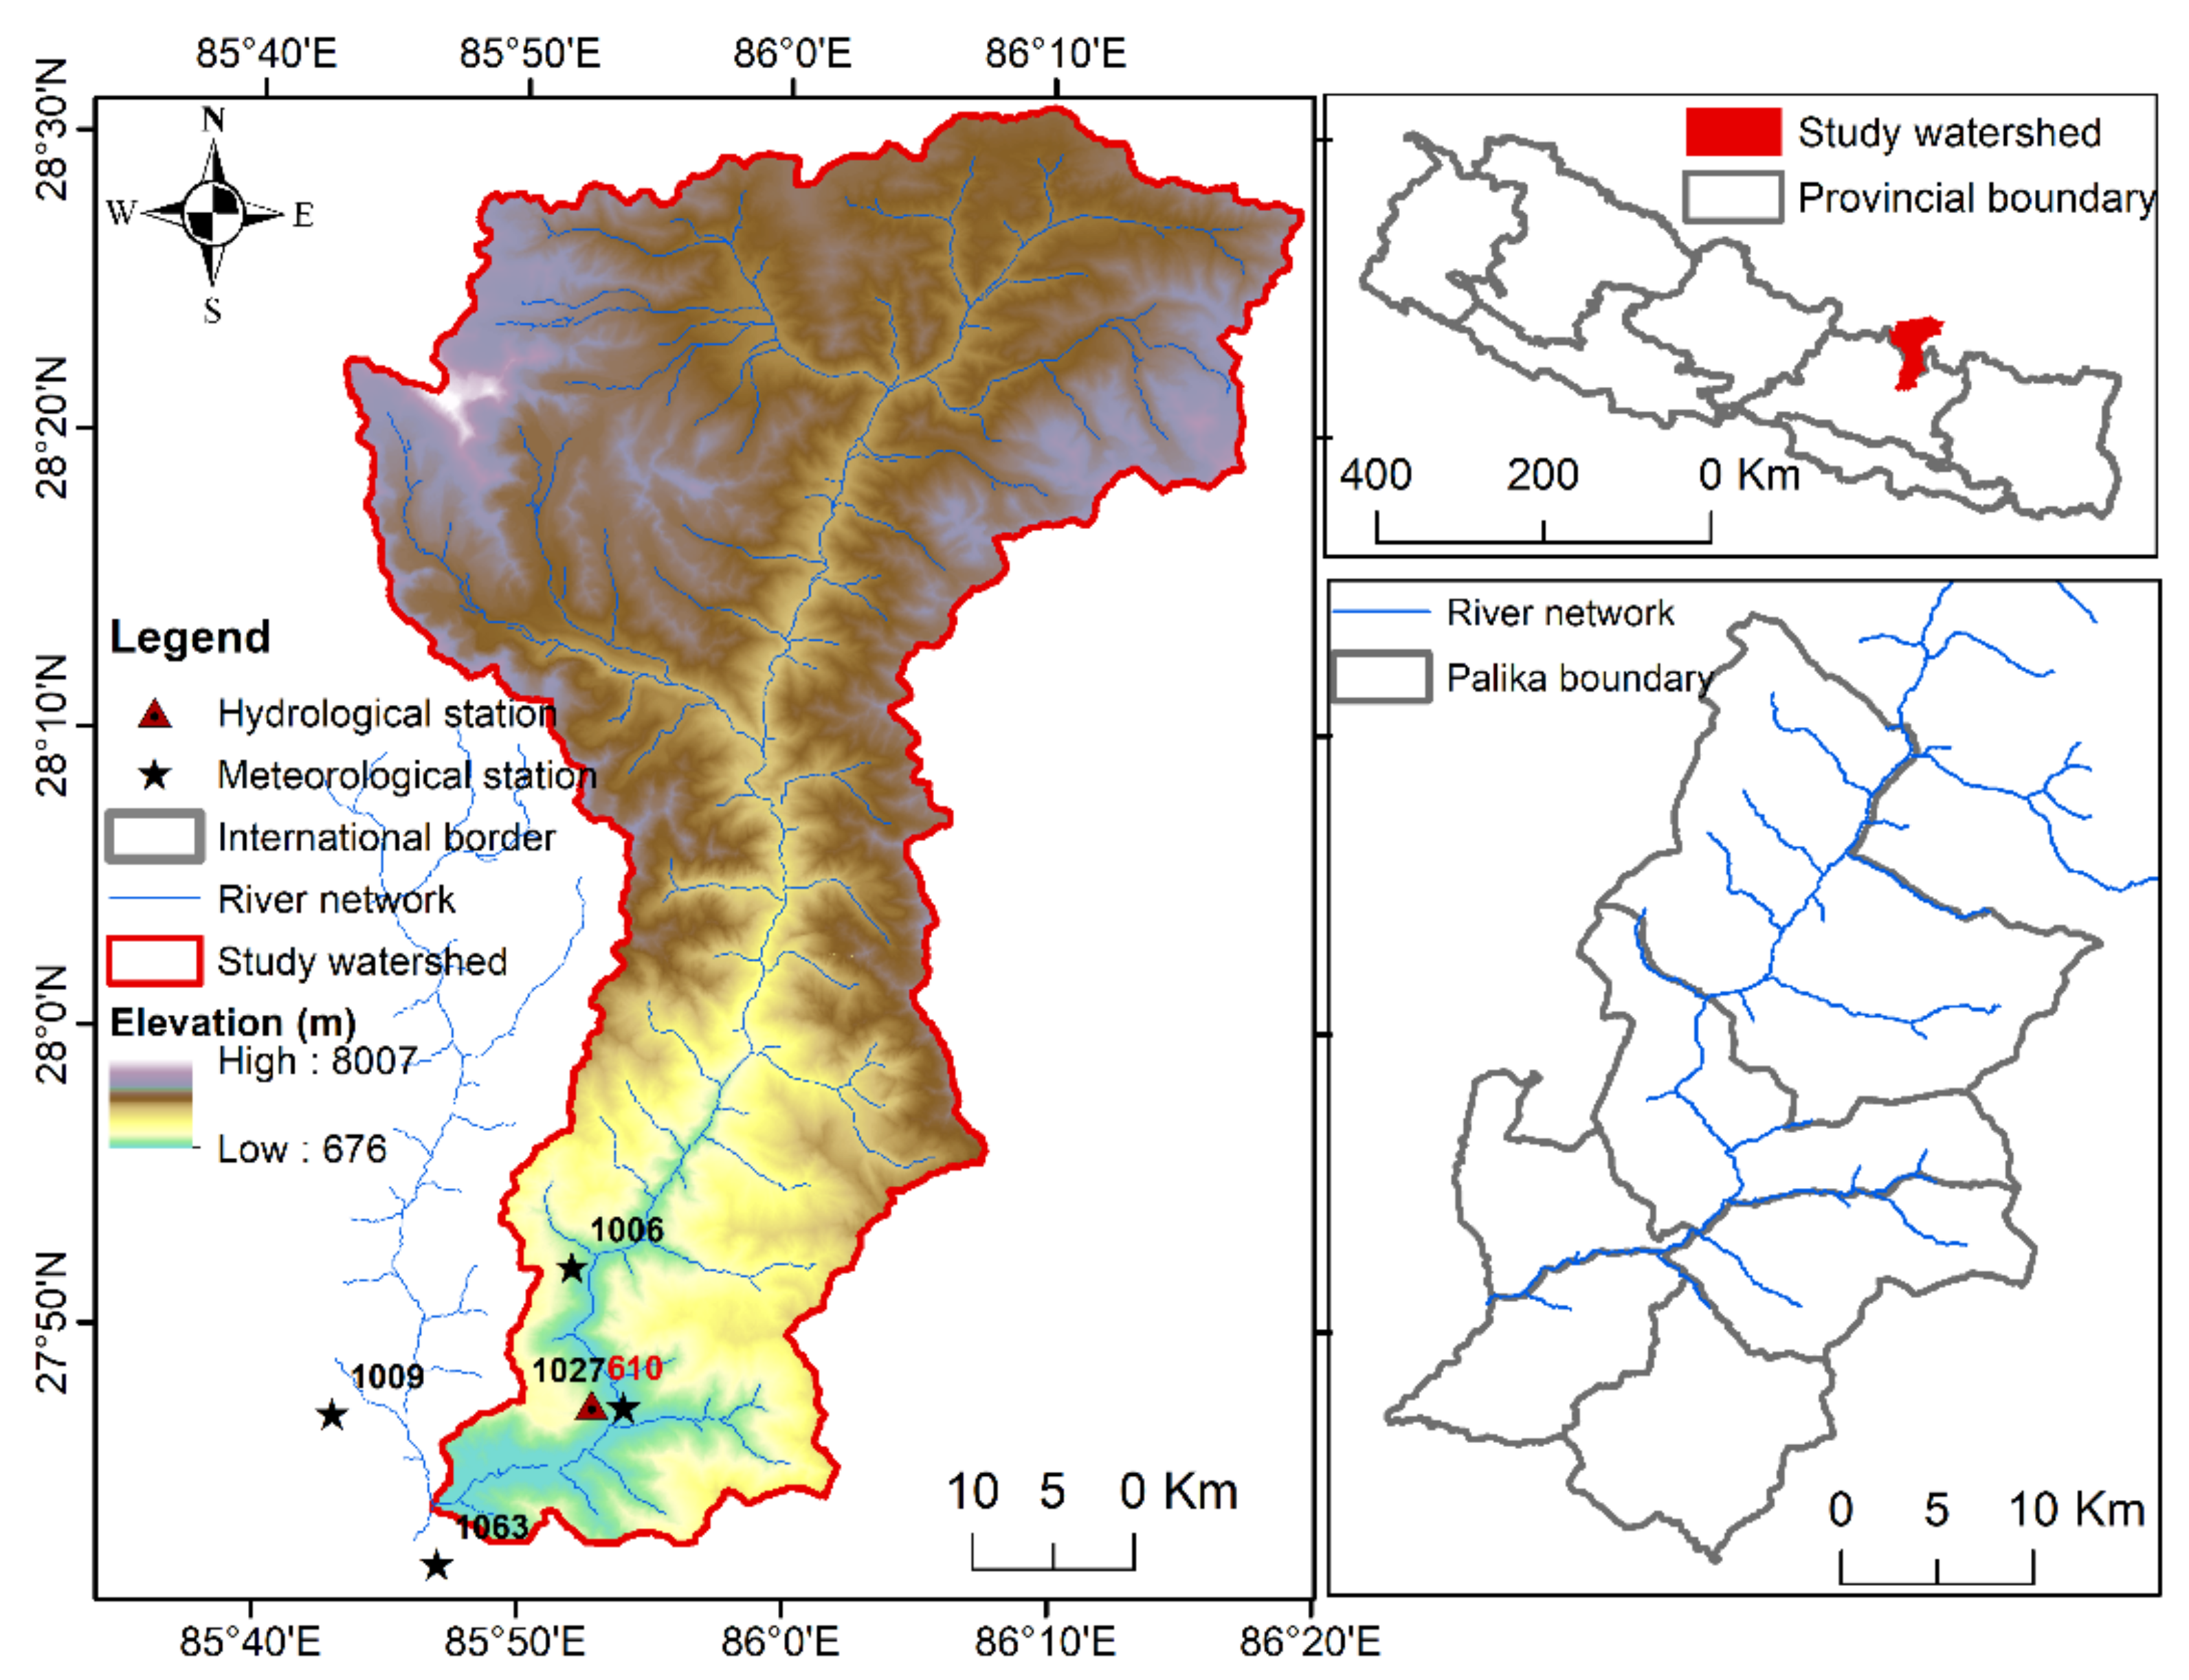
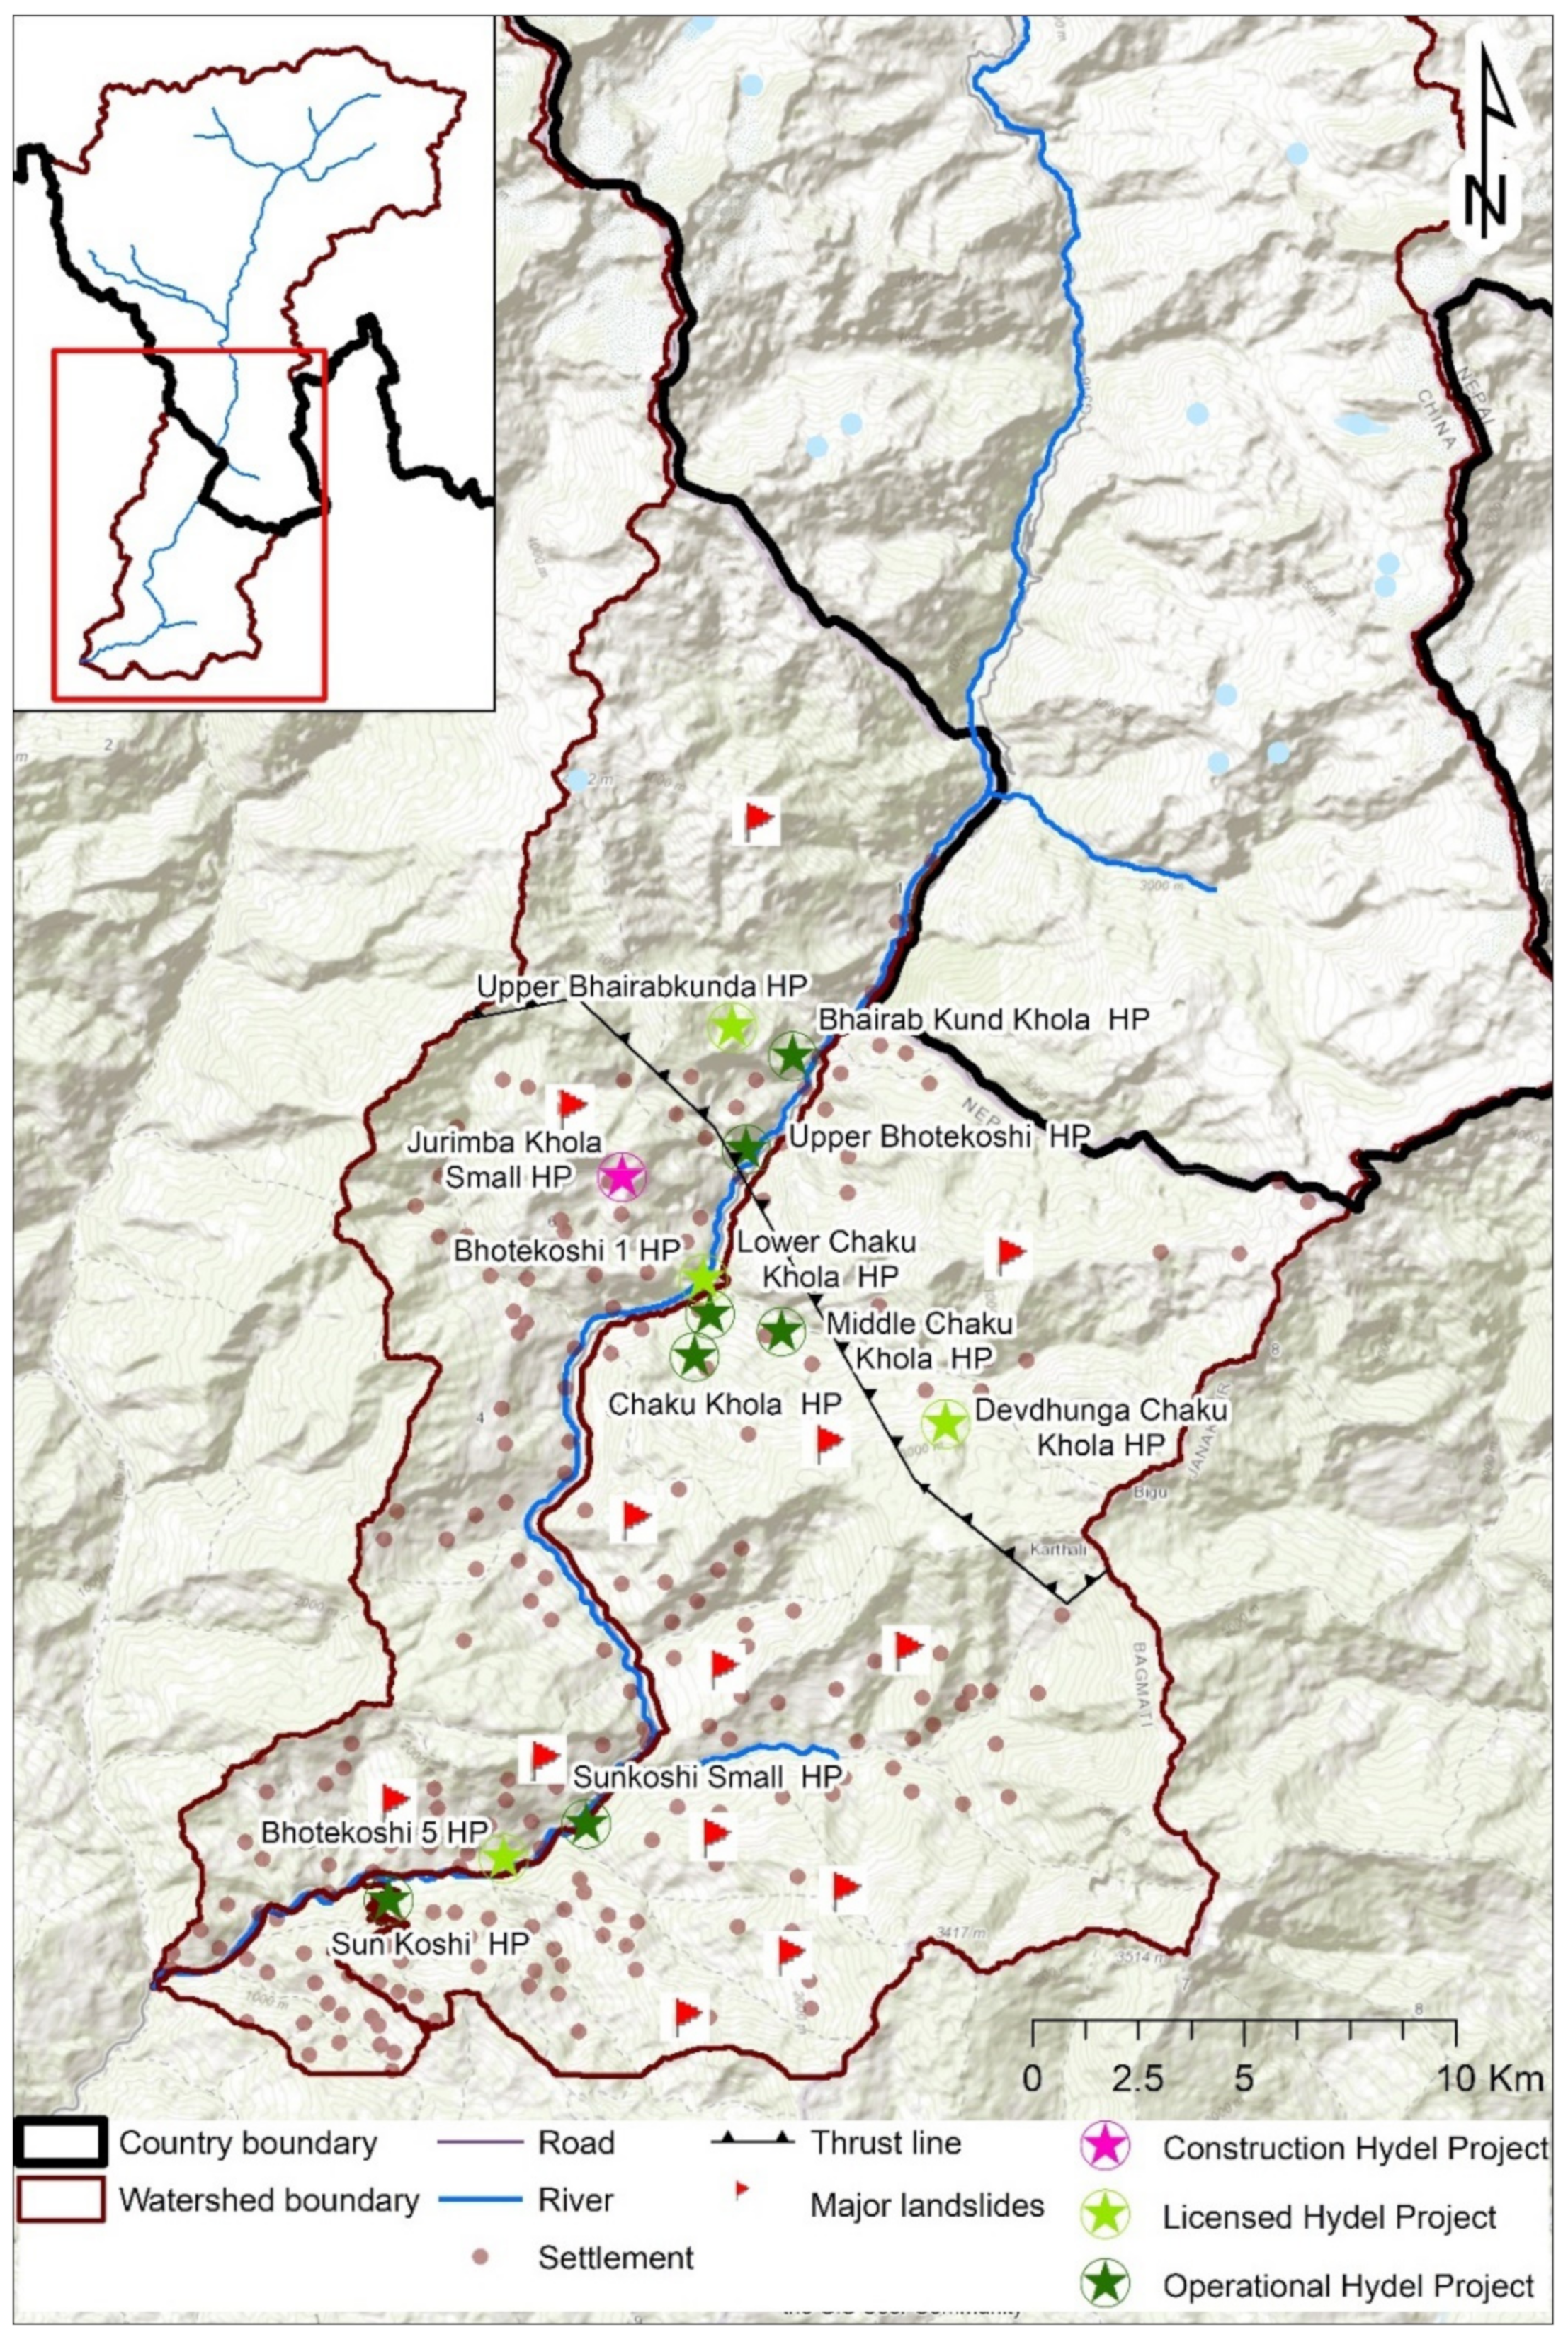
2. Study Area
3. Methodology
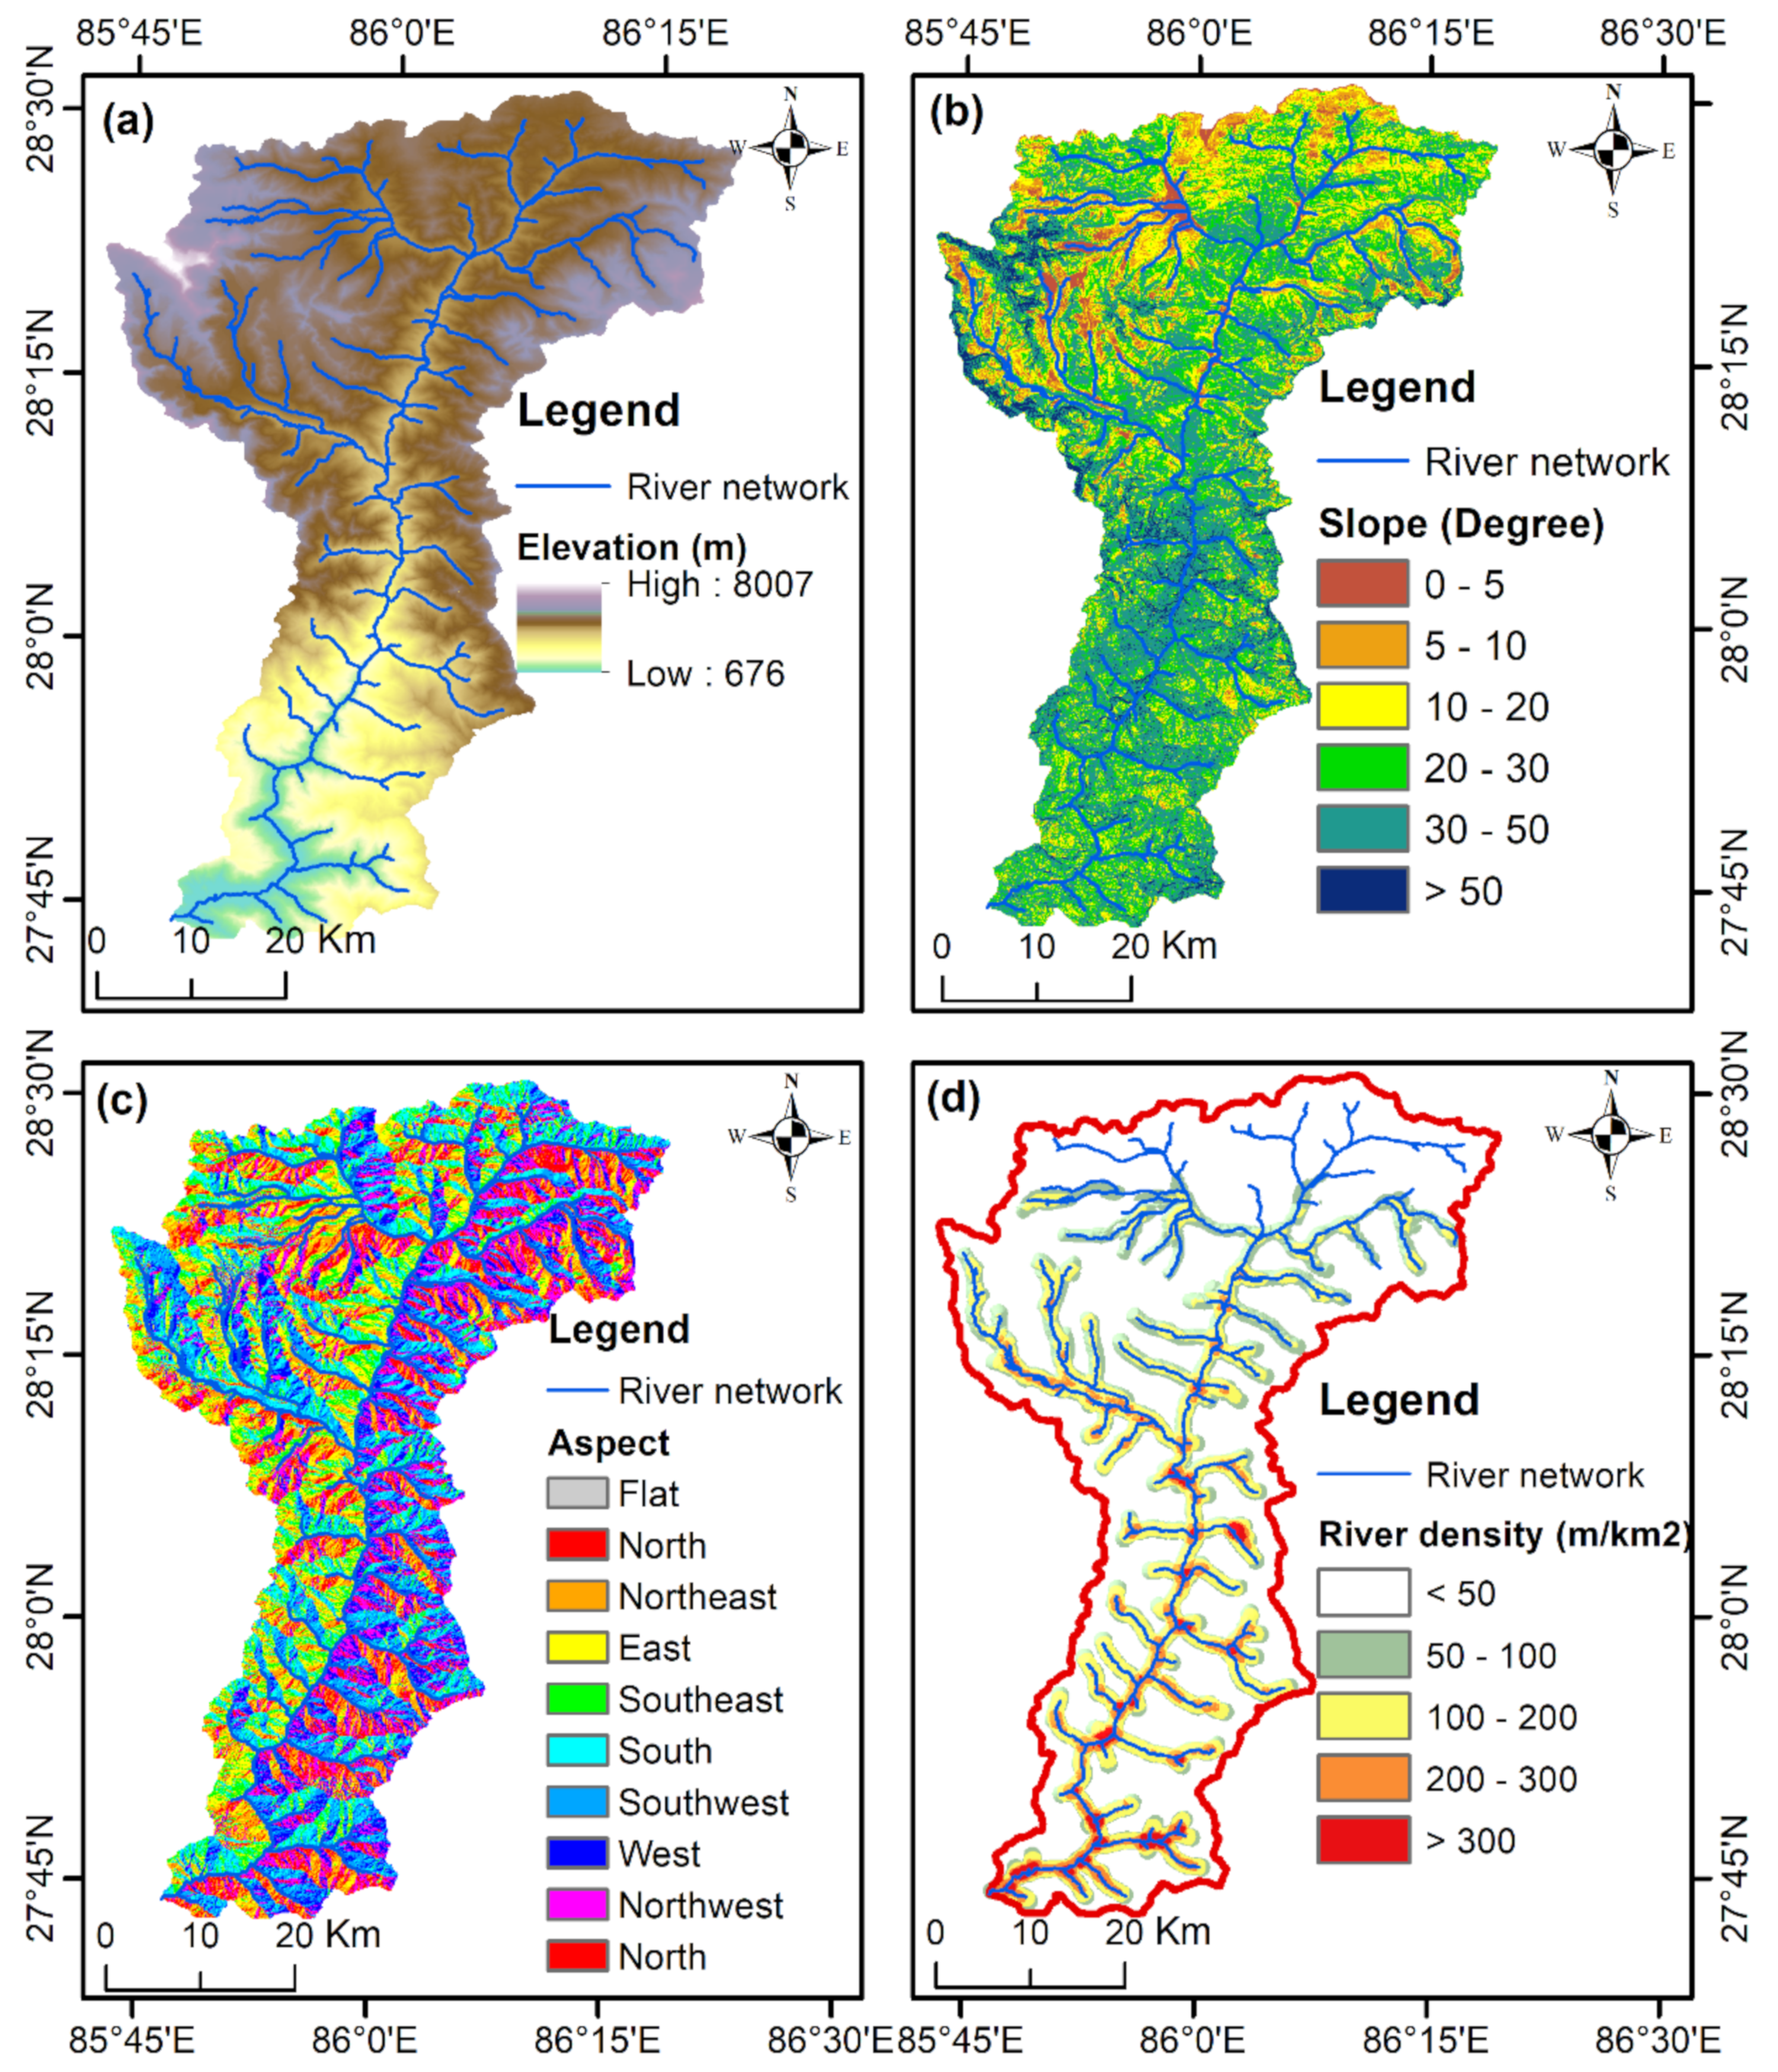
3.1. Topographical Characterization
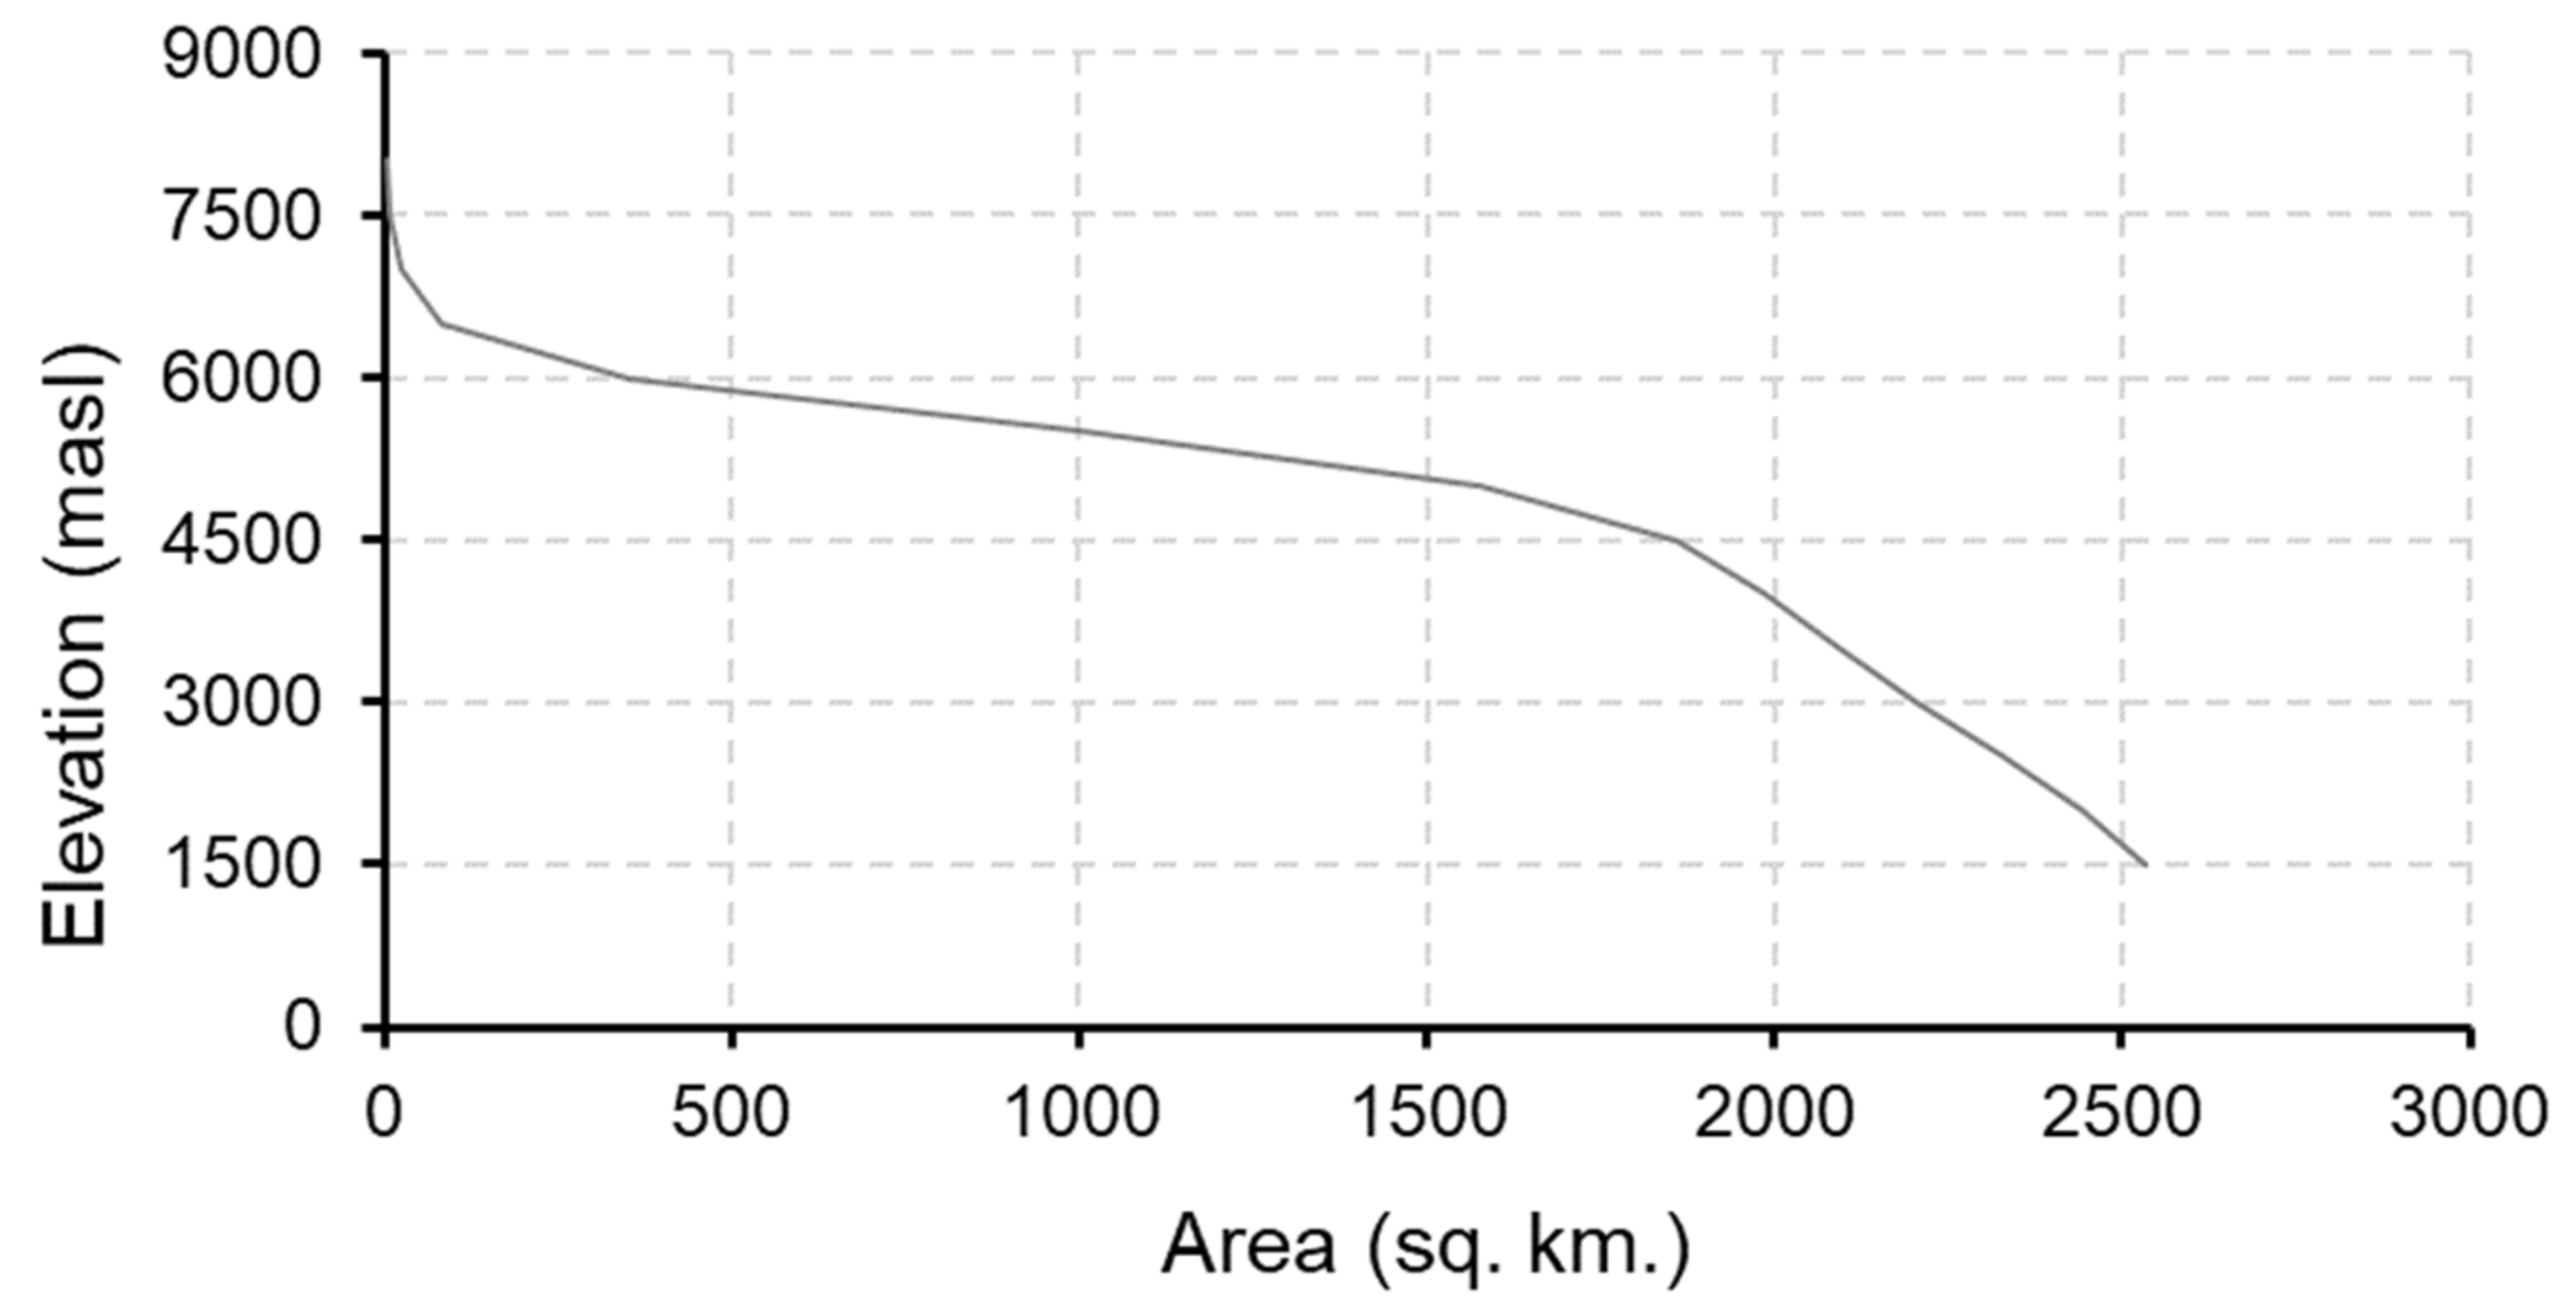
3.1.1. Elevation
3.1.2. Slope
3.1.3. Aspect
3.1.4. River density
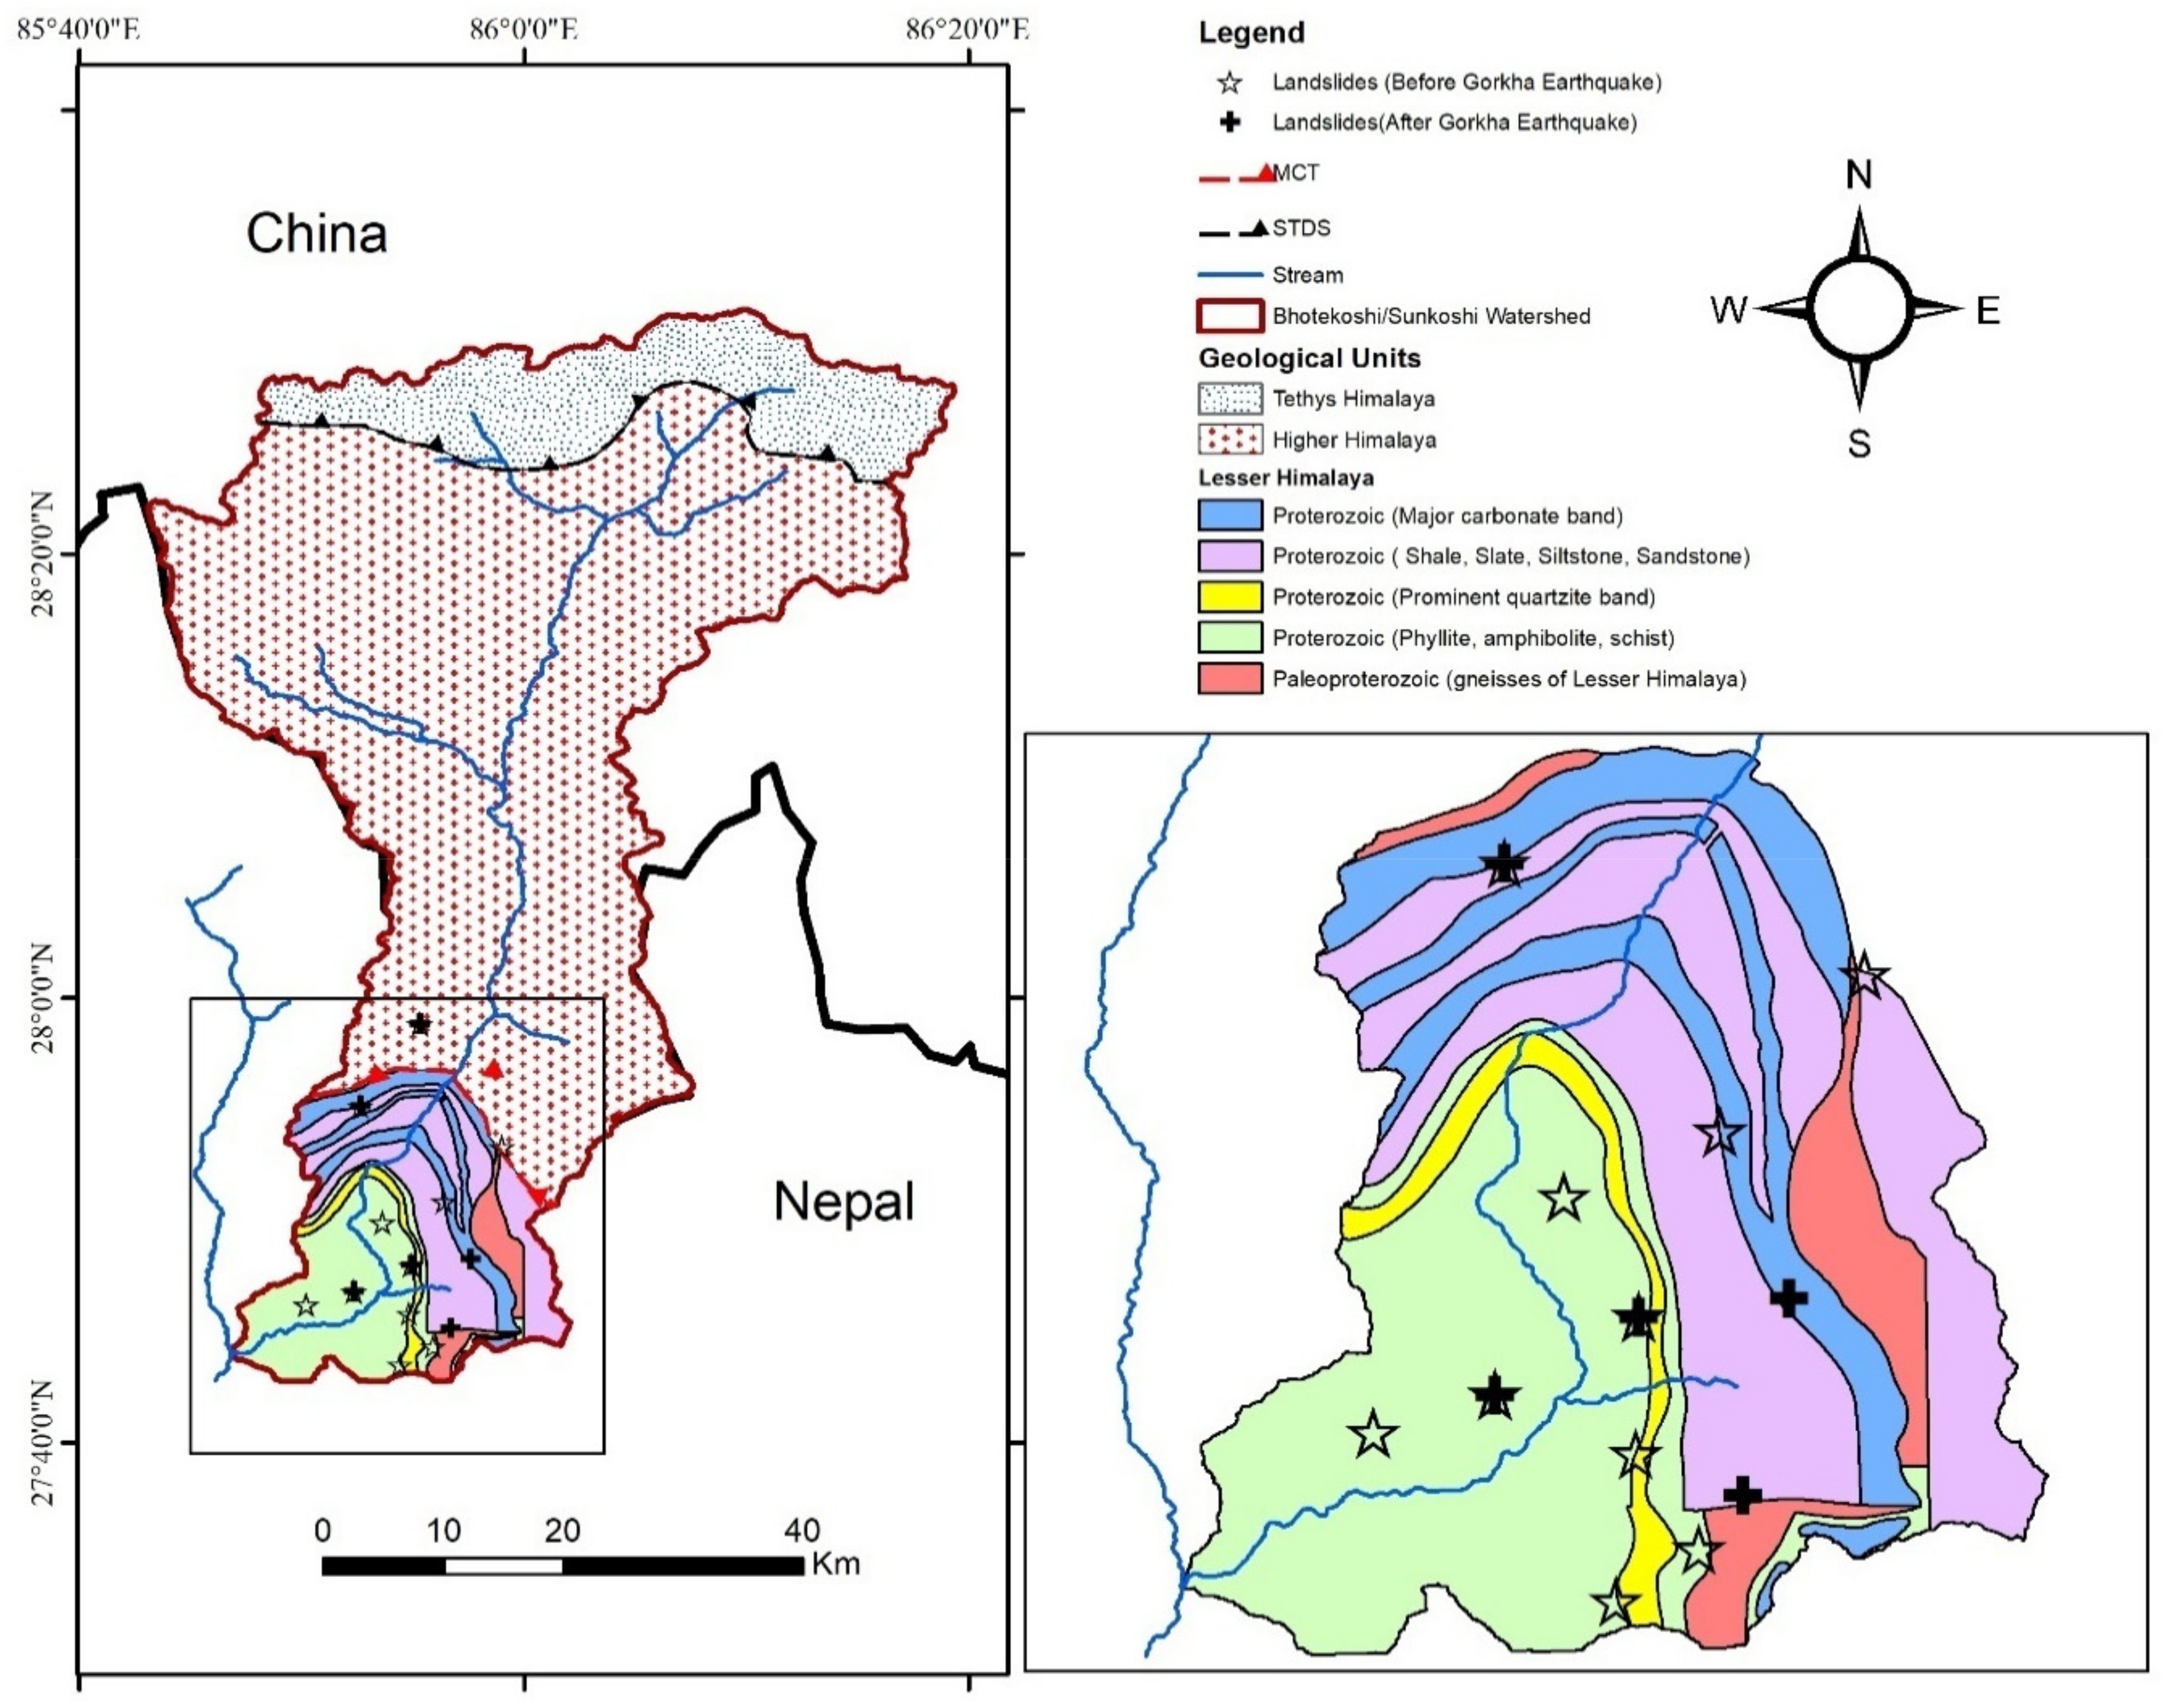
3.2. Geological Characterization
3.3. Hydrometeorological Characterization
3.4. Glacial Lakes Characterization
3.5. SocioEconomic Characterization
3.6. Data and Sources
4. Multihazard Susceptibility in Bhotekoshi–Sunkoshi Watershed
4.1. Topographical Aspects of Multihazards
4.2. Geological Aspects of Multihazards
4.2.1. Geological Setting
4.2.2. Geostructure and Lithology
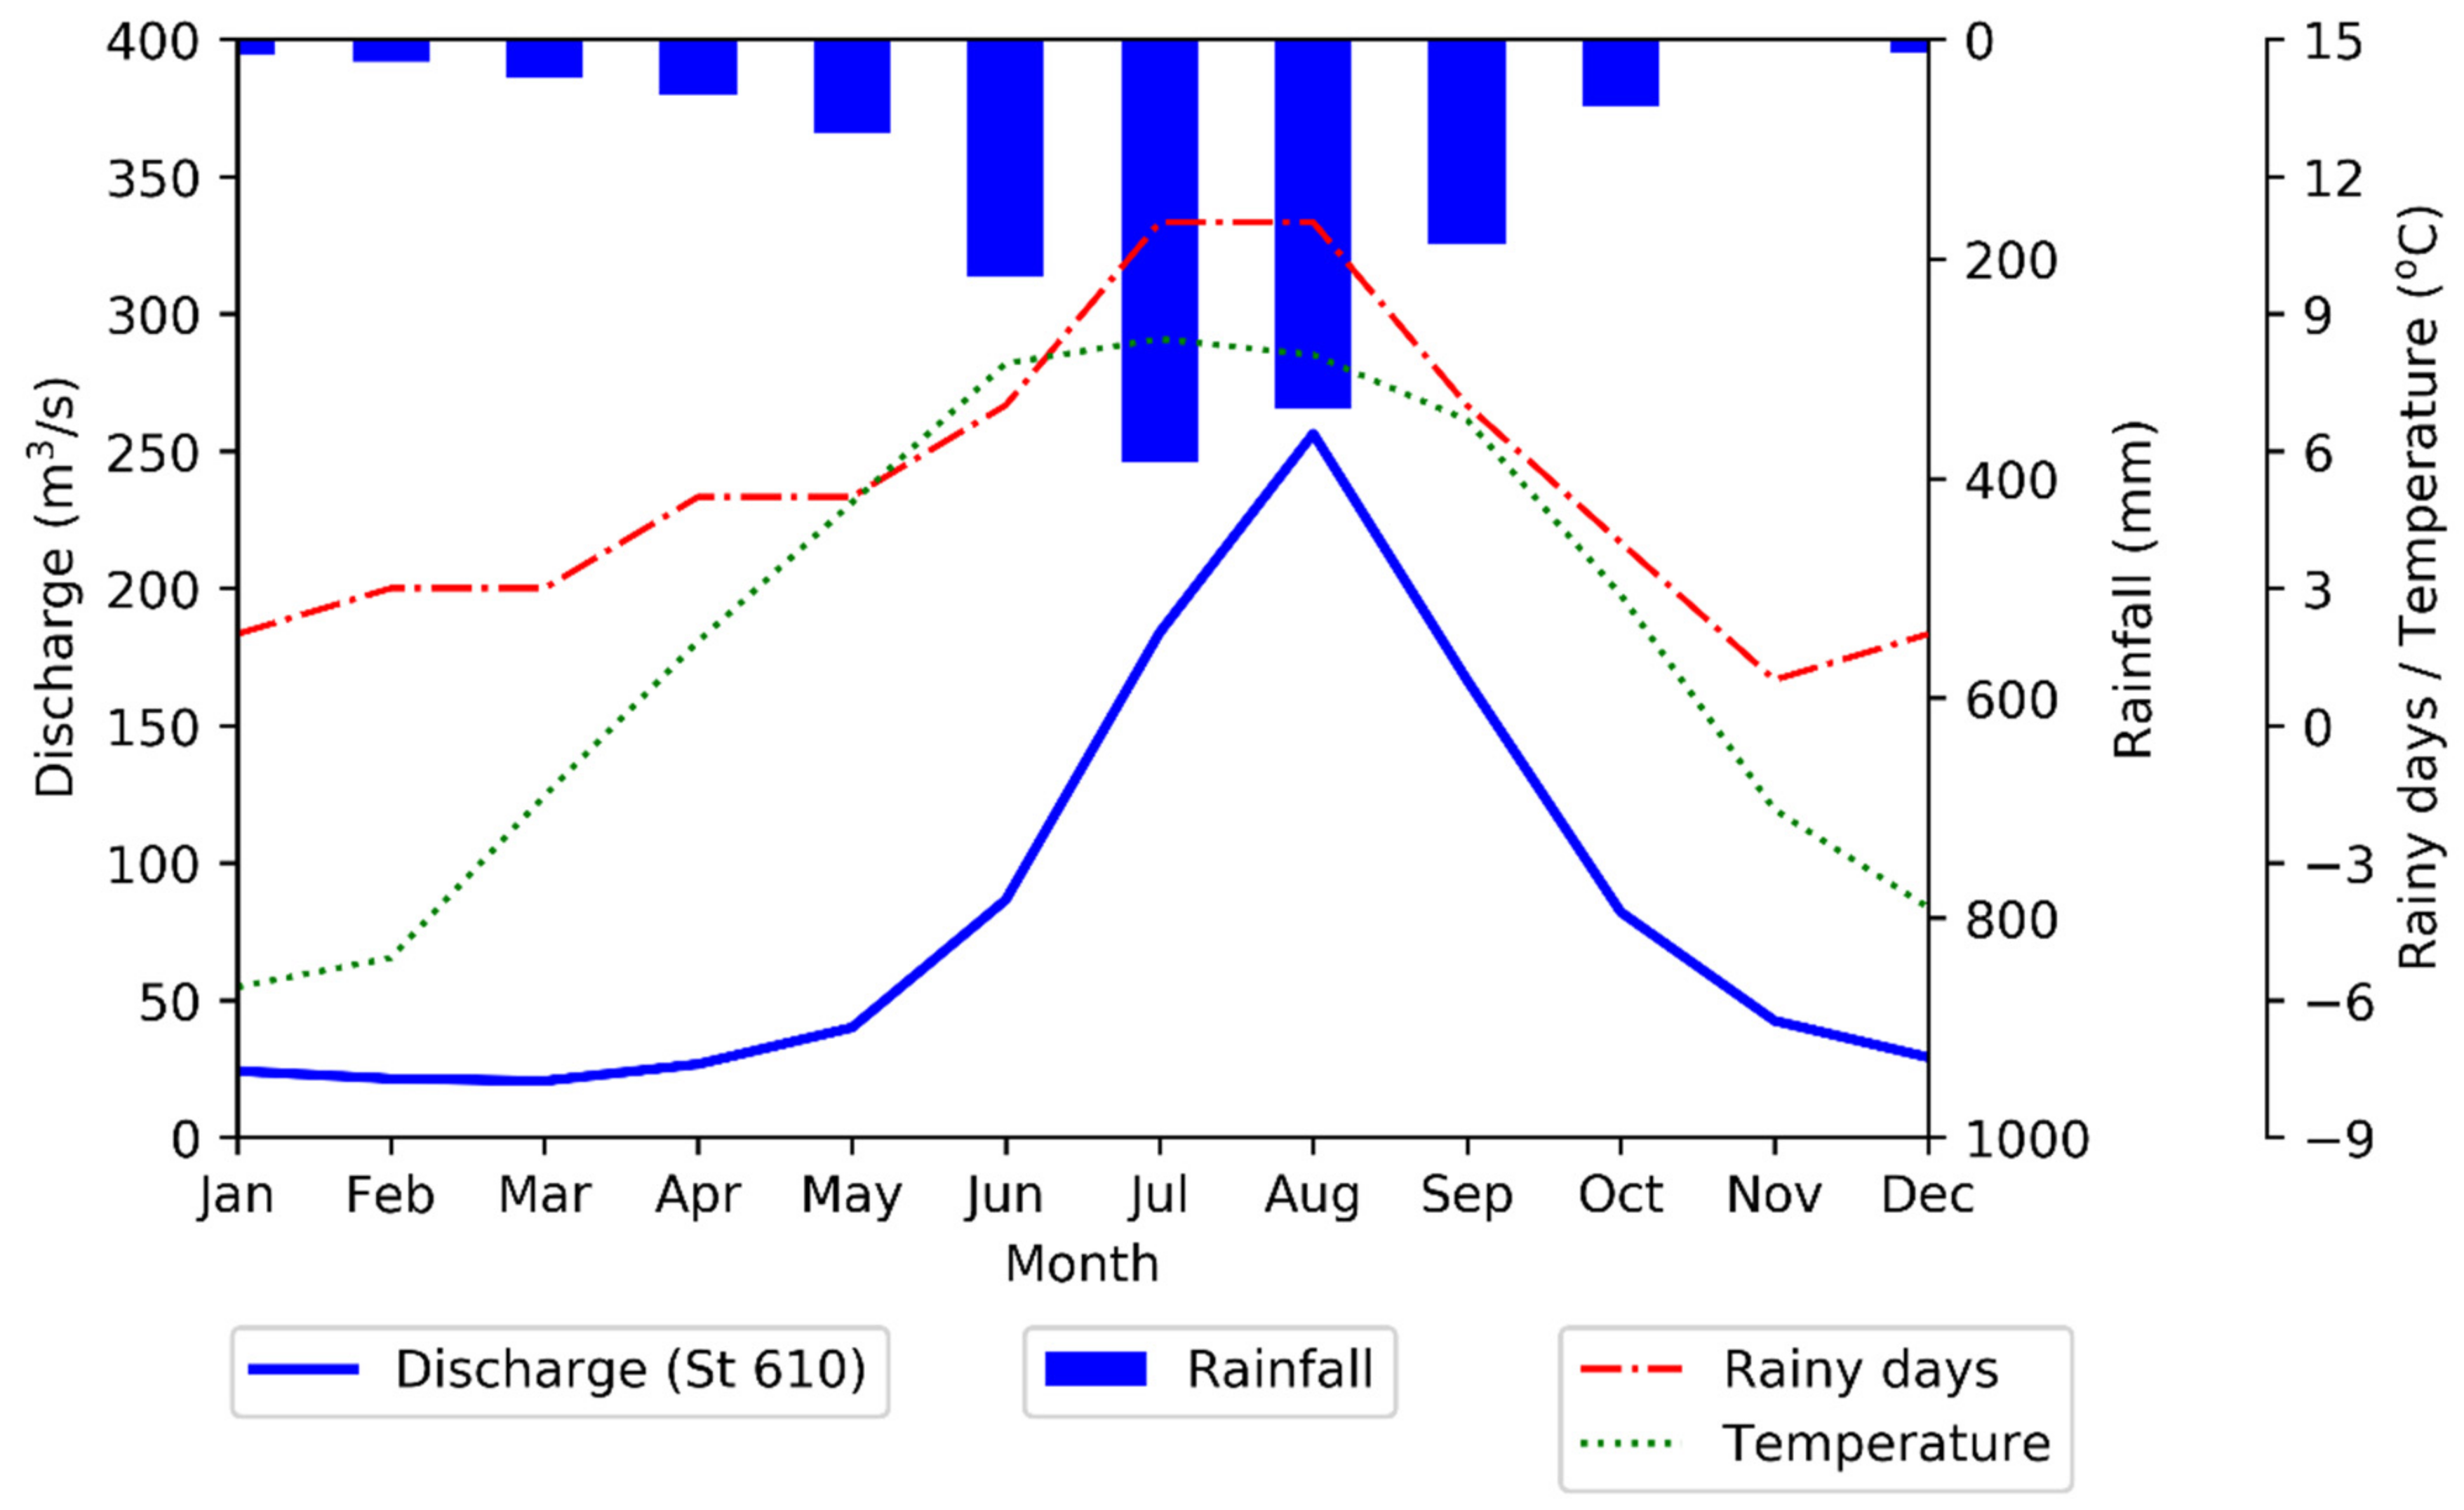
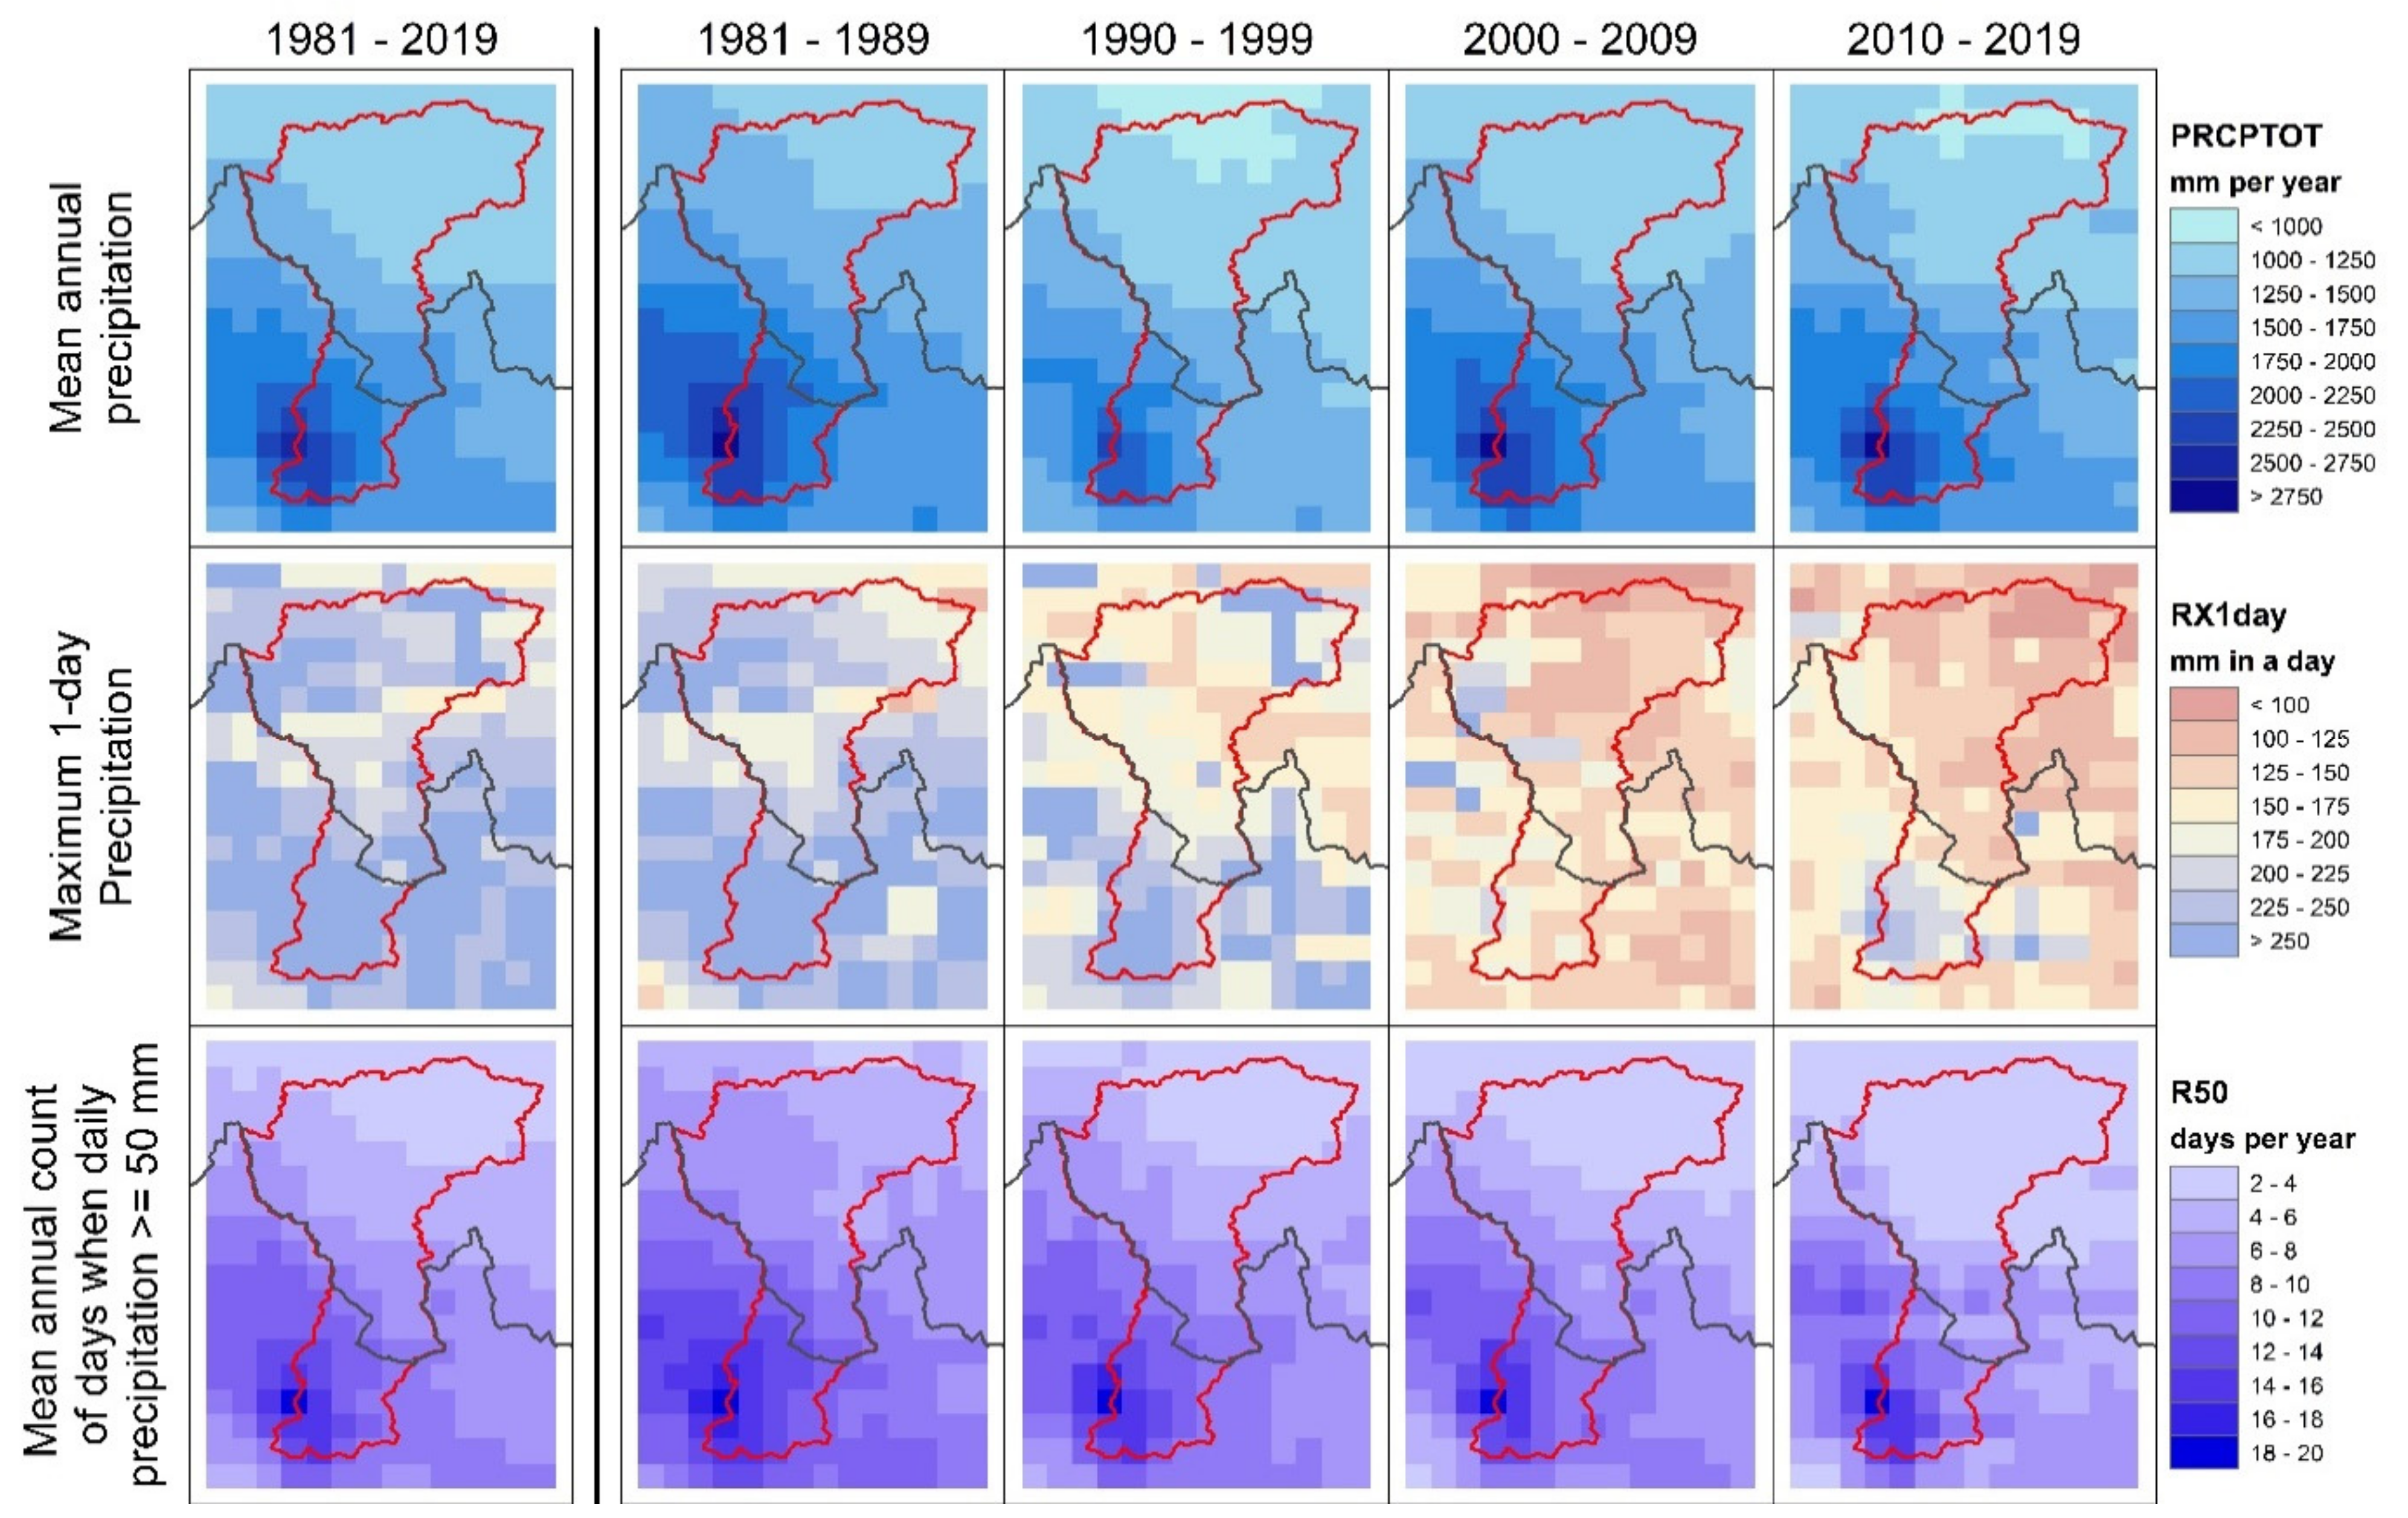
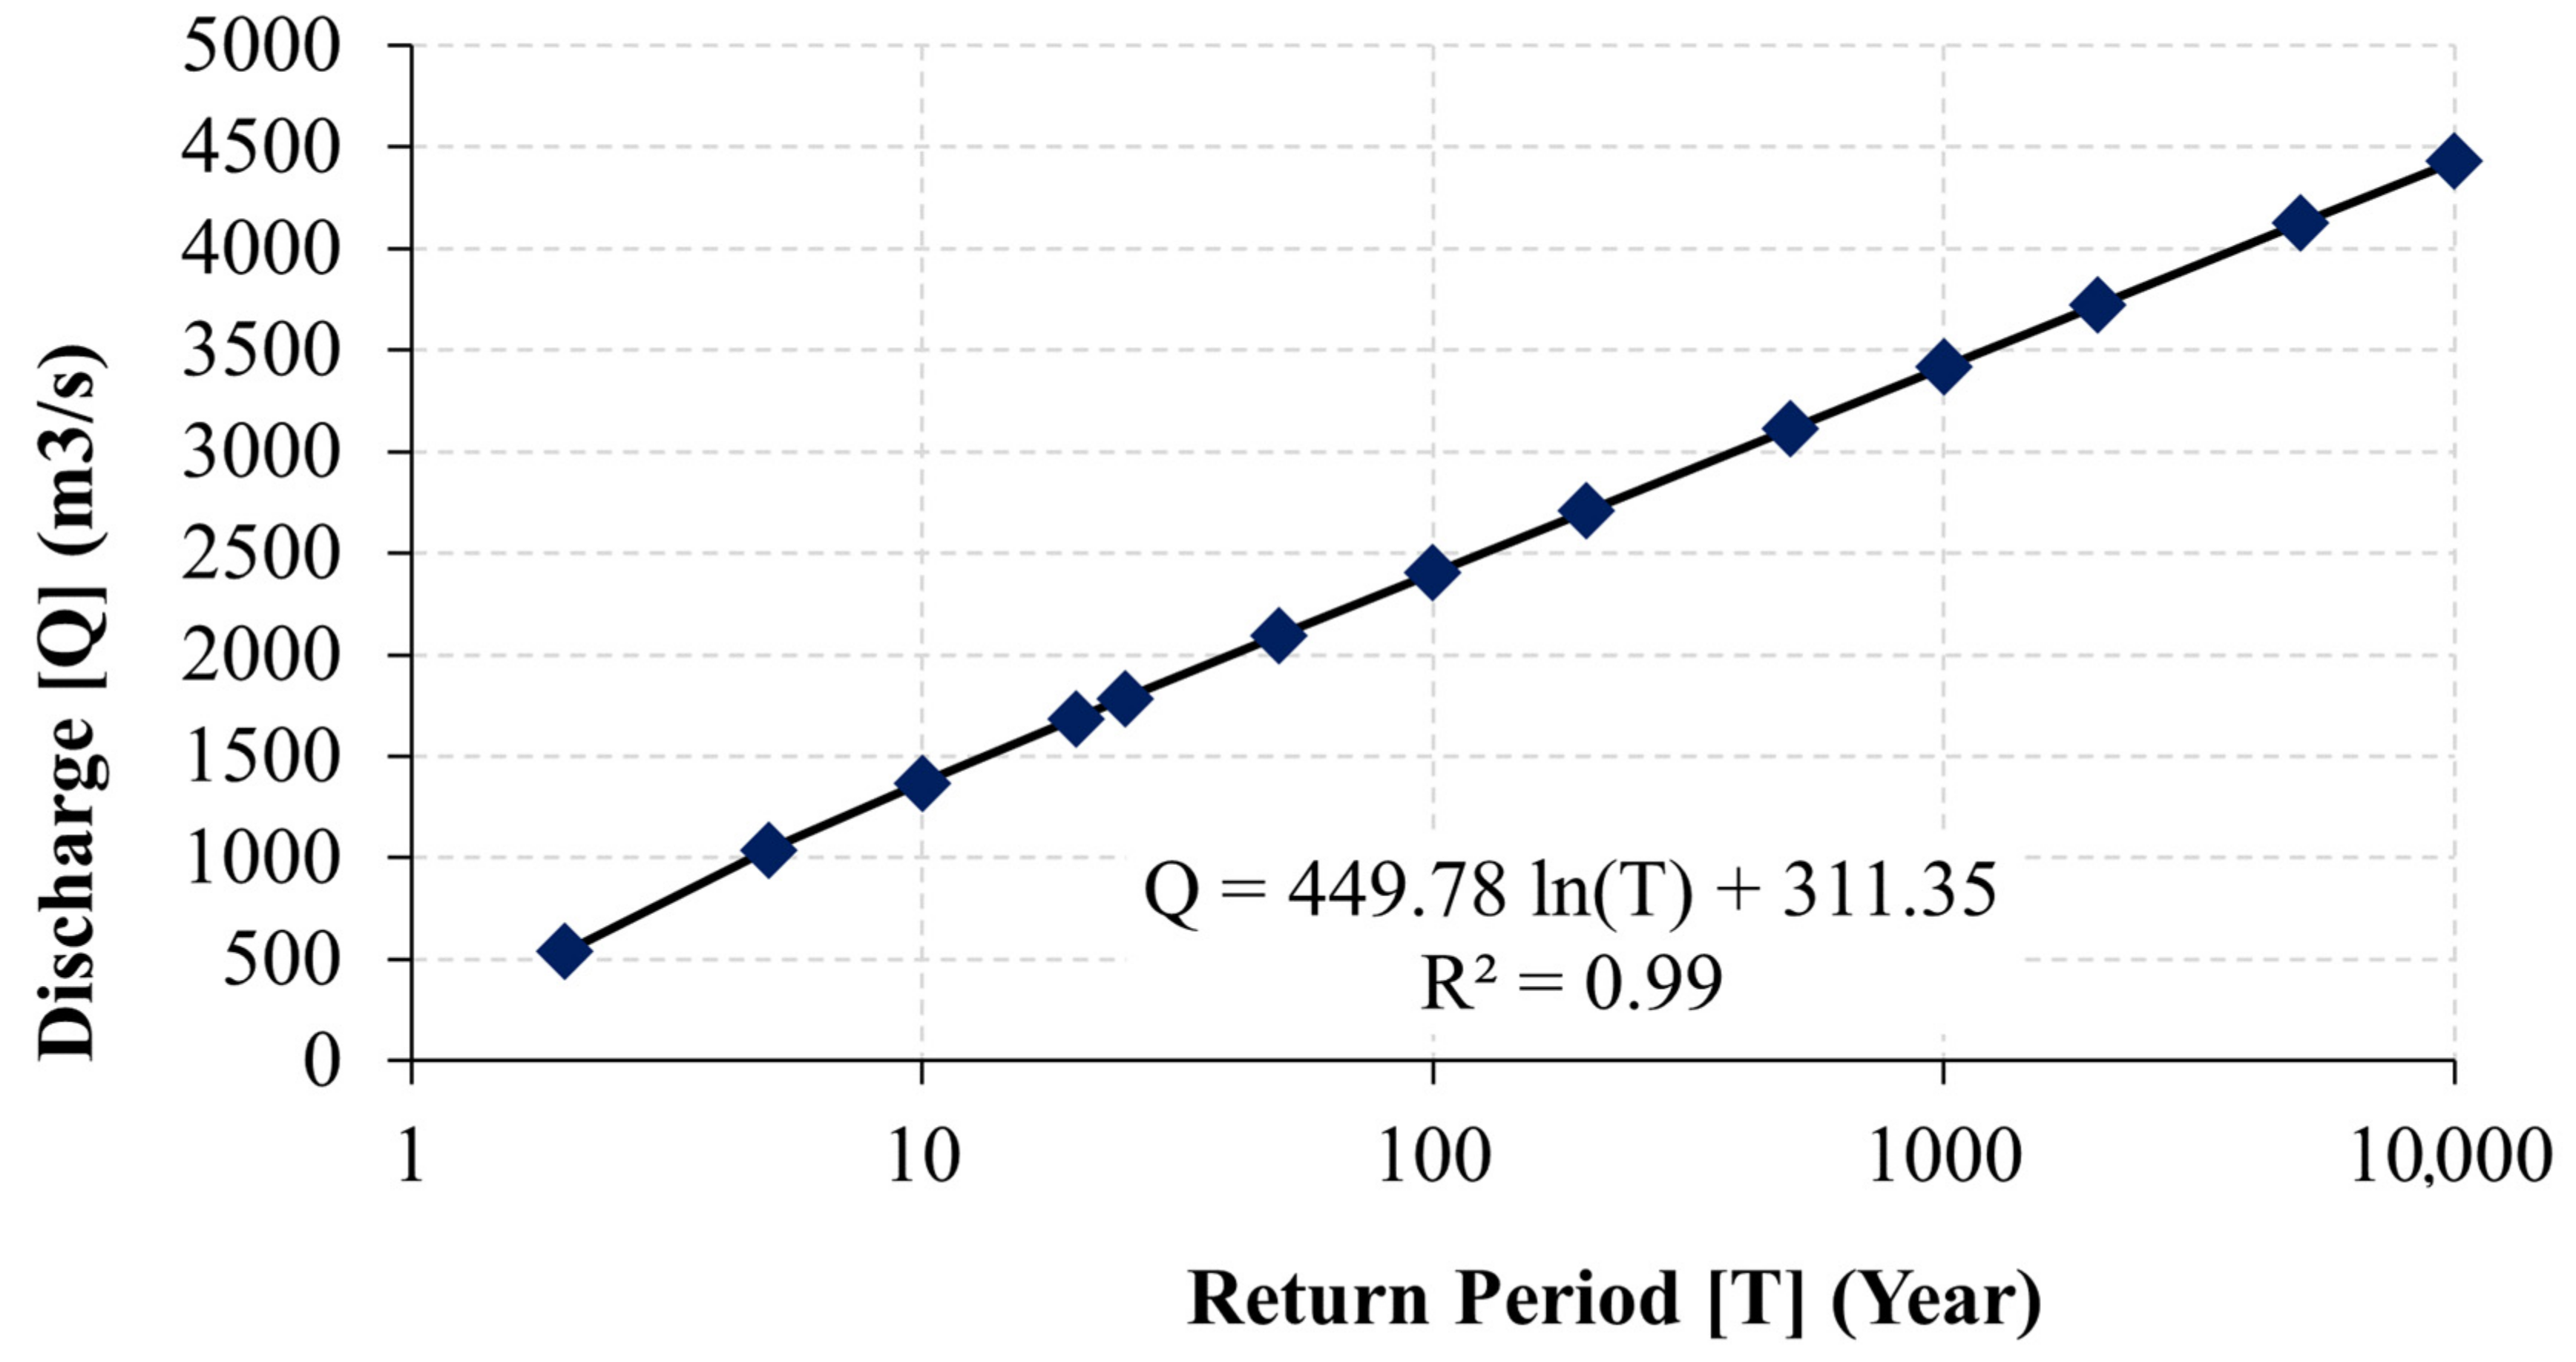
4.3. Hydrometeorological Aspects of Multihazard
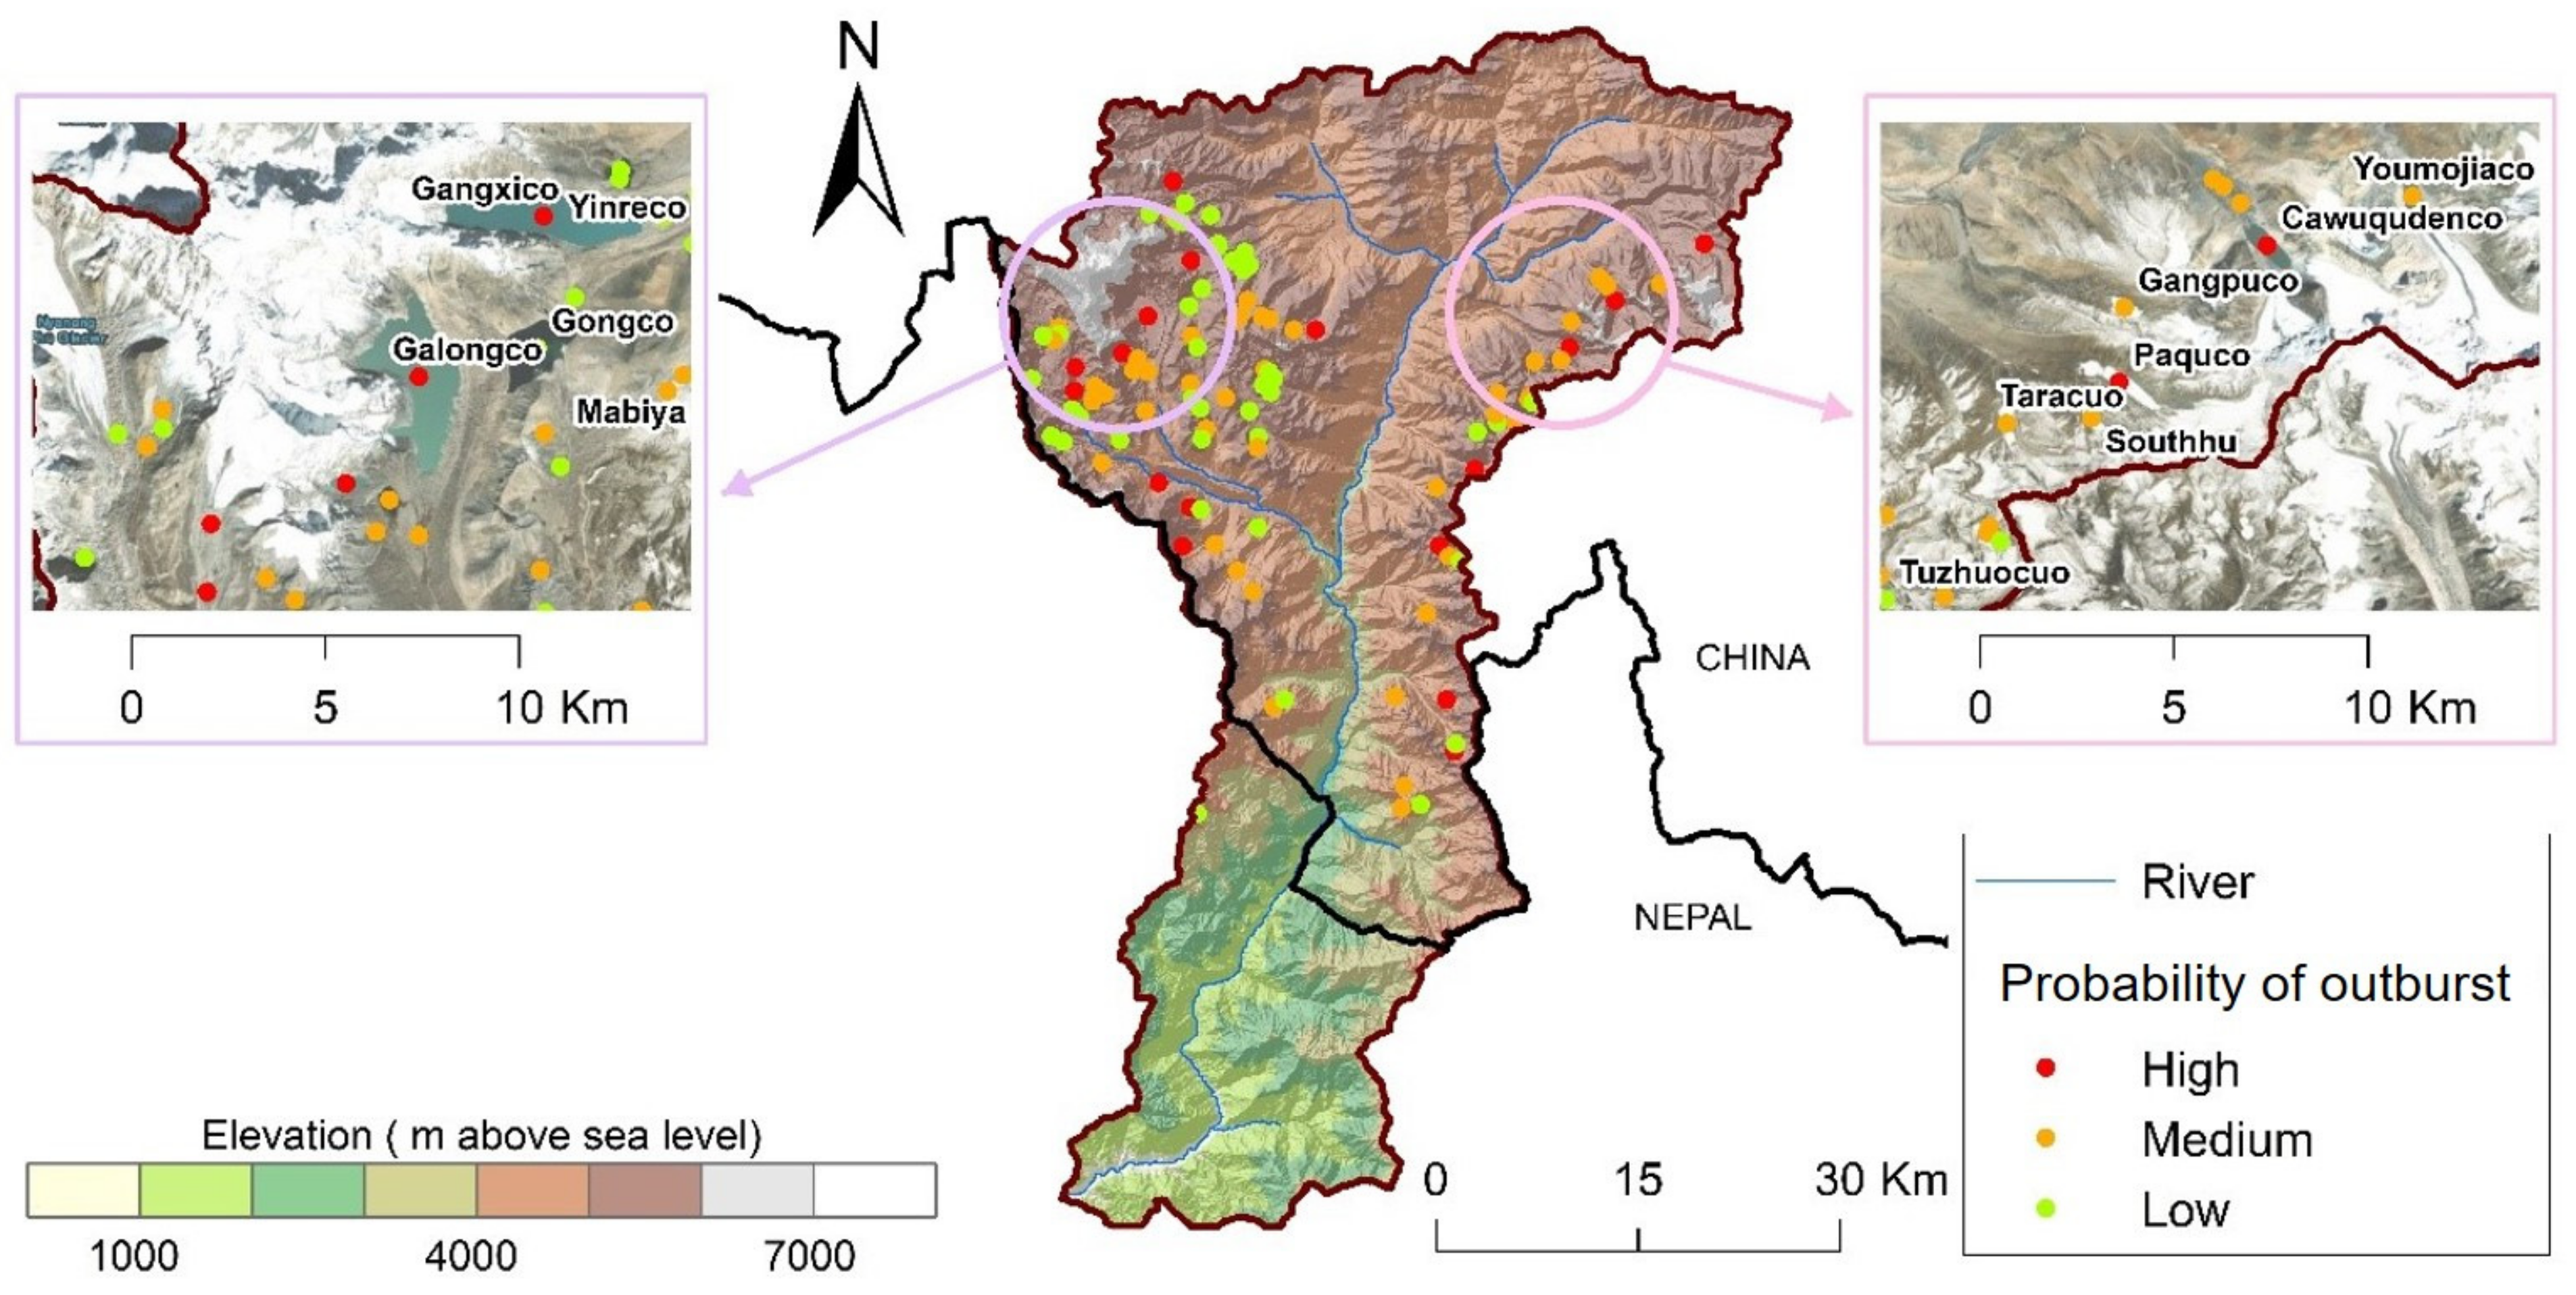
4.4. Glacial Lakes—Presence and Vulnerability
4.5. Socioeconomic Setting and Multihazard Dynamics
5. Case Study of Selected Hazards
5.1. Glacial Lake Outburst Flood (GLOF)
5.2. Rainfall-Induced Landslides
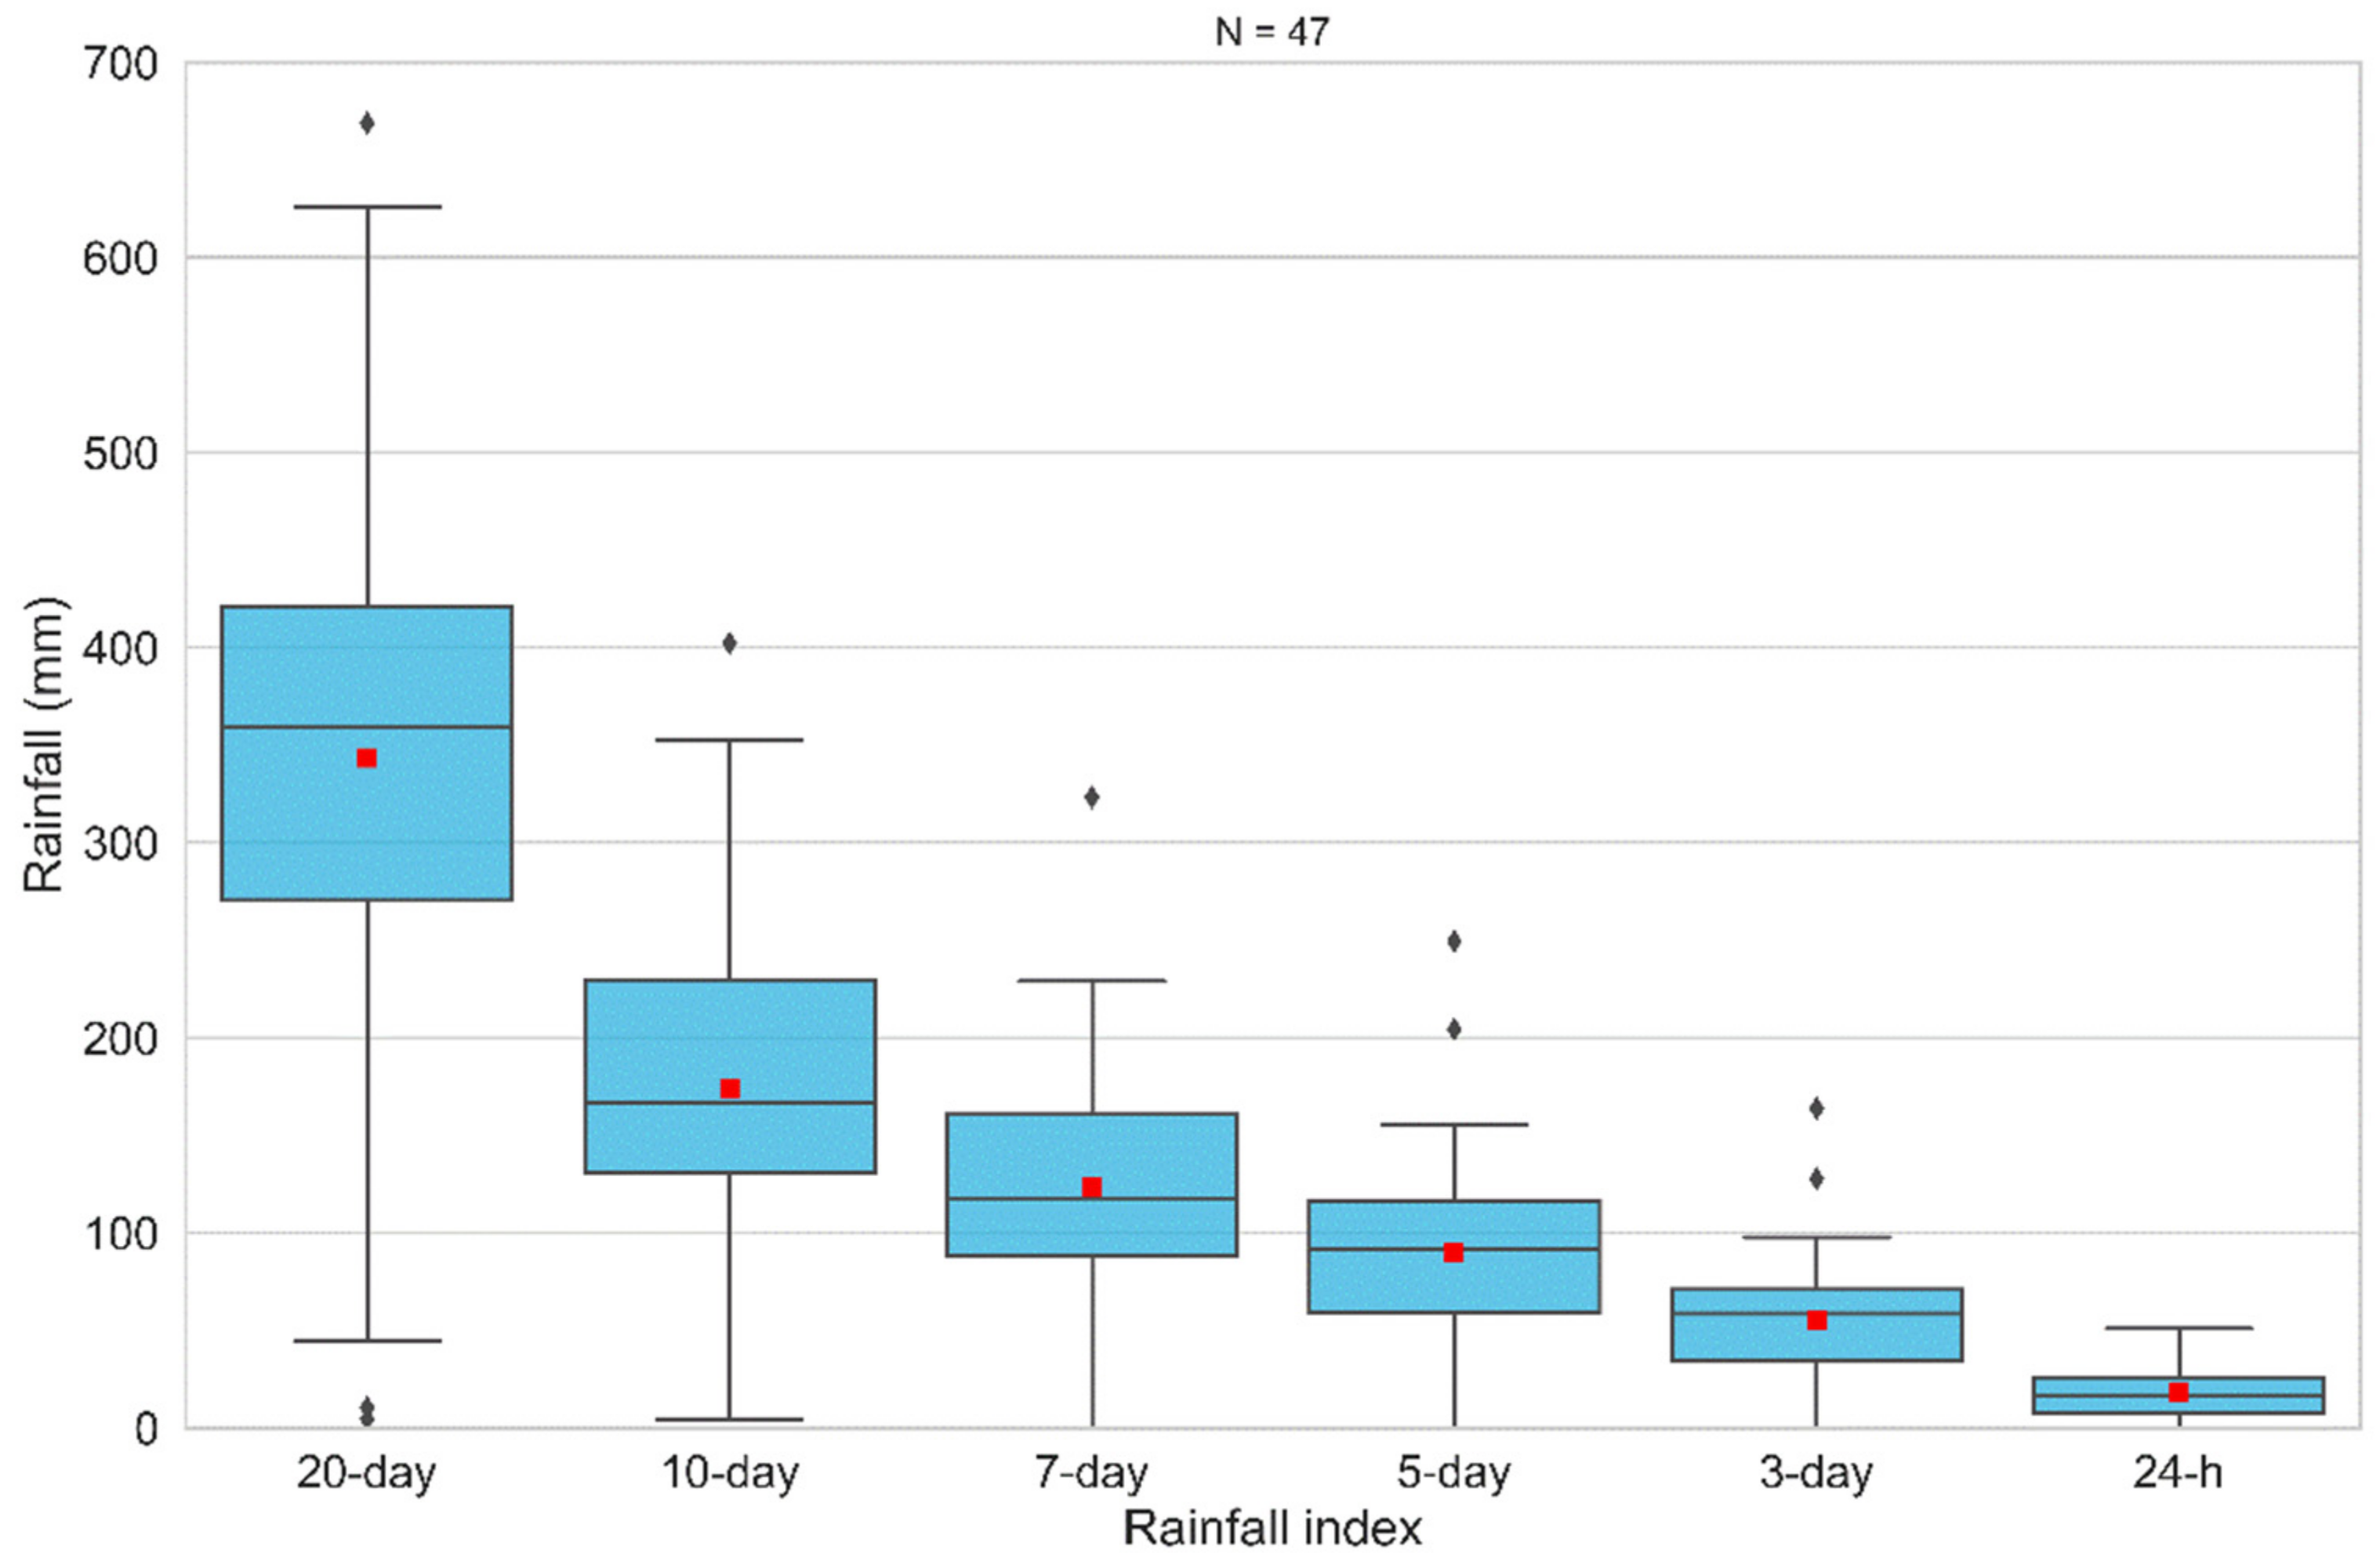
5.2.1. Association of Rainfall Amount and Landslide Occurrence
5.2.2. Jure Landslide (2 August 2014)
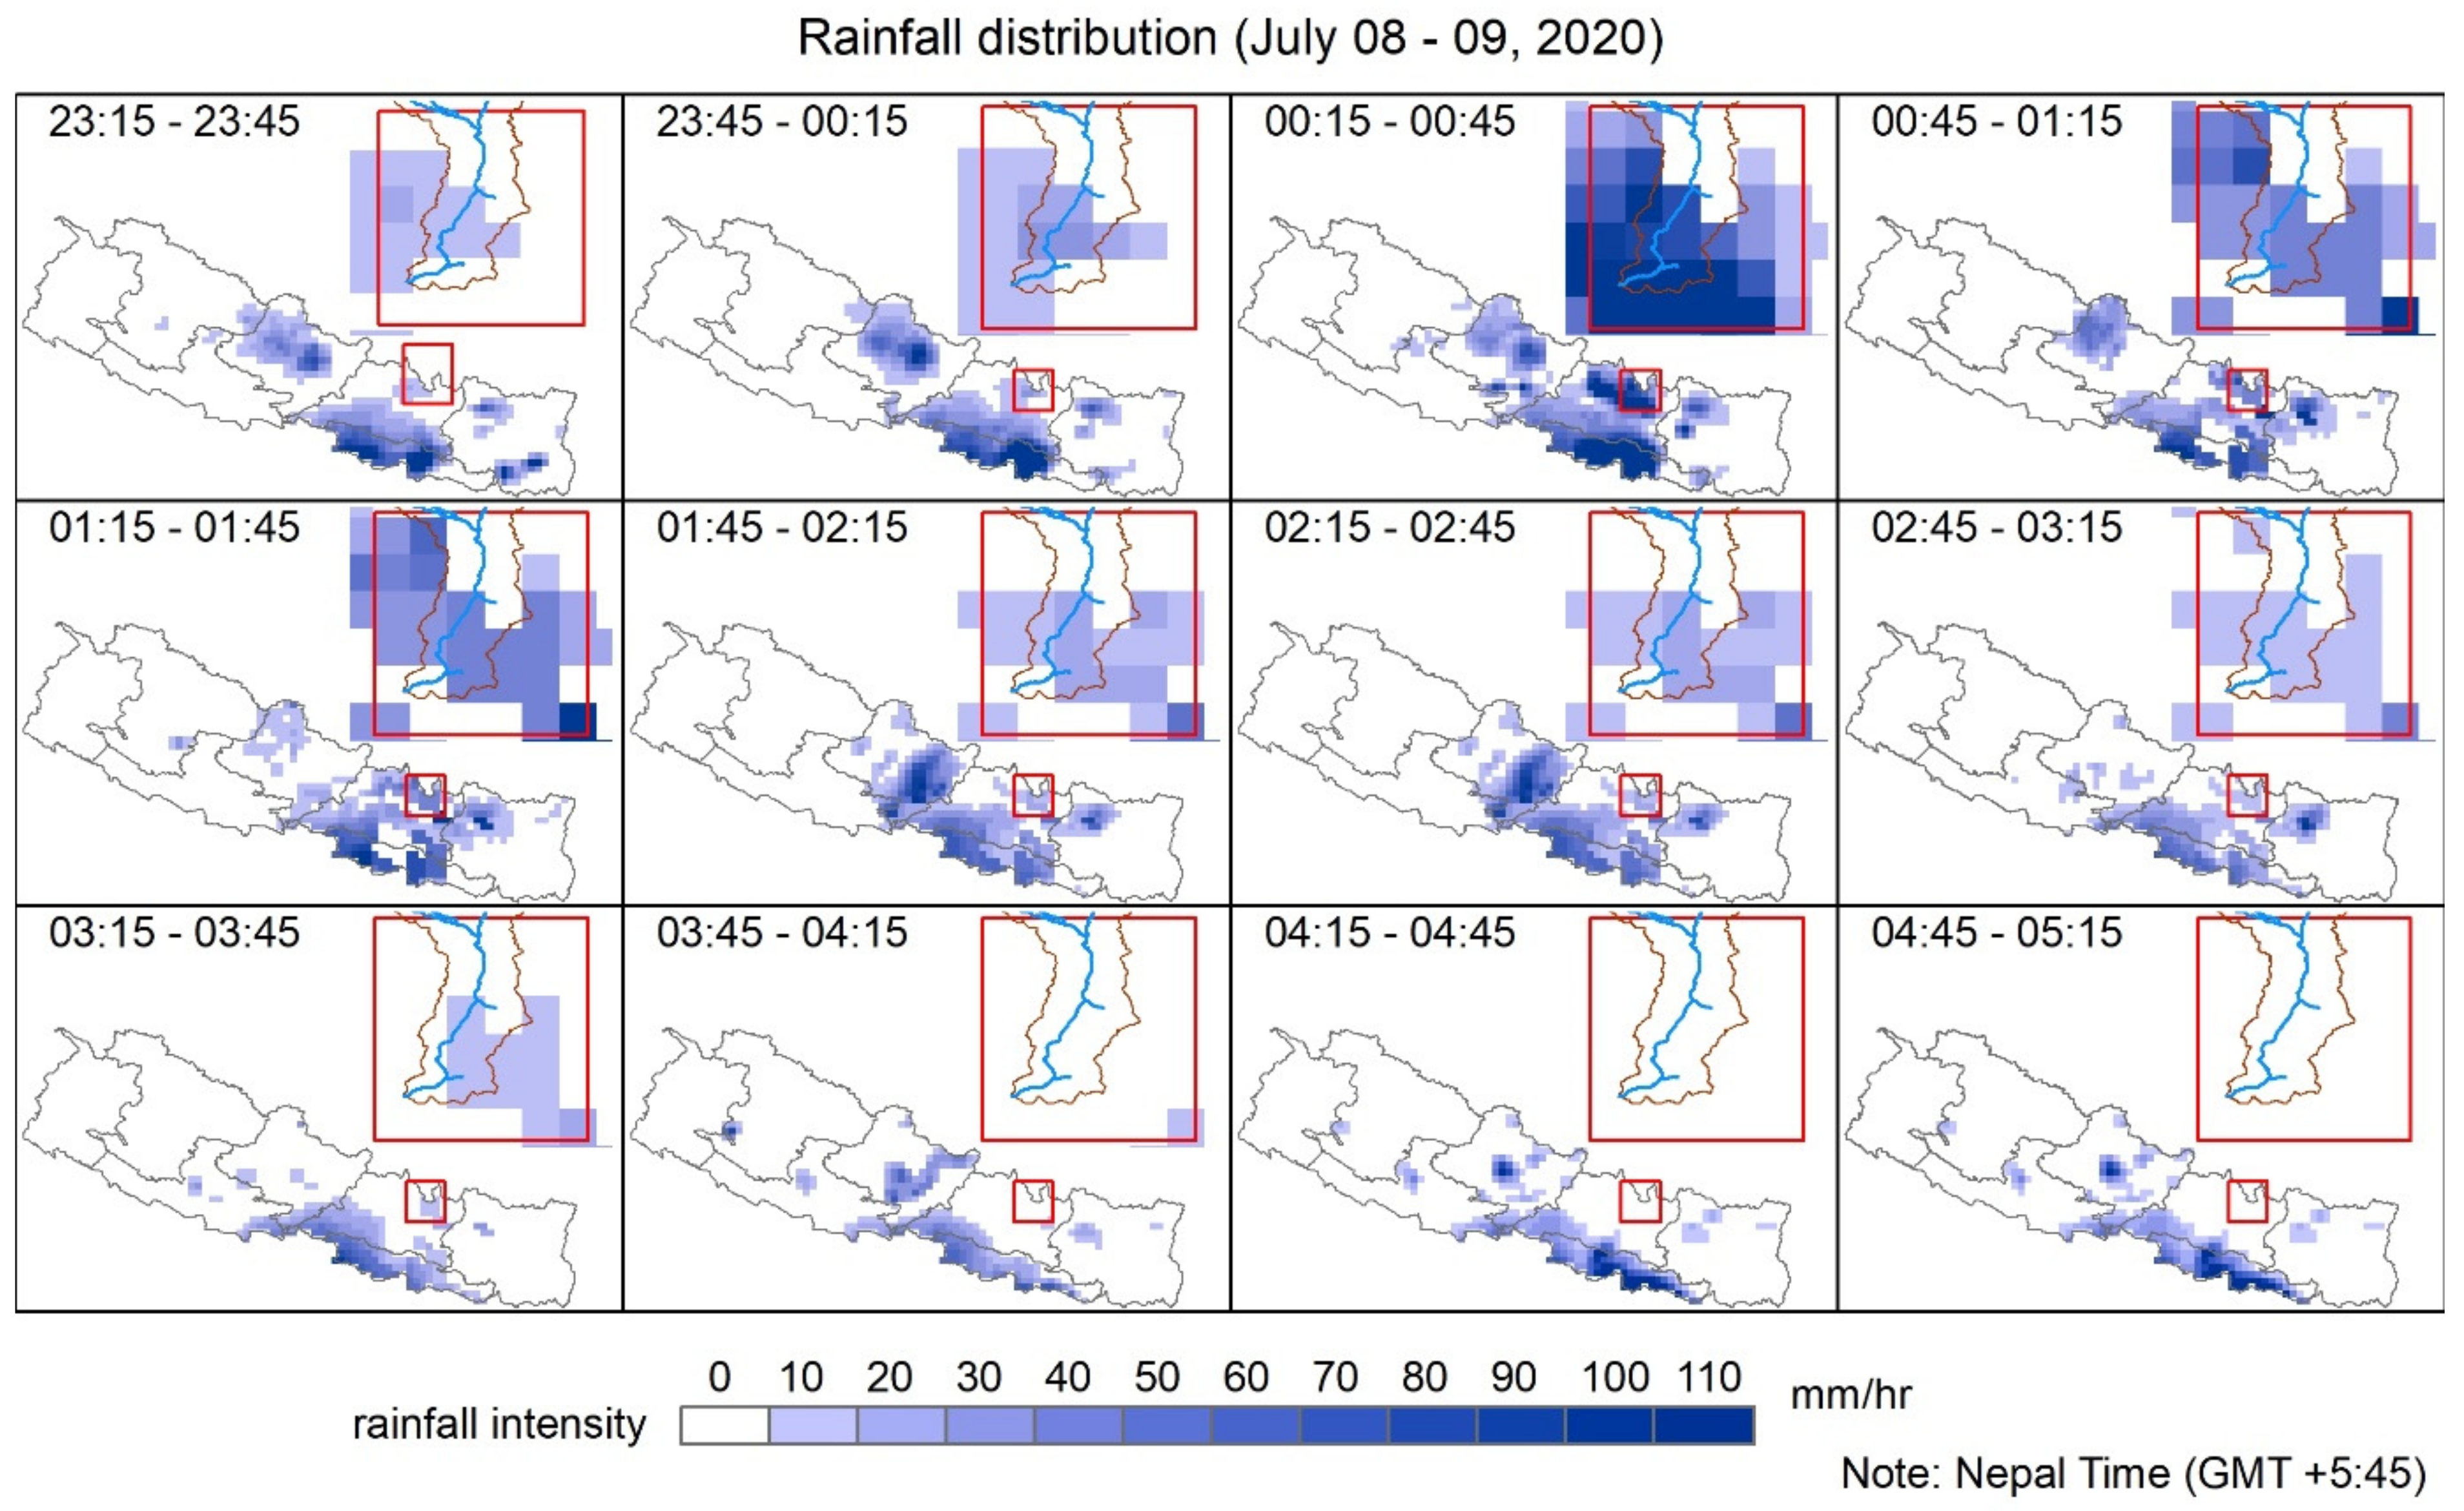
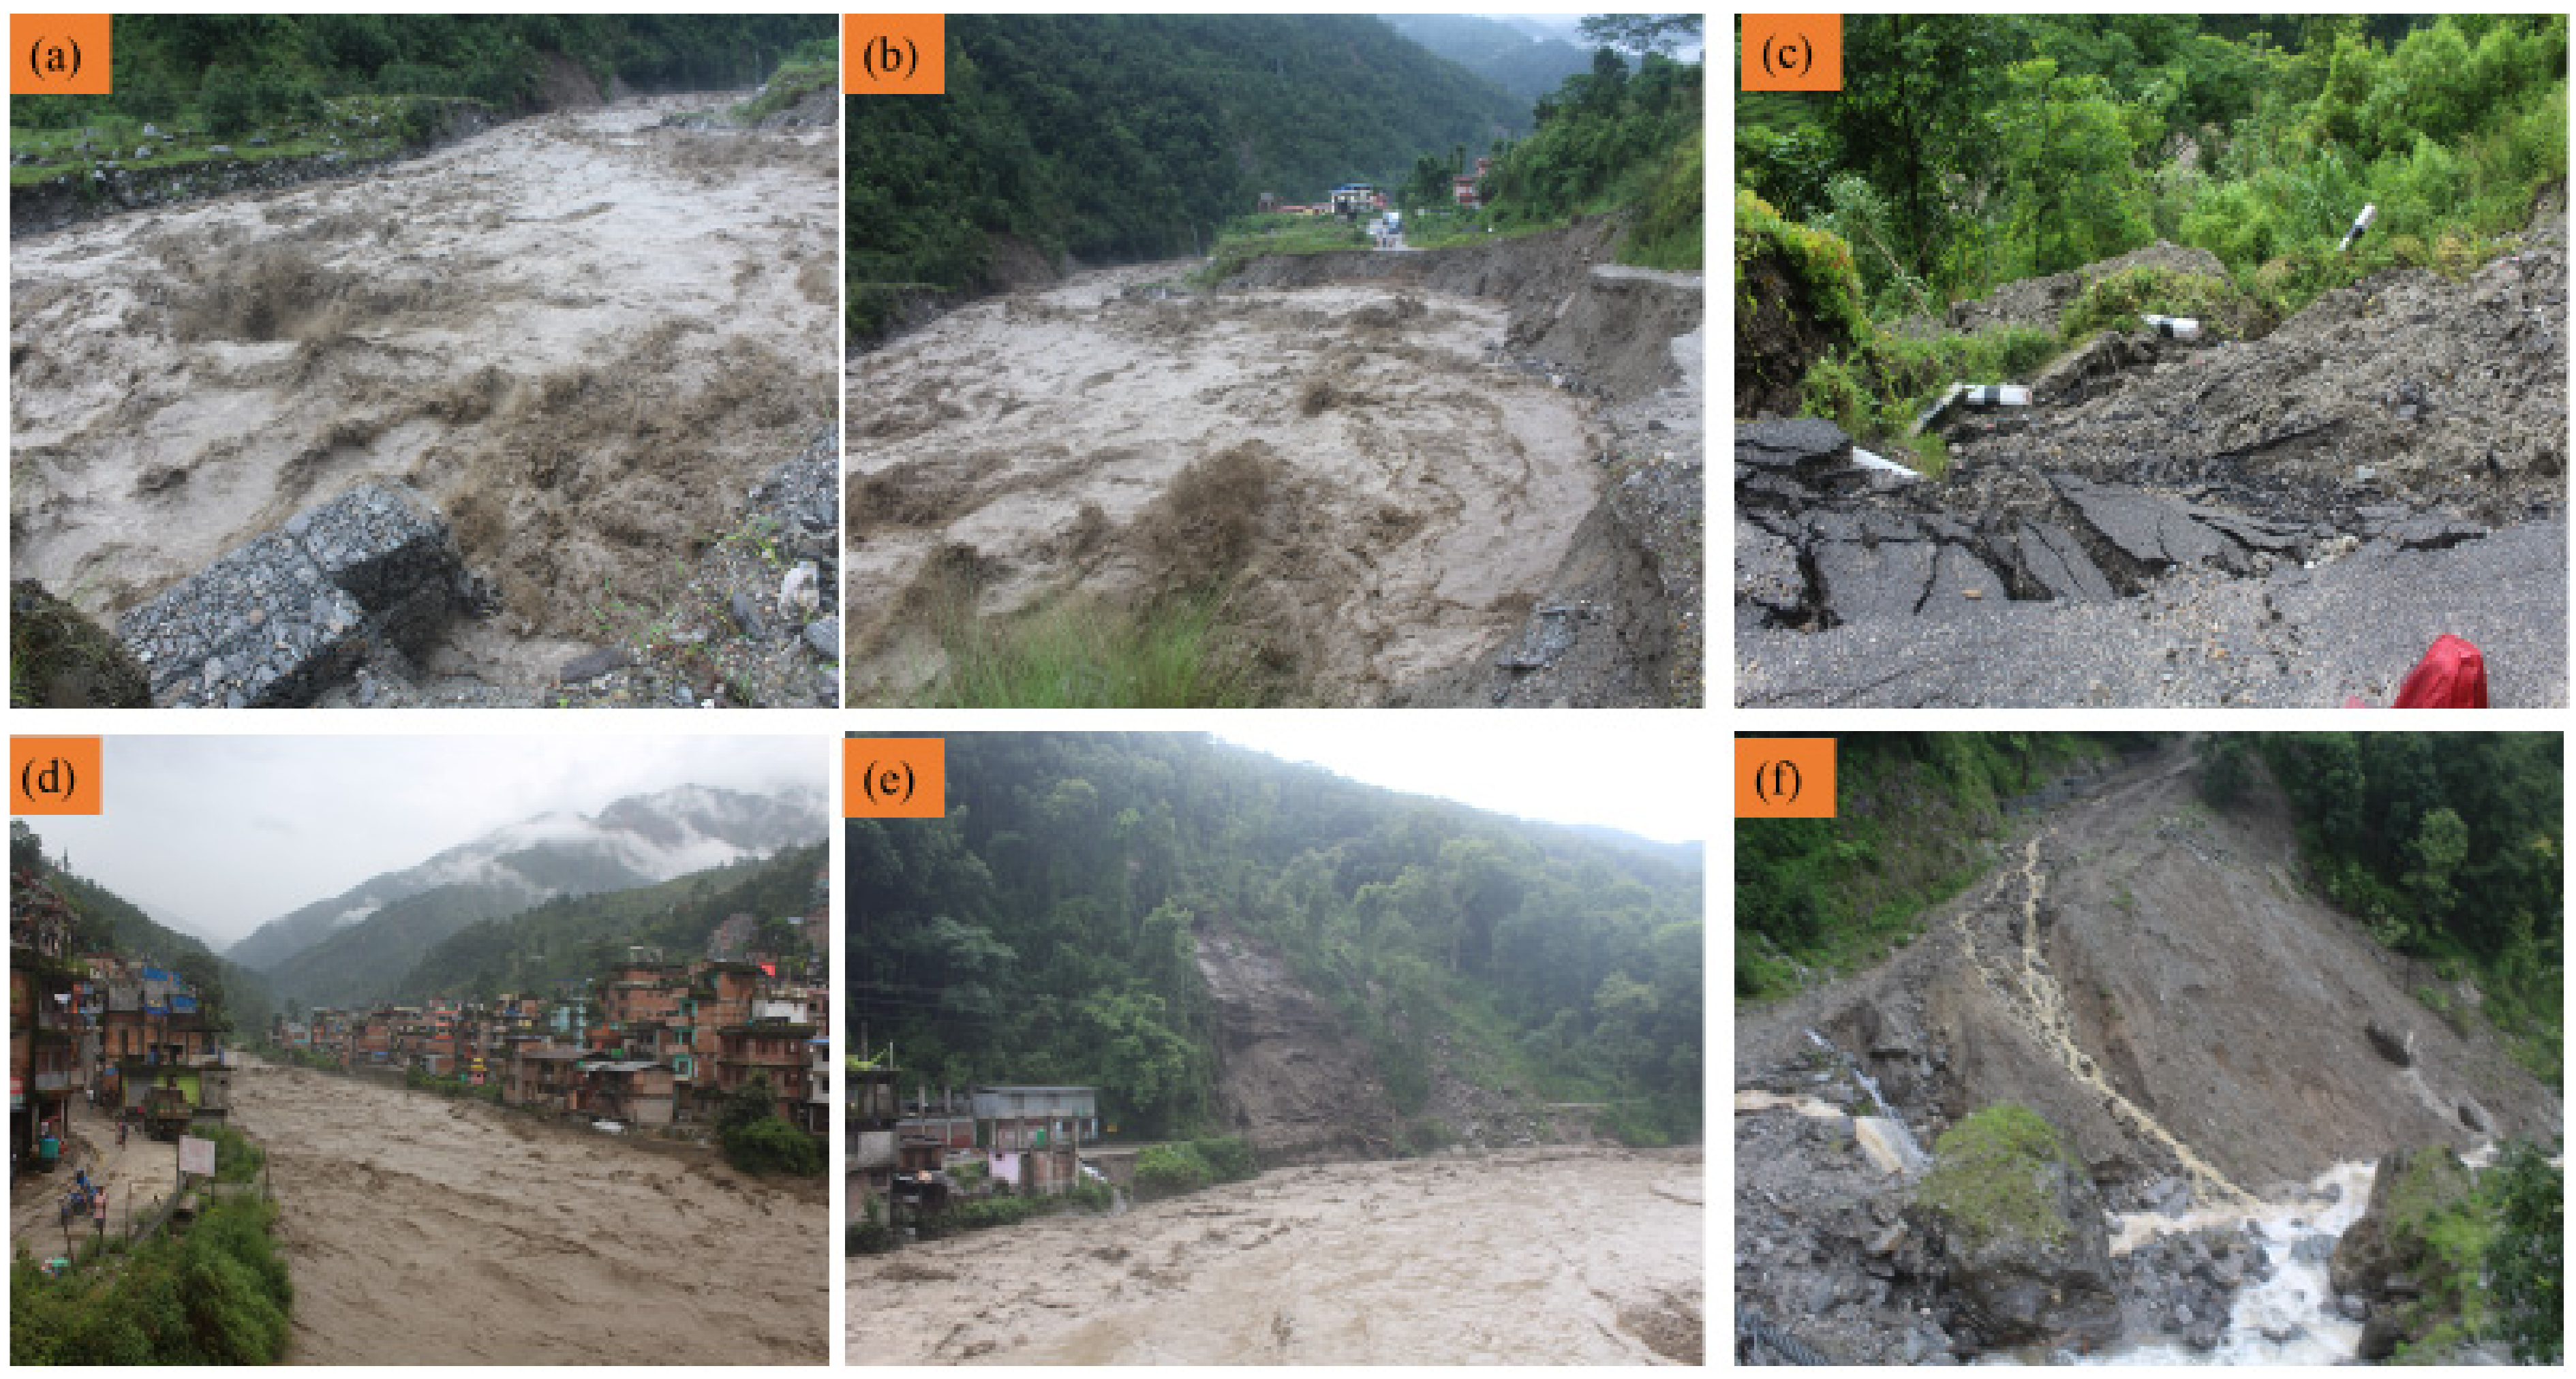
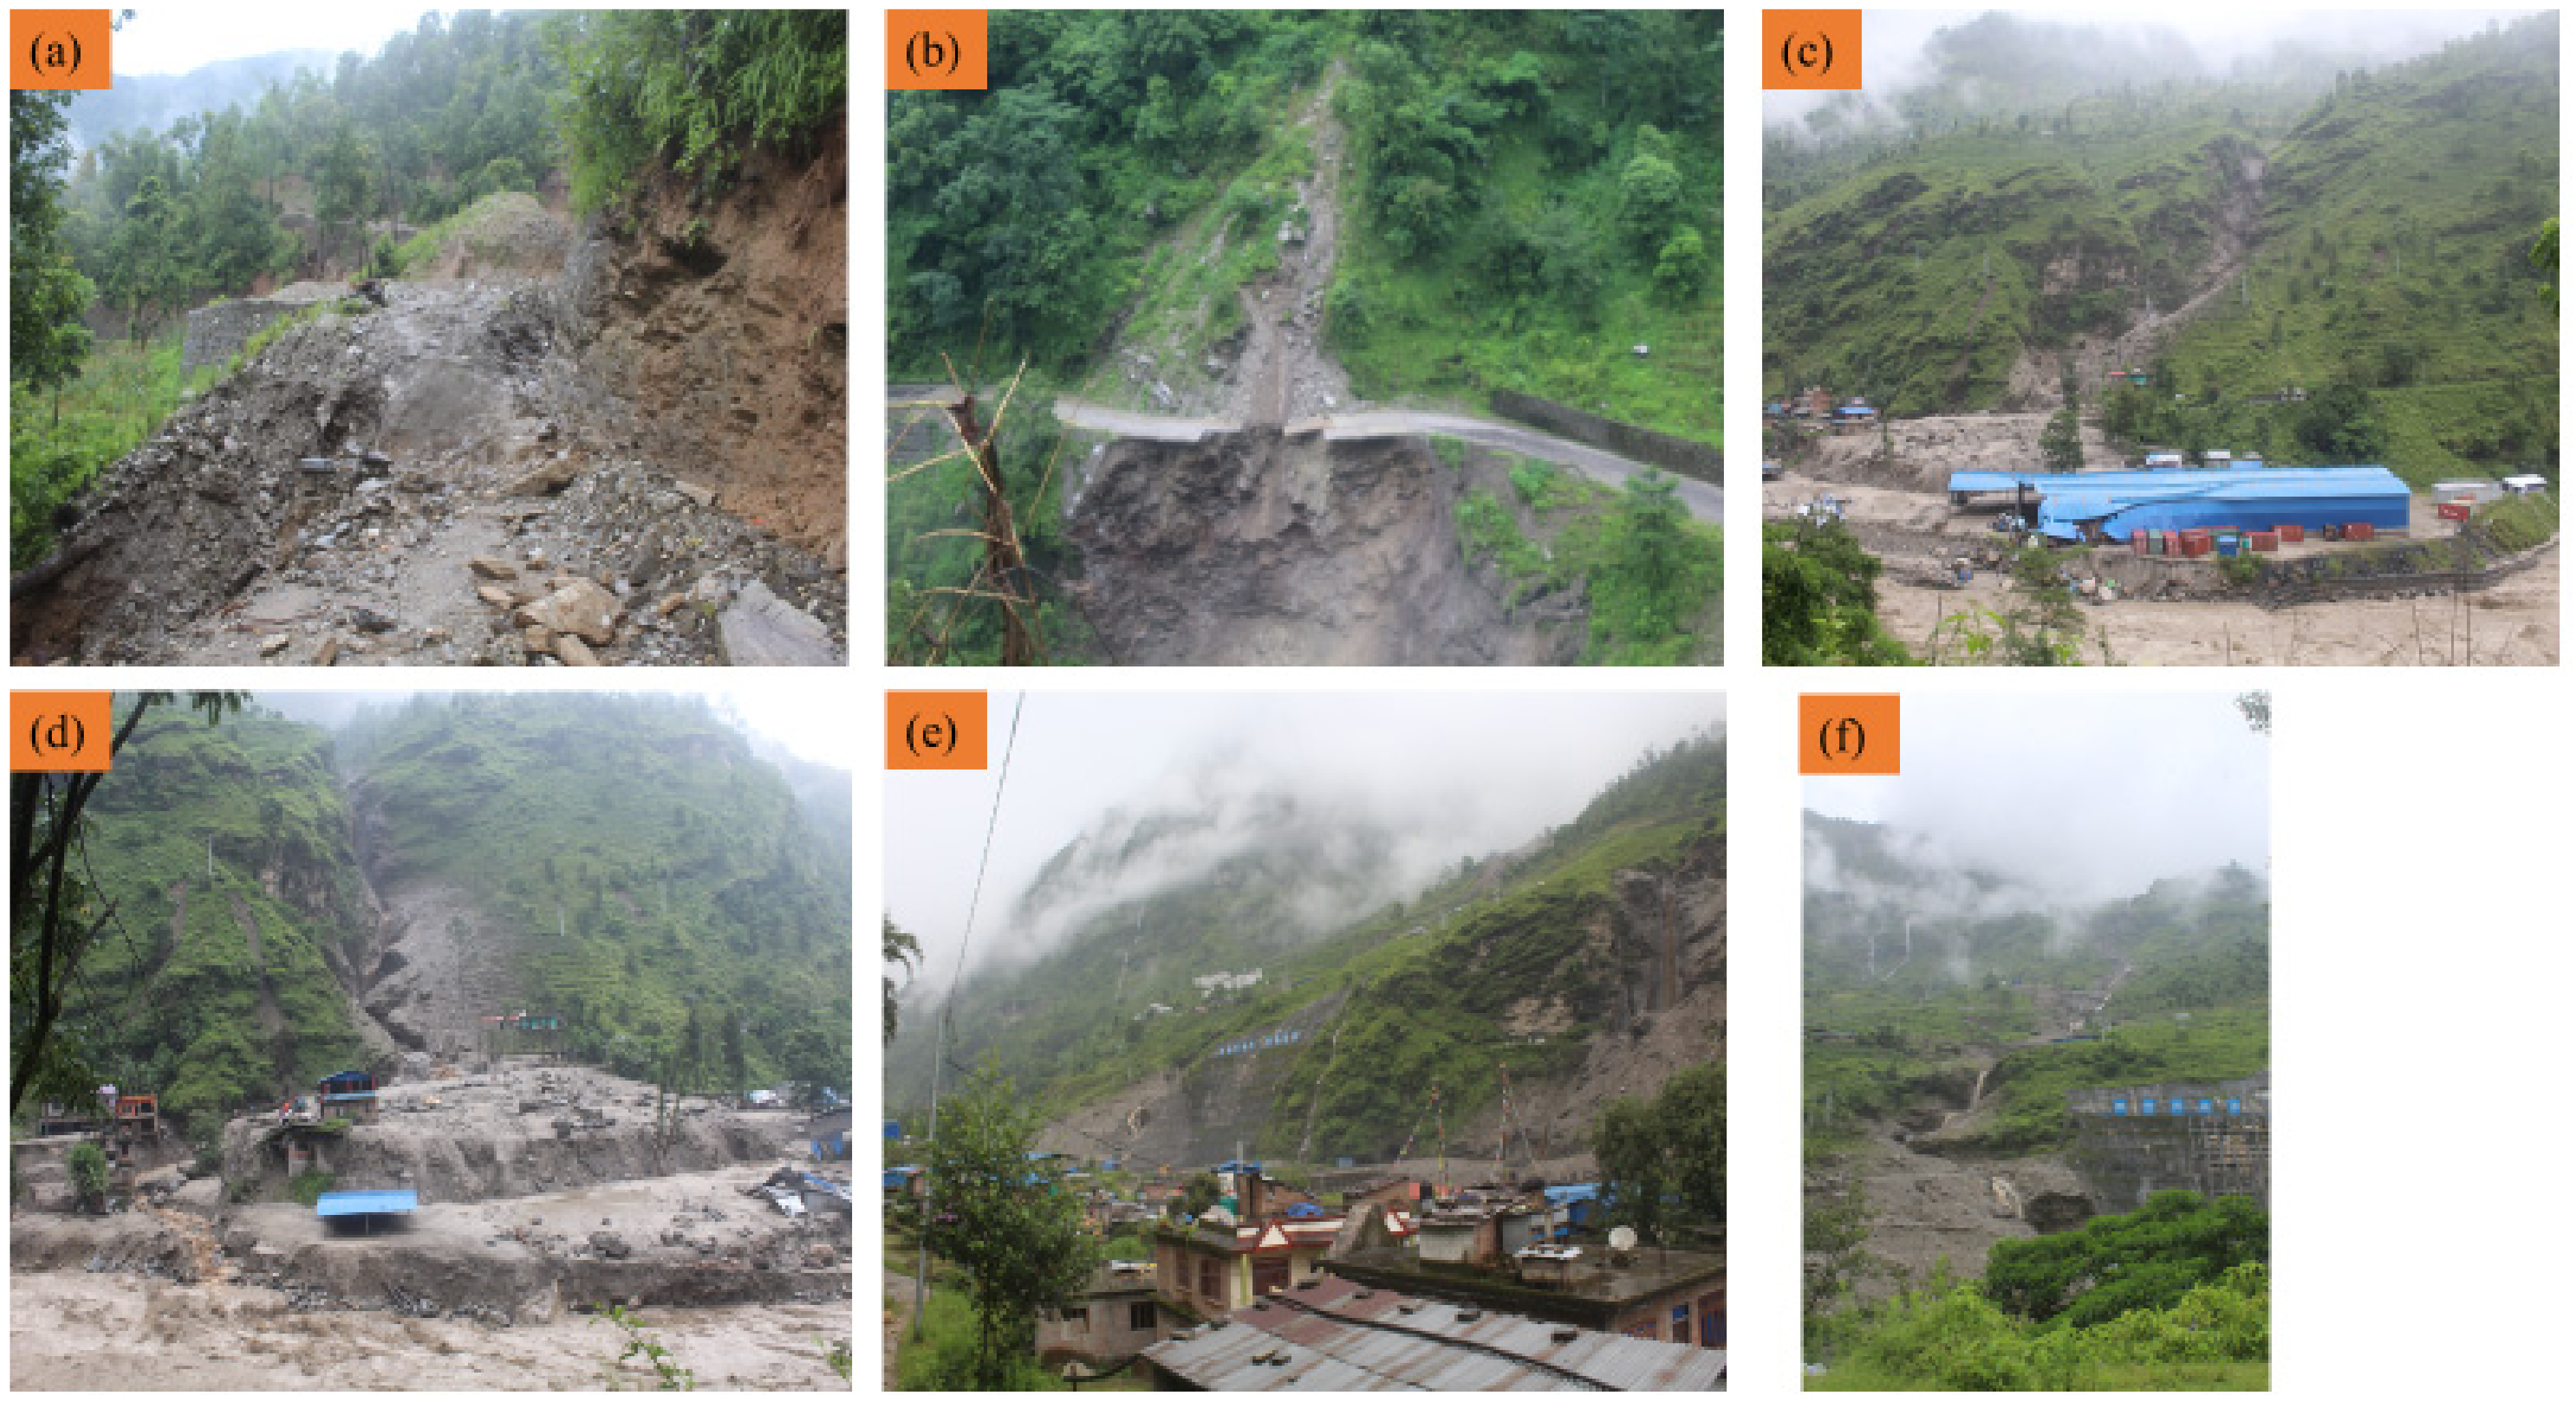
5.2.3. Incessant Rainfall-Triggered Mudslide/Debris Flow (9 July 2020)
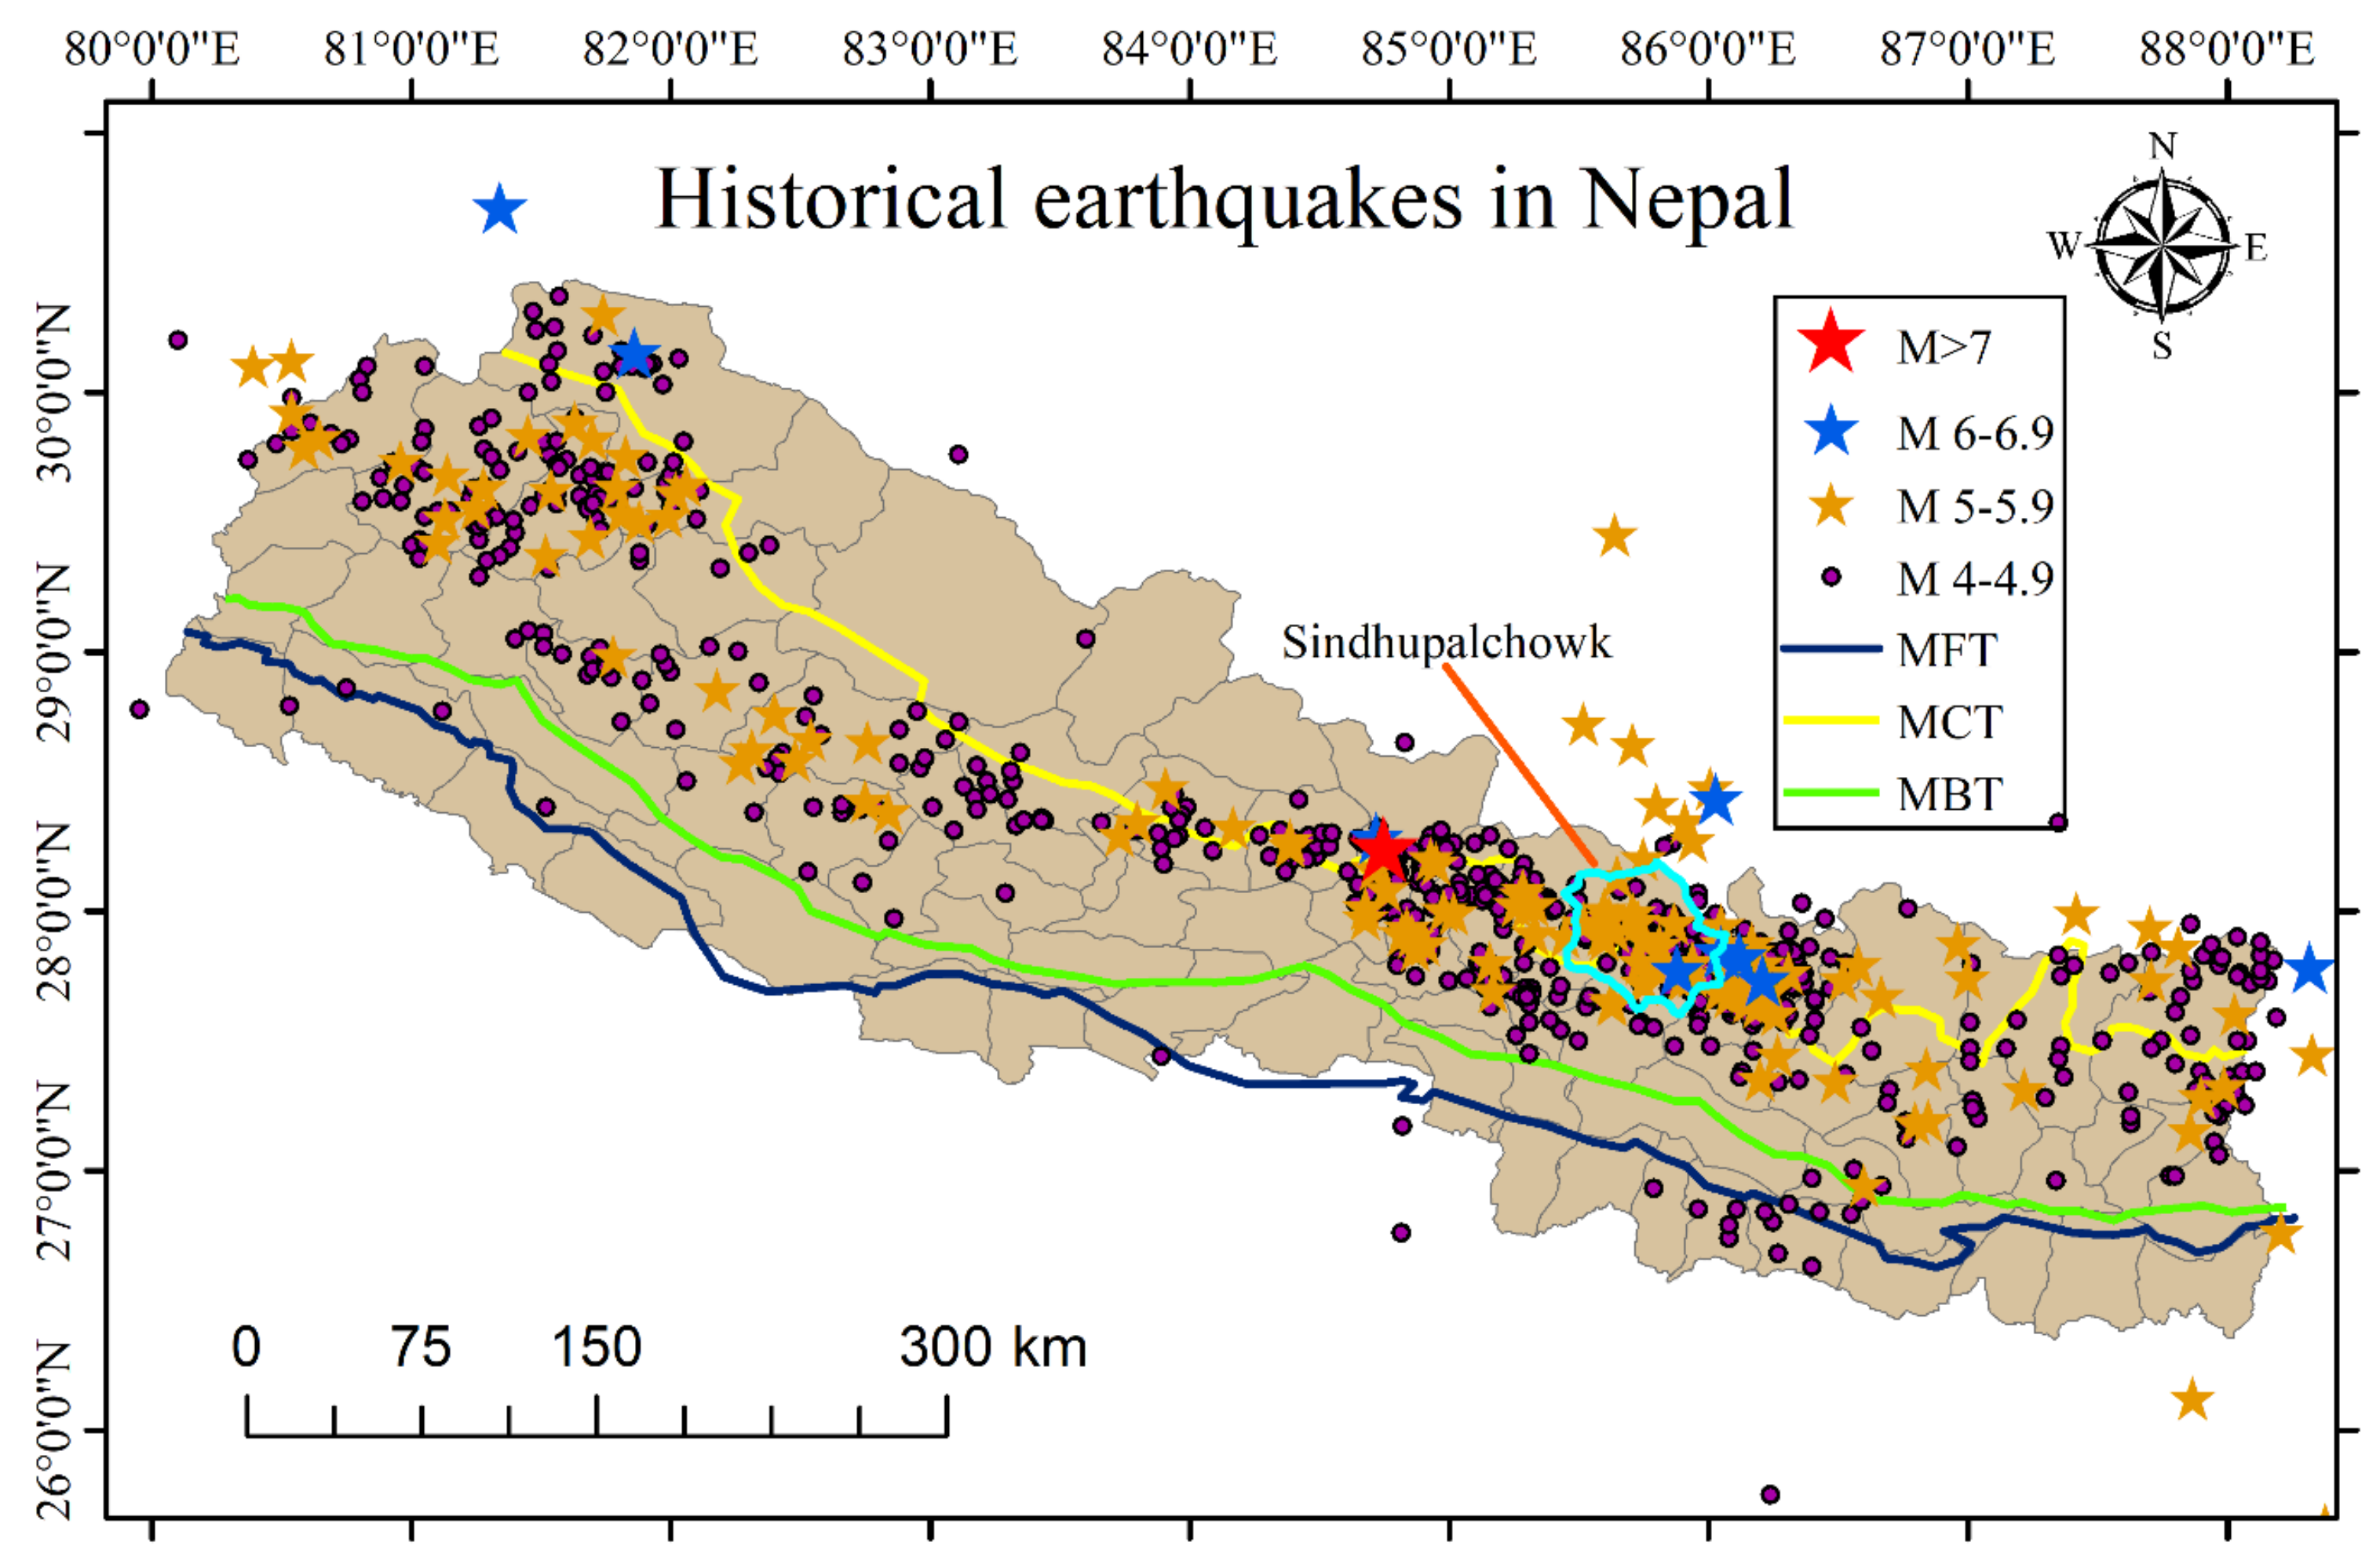
5.3. Earthquakes
5.3.1. 1934 Nepal–Bihar Earthquake
5.3.2. 1988 Earthquake
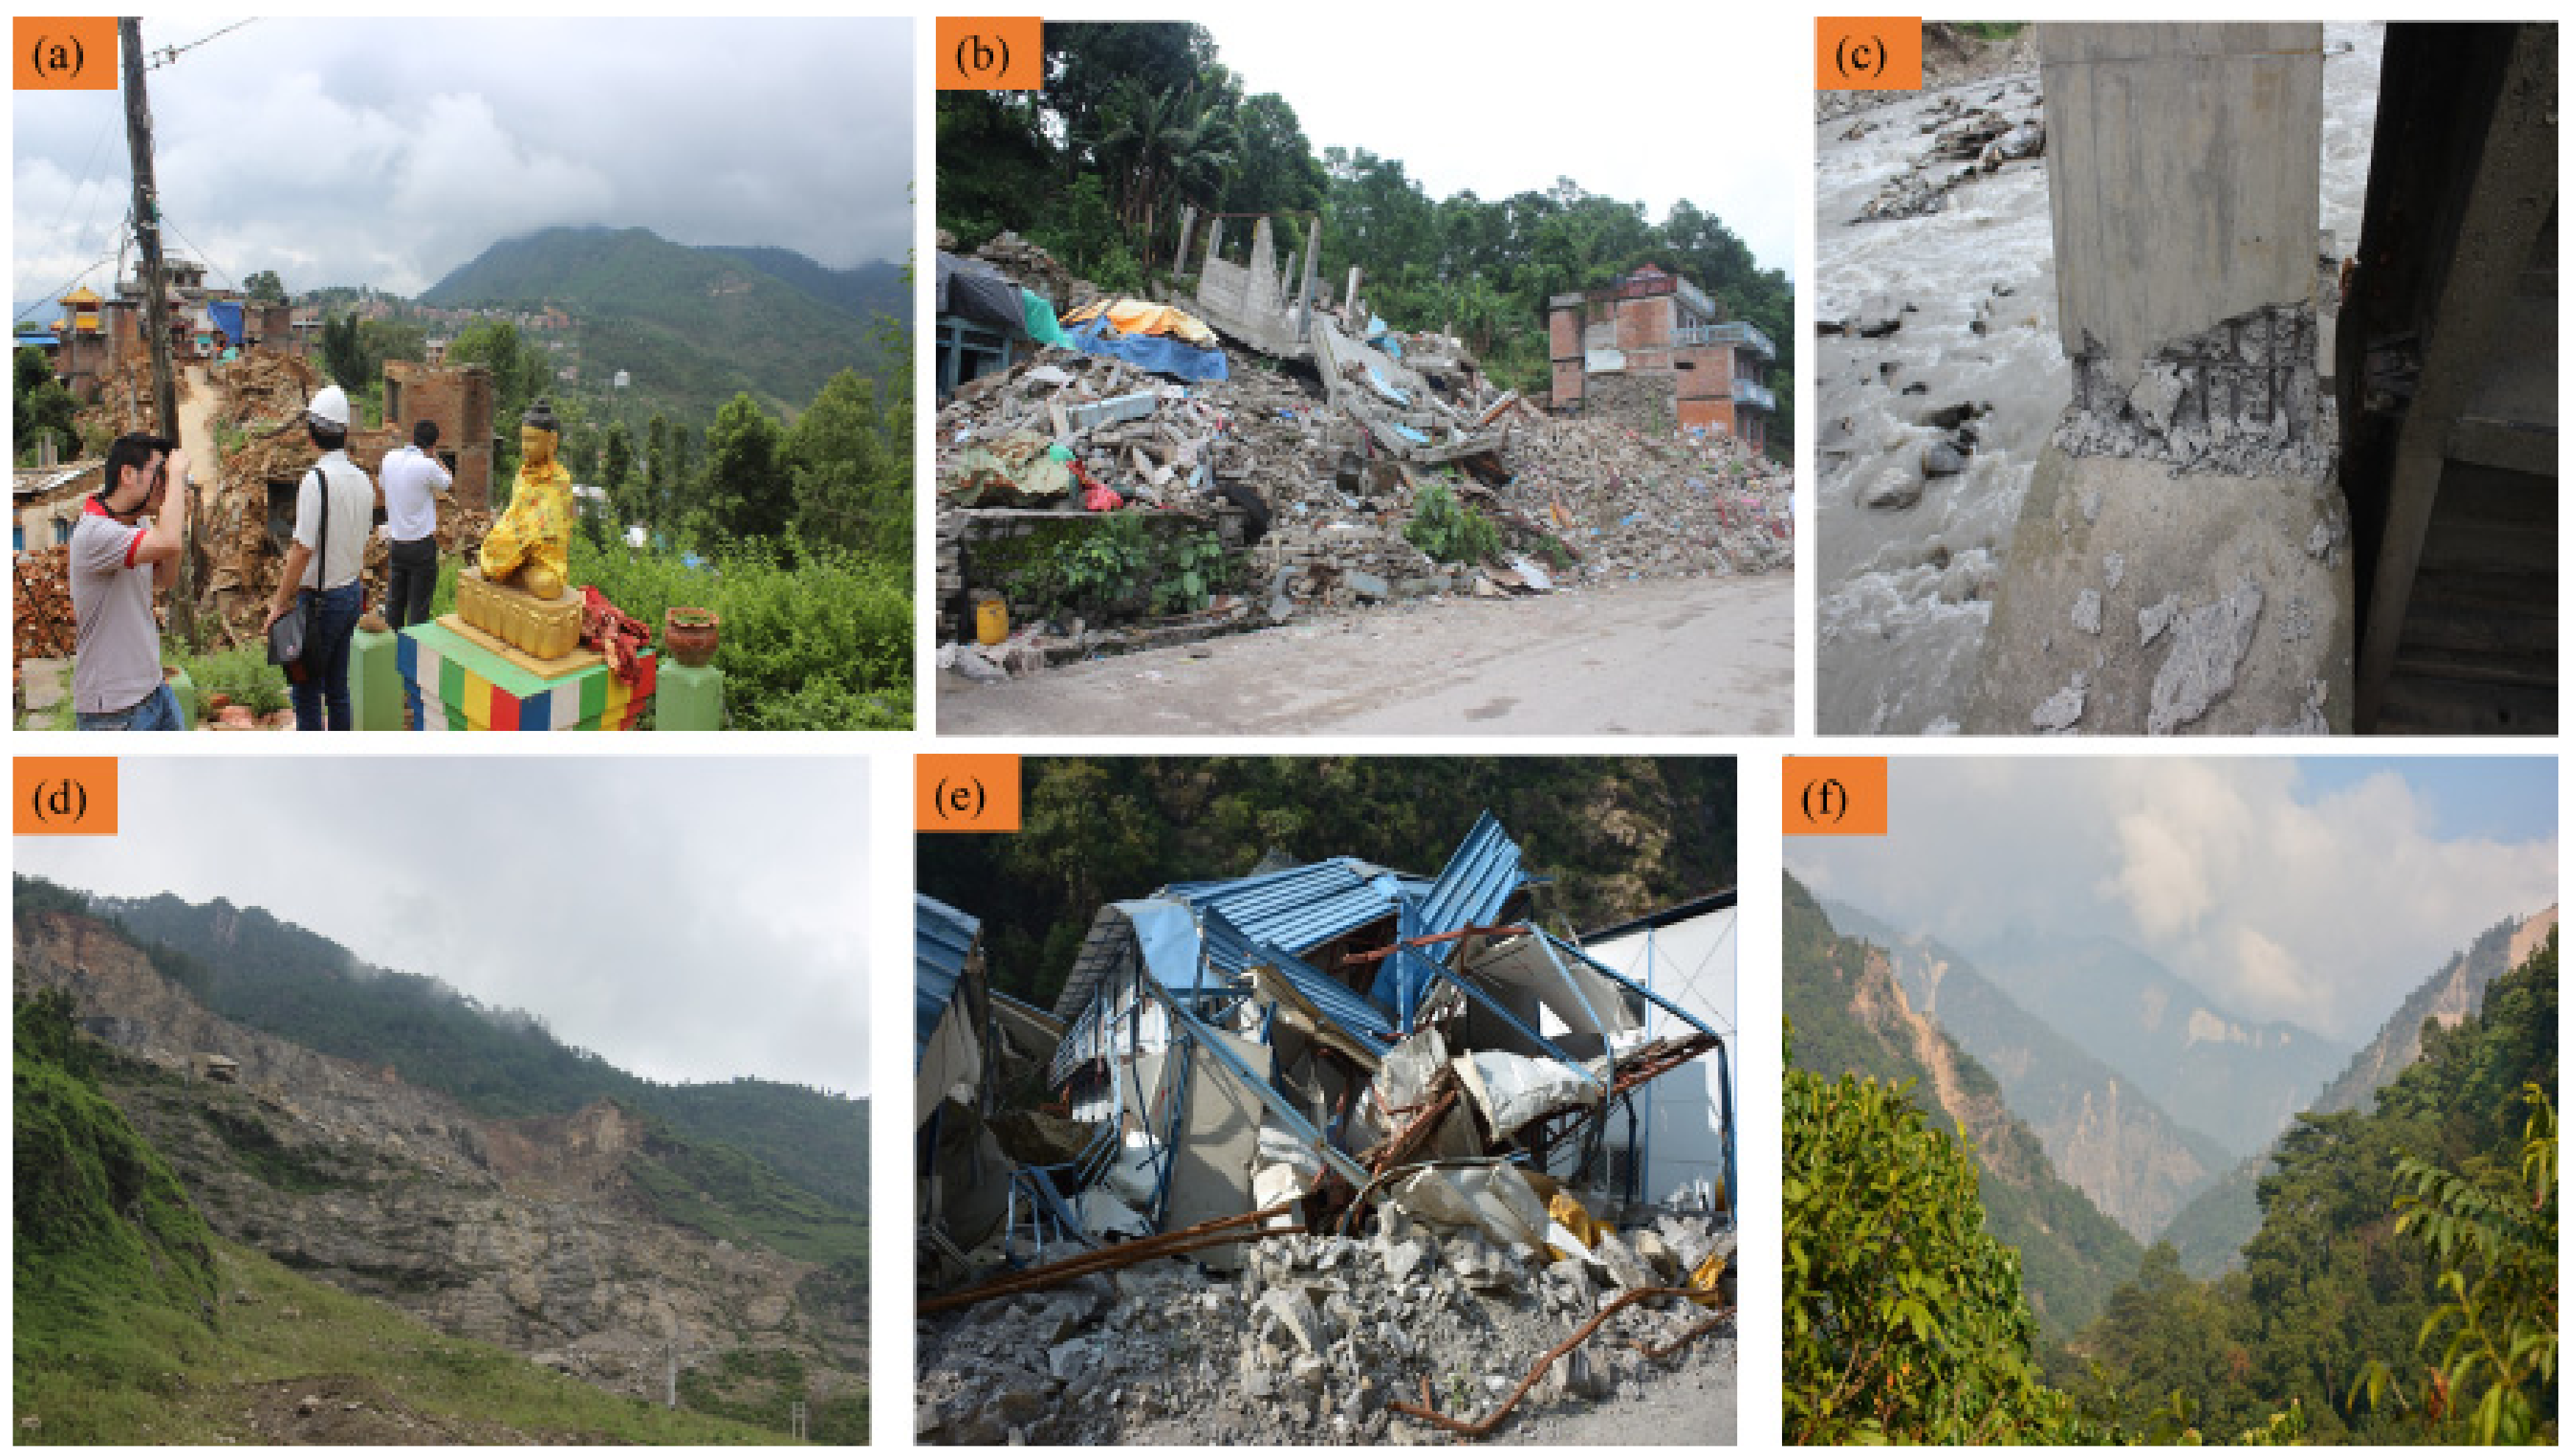
5.3.3. 2015 Gorkha Earthquake
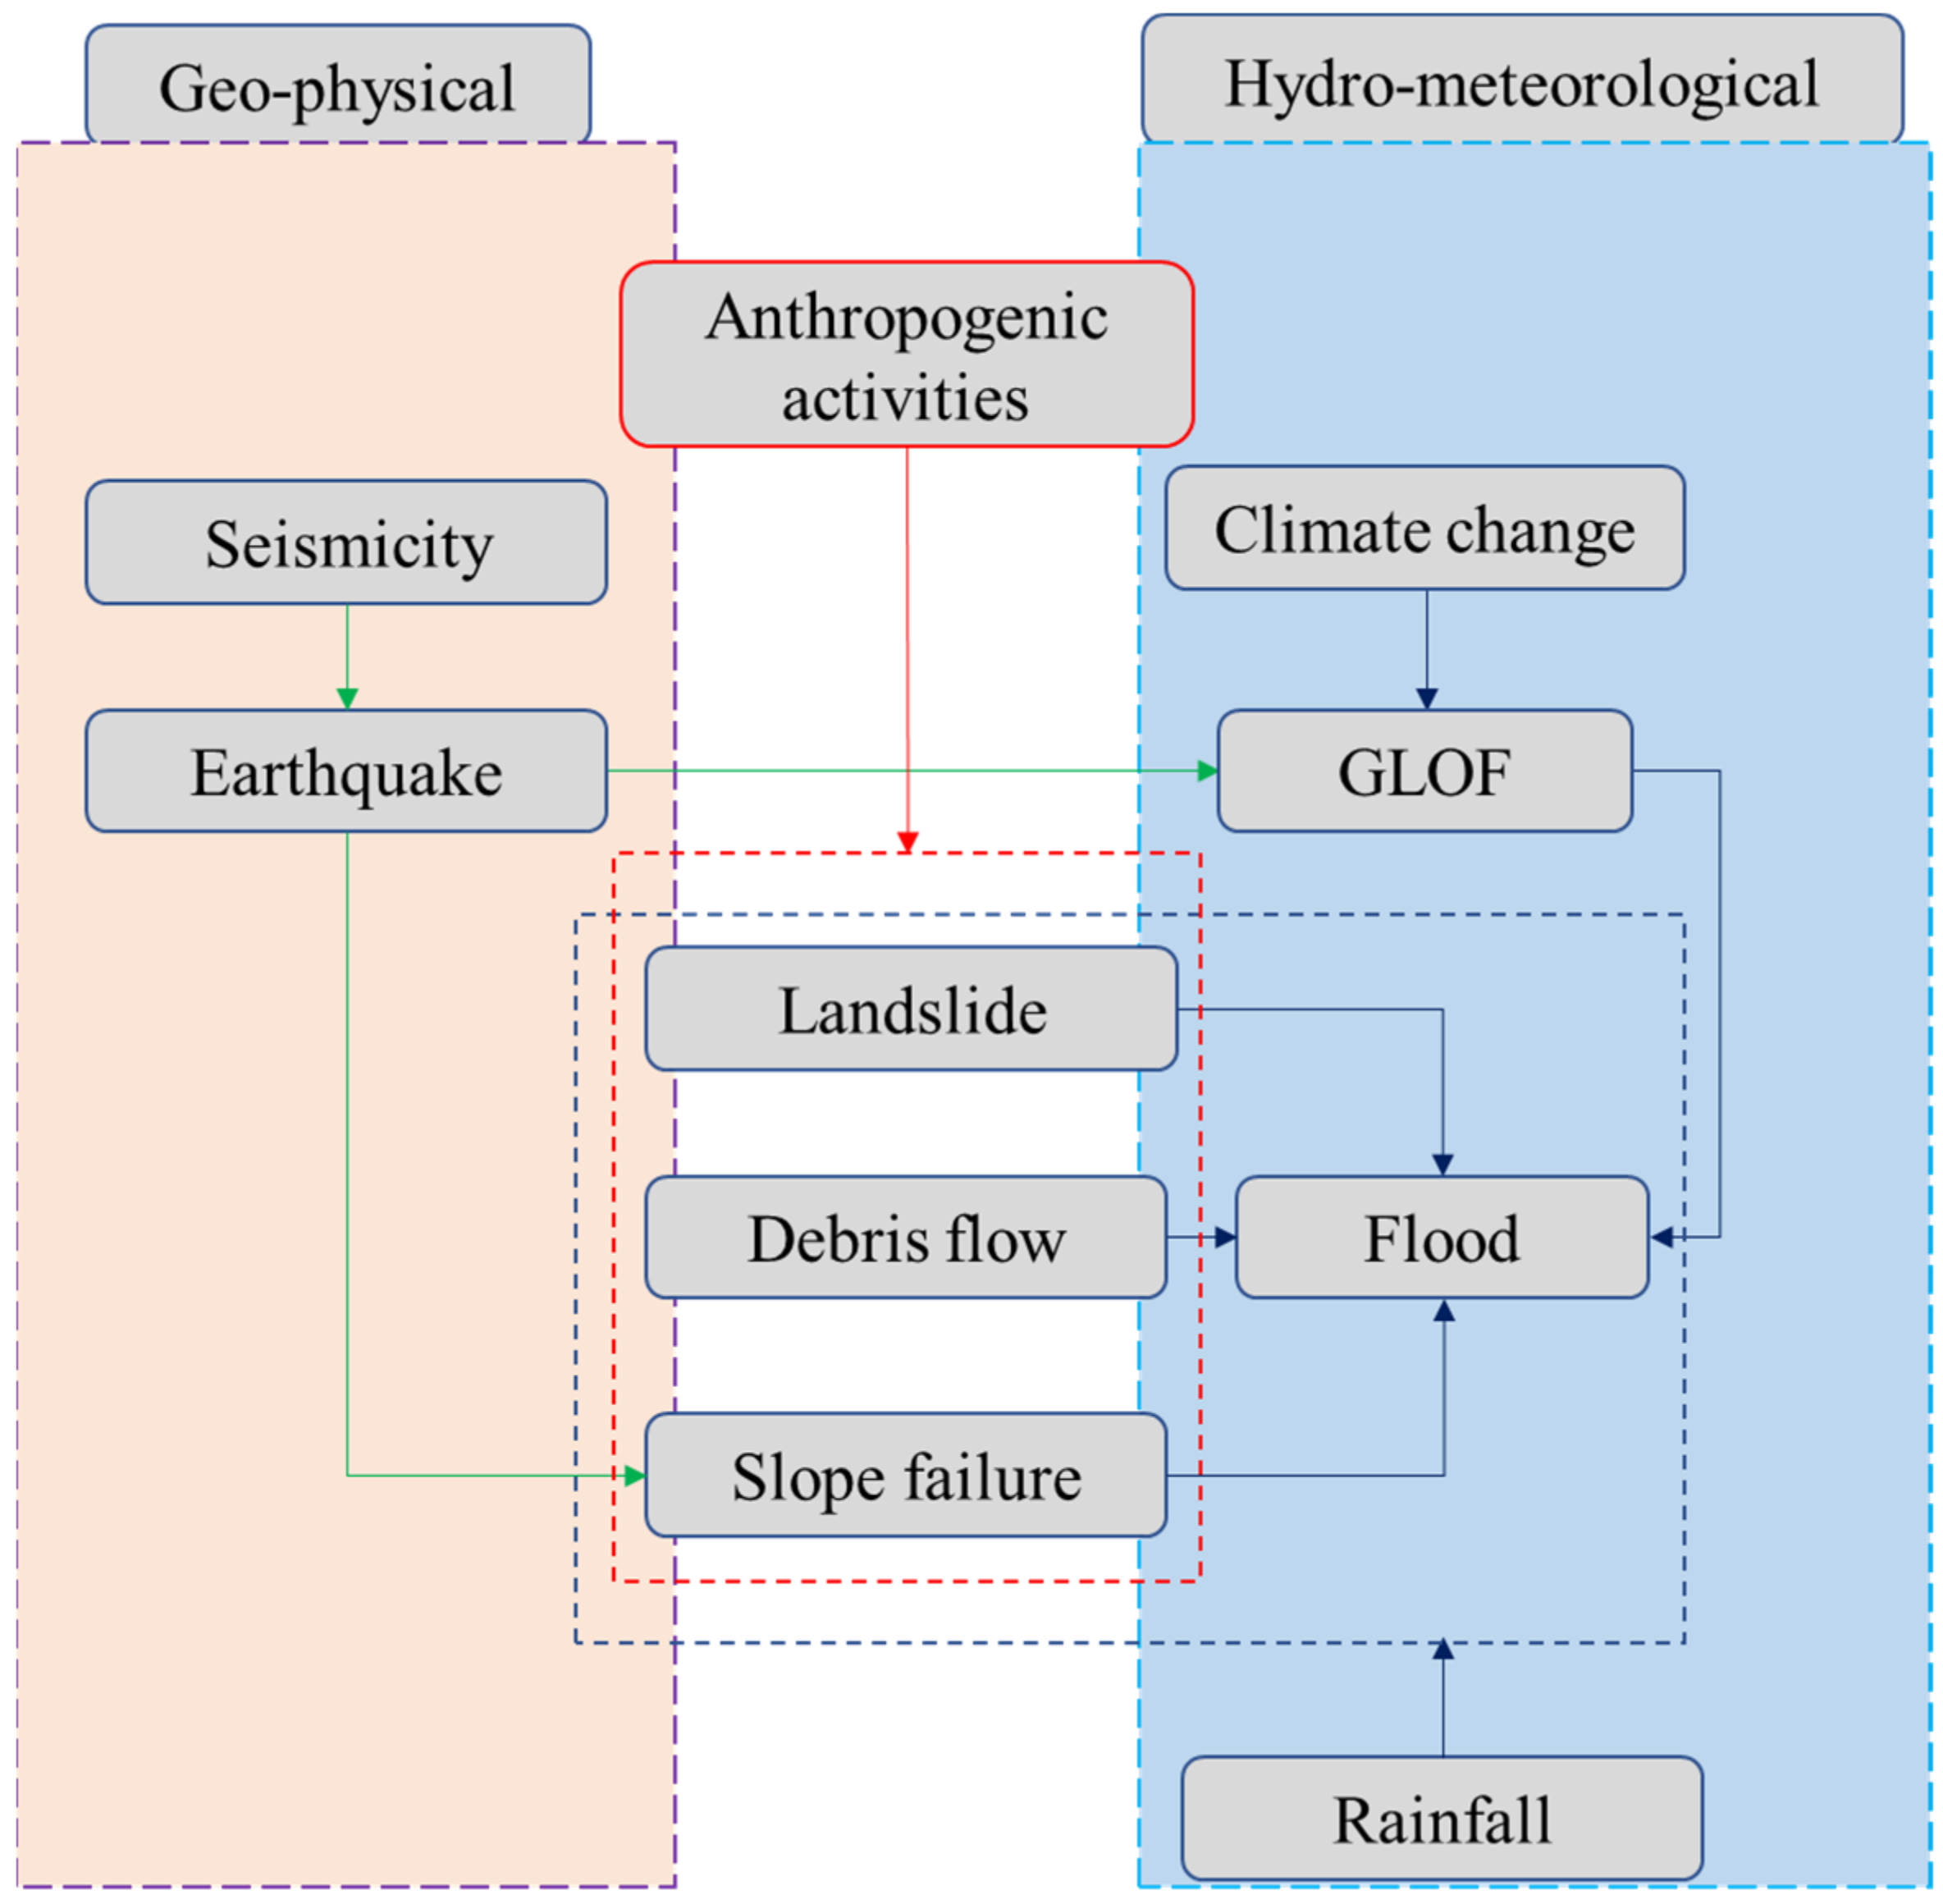
6. Prospects of Multihazards in Bhotekoshi–Sunkoshi Watershed
7. Conclusions
Author Contributions
Funding
Institutional Review Board Statement
Informed Consent Statement
Acknowledgments
Conflicts of Interest
References
- UNDP. Reducing Disaster Risk: A Challenge for Development. 2004. Available online: https://www.undp.org/content/undp/en/home/librarypage/crisis-prevention-and-recovery/reducing-disaster-risk--a-challenge-for-development.html (accessed on 7 August 2020).
- Government of Nepal. DRR Portal Nepal. 2020. Available online: http://www.drrportal.gov.np/ (accessed on 7 August 2020).
- Aryal, K.R. The history of disaster incidents and impacts in Nepal 1900–2005. Int. J. Disaster Risk Sci. 2012, 3, 147–154. [Google Scholar] [CrossRef]
- Ram, T.D.; Wang, G. Probabilistic seismic hazard analysis in Nepal. Earthq. Eng. Eng. Vib. 2013, 12, 577–586. [Google Scholar] [CrossRef]
- Rahman, M.; Bai, L. Probabilistic seismic hazard assessment of Nepal using multiple seismic source models. Earth Planet. Phys. 2018, 2, 327–341. [Google Scholar] [CrossRef]
- Thapa, S.; Shrestha, A.; Lamichhane, S.; Adhikari, R.; Gautam, D. Catchment-scale flood hazard mapping and flood vul-nerability analysis of residential buildings: The case of Khando River in eastern Nepal. J. Hydrol. Reg. Stud. 2020, 30, 100704. [Google Scholar] [CrossRef]
- Mishra, B.K.; Herath, S. Assessment of Future Floods in the Bagmati River Basin of Nepal Using Bias-Corrected Daily GCM Precipitation Data. J. Hydrol. Eng. 2015, 20, 05014027. [Google Scholar] [CrossRef]
- Sharma, R.H.; Shakya, N.M. Hydrological changes and its impact on water resources of Bagmati watershed. Nepal. J. Hydrol. 2006, 327, 315–322. [Google Scholar] [CrossRef]
- Khanal, N.R.; Hu, J.-M.; Mool, P. Glacial lake outburst flood risk in the Poiqu/Bhote Koshi/Sun Koshi river basin in the Central Himalayas. Mt. Res. Dev. 2015, 35, 351. [Google Scholar] [CrossRef]
- Fujita, K.; Sakai, A.; Takenaka, S.; Nuimura, T.; Surazakov, A.B.; Sawagaki, T.; Yamanokuchi, T. Potential flood volume of Himalayan glacial lakes. Nat. Hazards Earth Syst. Sci. 2013, 13, 1827–1839. [Google Scholar] [CrossRef]
- Devkota, K.C.; Regmi, A.D.; Pourghasemi, H.R.; Yoshida, K.; Pradhan, B.; Ryu, I.C.; Dhital, M.R.; Althuwaynee, O.F. Landslide susceptibility mapping using certainty factor, index of entropy and logistic regression models in GIS and their comparison at Mugling–Narayanghat road section in Nepal Himalaya. Nat. Hazards 2013, 65, 135–165. [Google Scholar] [CrossRef]
- Yu, B.; Chen, F.; Xu, C. Landslide detection based on contour-based deep learning framework in case of national scale of Nepal in 2015. Comput. Geosci. 2020, 135, 104388. [Google Scholar] [CrossRef]
- Gautam, D.; Adhikari, R.; Jha, P.; Rupakhety, R.; Yadav, M. Windstorm vulnerability of residential buildings and infra-structures in south-central Nepal. J. Wind Eng. Ind. Aerodyn. 2020, 198, 104113. [Google Scholar] [CrossRef]
- Khatiwada, K.R.; Pandey, V.P. Characterization of hydro-meteorological drought in Nepal Himalaya: A case of Karnali River Basin. Weather Clim. Extremes 2019, 26, 100239. [Google Scholar] [CrossRef]
- Adhikari, R.; Gautam, D.; Jha, P.; Aryal, B.; Ghalan, K.; Rupakhety, R.; Dong, Y.; Rodrigues, H.; Motra, G. Bridging Multi-hazard Vulnerability and Sustainability: Approaches and Applications to Nepali Highway Bridges. In Resilient Structures and Infrastructure; Springer International Publishing: Berlin/Heidelberg, Germany, 2019; pp. 361–378. [Google Scholar]
- Gautam, D.; Thapa, S.; Pokhrel, S.; Lamichhane, S. Local level multi-hazard zonation of Nepal. Geomat. Nat. Hazards Risk 2021, 12, 405–423. [Google Scholar] [CrossRef]
- Gautam, D.; Dong, Y. Multi-hazard vulnerability of structures and lifelines due to the 2015 Gorkha earthquake and 2017 central Nepal flash flood. J. Build. Eng. 2018, 17, 196–201. [Google Scholar] [CrossRef]
- Pandey, R.; Kala, S.; Pandey, V.P. Assessing climate change vulnerability of water at household level. Mitig. Adapt. Strat. Glob. Chang. 2014, 20, 1471–1485. [Google Scholar] [CrossRef]
- Artioli, E.; Battaglia, R.; Tralli, A. Emilia 2012 earthquake and the need of accounting for multi-hazard design paradigm for strategic infrastructures. Eng. Struct. 2017, 140, 353–372. [Google Scholar] [CrossRef]
- Pickard, C.J.; Needs, R.J. Structures at high pressure from random searching. Phys. Status Solidi 2009, 246, 536–540. [Google Scholar] [CrossRef]
- McCullough, M.C.; Kareem, A.; Donahue, A.S.; Westerink, J.J. Structural Damage Under Multiple Hazards in Coastal Environments. J. Disaster Res. 2013, 8, 1042–1051. [Google Scholar] [CrossRef]
- Liu, B.; Xu, W. Comprehensive multi-risk assessment of natural hazards to human life in yangtze river delta region. J. Nat. Disasters 2012, 21, 56–63. [Google Scholar]
- Georgescu, E.-S.; Gociman, C.O.; Craifaleanu, I.-G.; Georgescu, M.S.; Moscu, C.I.; Dragomir, C.S.; Dobre, D. Multi-Hazard Scenarios and Impact Mapping for a Protected Built Area in Bucharest, as a Base for Emergency Planning. In Proceedings of the International Conference on Dynamics of Disasters, Kalamata, Greece, 29 June–2 July 2015; pp. 57–70. [Google Scholar]
- Santos-Santiago, M.A.; Ruiz, S.E.; Valenzuela-Beltrán, F. Multihazard risk assessment (seismic and wind) for buildings with dampers in Mexico city. In Proceedings of the 11th National Conference on Earthquake Engineering 2018, NCEE 2018: Inte-grating Science, Engineering, and Policy, Los Angeles, CA, USA, 25–29 June 2018. [Google Scholar]
- National Planning Commission. Post disaster need assessment. 2015. Available online: https://www.npc.gov.np/images/category/PDNA_volume_BFinalVersion.pdf (accessed on 22 June 2018).
- Government of Nepal. Nepal Flood 2017: Post Flood Recovery Needs Assessment 2017. Available online: https://www.npc.gov.np/images/category/PFRNA_Report_Final.pdf (accessed on 13 May 2019).
- Da Silva, L.P.B.; Hussein, H. Production of scale in regional hydropolitics: An analysis of La Plata River Basin and the Guarani Aquifer System in South America. Geoforum 2019, 99, 42–53. [Google Scholar] [CrossRef]
- Conker, A.; Hussein, H. Hydropolitics and issue-linkage along the Orontes River Basin: An analysis of the Lebanon–Syria and Syria–Turkey hydropolitical relations. Int. Environ. Agreem. Politi Law Econ. 2020, 20, 103–121. [Google Scholar] [CrossRef]
- Hussein, H.; Grandi, M. Dynamic political contexts and power asymmetries: The cases of the Blue Nile and the Yarmouk Rivers. Int. Environ. Agreem. Politi Law Econ. 2017, 17, 795–814. [Google Scholar] [CrossRef]
- Karki, R.; Talchabhadel, R.; Aalto, J.; Baidya, S.K. New climatic classification of Nepal. Theor. Appl. Clim. 2015, 125, 799–808. [Google Scholar] [CrossRef]
- HLyu, H.M.; Shen, J.S.; Arulrajah, A. Assessment of geohazards and preventative countermeasures using AHP incorpo-rated with GIS in Lanzhou, China. Sustainability 2018, 10, 304. [Google Scholar]
- Alkhasawneh, M.S.; Ngah, U.K.; Tay, L.T.; Isa, N.A.M.; Al-Batah, M.S. Determination of Important Topographic Factors for Landslide Mapping Analysis Using MLP Network. Sci. World J. 2013, 2013, 1–12. [Google Scholar] [CrossRef]
- Auden, J.B.; Gansser, A. Geology of the Himalayas. Geogr. J. 1967, 133, 84. [Google Scholar] [CrossRef]
- Neupane, B.; Ju, Y.; Allen, C.M.; Das Ulak, P.; Han, K. Petrography and provenance of Upper Cretaceous–Palaeogene sandstones in the foreland basin system of Central Nepal. Int. Geol. Rev. 2017, 60, 135–156. [Google Scholar] [CrossRef]
- Nepal, N.; Chen, J.; Chen, H.; Wang, X.; Sharma, T.P.P. Assessment of landslide susceptibility along the Araniko Highway in Poiqu/Bhote Koshi/Sun Koshi Watershed, Nepal Himalaya. Prog. Disaster Sci. 2019, 3, 100037. [Google Scholar] [CrossRef]
- Liu, M.; Chen, N.; Zhang, Y.; Deng, M. Glacial lake inventory and lake outburst flood/debris flow hazard assessment after the Gorkha earthquake in the Bhote Koshi Basin. Water 2020, 12, 464. [Google Scholar] [CrossRef]
- Allen, S.K.; Zhang, G.; Wang, W.; Yao, T.; Bolch, T. Potentially dangerous glacial lakes across the Tibetan Plateau revealed using a large-scale automated assessment approach. Sci. Bull. 2019, 64, 435–445. [Google Scholar] [CrossRef]
- DGautam, D. Assessment of social vulnerability to natural hazards in Nepal. Nat. Hazards Earth Syst. Sci. 2017, 17, 2313–2320. [Google Scholar] [CrossRef]
- Dahal, R.K.; Hasegawa, S.; Nonomura, A.; Yamanaka, M.; Dhakal, S.; Paudyal, P. Predictive modelling of rainfall-induced landslide hazard in the Lesser Himalaya of Nepal based on weights-of-evidence. Geomorphology 2008, 102, 496–510. [Google Scholar] [CrossRef]
- Fick, S.E.; Hijmans, R.J. WorldClim 2: New 1-km spatial resolution climate surfaces for global land areas. Int. J. Climatol. 2017, 37, 4302–4315. [Google Scholar] [CrossRef]
- Talchabhadel, R.; Karki, R. Assessing climate boundary shifting under climate change scenarios across Nepal. Environ. Monit. Assess. 2019, 191, 520. [Google Scholar] [CrossRef] [PubMed]
- Funk, C.; Verdin, A.; Michaelsen, J.; Peterson, P.; Pedreros, D.; Husak, G. A global satellite-assisted precipitation climatology. Earth Syst. Sci. Data 2015, 7, 275–287. [Google Scholar] [CrossRef]
- Talchabhadel, R.; Aryal, A.; Kawaike, K.; Yamanoi, K.; Nakagawa, H.; Bhatta, B.; Karki, S.; Thapa, B.R. Evaluation of precipitation elasticity using precipitation data from ground and satellite-based estimates and watershed modeling in Western Nepal. J. Hydrol. Reg. Stud. 2021, 33, 100768. [Google Scholar] [CrossRef]
- Central Bureau of Statistics Nepal. National Population and Housing Census 2011; Government of Nepal: Kathmandu, Nepal, 2012.
- Xu, Y.-S.; Shen, S.-L.; Ren, D.-J.; Wu, H.-N. Analysis of Factors in Land Subsidence in Shanghai: A View Based on a Strategic Environmental Assessment. Sustainability 2016, 8, 573. [Google Scholar] [CrossRef]
- Tian, H.; Nan, H.; Yang, Z. Select landslide susceptibility main affecting factors by multi-objective optimization algorithm. In Proceedings of the 2010 Sixth International Conference on Natural Computation, Yantai, China, 10–12 August 2010; Volume 4, pp. 1830–1833. [Google Scholar]
- Liu, R.; Chen, Y.; Wu, J.; Gao, L.; Barrett, D.; Xu, T.; Li, L.; Huang, C.; Yu, J. Assessing spatial likelihood of flooding hazard using naïve Bayes and GIS: A case study in Bowen Basin, Australia. Stoch. Environ. Res. Risk Assess. 2016, 30, 1575–1590. [Google Scholar] [CrossRef]
- Yao, X.; Liu, S.; Han, L.; Sun, M.; Zhao, L. Definition and classification system of glacial lake for inventory and hazards study. J. Geogr. Sci. 2018, 28, 193–205. [Google Scholar] [CrossRef]
- Chen, X.-Q.; Cui, P.; Li, Y.; Yang, Z.; Qi, Y.-Q. Changes in glacial lakes and glaciers of post-1986 in the Poiqu River basin, Nyalam, Xizang (Tibet). Geomorphology 2007, 88, 298–311. [Google Scholar] [CrossRef]
- Dhital, M.R. Geology of the Nepal Himalaya: Regional Perspective of the Classic Collided Orogen; Springer: Berlin/Heidelberg, Germany, 2015. [Google Scholar]
- Gerrard, J. The landslide hazard in the Himalayas: Geological control and human action. Geomorphology 1994, 10, 221–230. [Google Scholar] [CrossRef]
- Zhang, J.-Q.; Liu, R.-K.; Deng, W.; Khanal, N.R.; Gurung, D.R.; Murthy, M.S.R.; Wahid, S. Characteristics of landslide in Koshi River Basin, Central Himalaya. J. Mt. Sci. 2016, 13, 1711–1722. [Google Scholar] [CrossRef]
- Guo, C.-W.; Huang, Y.-D.; Yao, L.-K.; Alradi, H. Size and spatial distribution of landslides induced by the 2015 Gorkha earthquake in the Bhote Koshi river watershed. J. Mt. Sci. 2017, 14, 1938–1950. [Google Scholar] [CrossRef]
- Liu, J.-J.; Cheng, Z.-L.; Su, P.-C. The relationship between air temperature fluctuation and Glacial Lake Outburst Floods in Tibet, China. Quat. Int. 2014, 321, 78–87. [Google Scholar] [CrossRef]
- Nie, Y.; Liu, Q.; Wang, J.; Zhang, Y.; Sheng, Y.; Liu, S. An inventory of historical glacial lake outburst floods in the Himalayas based on remote sensing observations and geomorphological analysis. Geomorphology 2018, 308, 91–106. [Google Scholar] [CrossRef]
- Shrestha, F.; Gao, X.; Khanal, N.R.; Maharjan, S.B.; Shrestha, R.B.; Wu, L.-Z.; Mool, P.K.; Bajracharya, S.R. Decadal glacial lake changes in the Koshi basin, central Himalaya, from 1977 to 2010, derived from Landsat satellite images. J. Mt. Sci. 2017, 14, 1969–1984. [Google Scholar] [CrossRef]
- Cook, K.L.; Andermann, C.; Gimbert, F.; Adhikari, B.R.; Hovius, N. Glacial lake outburst floods as drivers of fluvial erosion in the Himalaya. Science 2018, 362, 53–57. [Google Scholar] [CrossRef]
- Xu, D.M.; Liu, C.H.; Feng, Q.H. Dangerous glacial lake and outburst features in Xizang Himalayas. Acta Geogr. Sin. 1989, 44, 345–352. [Google Scholar]
- Wicki, A.; Lehmann, P.; Hauck, C.; Seneviratne, S.I.; Waldner, P.; Stähli, M. Assessing the potential of soil moisture measurements for regional landslide early warning. Landslides 2020, 17, 1881–1896. [Google Scholar] [CrossRef]
- Zhuo, L.; Dai, Q.; Han, D.; Chen, N.; Zhao, B.; Berti, M. Evaluation of Remotely Sensed Soil Moisture for Landslide Hazard Assessment. IEEE J. Sel. Top. Appl. Earth Obs. Remote Sens. 2019, 12, 162–173. [Google Scholar] [CrossRef]
- Shrestha, B.B.; Nakagawa, H. Hazard assessment of the formation and failure of the Sunkoshi landslide dam in Nepal. Nat. Hazards 2016, 82, 2029–2049. [Google Scholar] [CrossRef]
- Ao, M.; Zhang, L.; Dong, Y.; Su, L.; Shi, X.; Balz, T.; Liao, M. Characterizing the evolution life cycle of the Sunkoshi landslide in Nepal with multi-source SAR data. Sci. Rep. 2020, 10, 1–12. [Google Scholar] [CrossRef]
- Rana, B. The Great Earthquake of Nepal; Jorganesh Press: Kathmandu, Nepal, 1935. [Google Scholar]
- Gautam, D.; Chaulagain, H. Structural performance and associated lessons to be learned from world earthquakes in Nepal after 25 April 2015 (MW 7.8) Gorkha earthquake. Eng. Fail. Anal. 2016, 68, 222–243. [Google Scholar] [CrossRef]
- Gautam, D. Unearthed lessons of 25 April 2015 Gorkha earthquake ( M W 7.8): Geotechnical earthquake engineering per-spectives. Geomat. Nat. Hazards Risk 2017, 8, 1358–1382. [Google Scholar] [CrossRef]
- Gupta, S.P. Report on Eastern Nepal Earthquake 21 August 1988: Damages and Recommendations for Repairs and Reconstruction; Asian Disaster Preparedness Center: Bangkok, Thailand, 1988. [Google Scholar]
- Gautam, D.; Fabbrocino, G.; de Magistris, F.S. Derive empirical fragility functions for Nepali residential buildings. Eng. Struct. 2018, 171, 617–628. [Google Scholar] [CrossRef]
- Gautam, D. Observational fragility functions for residential stone masonry buildings in Nepal. Bull. Earthq. Eng. 2018, 16, 4661–4673. [Google Scholar] [CrossRef]


| Name of Palika | Total Area of Palika (km2) Calculated from GIS Shapefile | % of Area within the Watershed |
|---|---|---|
| Bhotekoshi | 278.04 | 100 |
| Bahrabise | 134.68 | 100 |
| Sunkoshi | 72.8 | 25 |
| Balefi | 61.57 | 29 |
| Tripurasundari | 94.2 | 88 |
| Lisangkhu Pakhar | 98.54 | 6 |
| Watershed Characteristics | Indicator/Parameter | Logical Link to Multiple Hazards | Reference(s) |
|---|---|---|---|
| Topographical | Elevation | Spatial distribution of topography affects distribution of floods, with flat area prone to more flooding | [31] |
| Slope | Damage potential due to natural hazards such as landslide is high in flat topography than in steep topography | [31] | |
| Aspect | Influences/triggers landslide | [32] | |
| River density | Distribution of drainage density can play a role in reducing flood water as well as induce flooding depending upon location | [31] | |
| Geological | Geological setting | Regional geological and geomorphological setting plays a significant role for the occurrence of geohazards in its preparatory phases | [33] |
| Geostructure and lithology | Fault structure, lithological variation, sediment thickness and rock fracturing impact the occurrence of geohazards | [34] | |
| Hydrometeorological | Rainfall | Rainfall infiltration may increase degree of saturation of soil, reduces soils shear strength, and ultimately may lead to occurrence of geohazards | [32,33] |
| River flow | High flow may lead to flooding and excessively low flow may lead to drought | [34,35] | |
| Glacier lakes | Erosion and sediment (entrainment of loose solid) in the watershed | Glacial lake outburst floods (GLOFs) evolve into debris flows by erosion and sediment entertainment, which increase peak discharge and volume leading to destructive damage in downstream | [36] |
| Lake volume | Higher volume may lead to potential flood magnitude during GLOFs and vice versa | [36,37] | |
| Socioeconomic | Socioeconomic variables | Population comprising significant number of people above 60 years and below 14 years will be more affected during disaster. Disasters will affect poor and physically disadvantaged people more than normal people and people with better economic status. | [3,38] |
| Data Type | Description/Characteristics | Data Source |
|---|---|---|
| Digital elevation model (DEM) | Raster data of 30 m horizontal resolution | Advanced Land Observing Satellite (ALOS) World 3D-DEM (AW3D) |
| River discharge | Daily river discharge (m3/s) and instantaneous discharge (m3/s) at Bahrabise station (index: 610; Lat.: 27°47’18”; Lon.: 85°53’55”) for the period of 1965–2006. | Department of Hydrology and Meteorology (DHM), Government of Nepal |
| Precipitation | Daily time series data at every 5 km spatial resolution | CHIRPS (Climate Hazards Group Infrared Precipitation with Stations) |
| Geology | Geological map of Nepal with major lithological units and faults | Department of Mines and Geology, Government of Nepal |
| Glacier lakes | Glacial lake inventory of Bhotekoshi based on GAoFEn-1 (GF-1) satellite image (http://www.cresda.com/CN/ (accessed on 17 March 2021)) | [36] |
| Socioeconomic data | 2011 National Housing and Population Census | Central Bureau of Statistics, Government of Nepal |
| Features | Unit | Value |
|---|---|---|
| Catchment area (A) | km2 | 2558 |
| Area below 3000 m | km2 | 467.5 |
| Area between 3000 to 5000 m | km2 | 880.4 |
| Area above 5000 m | km2 | 1002.1 |
| Longest flow path (L) | km | 145.3 |
| Maximum elevation (Zmax) | m asl | 8007 |
| Minimum elevation (Zmin) | m asl | 676 |
| Mean elevation (Zmean) | m asl | 4333 |
| Average slope of river ((Zmax−Zmin)/L) | - | 0.05 |
| Aspect | Area (%) | Slope (°) | Area (%) | River Density (m/km2) | Area (%) |
|---|---|---|---|---|---|
| Flat | 0.1 | <5 | 4.8 | <50 | 64.3 |
| North | 13.5 | 5–10 | 8.4 | 50–100 | 12.5 |
| Northeast | 12.3 | 10–20 | 20.8 | 100–200 | 15.7 |
| East | 11.5 | 20–30 | 27.0 | 200–300 | 6.0 |
| Southeast | 11.3 | 30–50 | 34.3 | >300 | 1.5 |
| South | 13.0 | >50 | 4.7 | ||
| Southwest | 13.9 | ||||
| West | 12.7 | ||||
| Northwest | 11.7 |
| Name of Lake | Date of Outburst | Latitude | Longitude | Elevation (masl) | Burst Water Volume (106 m3) | Damage | Triggering Factor(s) | Reference(s) |
|---|---|---|---|---|---|---|---|---|
| Taracho | 28 August 1935 | 28.29 | 86.13 | 5245 | 6.3 | Farmlands, yaks | Damage collapsed by seepage | [49,58] |
| Cirenmaco | 1964 | 28.07 | 86.07 | 4627 | Piping | [49,58] | ||
| 11 July 1981 | 18.9 | 200 deaths, friendship bridge, hydropower station | Ice avalanche | [54,58] | ||||
| Jialongco | 23 May 2002 | 28.21 | 85.85 | 4374 | 23.6 | Hydropower | Ice avalanche | [49] |
| 11 July 1981 | Station, highway | |||||||
| Gongbatongsha Tsho | 5 July 2016 | 28.08 | 86.06 | 4608 | [55] |
| Rainfall (mm) | |||||
|---|---|---|---|---|---|
| 20-Day | 10-Day | 7-Day | 5-Day | 3-Day | 24-h |
| (337.6 to 379.8) | (161.5 to 189.7) | (111.3 to 129.2) | (84.6 to 98.8) | (52.1 to 62) | (0 to 51) |
| Local Magnitude (ML) | No. of Events | Total | |
|---|---|---|---|
| Independent | Aftershock of Gorkha Earthquake | ||
| ≥6 | - | 1 | 1 |
| 5–5.9 | - | 17 | 17 |
| 4–4.9 | 14 | 131 | 145 |
| EQ | LS | DF | FD | GF | TR | |
|---|---|---|---|---|---|---|
| EQ | - | ✓ | - | ✓ | ✓ | - |
| LS | - | - | - | ✓ | - | - |
| DF | - | - | - | ✓ | - | - |
| FD | - | ✓ | - | - | - | - |
| GF | - | ✓ | ✓ | ✓ | - | - |
| TR | ✓ | ✓ | ✓ | - | - |
Publisher’s Note: MDPI stays neutral with regard to jurisdictional claims in published maps and institutional affiliations. |
© 2021 by the authors. Licensee MDPI, Basel, Switzerland. This article is an open access article distributed under the terms and conditions of the Creative Commons Attribution (CC BY) license (http://creativecommons.org/licenses/by/4.0/).
Share and Cite
Lamichhane, S.; Aryal, K.R.; Talchabhadel, R.; Thapa, B.R.; Adhikari, R.; Khanal, A.; Pandey, V.P.; Gautam, D. Assessing the Prospects of Transboundary Multihazard Dynamics: The Case of Bhotekoshi–Sunkoshi Watershed in Sino–Nepal Border Region. Sustainability 2021, 13, 3670. https://doi.org/10.3390/su13073670
Lamichhane S, Aryal KR, Talchabhadel R, Thapa BR, Adhikari R, Khanal A, Pandey VP, Gautam D. Assessing the Prospects of Transboundary Multihazard Dynamics: The Case of Bhotekoshi–Sunkoshi Watershed in Sino–Nepal Border Region. Sustainability. 2021; 13(7):3670. https://doi.org/10.3390/su13073670
Chicago/Turabian StyleLamichhane, Suraj, Komal Raj Aryal, Rocky Talchabhadel, Bhesh Raj Thapa, Rabindra Adhikari, Anoj Khanal, Vishnu Prasad Pandey, and Dipendra Gautam. 2021. "Assessing the Prospects of Transboundary Multihazard Dynamics: The Case of Bhotekoshi–Sunkoshi Watershed in Sino–Nepal Border Region" Sustainability 13, no. 7: 3670. https://doi.org/10.3390/su13073670
APA StyleLamichhane, S., Aryal, K. R., Talchabhadel, R., Thapa, B. R., Adhikari, R., Khanal, A., Pandey, V. P., & Gautam, D. (2021). Assessing the Prospects of Transboundary Multihazard Dynamics: The Case of Bhotekoshi–Sunkoshi Watershed in Sino–Nepal Border Region. Sustainability, 13(7), 3670. https://doi.org/10.3390/su13073670