Abstract
Traditional Cambodian food has higher nutrient balances and is environmentally sustainable compared to conventional diets. However, there is a lack of knowledge and evidence on nutrient intake and the environmental greenness of traditional food at different age distributions. The relationship between nutritional intake and environmental impact can be evaluated using carbon dioxide (CO2) emissions from agricultural production based on life cycle assessment (LCA). The objective of this study was to estimate the CO2 equivalent (eq) emissions from the traditional Cambodian diet using LCA, starting at each agricultural production phase. A one-year food consumption scenario with the traditional diet was established. Five breakfast (BF1–5) and seven lunch and dinner (LD1–7) food sets were consumed at the same rate and compared using LCA. The results showed that BF1 and LD2 had the lowest and highest emissions (0.3 Mt CO2 eq/yr and 1.2 Mt CO2 eq/yr, respectively). The food calories, minerals, and vitamins met the recommended dietary allowance. The country’s existing food production system generates CO2 emissions of 9.7 Mt CO2 eq/yr, with the proposed system reducing these by 28.9% to 6.9 Mt CO2 eq/yr. The change in each food item could decrease emissions depending on the type and quantity of the food set, especially meat and milk consumption.
1. Introduction
1.1. General Background
Traditional Cambodian food has not been popularized even though it provides a high nutrient intake of calories, minerals, and vitamins. In addition, this traditional food is environmentally sustainable compared to conventional food consumption, considering carbon dioxide (CO2) emissions based on land and water use for agricultural production [1,2]. However, there is a lack of knowledge and evidence on nutrient intake and environmental greenness in favor of traditional food at various age distributions in Cambodia. To confirm the nutritional intake with environmental greenness, it is essential to evaluate traditional Cambodian food consumption patterns for CO2 emissions. Food production systems impact both the environment and human health. The environmental impact is caused by human activities emitting carbon dioxide emissions that contribute to climate change [3,4]. The carbon dioxide emissions of Cambodia amount to 65.6 Mt CO2 equivalent, contributing 0.13% to global data [5] of CO2 from agriculture, industry, etc.
1.2. Cambodia Geography, Food Nutrient Issues, and Carbon Dioxide Emissions
Cambodia is a southeast Asian country with a population of 16.5 million as of 2019 [6]. The country spans 18.1 million ha (Mha), with a land area of 17.7 Mha and an inland area of 0.5 Mha. The land area is used for agriculture, organic agriculture, and forestry. In this regard, the agricultural land area is 5.6 Mha, of which 4.1 Mha are engaged in cropland, with arable land covering 3.9 Mha. The agricultural sector contributes 20.8% to the national economy, consisting of crops (57.7%), livestock and poultry (11.1%), fishery (24.3%), and forestry (6.9%). Paddy land spans 3.3 Mha, land for vegetable crops covers 0.2 Mha, and land for fruit occupies 0.2 Mha. The freshwater fish resource is from the Mekong River and the Tonle Sap lake (Great Lake) [7,8,9,10]. However, food intake is still insufficient for the Cambodian nation, and food nutrition security is a challenge.
Food intake is defined as food for calories, minerals, and vitamins. Food calories are consumed at a rate of 2940 kcal/capita/day worldwide, 2850 kcal/capita/day in developing countries, 3060 kcal/capita/day in East Asia, and 2700 kcal/capita/day in South Asia [11]. However, the food supply is 2472 kcal/capita/day, protein supply is 65.4 g/capita/day, and fat supply is 32.8 g/capita/day in Cambodia [12]. In Cambodia, the total calorie intake is 2411 kcal/person. Calorie intake from rice consumption is 1520 kcal; from meat, milk, and egg, 124 kcal; from fish and fish products, 74 kcal; from fruits and vegetables, 57 kcal; and vegetable oil, 135 kcal [13]. According to the Cambodian Demographic Health Survey, malnutrition has the greatest effect on women and children under 5 years of age. Based on body mass index calculations, across Cambodia 32% of children under 5 years of age are affected by stunting, 10% are affected by wasting, and 24% are underweight. Moreover, 14% of women are underweight and 18% are overweight [14]. Adults suffer from obesity and diabetes. The obesity rates of men and women were 2.7% and 4.8%, respectively. In addition, 7.4% of men and 6.9% of women have diabetes [15,16]. In a rural area, women have high levels of anemia, which is related to food consumption and a lack of education [15]. Moreover, 26.9% of garment workers had anemia, and 34.4% were underweight. They have no access to safe food and consume nutritionally unbalanced food, with 18% of interviewees stating that their food was not hygienic and secure [16]. They consume lower amounts of vegetables, fruits, and milk which are defined as food for minerals and vitamins.
Food types and sizes affect human health and environmental conditions. Staple food diets that do not contain a correct balance of meat (beef, chicken, pork, and fish), eggs, fat or oil, vegetables, fruit, and milk lead to malnutrition and environmental impacts because these diets are associated with food production, consumption, and the environment. These diets cause their consumers to be underweight, overweight, and nutritionally deficient due to hunger, overconsumption, or poor food types and dish serving size. High levels of nutrient-rich foods, such as cereals, fruits, vegetables, and low-fat meat and dairy products have been associated with several favorable health outcomes in adults, including a decreased prevalence of obesity [17]. Low-nutrient dense diets with a high intake of sweets, desserts, and high-fat dairy products correlate with higher obesity rates and poor nutritional status in older adults [18]. Therefore, it is important to make food more environmentally friendly to attract the younger population. Global greenhouse gases such as CO2 are a concern and a deciding factor in the adoption of green food production methods for the benefit of the environment.
Global greenhouse gas emissions are 52.4 billion tons CO2 eq, 26% of which are related to food production. The emissions from food are due to land use (24%), crop production (27%), livestock and fish farms (31%), and supply chains (18%) [19]. Cambodia’s greenhouse gas emissions are accounted for by land use change and forestry (47.6%), agriculture (36.4%), energy (14.1%), industry (1.2%), and waste (0.7%) [5,20]. Thus, greenhouse gases from agriculture amount to 9.3 million t (Mt) CO2 eq originating from enteric fermentation, agricultural soil, synthetic nitrogen fertilizers, manure management, and crop residues [9]. Consequently, methane emissions from rice fields are 0.4 Mt, and the total global warming potential was 11.7 Mt from paddy rice soil [21]. It is necessary to analyze overall global greenhouse gas emissions with agricultural production, and life cycle assessment (LCA) is one of the best ways to understand environmental effects.
LCA is an analysis tool that is used to indicate the environmental impact of an agriculture or production system. Various foods have been studied for their environmental impact depending on the quantity of food set as a diet menu, nutrient pattern, and food consumption pattern [22,23,24]. Through environmental impact assessments, traditional Cambodian foods can be adapted to suit young and environmentally aware populations.
1.3. Objective of the Study
The type and quantity of food consumption not only affects human health through malnutrition and but also has environmental impacts. Carbon dioxide emissions are linked to the type and quantity of food consumption. This study uses LCA to study both the nutritional value and environmental impact of traditional Cambodian diets. This was completed using 12 sets of traditional Cambodian food, including five breakfast (BF) sets and seven lunch and dinner (LD) sets. The nutritional content of each diet, including calories, minerals, vitamins, and associated carbon dioxide emissions, were evaluated.
2. Materials and Methods
2.1. Nutrient Requirement
Carbohydrates, proteins, fats, and oils are sources of calories from food. Carbohydrates are the primary energy source from cereals and cereal products (rice, rice noodles, bread, etc.). They consist of 45–65% of the total calorie intake; however, 25% of the total calories come from sugar. Proteins come from fish, meat, and beans, with a daily consumption of 0.8 g (10% to 20% of total calories) multiplied by the weight (kg) of the human body. Moreover, fat is divided into saturated fat (fat) and unsaturated fat (oil), which consists of 25–30% of the total calories. However, saturated fat is separated from animal sources that consume less than 7% of the total calories [25,26,27,28,29,30]. Therefore, minerals and vitamins are derived from vegetables, milk, and/or fruits [31]. In a case study in Cambodia, the food consumption for calories was normal; however, the food consumption for minerals and vitamins was unbalanced. Consumers had mineral and vitamin deficiency problems [26,31,32]. The food quantity was calculated based on the food contents of calories, minerals, and vitamins contained in one set of traditional Cambodian food. Food self-sufficiency in rice has ensured adequate calories per person per day from domestic production. The food set is dependent on the quantity of food and food items that were able to reduce malnutrition and environmental issues and related to agricultural production and food consumption. Therefore, the food set was divided into two groups according to consumer age of G1 and G2 in Cambodia.
2.2. Food Dietary
The food set of traditional Cambodian food consisted of food items and the of food serving size. Food items included staple food (rice and/or wheat), meat (beef, chicken, pork, and/or fish), poultry eggs, vegetable cooking oil, vegetables, spices, fruit, and milk. Cambodian cuisine includes a soup menu, stir-fry menu, a roasting menu, and a toasting menu [33]. The food serving size was based on food for calories, vitamins, and minerals and consumer age. Therefore, the food set was consumed two to three times a day to fulfill food needs for calories, vitamins, and minerals. Many Cambodian dishes are served with rice, noodles, or bread, depending on the menu and individual preference. The cuisine taste is balanced between salty, sweet, sour, bitter, and spicy [1,33,34]. Malnutrition is induced by unbalanced of diet habits, so a quantity of staple foods, meat, poultry eggs, cooking oil, vegetables, fruits, and milk was provided. Adequate nutrition is an essential human need, affecting health and well-being through dietary intake from food for calories and food for minerals and vitamins [16,17,18]. The food set was calculated to estimate the food needed for calories, minerals, and vitamins according to the food serving size, consumers’ age, estimated land use, water use, and carbon dioxide emission equivalent.
2.3. Calculation of Food for Calories, Food for Minerals and Vitamins, and Food Consumption
The concept of this study focused on the necessary food serving size and food items to meet requirements for calories and minerals and vitamins, which are a priority to decrease malnutrition and reduce environmental impact. According to the Cambodian population by age, participants were divided into two consumer groups (G1 and G2). The food set included five breakfast (BF1–5) and seven lunch and dinner (LD1–7) food sets to calculate the food consumption and food items that were converted to food production. Therefore, the food production system was analyzed using land requirements and water use according to the yield of production, product requirements, and/or quantity of animals. After that, the land requirement and animal quantity were calculated to estimate the greenhouse gas (GHG) emissions of carbon dioxide equivalent (CO2 eq) (Figure 1).
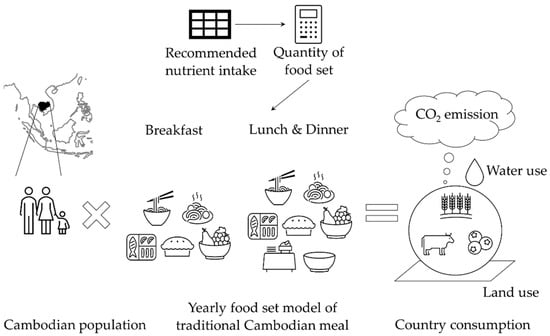
Figure 1.
Food consumption pattern in traditional Cambodian foods for estimating CO2 emissions.
Figure 2 illustrates the system boundary through the production stage referred to as the quantity of food production to calculate the land and water use. Moreover, the emission of carbon dioxide equivalents was calculated based on production. Production was focused on cereals, vegetables, fruit plantations, and animal raising (cattle, poultry, pig, and fish) based on the land area used for planting and raising animals for food consumption. Based on traditional Cambodian food (one food set), the serving size was set to calculate the food consumption of cereals (staple food, such as rice and wheat), meat, eggs, cooking oil, vegetables, fruits, and milk. The staple food, vegetable, and fruit consumption were converted to food production to calculate the plantation’s land area. Moreover, meat, egg, and milk consumption were converted to food production to calculate the number of animals reared. The number of animals depended on the weight of the animal carcass and the yield of egg and milk per animal. The cattle, poultry, pig, fish, egg, and milk yield were 120 kg/head. 1.14 kg/head, 50 kg/head [9], 1 kg/head, 98 eggs = 4.878 kg/animal [9], and 1650 kg/animal [35], respectively.
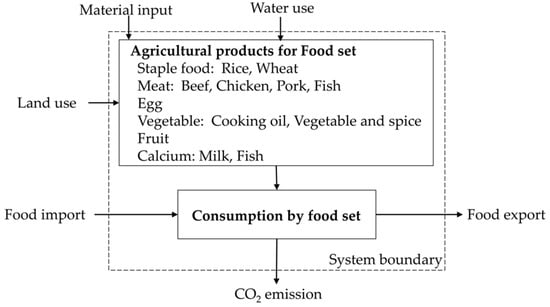
Figure 2.
System boundary in the agricultural production of traditional Cambodian foods to evaluate CO2 emissions.
The Cambodian population was divided into two groups by consumer age category (G1: age nine years and below; G2: age ten years and over) to calculate the food required for calories and the food required for minerals and vitamins (Table 1). The recommended nutrient intakes as food for calories and food for minerals and vitamins were studied in terms of staple food, meat, egg, cooking oil, vegetable, fruit, calcium as milk, and fish consumption. The food item was defined using existing and proposed scenarios to account for the carbon dioxide emission equivalent. In this study, two scenarios are discussed: the existing scenario is based on Cambodia data [9] and the proposed scenario is dependent on the food set (Table 2).

Table 1.
Cambodian population by age in 2019 [6].
Table 2.
Traditional Cambodian food sets divided into breakfast, lunch, and dinner (BF, LD) with two groups for age classification (G1 and G2) [1].
The amount of carbohydrates, proteins, and fats or oils consumed was equal to 100% of the food consumed by calories. According to the Ministry of Health, Labor, and Welfare and the Food and Agriculture Organization (FAO), fats or oils and proteins accounted for 30% and 10% of calories consumed, respectively. Therefore, the rest came from carbohydrates (60%). Consumers consumed carbohydrates, proteins, and fats or oils depending on the food nutrient composition [25,26,27,28,29,30].
Foods consumed for minerals and vitamins varied according to the age of the population. Therefore, 100 g/day was the minimum consumption of vegetables and fruits for G1, and 400 g/day was the minimum consumption of vegetables and fruits for G2. The amount of milk consumed was between 50 and 300 mL/day, and it was consumed to meet calcium (Ca) requirements.
The food for calories, minerals, and vitamins was calculated depending on the total food consumption and nutrient composition. The nutrient composition includes values for carbohydrate; protein; fat; calcium; iron; zinc; and vitamin A, D, B, and C (Table A1).
The items in traditional Cambodian food are defined by the Cambodian food consumption pyramid. Staple foods such as rice, rice noodles, or wheat are referred to as carbohydrates. Meat or fish and eggs are referred to as proteins, and cooking oil is referred to as fat. Moreover, vegetables, fruits, milk, and fish are referred to as sources of vitamins and minerals. The quantity of food eaten per person was divided into three meals—breakfast, lunch, and dinner—according to the total of food consumed for calories [1,26,31].
The traditional Cambodian food set consists of food for calories and food for minerals and vitamins (Table 2). The food for calories included breakfast (BF) and lunch and dinner (LD) menus that contained staple foods, meats, eggs, and/or cooking oil. The food eaten for minerals and vitamins contained vegetables and spices (VESP), fruit, and milk. Therefore, staple food consisted of rice and wheat. The meat was composed of beef, chicken, pork, and/or fish, which is referred to as protein.
The annual intake included the food sets of BF1–5 and LD1–7. Ordinarily, consumers consume food sets three times per day, with BF once per day and LD twice per day. BF was set to 73 times the annual intake/set/yr, and the total annual intake of BF was 365 times/yr. LD was set to 104 times the annual intake/set/yr, and the total annual intake of LD was 730 times/yr (Table 2). Therefore, the annual intake changed depending on the number of food sets selected from the BF and LD. Consequently, the quantity of food produced changed according to the annual intake.
This study was focused on one food set of traditional Cambodian food. Imported foods were not included in this mass balanced because wheat and milk production did not satisfy food needs. Cambodia is a tropical country where wheat cannot be cultivated. The milk production was not enough for consumption because of its limited and low production.
The carbon dioxide equivalent estimation was calculated with SimaPro® v8.0.4 using the global warming potential for a 100-year time horizon as the environmental impact category. The LCA methodology in this study followed the study framework in ISO14040.
3. Results
Traditional Cambodian food sets consist of 12 food sets categorized into five breakfast food sets (BF1–5) and seven lunch and dinner (LD1–7) food sets, which include food for calories, minerals, and vitamins. The food sets of food for calories consist of staple food, food menu, cooking oil, and food eaten for minerals and vitamins, such as vegetables, spices, fruits, and milk. Therefore, the food set called BF1 included chicken congee, fruit, and milk. BF2 consisted of Khmer fish noodle soup, fruit, and milk. BF3 included rice with fried pork, fruit, and milk. BF4 included beef noodle soup, fruit, and milk. Finally, BF5 included a Khmer sandwich, fruit, and milk. LD1 included samlor kako Khmer stew, fruit, and milk. LD2 included beef lemongrass sour soup, fruit, and milk. LD3 included samlor brahaer Khmer stew, fruit, and milk. LD4 included fried fish with ginger, fruit, and milk. LD5 included braised fish with tomato, fruit, and milk. LD6 included waterlily sour soup, fruit, and milk. Lastly, LD7 included stir-fry beansprouts, fruits, and milk. The serving size depended on the consumer’s age. For G1, it was 200–205 g/set, and for G2 it was 330–335 g/set (Table 3). Therefore, the nutrient requirements include typical food eaten for calories, minerals, and vitamins (Table A2). Nutrition value is dependent on the food composition, such as carbohydrates, protein, fat, calcium, iron, zinc, vitamin A, vitamin B, vitamin C, and vitamin D (Table A1). Normally, consumers consume three food sets per day to satisfy the nutrient requirements for their daily life.
Table 3.
Foods eaten for calories, minerals, and vitamins based on food set, including fruit and milk consumption.
Traditional Cambodian food (one set of food) consists of food eaten for calories and food eaten for minerals and vitamins and is dependent on food composition and the quantity of food items eaten. Food eaten for calories (carbohydrate, protein, and fat), minerals (Ca, Fe, and Zn), and vitamins (A, D, B1, B2, B3, B6, B9, B12, and C) is divided into two major categories (BF and LD) and two age groups (Table 3). The average calorie count of one food set for G1 consumers was 307 kcal/set, which consisted of 50 g of carbohydrate, 11 g of protein, and 6 g of fat. The same food set contains minerals (82 mg of Ca, 4 mg of Fe, and 1 mg of Zn), and vitamins (105 µg of A, 13 µg of D, 0.2 µg of B1, 0.2 mg of B2, 2.8 mg of B3, 0.3 mg of B6, 30 µg of B9, 0.5 µg of B12, and 26 mg of C). Additionally, the average calorie count of one food set for G2 consumers was 540 kcal/set, which consisted of 91 g of carbohydrate, 22 g of protein, 8 g of fat, minerals (127 mg of Ca, 6.8 mg of Fe, and 2.3 mg of Zn), and vitamins (186 µg of A, 25 µg of D, 0.3 µg of B1, 0.3 mg of B2, 5.5 mg of B3, 0.5 mg of B6, 57 µg of B9, 0.9 µg of B12, and 37 mg of C) (Table 3; Figure 3). Both consumers went beyond the minimum and maximum food nutrition requirements.
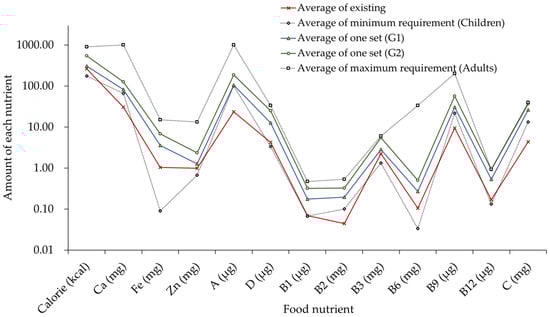
Figure 3.
Food nutrient requirements and compositions according to the food sets eaten in the existing [12,26] and proposed scenarios compared with the minimum and maximum requirements [36].
Instead of the food set selection, three sets listed as BF1 + LD1 + LD3 were consumed every day. The results showed foods eaten for calorie intake and foods eaten for mineral and vitamin intake. Thus, food selection could change according to consumers’ preferences. In one day, the G1 consumers consumed 907 kcal of food for calories, which included 153 g of carbohydrates, 35 g of protein, 14 g of fat. Food eaten for minerals included 257 mg of Ca, 5.6 mg of Fe, and 3.3 mg of Zn. Food eaten for vitamins included 328 µg of A, 5.5 µg of D, 0.7 µg of B1, 0.7 mg of B2, 11 mg of B3, 0.9 mg of B6, 82 µg of B9, 1.5 µg of B12, and 77 mg of C. For G2 consumers, the calorie intake per day was 1620 kcal, which included 280 g of carbohydrates, 67 g of protein, and 22 g of fat. Food eaten for minerals included 402 mg of Ca, 9.9 mg of Fe, and 5.9 mg of Zn, and food eaten for vitamins included 588 µg of A, 93.5 µg of D, 1 µg of B1, 1.1 mg of B2, 21.1 mg of B3, 1.6 mg of B6, 150 µg of B9, 2.4 µg of B12, and 108 mg of C.
In the proposed scenario, rice, rice noodles, wheat, chicken, pork, fish, egg, cooking oil, vegetables, fruit, and milk were eaten in amounts of 1.18 Mt, 0.20 Mt, 0.10 Mt, 0.12 Mt, 0.07 Mt, 0.13 Mt, 0.52 Mt, 0.05 Mt, 0.04 Mt, 1.48 Mt, 0.84 Mt, and 0.34 Mt, respectively. Therefore, the proposed scenario consumption was based on the food set and the quantity of food items eaten (Table 2 and Table 4; Figure 4).
Table 4.
Total food consumption according to the quantity of food sets eaten per person annually.
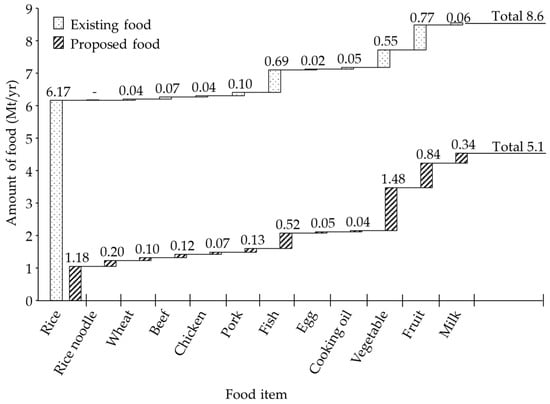
Figure 4.
Food balance of the existing [8,9] and proposed scenarios to fulfill the nutrient requirements.
The Cambodian GHG emissions of carbon dioxide equivalent from the proposed food set were 6.9 Mt/y. The highest emission was 1.2 Mt for LD2, and the lowest was 0.3 Mt for BF1 and BF2. Therefore, BF4, LD7, and LD1 had emissions of 0.9 Mt, 0.8 Mt, and 0.7 Mt, respectively. Both BF4 and LD4 had emissions equal to 0.5 Mt, and BF5, LD3, LD5, and LD6 had emissions equal to 0.4 Mt (Figure 5).
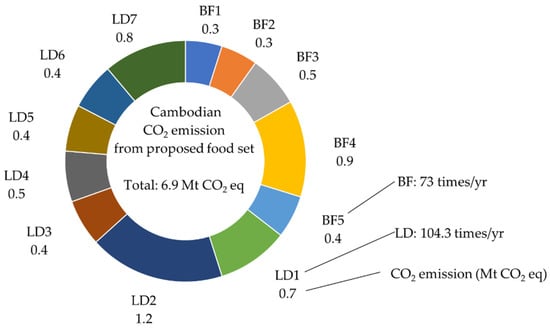
Figure 5.
The quantity of total emissions of CO2 eq based on the food set emissions multiplied by annual intake and population size (proposed scenario).
The mass balance of the existing and proposed scenarios according to land use, water use, and CO2 emissions showed the supply to be 8.6 Mt, including an import of 0.2 Mt and an export of 0.6 Mt. Based on the supply, 4.1 Mha for land use, 17.1 Gt for water use, and 9.7 Mt CO2 eq for emitted CO2 emissions were required. However, the result for the proposed scenario showed that the consumption was 5.1 Mt, including the import of wheat and milk products. Depending on the supply required, 2.3 Mha for land use, 6.8 Gt for water use, and 6.9 Mt CO2 eq for CO2 were emitted (Figure 6). For the proposed scenario, the result showed the consumption of staple foods, meat, eggs, vegetables, fruits, and milk to be 1.48 Mt, 0.84 Mt, 0.05 Mt, 1.52 Mt, 0.84 Mt, and 0.34 Mt, respectively, with land uses of 0.88 Mha, 0.78 Mha, 0.08 Mha, 0.16 Mha, 0.06 Mha, and 0.38 Mha, respectively, and water uses of 3.00 Gt, 2.38 Gt, 0.03 Gt, 0.17 Gt, 0.13 Gt, and 0.91 Gt, respectively (Table 5).
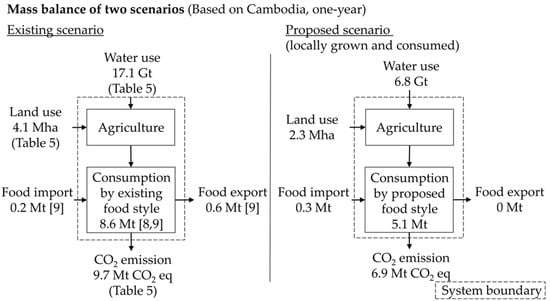
Figure 6.
Mass balance of the existing and proposed scenarios for land use, water use, and CO2 emissions.
Table 5.
Total food consumption, land use, water use, and emissions of carbon dioxide equivalent according to the existing and proposed scenarios (Table A4).
For the proposed scenario, the result showed the consumption of staple foods, meat, eggs, vegetables, fruits, and milk to be 1.48 Mt, 0.84 Mt, 0.05 Mt, 1.52 Mt, 0.84 Mt, and 0.34 Mt, respectively, with land uses of 0.88 Mha, 0.78 Mha, 0.08 Mha, 0.16 Mha, 0.06 Mha, and 0.38 Mha, respectively, and water uses of 3.00 Gt, 2.38 Gt, 0.03 Gt, 0.17 Gt, 0.13 Gt, and 0.91 Gt, respectively (Table 5).
For the total GHG emissions of carbon dioxide equivalent in the existing scenario, the total emissions of carbon dioxide were 9.7 Mt CO2 eq/yr, in which staple foods, meat, eggs, vegetables, fruits, and milk had values of 5.3 Mt, 2.93 Mt, 0.05 Mt, 0.78 Mt, 0.41 Mt, and 0.24 Mt, respectively. However, in the proposed scenario the total carbon dioxide emissions were 6.9 Mt CO2 eq/yr, of which staple foods, meat, eggs, vegetables, fruits, and milk had values of 1.12 Mt, 3.16 Mt, 0.09 Mt, 0.99 Mt, 0.28 Mt, and 1.25 Mt, respectively (Table 5; Figure 7; Table A4 and Table A5).
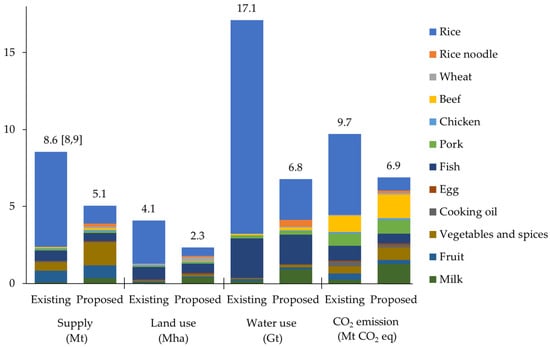
Figure 7.
Consumption of food based on supply, land use, water use, and CO2 emissions for the existing and proposed scenarios.
4. Discussion
In the proposed scenario, the food consumed for calories per one set had an average of 307 to 540 kcal/set (Table 3; Figure 3), which was higher than the average in the existing scenario. Moreover, the amount of food consumed for minerals and vitamins in the proposed scenario was the higher than in the existing scenario [12,26].
One set had food consumed for calories from 591 to 793 kcal/set, containing 100 to 112 g of carbohydrate, 16 to 30 g of protein, and 12 to 24 g of fat. Then, the minerals included 4 to 12 mg of Fe, and the vitamins included 61 to 799 µg of A, 29 to 477 µg of B9, and 24 g of C [1,36,37,38].
The food consumed for calories was defined by the consumer age and physical activity [26,27,28,29,30]. From 1 to 9 years of age, the food consumed for calories was between 1180 and 1825 kcal/day [24]. From 1 to 5 years of age, the food consumed for calories was between 950 and 1300 kcal/day. Therefore, from 6 to over 80 years old, the food consumed for calorie intake was defined according to the physical activity level [28]. Food consumed for minerals and vitamins was defined between the minimum and maximum requirements [29,37]. The individual intake guideline includes 5–12 g of carbohydrate/set/kg body weight, 1.2–1.8 g of protein/set/kg body weight dependent on physical activity, and 20–30% of the total calories required [39]. The food consumed for calories and the food consumed for minerals and vitamins was beyond the minimum and maximum requirements (Table A2).
In the existing scenario, food items consisted of rice, wheat, meat, eggs, cooking oil, vegetables, fruits, calcium as milk, and fish. The Cambodian data in 2017 [9] showed that the food supply of each food item was equal to the demand and other (processing, feed, seed, non-food, and stock) was equal to the production and import, excluding export. The rice was required 6.17 Mt/y of supply. The wheat, beef, chicken, pork, fish, eggs, cooking oil, vegetables, fruits, and milk accounted for 0.04 Mt, 0.07 Mt, 0.04 Mt, 0.10 Mt, 0.69 Mt, 0.02 Mt, 0.05 Mt, 0.55 Mt, 0.77 Mt, and 0.06 Mt, respectively. We do not have data concerning rice noodles yet (Figure 4; Table A3). According to the Ministry of Health and the Foundation for International Development/Relief, individuals of ages from 6 to 17 years old in a rural area consumed 74.6% carbohydrates, 11% proteins, and 14.4% fats. However, in an urban area they consumed 70.5% carbohydrates, 11.8% proteins, and 17.7% fats [26]. Moreover, the annual food intake per person was 300 kg of rice, 27 kg of meat, 27 kg of fish, and 91 kg of vegetables [34]. The total food consumption in the proposed scenario was less than in the existing one.
According to the food set, land and water use for plantation and raising and emissions of carbon dioxide equivalent (CO2 eq) were estimated. For the existing scenario, the rice produced 6.17 Mt and required 2.79 Mha of land use [8,9] and 13.88 Gt of water use [19]. Data for rice noodles have not yet been reported [8,9]. The consumption of wheat, meat, egg, vegetables, fruit, and milk was 0.04 Mt, 0.09 Mt, 0.02 Mt, 0.60 Mt, 0.77, and 0.06 Mt, respectively, with land uses of 0.11 Mha, 0.93 Mha, 0.04 Mha, 0.09 Mha, 0.06 Mha, and 0.06 Mha, respectively, and water uses of 0.02 Gt, 2.86 Gt, 0.01 Gt, 0.08 Gt, 0.12 Gt, and 0.15 Gt, respectively (Table 5; Figure 7).
In the proposed scenario, the average for G1 and G2 per week was emitted CO2 eqs of 5.42 kg/week and 9.47 kg/week, respectively (Table A5), which were lower than the values for the Mediterranean and new Nordic diets. However, the Mediterranean and new Nordic diets had emitted carbon dioxide emissions of 23.56 kg CO2 eq/week and 25.8 kg CO2 eq/week, respectively. These emissions were calculated from the individual food categories of beef, egg, milk, margarine, potatoes, pasta, assorted fruits, and tap water [24]. Therefore, the carbon dioxide emissions per product, including cereal, rice, beef, chicken, pork, fish, egg, butter, vegetable, fruit, and milk, were 0.50 kg, 2.55 kg, 26.61 kg, 3.65 kg, 5.77 kg, 3.49 kg, 3.46 kg, 9.25 kg, 0.37 kg, 0.42 kg, and 1.29 kg, respectively [19]. The emissions from fast food, pizza, were 3.5 kg CO2 eq/kg pizza, in which cheese, meat, and solid fat made up 43%, 21%, and 21%, respectively [40]. Therefore, the dairy emissions were 0.37 kg CO2 eq. Therefore, the global warming potential of carbon dioxide emissions were 1.09 kg for a ready meal and 0.99 kg for homemade chicken. The ready meal, tomato pasta, caused 0.12 kg, and the home made meal caused 0.11 kg [41]. However, in the proposed scenario the CO2 eq kg/kg was higher than the emissions from ready meal, tomato pasta, and homemade chicken.
The global GHG emissions by sector were 49.4 billion t CO2 eq, which included energy, industry, waste, and agriculture and land use at amounts pf 73.2%, 5.2%, 3.2%, and 18.4%, respectively. The global land use for livestock (meat and dairy) and crops was 77% and 23% of all agricultural land, accounting for 18% and 82% of calories supplied, and 37% and 63% of the protein supply, respectively [19]. Consequently, the global GHG emissions from non-food and food were 74% and 26%, respectively. The supply chain emissions, livestock and fish farms, crops, and land uses were 18%, 31%, 27%, and 24% of food, respectively. In the supply chain, the GHG emissions were high, accounting for high carbon dioxide equivalents from farms per kilogram of product. Instead of beef, the total GHG emissions were 60 kg CO2 eq/kg product, which included land use, animal feed, farm, processing, transport, packaging, and retail of 16.3 kg, 1.9 kg, 39.4 kg, 1.3 kg, 0.3 kg, 0.2 kg, and 0.2 kg, respectively. Moreover, the total GHG emissions from pig meat, poultry meat, fish (farm), other vegetables, and other fruits were 7.2 kg, 6.1 kg, 5.1 kg, 0.5 kg, and 0.7 kg, respectively [19]. In Cambodia, the 2016 carbon dioxide emissions equivalent was 65.6 Mt, which included emissions from agriculture, land use change and forestry, transport, and other (bunker fuel, industry, waste, building, electricity, and heat, fumes from energy production, construction energy, and other types of fuel combustion) of 21.0 Mt, 30 Mt, 5.0 Mt, and 9.6 Mt, respectively [20]. Therefore, in Cambodia the 2016 GHG emissions for agriculture, land use change and forestry, other fuel combustion, waste, and fugitive emission and industry were 17.09 Mt, 5.37 Mt, 2.8 Mt, 0.28 Mt, and 0 Mt for methane emissions, respectively, and 3.89 Mt, 1.88 Mt, 0.67 Mt, 0.26 Mt, and 0 Mt for nitrous oxide, respectively [20]. According to Ritchie and Roser, the per person methane emissions of CO2 eq based on their global warming potential value over a 100-year timescale was 1.62 Mt. Therefore, the total methane emissions from the rice field were 0.38 Mt [19,21,35,42,43]; in Cambodia, the total emissions from the paddy field were 0.45 Mt for methane emissions and 9.37 Mt for carbon dioxide emissions. Moreover, the total emissions (enteric) from all animals were 0.18 Mt for CH4 emissions, and the CO2 eq was 3.74 Mt [9].
In a comparison between the existing and proposed scenarios, the results showed that the carbon dioxide emissions are expected to reduce from 9.7 Mt in the existing scenario to 6.9 Mt in the proposed one. The land use requirement is reduced from 4.1 Mha in the existing scenario to 2.3 Mha in the proposed scenario, and the water use requirement is reduced from 17.1 Gt in the existing scenario to 6.8 Gt in the proposed one.
5. Conclusions
This research focuses on food consumption for traditional Cambodian food. The food set was defined as the quantity of rice, rice noodles, wheat, beef, chicken, pork, fish, eggs, cooking oil, vegetables, spices, fruits, and milk consumed. Depending on the food consumption in the proposed scenario, the land and water use requirements were reduced by 43.90% and 60.23%, respectively, for agricultural plantation and raising animals to meet the nutrient requirement intake.
The assessment was performed using existing practices and the proposed scenario was divided into BF and LD sets. In these sub-categories, food was divided into two scenarios: food eaten for calories and food eaten for minerals and vitamins. In the proposed scenario, the food eaten for calories, minerals, and vitamins satisfied the food requirements. The carbon dioxide emissions for the traditional Cambodian food set were decreased by 28.87%. Therefore, the food eaten for calories, minerals, and vitamins met the food set quantity requirements. The food set emissions were calculated from the food item intake.
In the proposed scenario, there is an opportunity to reduce land and water use, and the CO2 of the agricultural production system met the nutrient requirements for human health. Furthermore, the LCA-based analysis showed the effectiveness of adopting a diet rich in traditional Cambodian foods to reduce the environmental load for CO2 emissions. This method calculates dietary intake based on food eaten for calories, minerals, and vitamins.
Author Contributions
Conceptualization, R.H.; methodology, R.H., A.S.P., R.I., and R.N.; formal analysis, R.H., A.S.P., and R.I.; resources, R.H., P.L., A.S.P., R.I., T.A., and R.N.; data curation, R.H., and P.L.; writing—original draft preparation, R.H.; writing—review and editing, R.H., P.L., A.S.P., R.I., T.A., and R.N.; supervision, R.N. All authors have read and agreed to the published version of the manuscript.
Funding
This research received no external funding, and the APC was funded by the University of Tsukuba, Japan.
Institutional Review Board Statement
Not applicable.
Informed Consent Statement
Not applicable.
Data Availability Statement
Data for the existing scenario were supplied by the Ministry of Agriculture, Forestry and Fisheries (MAFF, Cambodia); National Institute of Statistics (NIS); Ministry of Planning and FAOSTAT, Cambodia. MAFF, Cambodia was “Annual Report of Agriculture in Cambodia” at https://elibrary.maff.gov.kh/book/5eaa3815b825e (accessed on 1 November 2020); NIS was “Cambodian Population” at http://www.nis.gov.kh/index.php/km/15-gpc/79-press-release-of-the-2019-cambodia-general-population-census (accessed on 1 June 2020) and FAOSTAT; Cambodian was “About Food Balance Sheet of All Foods, Food Supply of All Foods, Commodity Balance sheet of Crop, Livestock, and Fish, in Cambodia” at http://www.fao.org/faostat/en/#data (accessed on 8 February 2019).
Acknowledgments
Faculty of Agro-Industry, Royal University of Agriculture, Ministry of Agriculture, Forestry and Fisheries, Cambodia, Graduate School: Life and Environmental Sciences, University of Tsukuba, Japan, and MEXT Scholarship, Ministry of Education, Culture, Sports, Science and Technology, Japan.
Conflicts of Interest
The authors declare no conflict of interest.
Abbreviation
| BF | Breakfast |
| CO2 eq | Carbon dioxide equivalent |
| GHG | Greenhouse gas |
| Gt | Gigaton |
| LCA | Life cycle assessment |
| LD | Lunch and dinner |
| Mha | Million hectares |
| Mt | Million ton |
| VESP | Vegetables and spices |
| yr | Year |
Appendix A
Table A1.
Food composition of each food item based on 100 g of product [36,37,38].
Table A1.
Food composition of each food item based on 100 g of product [36,37,38].
| Food Set | Food for Calories | Food for Minerals and Vitamins | ||||||||||||||
|---|---|---|---|---|---|---|---|---|---|---|---|---|---|---|---|---|
| Carbohydrate | Protein | Fat | Calorie | Minerals | Vitamins | |||||||||||
| Ca | Fe | Zn | A | D | B1 | B2 | B3 | B6 | B9 | B12 | C | |||||
| (g) | (g) | (g) | (kcal) | (mg) | (mg) | (mg) | (µg) | (µg) | (µg) | (mg) | (mg) | (mg) | (µg) | (µg) | (mg) | |
| Staple food | ||||||||||||||||
| Rice | 78.4 | 7.2 | 0.8 | 352 | 21 | 1.2 | 0.8 | - | - | 0.1 | 0.0 | 2.2 | 0.2 | 9 | - | - |
| Rice noodle | 24.0 | 1.7 | 0.6 | 111 | 12 | 0.2 | 0.7 | - | - | 0.0 | 0.0 | 1.3 | 0.0 | 3 | - | - |
| Wheat | 71.2 | 10.3 | 1.1 | 341 | 29 | 2.0 | 2.5 | - | - | 0.2 | 0.1 | 1.0 | 0.1 | 44 | - | - |
| Meat | ||||||||||||||||
| Beef | - | 21.3 | 3.5 | 117 | 24 | 2.5 | 2.2 | 66 | 3 | 0.1 | 0.2 | 5.6 | 0.5 | 8 | 1.3 | 0.5 |
| Chicken | 0.2 | 20.4 | 7.1 | 148 | 14 | 0.9 | 0.4 | 20 | - | 0.1 | 0.1 | 8.0 | 0.5 | 9 | 0.3 | 0.3 |
| Pork | 0.2 | 21.0 | 3.6 | 117 | 4 | 1.0 | 2.3 | 4 | 69 | 0.9 | 0.2 | 4.4 | 0.5 | 5 | 1.4 | 1.0 |
| Catfish | 3.1 | 16.0 | 14.7 | 209 | 20 | 0.7 | 0.2 | 374 | 13 | 0.0 | 0.5 | 2.3 | 0.0 | 10 | 2.2 | 0.7 |
| Siamese mud carp fish | 3.6 | 16.7 | 4.4 | 121 | 32 | 0.8 | 1.5 | 247 | 25 | 0.0 | 0.1 | 3.1 | 0.2 | 15 | 1.5 | 1.6 |
| Striped catfish | 1.9 | 14.6 | 16.5 | 215 | 24 | 1.3 | 1.6 | 15 | 13 | 0.0 | 0.2 | 0.8 | 0.1 | 10 | 2.2 | 2.0 |
| Striped snakehead fish | - | 18.2 | 2.7 | 97 | 90 | 0.5 | 0.9 | 203 | 118 | 0.0 | 0.1 | 2.3 | 0.1 | 5 | 1.1 | 1.7 |
| Fish * | 2.2 | 16.4 | 9.6 | 161 | 42 | 0.8 | 1.1 | 210 | 42 | 0.02 | 0.2 | 2.1 | 0.1 | 10 | 1.8 | 1.5 |
| Egg | 1.7 | 12.9 | 10.5 | 155 | 47 | 2.4 | 0.9 | 237 | 5 | 0.1 | 0.2 | 0.4 | 0.3 | 80 | 0.9 | - |
| Cooking oil | ||||||||||||||||
| Coconut milk | 31.7 | 7.7 | 56.0 | 666 | 20 | 1.6 | 0.7 | - | - | 0.0 | 0.0 | 0.1 | 0.0 | 16 | - | 0.5 |
| Vegetable oil | - | - | 100.0 | 900 | - | 0.1 | 0.7 | - | - | - | - | - | 0.0 | - | - | - |
| Vegetables | ||||||||||||||||
| Amaranth spineless | - | 3.7 | 0.5 | 43 | 192 | 3.4 | 0.9 | 255 | - | 0.0 | 0.3 | 0.9 | 0.2 | 85 | - | 43.0 |
| Banana flower | 2.3 | 1.6 | 0.5 | 42 | 44 | 0.9 | 0.3 | 16 | - | 0.3 | 0.0 | 0.6 | 0.4 | 25 | - | 11.0 |
| Carrot | 5.3 | 1.5 | 0.3 | 51 | 56 | 1.1 | 0.5 | 313 | - | 0.1 | 0.1 | 0.6 | 0.1 | 19 | - | 11.8 |
| Chinese radish | 3.3 | 0.9 | 0.2 | 21 | 37 | 0.7 | 0.2 | - | - | 0.0 | 0.0 | 0.4 | 0.1 | 25 | - | 25.8 |
| Cucumber | 3.2 | 0.8 | 0.1 | 19 | 22 | 0.7 | 0.2 | 8 | - | 0.0 | 0.0 | 0.2 | 0.0 | 7 | - | 8.5 |
| Eggplant | 4.0 | 1.2 | 0.2 | 26 | 22 | 0.6 | 0.2 | 7 | - | 0.1 | 0.1 | 0.6 | 0.1 | 22 | - | 8.7 |
| Ginger | 5.0 | 1.0 | 0.8 | 36 | 36 | 2.0 | 0.3 | - | - | 0.0 | 0.2 | 0.8 | 0.2 | 11 | - | 9.0 |
| Gourd sponge fresh | 3.3 | 0.8 | 0.2 | 20 | 19 | 0.7 | 0.1 | 4 | - | 0.0 | 0.0 | 0.4 | 0.0 | 7 | - | 6.3 |
| Gourd wax | 2.5 | 0.5 | 0.2 | 22 | 23 | 0.3 | 0.1 | - | - | 0.0 | 0.1 | 0.3 | 0.0 | 5 | - | 26.0 |
| Ivy gourd leaf | 1.2 | 3.6 | 0.2 | 37 | 57 | 1.4 | 0.5 | 336 | - | 0.1 | 0.2 | 19 | 0.2 | 36 | - | 13.0 |
| Beansprout | 5.1 | 4.5 | 0.1 | 54 | 28 | 1.3 | 0.5 | 2 | - | 0.1 | 0.1 | 0.9 | 0.1 | 61 | - | 25.7 |
| Pumpkin | 6.2 | 1.0 | 0.3 | 45 | 39 | 0.6 | 0.1 | 139 | - | 0.1 | 0.0 | 0.6 | 0.1 | 16 | - | 14.3 |
| Pumpkin leaf | 1.8 | 3.0 | 0.5 | 35 | 90 | 3.0 | 0.5 | 112 | - | 0.1 | 0.1 | 0.9 | 0.2 | 36 | - | 16.7 |
| Tomato | 3.5 | 0.9 | 0.3 | 23 | 17 | 0.9 | 0.4 | 36 | - | 0.1 | 0.0 | 0.6 | 0.1 | 30 | - | 32.5 |
| Taro | 21.4 | 2.0 | 0.1 | 129 | 59 | 1.0 | 0.8 | 2 | - | 0.1 | 0.1 | 0.8 | 0.3 | 22 | - | 5.3 |
| Unripe banana | 14.7 | 1.2 | 0.5 | 73 | 26 | 0.4 | 0.3 | 15 | - | 0.1 | 0.0 | 0.6 | 0.4 | 25 | - | 31.0 |
| Unripe papaya | 4.3 | 0.8 | 0.1 | 25 | 47 | 0.6 | 0.1 | 1 | - | 0.0 | 0.0 | 0.3 | 0.0 | 37 | - | 32.3 |
| Water lily | 1.1 | 0.8 | 0.4 | 18 | 37 | 0.6 | 0.3 | 15 | - | 0.0 | 0.0 | 0.3 | 0.3 | 8 | - | 6.5 |
| White mushroom | 4.3 | 2.7 | 0.2 | 19 | 11 | 1.2 | 0.5 | 1 | 2 | 0.1 | 0.4 | 3.6 | 0.1 | 25 | 0.0 | 4.9 |
| Water spinach | 1.2 | 2.9 | 0.4 | 35 | 73 | 2.8 | 0.4 | 246 | - | 0.1 | 0.2 | 0.9 | 0.1 | 57 | - | 23.0 |
| Yard long bean | 4.7 | 3.6 | 0.4 | 42 | 49 | 1.0 | 0.5 | 17 | - | 0.2 | 0.1 | 1.1 | 0.0 | 62 | - | 20.0 |
| Fruit | 14.3 | 1.0 | 0.9 | 75 | 13 | 0.7 | 0.2 | 9 | - | 0.1 | 0.1 | 0.7 | 0.0 | 6 | - | 30.7 |
| Milk | 5.8 | 4.0 | 3.3 | 69 | 151 | 0.0 | 0.5 | 55 | 1 | 0.1 | 0.2 | 0.1 | 0.2 | 3 | 0.5 | 0.4 |
* Fish composition for calcium calculation.
Table A2.
Food eaten for calory requirements [25,26,27,28,29,30] and food eaten for mineral and vitamin requirements per day of consumption [36,37,38].
Table A2.
Food eaten for calory requirements [25,26,27,28,29,30] and food eaten for mineral and vitamin requirements per day of consumption [36,37,38].
| Age (Year) | Food for Calories | Food for Minerals and Vitamins | ||||
|---|---|---|---|---|---|---|
| Male (kcal) | Female (kcal) | Total (kcal) | Composition | Minimum | Maximum | |
| Less than 5 | 830 | 780 | 805 | Ca (mg) | 200 | 2000 |
| 5 to 9 | 1567 | 1467 | 1517 | Fe (mg) | 0.73 | 45 |
| 10 to 14 | 2425 | 2250 | 2338 | Zn (mg) | 2.0 | 40 |
| 15 to 19 | 2750 | 2125 | 2438 | A (µg) | 400 | 3000 |
| 20 to 29 | 2650 | 1950 | 2300 | D (µg) | 10 | 100 |
| 30 to 49 | 2650 | 2000 | 2325 | B1(µg) | 0.2 | 1.4 |
| 50 to 79 | 2450 | 1900 | 2175 | B2 (mg) | 0.3 | 1.6 |
| Over 80 | 2200 | 1750 | 1975 | B3 (mg) | 4.0 | 35 |
| Minimum | 550 | 500 | 525 | B6 (mg) | 0.1 | 100 |
| Maximum | 3150 | 2300 | 2725 | B9 (µg) | 65 | 1000 |
| B12 (µg) | 0.4 | 2.8 | ||||
| C (mg) | 40 | 120 | ||||
Table A3.
Illustration of food supply balanced with food demand plus others and equal to food production and import excluding export (existing data) [8,9].
Table A3.
Illustration of food supply balanced with food demand plus others and equal to food production and import excluding export (existing data) [8,9].
| Food Item | Production (Mt) | Demand (Mt) | Supply (Mt) | Import (Mt) | Export (Mt) | Other (Mt) |
|---|---|---|---|---|---|---|
| Rice | 6.62 | 2.44 | 6.11 | 0.06 | 0.51 | 3.73 |
| Rice noodle | - | - | - | - | - | - |
| Wheat | - | 0.04 | 0.04 | 0.03 | - | 0.01 |
| Beef | 0.07 | 0.07 | 0.07 | 0.00 | - | 0.00 |
| Chicken | 0.03 | 0.04 | 0.04 | 0.01 | - | 0.00 |
| Pork | 0.10 | 0.09 | 0.10 | 0.00 | - | 0.01 |
| Fish | 0.72 | 0.54 | 0.69 | 0.00 | 0.03 | 0.15 |
| Egg | 0.02 | 0.02 | 0.02 | - | - | 0.00 |
| Cooking oil | 0.07 | 0.04 | 0.05 | 0.01 | 0.04 | 0.01 |
| Vegetable | 0.54 | 0.49 | 0.54 | 0.00 | 0.00 | 0.06 |
| Fruit | 0.73 | 0.68 | 0.77 | 0.06 | 0.01 | 0.09 |
| Milk | 0.03 | 0.05 | 0.06 | 0.03 | - | 0.00 |
| Total | 8.93 | 4.50 | 8.49 | 0.21 | 0.59 | 4.06 |
Note: (Production + Import)—Export = (Demand + Other); Demand + Other = Supply; “Other” meant for other use purposes as processing, feed, seed, stock, and non-food.
Table A4.
Inventory data of total rice and rice noodle production from paddy resources.
Table A4.
Inventory data of total rice and rice noodle production from paddy resources.
| Input (Rice) | Qty | Input (Rice Noodle) | Qty | Ref. | ||
|---|---|---|---|---|---|---|
| Paddy production (Mt) | 1.84 | Paddy production (Mt) | 0.12 | [8] | ||
| Rice production (Mt) | 1.18 | Rice production (Mt) | 0.08 | |||
| Rice noodle production (Mt) | 0.20 | |||||
| Rice consumption (Mt) | 1.18 | Rice noodle consumption (Mt) | 0.20 | Table 4 | ||
| Paddy yield (Mt/Mha) | 3.45 | Paddy yield (Mt/Mha) | 3.45 | [8,9] | ||
| Land use (Mha) | 0.53 | Land use (Mha) | 0.04 | |||
| Compost fertilizer (N-P-K) requirement (Mt) | 5.34 | Compost fertilizer (N-P-K) requirement (Mt) | 0.36 | [8] | ||
| DAP fertilizer requirement (Mt) | 0.13 | DAP fertilizer requirement (Mt) | 0.01 | [8] | ||
| Urea fertilizer requirement (Mt) | 0.13 | Urea fertilizer requirement (Mt) | 0.01 | [8] | ||
| Water use of product * (Gt) | 2.65 | Water use of product * (Gt) | 0.18 | [19] | ||
| Emission factor (Mt CH4/Mha) | 0.1561 | Emission factor (Mt CH4/Mha) | 0.1561 | [43] | ||
| Output (Rice) | Output (Rice noodle) | |||||
| Total emission CH4 (Mt CH4) | 0.08 | Total emission CH4 (Mt CH4) | 0.01 | |||
| Emission as CO2 eq using SimaPro® (Mt/Mt product *) | 0.717 | Emission as CO2 eq using SimaPro® (Mt/Mt product **) | 0.861 | |||
| Total emission as CO2 eq (Mt CO2 eq) | 0.85 | Total emission as CO2 eq (Mt CO2 eq) | 0.17 | Table 5 |
* Rice production; ** Rice noodle production.
Table A5.
Inventory data of total wheat production (import basis).
Table A5.
Inventory data of total wheat production (import basis).
| Input (Wheat) | Qty | Ref. | |
|---|---|---|---|
| Wheat production (Mt) | 0.10 | ||
| Bread production (Mt) | 0.10 | ||
| Bread consumption (Mt) | 0.10 | Table 4 | |
| Land use of product * (Mha) | 0.05 | [19] | |
| Water use of product * (Gt) | 3.46 | [19] | |
| Emission factor (Mt CH4/Mha) | 0.1561 | [43] | |
| Output (Wheat) | |||
| Total emission CH4 (Mt CH4) | 0.01 | ||
| Emission as CO2 eq using SimaPro® (Mt/Mt product *) | 0.040 | ||
| Total emission as CO2 eq (Mt CO2 eq) | 0.10 | Table 5 |
* Wheat production.
Table A6.
Inventory data of total beef and milk production based on animal resources.
Table A6.
Inventory data of total beef and milk production based on animal resources.
| Input (Beef) | Qty | Input (Milk) | Qty | Ref. | ||
|---|---|---|---|---|---|---|
| Beef consumption (Mt) | 0.12 | Milk production (Mt) | 0.38 | |||
| Beef consumption (Mt) | 0.12 | Milk consumption (Mt) | 0.308 | Table 4 | ||
| Cattle carcass weight (Mt/head) | 1.20 × 10⁻⁷ | Milk yield (Mt/head) | 1.65 × 10⁻⁶ | [8,9,35] | ||
| Land use of product * (Mt) | 0.05 | Land use of product ** (Mt) | 0.34 | [19] | ||
| Quantity of animal (million head) | 0.97 | Quantity of animal (million head) | 0.23 | |||
| Feed requirement of product * (Mt) | 0.29 | Feed requirement of product ** (Mt) | 0.95 | [19] | ||
| Water use of product * (Gt) | 0.17 | Water use of product ** (Gt) | 1.03 | [19] | ||
| Enteric fermentation (Mt CH4/head/yr) | 4.70 × 10⁻⁸ | Enteric fermentation (Mt CH4/head/yr) | 6.8 × 10⁻⁸ | [35,43] | ||
| Manure management (Mt CH4/head/yr) | 1.00 × 10⁻⁹ | Manure management (Mt CH4/head/yr) | 3.1 × 10⁻⁸ | [35,43] | ||
| Output (Beef) | Output (Milk) | |||||
| Total emission CH4 (Mt CH4) | 0.05 | Total emission CH4 (Mt CH4) | 0.02 | |||
| Emission as CO2 eq using SimaPro® (Mt/Mt product *) | 13.200 | Emission as CO2 eq using SimaPro® (Mt/Mt product **) | 3.710 | |||
| Total emission as CO2 eq (Mt CO2 eq) | 1.53 | Total emission as CO2 eq (Mt CO2 eq) | 1.41 | Table 5 |
* Beef production; ** Milk production.
Table A7.
Inventory data of total chicken and egg production based on animal resources.
Table A7.
Inventory data of total chicken and egg production based on animal resources.
| Input (Chicken) | Qty | Input (Egg) | Qty | Ref. | ||
|---|---|---|---|---|---|---|
| Chicken consumption (Mt) | 0.07 | Egg production (Mt) | 0.05 | |||
| Chicken consumption (Mt) | 0.07 | Egg consumption (Mt) | 0.05 | Table 4 | ||
| Chicken carcass weight (Mt/head) | 1.14 × 10⁻⁹ | Egg weight (98 eggs = 4.878 kg) (Mt/head) | 4.88 × 10⁻⁹ | [8,9] | ||
| Land use of product * (Mt) | 0.09 | Land use of product** (Mt) | 0.03 | [19] | ||
| Quantity of animal (million head) | 63.07 | Quantity of animal (million head) | 9.80 | |||
| Feed requirement of product * (Mt) | 0.13 | Feed requirement of product ** (Mt) | 0.11 | [19] | ||
| Water use of product * (Gt) | 0.05 | Water use of product ** (Gt) | 0.03 | [19] | ||
| Enteric fermentation (Mt CH4/head/yr) | 0 | Enteric fermentation (Mt CH4/head/yr) | 0 | [35,43] | ||
| Manure management (Mt CH4/head/yr) | 2 × 10⁻¹¹ | Manure management (Mt CH4/head/yr) | 2 × 10⁻¹¹ | [35,43] | ||
| Output (Chicken) | Output (Egg) | |||||
| Total emission CH4 (Mt CH4) | 0.001 | Total emission CH4 (Mt CH4) | 1.96 × 10⁻⁴ | |||
| Emission as CO2 eq using SimaPro® (Mt/Mt product *) | 1.950 | Emission as CO2 eq using SimaPro® (Mt/Mt product **) | 1.900 | |||
| Total emission as CO2 eq (Mt CO2 eq) | 0.150 | Total emission as CO2 eq (Mt CO2 eq) | 0.09 | Table 5 |
* Chicken production; ** Egg production.
Table A8.
Inventory data of total pork production based on animal resources.
Table A8.
Inventory data of total pork production based on animal resources.
| Input (Pork) | Qty | Ref. | |
|---|---|---|---|
| Pork consumption (Mt) | 0.13 | ||
| Pork consumption (Mt) | 0.13 | Table 4 | |
| Pig carcass weight (Mt/head) | 5.0 × 10⁻⁸ | [8,9] | |
| Land use of product * (Mt) | 0.22 | [19] | |
| Quantity of animal (million head) | 2.53 | ||
| Feed requirement of product * (Mt) | 0.37 | [19] | |
| Water use of product * (Gt) | 0.23 | [19] | |
| Enteric fermentation (Mt CH4/head/yr) | 1.0 × 10⁻⁹ | [35,43] | |
| Manure management (Mt CH4/head/yr) | 7.0 × 10⁻⁹ | [35,43] | |
| Output (Pork) | |||
| Total emission CH4 (Mt CH4) | 0.02 | ||
| Emission as CO2 eq using SimaPro® (Mt/Mt product *) | 6.830 | ||
| Total emission as CO2 eq (Mt CO2 eq) | 0.86 | Table 5 |
* Pork production.
Table A9.
Inventory data of total fish production based on aquatic resources.
Table A9.
Inventory data of total fish production based on aquatic resources.
| Input (Fish) | Qty | Ref. | |
|---|---|---|---|
| Fish consumption (Mt) | 0.52 | ||
| Fish consumption (Mt) | 0.52 | Table 4 | |
| Fish carcass weight (Mt/head) | 1.0 × 10⁻⁹ | ||
| Land use of product * (Mt) | 0.44 | [19] | |
| Quantity of animal (million head) | 523.50 | ||
| Feed requirement of product * (Mt) | 0.42 | [19] | |
| Water use of product * (Gt) | 1.93 | [19] | |
| Energy emission factor (Mt CO2 eq/Mt product *) | 0.551 | [44] | |
| Output (Fish) | |||
| Total emission CO2 (Mt CH4) | 0.02 | ||
| Emission as CO2 eq using SimaPro® (Mt/Mt product *) | 6.830 | ||
| Total emission as CO2 eq (Mt CO2 eq) | 0.86 | Table 5 |
* Pork production.
Table A10.
Inventory data of total cooking oil and vegetable production based on plant resources.
Table A10.
Inventory data of total cooking oil and vegetable production based on plant resources.
| Input (Cooking Oil) | Qty | Input (Vegetable) | Qty | Ref. | ||
|---|---|---|---|---|---|---|
| Cooking production (Mt) | 0.04 | Vegetable production (Mt) | 1.48 | |||
| Cooking oil production (Mt) | 0.04 | Vegetable consumption (Mt) | 1.48 | Table 4 | ||
| Vegetable yield (Mt/Mha) | 12.80 | [8] | ||||
| Land use (Mha) | 0.04 | Land use (Mha) | 0.12 | [19] | ||
| CaCO3 requirement (Mt/Mha) | 0.23 | [8] | ||||
| N requirement (Mt/Mha) | 0.03 | [8] | ||||
| P2O5 requirement (Mt/Mha) | 0.03 | [8] | ||||
| K2O requirement (Mt/Mha) | 0.02 | [8] | ||||
| Water use of product * (Gt) | 0.02 | Water use of product ** (Gt) | 0.15 | [19] | ||
| Emission factor (Mt CH4/Mha) | 0.1561 | Emission factor (Mt CH4/Mha) | 0.1561 | [43] | ||
| Output (Cooking oil) | Output (Vegetable) | |||||
| Total emission CH4 (Mt CH4) | 6.72 × 10⁻³ | Total emission CH4 (Mt CH4) | 0.02 | |||
| Emission as CO2 eq using SimaPro® (Mt/Mt product *) | 4.600 | Emission as CO2 eq using SimaPro® (Mt/Mt product **) | 0.540 | |||
| Total emission as CO2 eq (Mt CO2 eq) | 0.19 | Total emission as CO2 eq (Mt CO2 eq) | 0.80 | Table 5 |
* Cooking oil production; ** Vegetable production.
Table A11.
Inventory data of total fruit production based on plant resources.
Table A11.
Inventory data of total fruit production based on plant resources.
| Input (Fruit) | Qty | Ref. | |
|---|---|---|---|
| Fruit production (Mt) | 0.84 | ||
| Fruit consumption (Mt) | 0.84 | Table 4 | |
| Fruit yield (Mt/Mha) | 13.20 | [8] | |
| Land use of product* (Mha) | 0.06 | ||
| Water use of product * (Gt) | 0.13 | [19] | |
| Emission factor (Mt CH4/Mha) | 0.1561 | [43] | |
| Output (Fruit) | |||
| Total emission CH4 (Mt CH4) | 0.01 | ||
| Emission as CO2 eq using SimaPro® (Mt/Mt product *) | 0.331 | ||
| Total emission as CO2 eq (Mt CO2 eq) | 0.28 | Table 5 |
* Fruit production.
Table A12.
Illustration of the emission of CO2 eq for the intake of each food item depending on the consumption of food for calories, minerals, and vitamins using SimaPro® calculation.
Table A12.
Illustration of the emission of CO2 eq for the intake of each food item depending on the consumption of food for calories, minerals, and vitamins using SimaPro® calculation.
| Food Set | Age | Food for Calories (kg) | Food for Minerals and Vitamins (kg) | Total (kg) | ||||||||||
|---|---|---|---|---|---|---|---|---|---|---|---|---|---|---|
| Staple Food | Meat | Egg | Vegetable | Fruit | Calcium | |||||||||
| Rice | Wheat | Beef | Chicken | Pork | Fish | Oil | VESP | Milk | Fish * | |||||
| BF1 | G1 | 0.036 | - | - | 0.039 | - | - | - | - | 0.027 | 0.017 | 0.074 | 0.006 | 0.199 |
| G2 | 0.072 | - | - | 0.098 | - | - | - | - | 0.054 | 0.017 | 0.074 | 0.006 | 0.321 | |
| BF2 | G1 | 0.043 | - | - | - | - | 0.024 | - | 0.023 | 0.027 | 0.017 | 0.074 | 0.006 | 0.214 |
| G2 | 0.086 | - | - | - | - | 0.060 | - | 0.023 | 0.054 | 0.017 | 0.074 | 0.006 | 0.320 | |
| BF3 | G1 | 0.036 | - | - | - | 0.068 | - | 0.019 | 0.023 | 0.027 | 0.017 | 0.074 | 0.006 | 0.270 |
| G2 | 0.072 | - | - | - | 0.171 | - | 0.048 | 0.023 | 0.054 | 0.017 | 0.074 | 0.006 | 0.465 | |
| BF4 | G1 | 0.043 | - | 0.265 | - | - | - | - | - | 0.027 | 0.017 | 0.074 | 0.006 | 0.432 |
| G2 | 0.086 | - | 0.661 | - | - | - | - | - | 0.054 | 0.017 | 0.074 | 0.006 | 0.898 | |
| BF5 | G1 | - | 0.052 | - | 0.020 | - | - | 0.019 | 0.023 | 0.027 | 0.017 | 0.074 | 0.006 | 0.238 |
| G2 | - | 0.104 | - | 0.049 | - | - | 0.048 | 0.023 | 0.054 | 0.017 | 0.074 | 0.006 | 0.375 | |
| LD1 | G1 | 0.036 | - | - | - | 0.068 | 0.012 | - | 0.023 | 0.027 | 0.017 | 0.074 | 0.006 | 0.263 |
| G2 | 0.072 | - | - | - | 0.171 | 0.030 | - | 0.023 | 0.054 | 0.017 | 0.074 | 0.006 | 0.447 | |
| LD2 | G1 | 0.036 | - | 0.265 | - | - | - | - | - | 0.027 | 0.017 | 0.074 | 0.006 | 0.425 |
| G2 | 0.072 | - | 0.661 | - | - | - | - | - | 0.054 | 0.017 | 0.074 | 0.006 | 0.884 | |
| LD3 | G1 | 0.036 | - | - | - | - | 0.024 | - | - | 0.027 | 0.017 | 0.074 | 0.006 | 0.184 |
| G2 | 0.072 | - | - | - | - | 0.060 | - | - | 0.054 | 0.017 | 0.074 | 0.006 | 0.283 | |
| LD4 | G1 | 0.036 | - | - | - | - | 0.024 | - | 0.023 | 0.027 | 0.017 | 0.074 | 0.006 | 0.207 |
| G2 | 0.072 | - | - | - | - | 0.060 | - | 0.023 | 0.054 | 0.017 | 0.074 | 0.006 | 0.306 | |
| LD5 | G1 | 0.036 | - | - | - | - | 0.024 | - | - | 0.027 | 0.017 | 0.074 | 0.006 | 0.184 |
| G2 | 0.072 | - | - | - | - | 0.060 | - | - | 0.054 | 0.017 | 0.074 | 0.006 | 0.283 | |
| LD6 | G1 | 0.036 | - | - | - | - | 0.024 | - | - | 0.027 | 0.017 | 0.074 | 0.006 | 0.184 |
| G2 | 0.072 | - | - | - | - | 0.060 | - | - | 0.054 | 0.017 | 0.074 | 0.006 | 0.283 | |
| LD7 | G1 | 0.036 | - | - | - | 0.137 | - | - | 0.023 | 0.027 | 0.017 | 0.074 | 0.006 | 0.320 |
| G2 | 0.072 | - | - | - | 0.342 | - | - | 0.023 | 0.054 | 0.017 | 0.074 | 0.006 | 0.588 | |
| Average of one set ** | G1 | 0.258 | ||||||||||||
| G2 | 0.451 | |||||||||||||
* Fish was from boiling fish, roasted fish, or fish powder that was consumed for calcium. ** CO2 eq kg/week = total average of one set (kg/set) × 7 days × 3 sets/day; CO2 eq kg/kg = total average of one set (kg/set)/Qty (kg).
References
- Makurat, J.; Kretz, E.C.; Wieringa, F.T.; Chamnan, C.; Krawinkel, M.B. Dietary Diversity in Cambodian Garment Workers: The Role of Free Lunch Provision. J. Nutr. 2018, 10, 1010. [Google Scholar] [CrossRef] [PubMed]
- Ridoutt, B.G.; Hendrie, G.A.; Noakes, M. Dietary Strategies to Reduce Environmental Impact: A Critical Review of the Evidence Base. Am. Soc. Nutr. Adv. Nutr. 2017, 8, 933–946. [Google Scholar] [CrossRef] [PubMed]
- Takacs, B.; Borrion, A. The Use of Life Cycle-Based Approaches in the Food Service Sector to Improve Sustainability: A Systematic Review. Sustainability 2020, 12, 3504. [Google Scholar] [CrossRef]
- Vermeulen, S.; Cambell, B.; Ingram, J. Climate Change and Food Systems. Annu. Rev. Environ. Resour. 2012, 37, 195–222. [Google Scholar] [CrossRef]
- CAIT. Cambodia Greenhouse Gas Emissions Targets. Climate Watch Data. Available online: https://www.climatewatchdata.org/countries/KHM (accessed on 2 October 2020).
- NIS (National Institute of Statistics), Ministry of Planning, Cambodia. Final General Population Census 2019-English (pdf) and Final-Priority Table A-H (xsls). Available online: http://www.nis.gov.kh/index.php/km/15-gpc/79-press-release-of-the-2019-cambodia-general-population-census (accessed on 1 June 2020).
- NIS (National Institute of Statistics), Ministry of Planning, Cambodia. Cambodia Socio-Economic Survey 2017. Available online: http://www.nis.gov.kh/index.php/en/14-cses/12-cambodia-socio-economic-survey-reports (accessed on 1 June 2020).
- MAFF, Cambodia. Yearly Report of Ministry of Agriculture, Forestry and Fisheries, Cambodia 2019–2020. Available online: https://elibrary.maff.gov.kh/book/5eaa3815b825e (accessed on 1 November 2020).
- FAOSTAT. Available online: http://www.fao.org/faostat/en/#country (accessed on 8 February 2019).
- World Bank. Available online: https://data.worldbank.org/indicator/ (accessed on 8 February 2019).
- World Health Organization. Global and Regional Food Consumption Pattern and Trend. Available online: https://www.who.int/nutrition/topics/3_foodconsumption/en/ (accessed on 1 June 2020).
- FAO. Cambodia-Food and Nutrition Security Profile. Available online: http://www.fao.org/3/a-at706e.pdf (accessed on 6 June 2020).
- Global Nutrition Report. Action on Equity to End Malnutrition. Available online: https://globalnutritionreport.org/reports/2020-global-nutrition-report/ (accessed on 6 September 2020).
- NIS. Cambodian Demographic Health Survey, National Institute of Statistics; Ministry of Planning: Phnom Penh, Cambodia, 2015.
- Makurat, J.; Friendrich, H.; Kuong, K.; Wieringa, F.T.; Chamnan, C.; Krawinkel, M.B. Nutritional and Micronutrient Status of Female Workers in Garment Factory in Cambodia. J. Nutr. 2016, 8, 694. [Google Scholar] [CrossRef] [PubMed]
- Darina, T.; Ningyin, M. Inadequate Nutrition Status of Garment Worker in Cambodia. MOJ Public Health 2018, 7, 196–199. [Google Scholar]
- Paradis, A.M.; Godin, G.; Perusse, L.; Vohl, M.C. Associations between Dietary Patterns Phenotype. Inter. J. Obes. 2009, 33, 1419–1426. [Google Scholar] [CrossRef] [PubMed]
- Ledikwe, J.H.; Ello-Martin, J.A.; Rolls, B.J. Portion Size and the Obesity Epidemic. J. Nutr. 2005, 134, 905–909. [Google Scholar] [CrossRef] [PubMed]
- Ritchie, H.; Roser, M. Environmental Impacts of Food Production, Our World in Data. Available online: https://ourworldindata.org/environmental-impacts-of-food (accessed on 2 October 2020).
- USAID. Greenhouse Gas Emissions Factsheet: Cambodia. Available online: https://www.climatelinks.org/resources/greenhouse-gas-emissions-factsheet-Cambodia (accessed on 2 October 2020).
- San, V.; Towapravoon, S. Estimating of Methane and Nitrous Oxide Emission from Rice Field with Straw Management in Cambodia. Environ. Monit. Assess. 2010, 161, 301–313. [Google Scholar]
- Carlsson-Kanyama, A.; Gonzalez, A.D. Potential Contributions of Food Consumption Pattern to Climate Change. Am. J. Clin. Nutr. 2009, 89, 1704s–1709s. [Google Scholar] [CrossRef] [PubMed]
- Pimentel, D.; Pimentel, M. Sustainability of Meat-based and Plant-based Diets and Environment. Am. J. Clin. Nutr. 2003, 78, 660s–663s. [Google Scholar] [CrossRef] [PubMed]
- Ulaszewska, M.M.; Luzzani, G.; Pignatelli, S.; Capri, E. Assessment of Diet-related GHG Emission Using the Environmental Hourglass Approach for the Mediterranean and New Nordic Diets. Sci. Total Environ. 2017, 574, 829–836. [Google Scholar] [CrossRef] [PubMed]
- WHO. Healthy Diet 2018. Available online: https://www.who.int/publications/m/item/healthy-diet-factsheet394 (accessed on 6 June 2020).
- MoH and FIDR. Development of Recommended Dietary Allowance and Food-Based Dietary Guidelines for School-Aged Children in Cambodia; Ministry of Health and Foundation for International Development/Relief: Phnom Penh, Cambodia, 2017. [Google Scholar]
- Tee, E.-S.; Florentino, R.F. Recommended Dietary Allowances: Harmonization in Southeast Asia; International Life Sciences Institute: Singapore, 2005. [Google Scholar]
- MoHLW. Dietary Reference Intakes for Japanese 2015; Ministry of Health, Labour and Welfare: Tokyo, Japan, 2018.
- Alasfoor, B.; Rajab, D.; Ai-Rassasi, H. Based Dietary Guidelines. FAO, 2006. Available online: http://www.fao.org/nutrition/education/food-dietary-guidelines/en/ (accessed on 6 June 2020).
- FAO. Human Energy Requirements, Food and Nutrition Technical Report Series; Food Agriculture Organization: Rome, Italy, 2001. [Google Scholar]
- Allen, L.; Benoist, B.; Dary, O.; Hurrell, R. Guidelines on Food Fortification with Micronutrients. 2006. Available online: https://www.who.int/nutrition/publications/guide_food_fortification_micronutrients.pdf (accessed on 6 June 2020).
- Mirzaeian, S.; Ghiasvand, R.; Sadeghian, F.; Sheikhi, M.; Khosravi, Z.; Askari, G.; Shiranian, A.; Yadegarfar, G. Assessing the Micronutrient and Macronutrient Intakes in Female students and Comparing them with the Set Standard Values. J. Educ. Health Promot. 2013, 2, 1. [Google Scholar] [PubMed]
- Makurat, J.; Pillai, A.; Wieringa, F.T.; Chamnan, C.; Krawinkel, M.B. Estimated Nutritive Value of Low-Price Model Lunch Sets Provided to Garment Workers in Cambodia. J. Nutr. 2017, 9, 782. [Google Scholar] [CrossRef] [PubMed]
- In, S.; Lambre, C.; Camel, V.; Ouldelhmim, M. Reginal and seasonal Variation of Food consumption. Malays. J. Nutr. 2015, 22, 167–178. [Google Scholar]
- IPCC. Volume 4: Agriculture Forestry and Other Land Use in Chapter 5: Cropland, and Chapter 10: Emission from Livestock and Manure Management. Available online: https://www.ipcc-nggip.iges.or.jp/public/2006gl/vol4.html (accessed on 2 October 2020).
- National Institutes of Health. Health Professional Fact Sheet on All Vitamins and Minerals (Vitamin A, Vitamin B, Vitamin C, Vitamin D, Calcium, Iron, Zinc, etc.). Available online: https://ods.od.nih.gov/factsheets/list-all/ (accessed on 2 October 2020).
- INFOODS. International Network of Food Data Systems. Smiling Food Composition Table for Cambodia. 2013. Available online: http://www.fao.org/infoods/infoods/tables-and-databases/asia/en/ (accessed on 6 June 2020).
- USDA. U.S. Department of Agriculture. Food Data Central. Food Composition Table. Available online: https://fdc.nal.usda.gov/ (accessed on 6 June 2020).
- Manore, M.M. Exercise and the Institute of Medicine Recommendations for Nutrition. Curr. Sports Med. Rep. 2005, 4, 193–198. [Google Scholar] [CrossRef] [PubMed]
- Stylianou, K.S.; Nguyen, V.K.; Fulgoni III, V.l.; Jolliet, O. Environmental Impacts of Mixed Dishes: A Case study on Pizza. FASEB J. 2018, 31, lb386. [Google Scholar]
- Rivera, S.X.C.; Orias, N.E.; Azapagic, A. Life Cycle Environmental Impacts of convenience food: Comparison of Ready and Home-made meals. J. Clean. Prod. 2014, 73, 294–309. [Google Scholar] [CrossRef]
- Poore, J.; Nemeccek, T. Reducing Food’s Environment impact through producers and Consumers. J. Sci. 2018, 360, 987–992. [Google Scholar]
- Tubiello, F.N.; Condor-Golec, R.D.; Salvatotore, M.; Piersante, A.; Federici, S.; Ferrara, A.; Rossi, S.; Flammini, A.; Cardenas, P.; Biancalani, R.; et al. Estimating Greenhouse Gas Emissions in Agriculture; FAO: Rome, Italy, 2014. [Google Scholar]
- MacLeod, M.; Hasan, M.R.; Robb, D.H.F.; Mamun-Ur-Rashid, M. Quantifying and Mitigating Greenhouse Gas Emissions from Global Aquaculture; FAO: Rome, Italy, 2019. [Google Scholar]


Publisher’s Note: MDPI stays neutral with regard to jurisdictional claims in published maps and institutional affiliations. |
© 2021 by the authors. Licensee MDPI, Basel, Switzerland. This article is an open access article distributed under the terms and conditions of the Creative Commons Attribution (CC BY) license (http://creativecommons.org/licenses/by/4.0/).