Abstract
Biochar application is reported as a method for improving physical and chemical soil properties, with a still questionable impact on the crop yields and quality. Plant productivity can be affected by biochar properties and soil conditions. High efficiency of biochar application was reported many times for plant cultivation in tropical and arid climates; however, the knowledge of how the biochar affects soils in temperate climate zones exhibiting different properties is still limited. Therefore, a three-year-long field experiment was conducted on a loamy Haplic Luvisol, a common arable soil in Central Europe, to extend the laboratory-scale experiments on biochar effectiveness. A low-temperature pinewood biochar was applied at the rate of 50 t h−1, and maize was selected as a tested crop. Biochar application did not significantly impact the chemical soil properties and fertility of tested soil. However, biochar improved soil physical properties and water retention, reducing plant water stress during hot dry summers, and thus resulting in better maize growth and higher yields. Limited influence of the low-temperature biochar on soil properties suggests the crucial importance of biochar-production technology and biochar properties on the effectiveness and validity of its application in agriculture.
1. Introduction
Soil fertility is the ability of the soil to ensure and sustain crop productivity. Low soil fertility is a common problem in many regions around the world [1]. In soils with low soil organic matter (SOM), content and coarse texture essential plant nutrients are easily leached from topsoil layer by rain water or become unavailable during drought periods. Relatively higher temperatures enhance SOM mineralization, resulting in the decrease of aggregate stability and capacity to retain water and nutrients. This phenomenon become one of the most important challenges towards sustainable agronomy and crop production [2]. Sustainable agriculture can be defined as “the management and conservation of the natural resource base, and the orientation of technological change in such a manner as to ensure the attainment of continued satisfaction of human needs for present and future generations [3]. Recently biochar became one of the most promising solutions mitigating problem of climate change and soil degradation. Returning crop waste into the soil, through organic amendments, represents a sustainable management strategy mitigating the human impacts on soil. As most of the research reported beneficial effects of biochar application to tropical and arid soils and improvement of growth of local plants species [4,5,6,7,8,9], there is an urgent need to extend field research on biochar application on soils and plants cultivated in temperate climate. A large variety of results and plant responses reports show that biochar properties and soil conditions are the most important factors influencing efficiency of amended application to soil and plant growth improvement [10,11]. In terms of soil application, pyrolysis temperature can be crucial in predicting possible soil effects. Biochars made at higher temperatures typically have larger surface areas [12], with high porosity [1] and C content [13], commonly along with an alkaline reaction [14], higher C:N ratio [15], lower dissolved organic carbon (DOC) content [16] and lower nutrient availability [17]. The low temperature biochars can be more efficient as slow-release fertilizers [18]. As the higher pyrolysis temperatures increase the cost of biochar production, thus decreasing the biochar yield, the most available commercial biochars are low-temperature materials produced from easily available biomass, mainly hardwood and woodchips. Since relatively little information is available regarding the application of this type of biochars as an organic amendment, compared to the variety of data obtained from laboratory-scale incubations and pot experiments with high-temperature biochars [19,20], our study aimed at achieving a wide understanding on the influence of different factors (such as the pyrolysis temperature, biochar application rate and soil texture) on the crop-response variables. The described study was probably the first field trial in Poland that tested biochar impact on maize yields and soil properties over the long-term. We hypothesized that biochar application will improve soil properties, especially water retention, and test crop growth, but the long-term effect may depend on the quality of the biochar resulting from technology of its preparation. Our results provide the agronomic context of commercially available biochar application to soils.
2. Materials and Methods
2.1. Study Area and Experimental Design
The field experiment was conducted from mid-April 2014 to mid-April 2016, on a field in the suburbs of Opole city in Southwestern Poland (50°57’40” N, 17°89’08” E). In spring 2018, experimental plots were resampled, to measure soil properties four years after pinewood biochar application. The farm was conventionally managed for maize and rape seed crop production. The climate of the area is moderately warm, with a mean annual air temperature (MAAT) of 8.4 °C and mean annual precipitation (MAP) of 611 mm. During years 2014–2018, MAAT was higher (10.5 °C) and MAP was 529 mm; MAP was extremely low, at 358 mm, in year 2015, which was registered as having had the warmest and driest summer of past decade in Poland. Detailed data on the temperature and precipitation are presented in the supplementary data (Supplementary Materials Table S11). The soil under investigation was the Haplic Luvisol (Food and Agriculture Organization of United Nations and World Reference Base soil classification system) with the texture class of sandy loam (in the 0–10 cm layer; Figure 1a and average content of 2%, 29% and 69% of clay, silt and sand, respectively. Biochar used in the experiment is presented in Figure 1b. The experiment was designed in 2 plots, 13 m × 5 m, with 3 blocks each (3 m × 3 m) and buffer areas: between blocks 2 m wide and between plots 5 m wide (see Figure 2b).
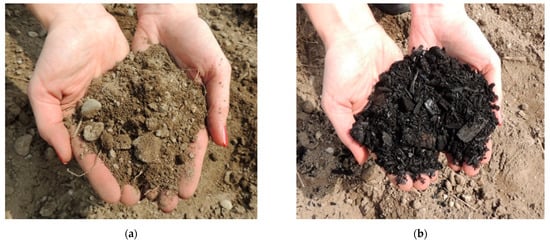
Figure 1.
(a) Sandy loam (Haplic Luvisol) soil in the field. (b) Low-temperature pinewood of biochar sample used in the experiment (photos by J.K., 23 April 2014).
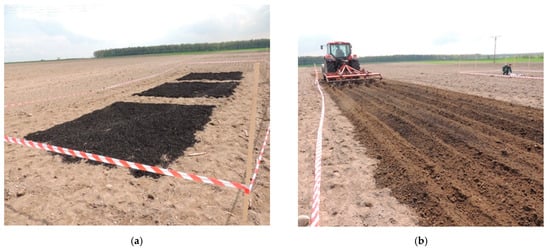
Figure 2.
(a) Experimental block with three visible plots with biochar addition, before ploughing. (b) Plowing of experimental area (photos taken by co-author J.K., 23 April 2014).
The two blocks consisted of the following treatments (plots): (C-S) control soil with no addition of biochar, and soil with pinewood biochar (PBC-S). Amended soil with pinewood biochar at a rate of 50 t ha−1. The particle size fraction of pinewood biochar applied into the field was between 2 and 20 mm (see Figure 1b). Biochar was raked out on the surface of the plots, and all the plots were ploughed to the depth of 30 cm (see Figure 2b). The field was sown with maize (Zea mays L.) variety P8745 (FAO 250, Pioneer® Company, Tokyo, Japan), on 23 April 2014, 30 April 2015 and 16 April 2016. Starter fertilizer dose was used at the beginning of the experiment, and 25 kg h−1 of ammonium phosphate, containing NP(S) 18-45(5) (Polidap®, Grupa Azoty Police S.A., Bydgoszcz, Poland) was applied in biochar and control treatments. During the experiment period, no additional fertilization, liming, irrigation and spraying against weeds and diseases were applied. Weeds were harvested manually during the vegetation season. Figure 3 presents maize growth after the first vegetative season, before sample collection.
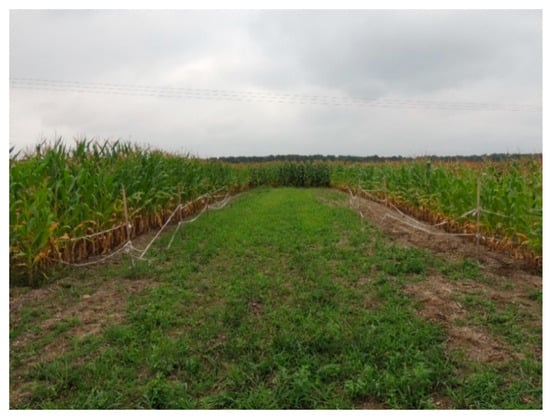
Figure 3.
Maize growth during the first vegetation season, 99 days after sowing. On the left side is field with biochar addition; on the right side is the control (photo by J.K., 31 July 2014).
2.2. Soil Sample Collection and Analysis
Soil samples were collected twice a year, in mid-April and mid-October. Four samples from each plot (3 × 3 m) were collected from the depth of 10 cm. During first year of the experiment, six samples were collected from each plot, to determine soil heterogeneity. As the soil samples collected from each plot were relatively homogeneous, in the next years, the soil subsamples were mixed, to form one composite sample from a plot. After soil drying, grinding and sieving, the following physicochemical properties were analyzed in the fine-earth fraction (<2 mm). Soil pH in deionized H2O and 1 M KCl were analyzed in a suspension 1:5 (w/v), using a potentiometric method (Mettler Toledo, Graifensee, Switzerland). Total organic carbon (TOC) was measured by dry combustion method (CS–Mat Analyzer Strohlein Instruments, Kaarst, Germany). Total nitrogen was determined by Kjedhal method (Buchi Labortechnik GmbH, Essen, Germany). Exchangeable acidity was measured by titration of soil extracts, to the endpoint, at pH 8.3, after sample extraction with 1 M KCl. Exchangeable cations (Ca2+, Mg2+, Na+ and K+) in the soils were extracted with 1 M NH4OAc at pH 7.0 (1:10 w/v), and their concentration in extracts was measured by using a Microwave Plasma–Atomic Emission Spectrometry (MP–AES 4200 Agilent Technologies, Santa Clara, CA, USA). Effective cation-exchange capacity (ECEC) of control and biochar-amended soil was estimated from sum of exchangeable acidity and exchangeable base cations. Total content of P, K, Ca and Mg was analyzed on MP–AES 4200, after microwave sample digestion in 70% nitric acid (1:10 w/v ratio), in a digestion microwave system StartD (Milestone Srl. Sorisole, Italy). Soil samples from C-S and PBC-S treatments for bulk density (BD) analysis were collected with 100 cm−3 Kopecky metal rings [21], once during the experiment period, in Autumn 2014, six months after PBC application to soil. The specific gravity was determined by the Pyknometer method [22]. Porosity was calculated based on bulk density and soil texture, according to the Brogowski et al. [23] equation. Soil water-retention characteristics θ(h) were measured between pF 1 and 4.2, gravimetrically, with sand and a kaolin box, in the range of 0–10 kPa and 10–100 kPa, respectively, and higher pressures (100–1500 kPa) were measured with a ceramic plate pressure apparatus (Eijkelkamp Soil & Water, Giesbeek, Netherlands). Available water for the plants was calculated as the difference of θ between field capacity (FC) (−33 kPa) and the permanent wilting point (PWP) (−1500 kPa).
2.3. Biochar Analysis
The biochar used in the experiment was produced by the low-temperature flash pyrolysis (300 °C) of pinewood chips (see Figure 1b). Its heating value was 25 MJ kg−1. Before the experiment, selected properties of biochar (pH, organic carbon content, cation exchange capacity, heavy metal content and polycyclic aromatic carbons (PAHs)) were analyzed according to International Biochar Initiative (IBI) Standard Product Definition and Product Testing Guidelines to describe properties of the material before its application to soil. The pH of biochar was analyzed in a suspension 1:5 (w/v), using a potentiometric method (Mettler Toledo, Graifensee, Switzerland). Ash content was determined by the ignition of biochar samples, in a muffle furnace, at 550 °C. Elemental composition (CHNS) was determined on elemental analyzer (CE Instruments Ltd., Hindley, UK). The specific surface area (SSA) was measured using a Tri-Star II 3020 (Micrometrics®, Norcross, GA, USA) surface area analyzer (N2-BET method). Total content of P, K, Ca and Mg was analyzed on MP–AES 4200 (Agilent Technologies, Santa Clara, CA, USA), after sample after microwave sample pretreatment with 36% H2O2 and digestion in 70% nitric acid (1:10 w/v ratio), in a digestion microwave system StartD (Milestone Srl., Sorisole, Italy). Available P and K were measured on MP–AES 4200 (Agilent Technologies, Santa Clara, CA, USA, after sample extraction with Mehlich-3 reagent [24]. Methods of potentially toxic compounds (heavy metals and PAHs) analyses were described in a previous paper of Gruss et al. [25]. Briefly, basic properties of pinewood biochar used in the experiment and properties of soil are given in Table 1.

Table 1.
Properties of pinewood biochar and the soil collected before the experiment.
2.4. Statistical Analysis
Soil basic properties parameters were statistically tested using Student’s t-test on the significance level p < 0.05, with R v3.6.0 software (Agricolae package). Maize (Zea mays L.) growth, nutrient uptake and yield were statistically tested, using Student’s t-test or Mann–Whitney U test on the significance level p < 0.05, with Statistica 13.3 software.
3. Results
3.1. Soil and Biochar Chemical Properties
The organic carbon content in the pinewood biochar (PBC) was 52.3%, and ash content was 46.1% (Table 1). The specific surface area (SSA) was very low, only 16.5 m2 g−1, and effective cation exchange capacity was 6.65 cmol (+) kg−1. Biochar was free from toxic compounds, according to the result described in the previous paper of Gruss et al. [25]. Changes of soil chemical properties are summarized in Table 2. Pinewood biochar (PBC) application did not cause significant (p > 0.05) changes in soil pH during the whole experimental period. However, this parameter was very dynamic, and between April and September 2014 (first months after PBC application), the pH increased from 6.87 to 7.35 in PBC-treated soil. In 2015, in PBC-treated soil, the pH decreased to 7.04, and in 2016, it increased again to pH 7.31. Pinewood biochar application had a significant (p < 0.05) effect on soil exchangeable acidity values, and a twofold increase was observed in the second year after PBC application. The effect of PBC application on soil effective cation exchange capacity was apparent during two first years of the experiment. However, an insignificant increase of ECEC values was observed from PBC-S treatment, compared with C–S, in the third year of experiment and in the post-experiment study in year 2018 (Table 2.). Biochar application caused shifts between exchangeable cation in sorption complex, as increases of Ca2+, K+ and Mg2+ cations were observed in the first year after PBC application. Changes of Mg2+ were statically significant (p < 0.05). The change was observed in total carbon content. Application of 50 t ha−1 of PBC increased TOC by 16% in the first year and was consequently higher in PBC-S during the whole experimental period (years 2014–2018).
Table 2.
Physicochemical properties of the control soil (C-S) and soil treated with 50 t ha−1 pinewood biochar (PBC-S).
3.2. Changes in Soil Physical Properties
The changes in the soil porosity were reflected in the water retention properties. PBC-S samples show significant (p < 0.05) increase in AWC (available water capacity) in relation to the control samples without biochar (Table 3, Figure 4). Content of AWC increased by 100% after PBC application at pF 2.0 (10 kPa) and 200% at pF 4.2 (1500 kPA) (Table 3). Pinewood biochar application decreased sandy loam permeability by 100% and number of macrospores and mesopores decreased significantly (p > 0.05, Figure 5). Total porosity of soil increased to 49% in PBC-S, compared with 43.7% in C-S. Bulk density of soil decreased from 1.54 g cm−3 in C-S to 1.3 g cm−3 in PBC-S. There was no change in specific gravity after application with and without biochar 2.61 g cm−3.
Table 3.
Water properties of pinewood biochar (PBC), soil with pinewood biochar (PBC-S), compared with control soil (C-S) from samples collected in Autumn 2014.
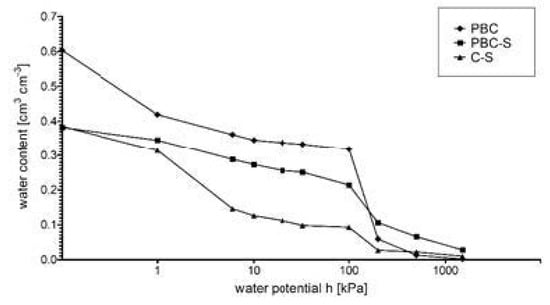
Figure 4.
Water retention curves of pinewood biochar (PBC) and soil with pinewood biochar (PBC-S), compared with control without biochar (C-S).
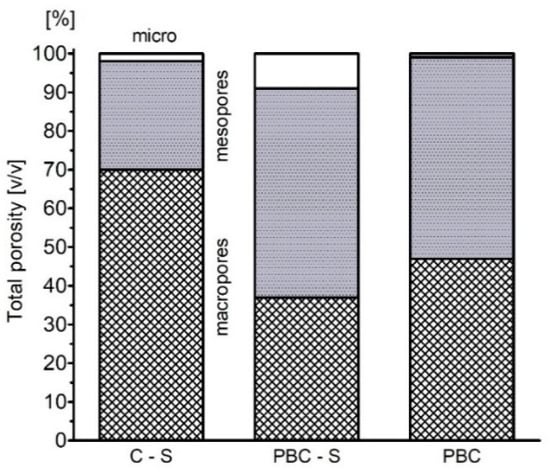
Figure 5.
Estimated contribution of different-sized pores in total porosity of pinewood biochar (PBC) and soil with pinewood biochar (PBC-S), as compared with C-S (soil without biochar).
3.3. Maize Growth, Nutrient Uptake and Yield
Biochar application improved maize growth during the observation period (Figure 6). In year 2014, the average height of plants (stalk) was 2.21 m on PBC-S, compared to 1.64 m on C-S. (Table 4). During severe drought in year 2015, maize crops were impacted by lack of rainfalls in entire area of Southwest Poland, and maize biomass was twofold lower, 0.76 m PBC-S vs. 0.78 m C-S, compared with previous years. In year 2016, maize grew better, 1.73 m on PBC-S vs. 1.38 m C-S; however, the impact of the dry-weather period between summer 2015 and spring 2016 was noticeable. Pinewood biochar application also had a significant effect on other biometric parameters. The average root length (Table 4) was significantly higher during the observation period. In 2014, it was 0.30 m on PBC-S vs. 0.26 m on C-S; in 2015, it was 0.21 m on PBC-S vs. 0.17 m on C-S; and in 2016, it was 0.21 m on PBC-S vs. 0.18 m on soil without PBC amendment. Maize cob length was also impacted and higher for plants grown on PBC amended soil. On the left side of the photo in Figure 6b are presented cobs collected from the field trials containing biochar (taken from the plots marked as 1, 2 and 3; see Figure 2a). A total of 32 psc were collected with an average flask length of 158 mm, and an average flask diameter of 43.40 mm (see Table 6). On the right side of the photo in Figure 6b, there are flasks collected from plots with numbers 4, 5 and 6, i.e., from the plot without the addition of biocarbon. Despite the fact that the number of cobs is only four pieces smaller than in the case of the addition of biochar, cobs are much smaller in terms of diameter and thickness. In summary, biochar can reduce the share of the smallest cobs in the yield. The field observation of plants indicated that the application of PBC-mitigated impacts of drought periods, as plants grew better and turned to all growing stage (kernels development), compared with control soils and neighboring maize fields (no cobs and kernels development; vegetative parts desiccation).
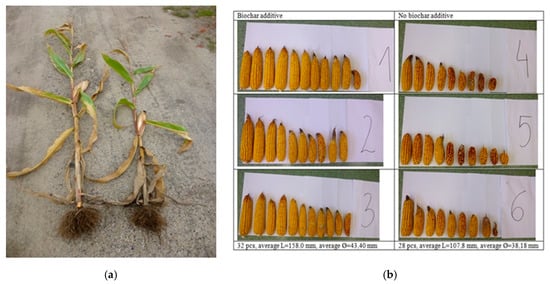
Figure 6.
Maize growth in year 2014. (a) Comparison of plants collected from the field trials with biochar application (left) and a control field (right); photo by J.K. (b) Maize cobs collected from the field trials containing biochar (left) and a control field (right); photos by J.K.
Table 4.
Plant height and root length (m) for maize on control fields (C-S) and with biochar application (PBC-S).
Pinewood biochar application improved the thousand seeds weight (TSW) parameter and maize yields during three years of observation. In year 2014, there was 268 g on PBC-S vs. 246 g on C-S; in year 2015, kernel mass was very low, but significantly higher on PBC-S, at 113 g, vs. 86 g on C-S; and in year 2016, there was 227 g on PBC-S, compared with 220 g on C-S (Table 5). The statically important difference in maize cob thickness occurred only in the first year of the study: 43 mm on PBC-S vs. 38 mm on C-S (Table 6). See Supplementary Materials Figures S1–S10 and Tables S1–S10 for more details.
Table 5.
Thousand seeds weight (TSW) and total yield of maize on control soil (C-S) and with biochar application (PBC-S).
Table 6.
The cob thickness of maize on control fields (C-S) and with biochar application (PBC-S).
Concentrations of P and K in soil were similar on PBC-S and C-S (Figure 7). Biochar application did not increase significantly (p > 0.05) content of phosphorus and potassium in maize leaves. Greater changes were observed in calcium and magnesium content. In the years 2014 and 2015, concentrations of Ca and Mg were significantly higher (p < 0.05) in plants grown on C-S. In the third year, no significant changes were observed between treated and untreated soil.
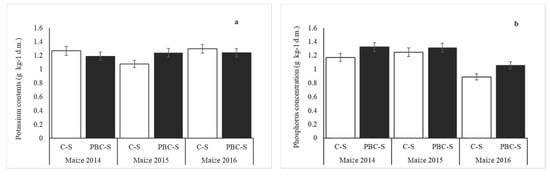
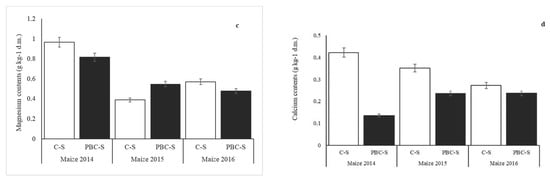
Figure 7.
Concentration of potassium (a), phosphorus (b), magnesium (c) and calcium (d) in maize dry mass (leaves) grown on PBC-S, compared with C-S. Error bars indicate the standard deviation (SD) of the mean (n = 3).
4. Discussion
4.1. Effects on Soil pH
Application of the biochar affects properties which are related to important soil functions, such as nutrient storage and release, water and carbon storage and crop production. This phenomenon was described recently by many authors [5,20,26,27,28,29], suggesting that most of the soil properties are improved when biochar is applied to soil. Absence of effects of PBC application on most soil properties can be explained by low quality of the material and probable interactions in soil, as the best results are obtained when biochar is applied to very poor sandy soils [30,31]. Acidifying effect of biochar is a feature that is straightly related with the feedstock type and temperature of pyrolysis [32]. Wood materials are usually more acidify in nature, compared with other feedstock types, which could release more H+ cations decreasing soil pH. Biochar pH tended towards neutral probably due to lower carbonate formation rate at low temperature (250 °C) and smaller release of alkali salts from pinewood during pyrolysis [33]. The differences in alkalinity of the biochars are attributed to the different alkaline substances from the feedstocks and the new alkaline substances produced during the pyrolysis process [32]. Jones et al. [34] observed that, after three years from biochar burial in the soil, the pH of the biochar had fallen significantly by over two units. In the literature, pH changes following biochar application were variable, due to the inherent differences in biochar properties and also due to varying buffering capacities of the soils [35,36]. The positive influence of biochar on increasing soil pH is more profound in acidic soils and soils with low SOM content, probably because SOM content is linked to the pH buffering capacity of soil [9].
Incorporation of biochar into the soil induces changes in its chemical and biological properties, due to material ageing. Results of the study suggest that pH decrease can be related to biochar properties. Material was not fully carbonized, and a more acid-based substance could be on its surface, easily released to soil after PBC application. Low temperature can promote partial breakdown of lignocellulose and cellulose, increasing the yield of low-molecular-weight acids [37] that can be easily resorbed on the biochar surface [38,39], decreasing soil pH when applied to soil. Finally biochar degradation in soil and release of dissolved organic carbon (DOC) can decrease soil pH, as was also observed in other studies [40,41].
4.2. Effects on Soil Cation Exchange Capacity
Pinewood biochar application did not significantly improve the ECEC of soil, which is in disagreement with other authors [42]. This can be related to pinewood biochar properties. Low temperature (250 °C) developed low specific surface area (SSA) (16.5 m2 g−1) and ECEC (6.64 cmol(+) kg−1), almost equal to sandy loam soil, where it was applied (6.86 cmol(+) kg−1), while Gonzaga et al. [33] described that pinewood biochar produced at 500 °C can obtain higher SSA 72.2 m2 g−1 and cation exchange capacity 11.5 cmol(+) kg−1. We believe that the effect of biochar on soil ECEC is strongly related to surface properties of biochar, i.e., specific surface area, porosity and functional groups. The specific surface area of biochar increases rapidly with increasing temperature of pyrolysis [43]. Thermal decomposition of organic matter and the release of volatile matter during heating promotes micropore formation in biochar, increasing material porosity. Banik et al. [44] reported that the CEC of biochar is dependent on the nature and distribution of O-containing functional groups on the biochar surface. Higher temperatures, above 350 °C, break and rearrange the chemical bonds in the biomass, forming new functional groups, e.g., carboxyl, lactone, quinine, phenol or ether [45]. The negative charge sites on biochar surfaces are attributed to carboxylate and phenolate functional groups [46], increasing biochar CEC. Functional groups on pinewood biochar were not characterized in the study, but we assume that low values of SSA and ECEC are related to not well-developed biochar surface during low temperature of production. Some of the biochar particles were not well charred, and raw wood structure was visible. Greater CEC in PBC-S was observed in the second and third years of the experiment, and also in post-experiment observations in year 2018. This might suggest that application of fresh biochar can have adverse effects on some soil properties [47], while oxidation of biochar surface after biochar is returned to soil can induce superficial CEC increases [48] due to biochar ageing. Aged biochar contains more O-rich functional groups, compared to fresh biochar; this may enhance biochar solubility [49].
4.3. Effects on Exchangeable Cations Content and Soil Acidity
As three years is a relatively short time to observe changes on biochar surface, we assumed that material oxidation could be accelerated by extreme weather conditions during experimental period (lack of moisture and very high temperatures) and input of organic matter from plant residues. Changes of biochar properties were not studied during this experiment, but some authors suggested natural oxidation of biochar surface is not only related to exposure time, but also mean annual temperatures [46] and input of less stable forms of organic matter like plant residues or manure [39,50] what could explain variable effects of PBC application on soil properties between years of experiment performance.
We hypothesized that the content of exchangeable K, Ca, Na and Mg increases in soil if the content of cations contained in biochar is relatively higher than in the soil. Cheng et al. [48] suggested that direct cation release in soil and biochar mixtures is mainly originated from biochar. In PBC, the sum of exchangeable cations (ExC) was almost equal to the sum of ExC in soil, and biochar was not a relevant donor of cations. Even the effect on CEC was non-significant; PBC caused shifts of base cations in sorption complex a year after biochar application. Magnesium cations were exchanged with K+ cations, suggesting that biochar can be a source of potassium for soil, as was also observed in other studies [51].
Biochar application caused significant changes of exchangeable acidity; however trends Ex-acid in C-S followed the pH changes and in PBC-S were related to material properties and high exchangeable acidity of PBC was observed compared to soil (3.8 cmol(+) kg−1, versus 1.8cmol(+) kg−1, respectively). Similar findings were observed by Cheng et al. [48], where application of hard wood biochar derived from black locust (Robinia pseudoacacia L.) doubled Ex-acidity in tested soil.
4.4. Effects on Carbon and Nitrogen Content
Biochar plays a significant role in improving soil quality by storing organic C, thereby improving sustainability of agro-ecosystem [10]. As expected, the soil C content and C:N ratio were significantly increased by biochar application. Wood-derived biochars generally contains more C than biochars derived from other agricultural wastes [46]. Total C values in our pinewood biochar (530 g kg−1) produced at 250 °C were lower than reported by other authors [33,52,53] for pinewood derived biochar at 500 °C that fell within 700–950 g kg−1 of C. Total carbon content in biochars increases with the pyrolysis temperature; this is a well-described phenomenon. Kinney et al. [10] described changes in apple wood biochar properties at different temperatures, showing that content of carbon increases from 59.4% to 93.6% with the increase of pyrolysis temperature from 300 to 700 °C. Increase of total organic carbon in soil is the most commonly described phenomenon by many authors [15,54,55]. It is suggested that climate may induce changes in biochar derived carbon and in temperate climate zones biochar degradation may be accelerated by becoming a primary source of nutrients for microorganism, when other sources of organic matter are scarce.
4.5. Effect on Soil Physical Properties and Availability of Water for Crops
The results obtained in this experiment indicate that biochar application significantly affected the physical properties of sandy loam. Biochar features a quite porous structure and is characterized by low bulk density. Depending on the feedstock of BC and production conditions, its bulk density ranges from 0.08 to 1.7 g cm−3 [56]. Addition of pinewood biochar with the average bulk density of 0.65 g cm−3 leads to a decrease in soil bulk density, an increase in total porosity and higher contribution of mesopores and an increase in water content at the permanent wilting point. Numerous studies indicate that biochar impacts soil water retention and other hydrologic functions, but due to different experimental conditions (including soil type and biochar treatments), results have been variable [55]. Nevertheless, due to the high internal porosity of biochars, studies, in general, support decreased soil bulk density, increased porosity and enhanced water retention [6,19,20,27,31,38,53,56]. Our data showed that soil fertility may be negatively affected by the application of low-temperature pinewood biochar through pH and ECEC decrease and increase of exchangeable acidity; however, some of the soil properties, like carbon content and water availability for plants, were improved. In the experiment, biochar application reduced the negative impact of severe drought during summer 2015. Most of the cornfields surrounding the experimental area (including control plots) had water deficiencies and no grain crops, due to plant desiccation, while on biochar-treated plots, corn plants survived, giving 25% of normal grain yield obtained on similar soils in the area.
4.6. Effects on Maize Growth and Yields
It is frequently suggested that biochar applications to soil can increase agricultural productivity [57]. Our results showed that application of pinewood biochar did not significantly improve soil properties. Results showed that pinewood biochar application increased biomass (shoots and roots) yields, with no significant effect on grain size and weight. However, maize cobs were longer and thicker on PBC-treated soil, and grain yield was higher when pinewood biochar was applied. Similar findings were observed in our previous research (data not published) and also by other authors [58,59,60]. Results show that pinewood biochar could supply plants with available forms of P and K, as the content of this element was higher in corn leafs, as compared to plants grown on control soil. Another explanation can be related to pH changes after biochar application. Decreased pH could increase the bioavailability of elements and plant uptake. Biochar addition has been reported to either increase or decrease nutrient uptake by plants [42,61,62]. Low-temperature biochars contain more nutrients in available forms, as their structure is less condensed. P in biomass is largely retained during pyrolysis, mostly in soluble form. The total P and K content in biochar generally shows an increasing trend as the pyrolysis temperature increases [63], while the bioavailable P and K content significantly decreases with increasing temperature [64], making low-temperature biochar a better source of nutrients for soil and plants [65]. Better maize growth and higher yield may be the effect of improved water retention and better nutrient alleviation, as was also described by Pandit et al. [66]. Our observations show that biochar application can have a positive effect by reducing plant water stress during the drier periods of spring and summer. This suggests that biochar can be a useful tool for mitigating negative impacts of climate change on maize production in temperate climate zones. Similar findings were observed for crops grown in tropical climates, where lack of water is a less probable phenomenon.
5. Conclusions
Application of pinewood-derived biochar at 50 t ha−1 to loamy soil had very limited effects on soil properties; however, it improved maize growth during the three-year field experiment. We observed that some of the chemical properties that are important for soil productivity, like soil pH and cation exchange capacity, were even negatively affected, and the values of these parameters decreased over three years, from biochar application. Instead of this, biochar application significantly enhanced water retention and contributed to greater water-available content to maize during prolonged drier periods in temperate climate. Results showed that pinewood biochar application increased biomass yields, with no significant effect on grain size and weight. However, maize cobs were longer and thicker on PBC-treated soil, and grain yield was higher when pinewood biochar was applied. Higher contents of P and K maize leaves suggest that biochar can also play an important role in nutrient alleviation, probably due to the acidifying effect of the material, which is not a commonly observed phenomenon after biochar application. Use of commercially available low-temperature biochar may bring positive effects on soil and plants’ vegetation; nonetheless, a better understanding of its properties and how it affects soil fertility is necessary to estimate the potential benefits for the farmers and crop production.
Supplementary Materials
The following are available online, at https://www.mdpi.com/article/10.3390/su13073617/s1. File S1: Supplementary data.
Author Contributions
Conceptualization, J.K. and A.L.; methodology, J.K.; validation, J.K. and A.M.-J.; formal analysis, J.K., A.M.-J.; investigation, A.M.-J., A.L., J.K., A.B. and M.B.; writing—original draft preparation, A.M.-J., A.L., J.K., M.D. and D.K.; writing—review and editing, A.M.-J., A.L. and J.K.; visualization, J.K. and A.L.; supervision, A.M.-J., J.K. and A.L. All authors have read and agreed to the published version of the manuscript.
Funding
This research received no external funding.
Data Availability Statement
All field and analytical data will be available from a public repository after project finalizing and data completing.
Acknowledgments
We kindly thank Heinrich Lempke for providing free-of-charge support with this research, such as the field, equipment and advice. We would like to thank to the biochar producer Fluid S.A. Company (Poland) for experiment support with pinewood biochar and financial support of soil and plant analysis. We would like to thank to employees of the Department of Biosystem Engineering (Opole University of Technology) and students for help in the field work. We would like to thank the employees of Institute of Soil Sciences and Environmental Protection (Wroclaw University of Environmental and Life Sciences) for soil and plant analysis.
Conflicts of Interest
The authors declare no conflict of interest.
References
- El-Naggar, A.; El-Naggar, A.H.; Shaheen, S.M.; Sarkar, B.; Chang, S.X.; Tsang, D.C.W.; Rinklebe, J.; Ok, Y.S. Biochar Composition-Dependent Impacts on Soil Nutrient Release, Carbon Mineralization, and Potential Environmental Risk: A Review. J. Environ. Manag. 2019, 241, 458–467. [Google Scholar] [CrossRef] [PubMed]
- Zheng, J.; Stewart, C.E.; Cotrufo, M.F. Biochar and Nitrogen Fertilizer Alters Soil Nitrogen Dynamics and Greenhouse Gas Fluxes from Two Temperate Soils. J. Environ. Qual. 2012, 41, 1361–1370. [Google Scholar] [CrossRef] [PubMed]
- Moura, E.; Gehring, C.; Braun, H.; Ferraz Junior, A.; Reis, F.; Aguiar, A. Improving Farming Practices for Sustainable Soil Use in the Humid Tropics and Rainforest Ecosystem Health. Sustainability 2016, 8, 841. [Google Scholar] [CrossRef]
- Yu, H.; Zou, W.; Chen, J.; Chen, H.; Yu, Z.; Huang, J.; Tang, H.; Wei, X.; Gao, B. Biochar Amendment Improves Crop Production in Problem Soils: A Review. J. Environ. Manag. 2019, 232, 8–21. [Google Scholar] [CrossRef]
- Lehmann, J.; Rillig, M.C.; Thies, J.; Masiello, C.A.; Hockaday, W.C.; Crowley, D. Biochar Effects on Soil Biota—A Review. Soil Biol. Biochem. 2011, 43, 1812–1836. [Google Scholar] [CrossRef]
- Głąb, T.; Palmowska, J.; Zaleski, T.; Gondek, K. Effect of Biochar Application on Soil Hydrological Properties and Physical Quality of Sandy Soil. Geoderma 2016, 281, 11–20. [Google Scholar] [CrossRef]
- Castro, A.; da Silva Batista, N.; Latawiec, A.; Rodrigues, A.; Strassburg, B.; Silva, D.; Araujo, E.; de Moraes, L.; Guerra, J.; Galvão, G.; et al. The Effects of Gliricidia-Derived Biochar on Sequential Maize and Bean Farming. Sustainability 2018, 10, 578. [Google Scholar] [CrossRef]
- Latawiec, A.E.; Strassburg, B.B.N.; Junqueira, A.B.; Araujo, E.D.; de Moraes, L.F.; Pinto, H.A.N.; Castro, A.; Rangel, M.; Malaguti, G.A.; Rodrigues, A.F.; et al. Biochar Amendment Improves Degraded Pasturelands in Brazil: Environmental and Cost- -benefit Analysis. Sci. Rep. 2019, 9, 1–12. [Google Scholar] [CrossRef]
- Gul, S.; Whalen, J.K.; Thomas, B.W.; Sachdeva, V.; Deng, H. Physico-Chemical Properties and Microbial Responses in Biochar-Amended Soils: Mechanisms and Future Directions. Agric. Ecosyst. Environ. 2015, 206, 46–59. [Google Scholar] [CrossRef]
- Kinney, T.J.; Masiello, C.A.; Dugan, B.; Hockaday, W.C.; Dean, M.R.; Zygourakis, K.; Barnes, R.T. Hydrologic Properties of Biochars Produced at Different Temperatures. Biomass Bioenergy 2012, 41, 34–43. [Google Scholar] [CrossRef]
- De Jesus Duarte, S.; Glaser, B.; Cerri, C.E.P. Effect of Biochar Particle Size on Physical, Hydrological and Chemical Properties of Loamy and Sandy Tropical Soils. Agronomy 2019, 9, 165. [Google Scholar] [CrossRef]
- Park, J.H.; Lamb, D.; Paneerselvam, P.; Choppala, G.; Bolan, N.; Chung, J.W. Role of Organic Amendments on Enhanced Bioremediation of Heavy Metal(Loid) Contaminated Soils. J. Hazard. Mater. 2011, 185, 549–574. [Google Scholar] [CrossRef]
- Spokas, K.A.; Cantrell, K.B.; Novak, J.M.; Archer, D.W.; Ippolito, J.A.; Collins, H.P.; Boateng, A.; Lima, I.M.; Lamb, M.C.; Mcaloon, A.J.; et al. Biochar: A Synthesis of Its Agronomic Impact beyond Carbon Sequestration. J. Environ. Qual. 2012, 41, 973–989. [Google Scholar] [CrossRef]
- Novak, J.M.; Lima, I.; Gaskin, J.W.; Steiner, C.; Das, K.C.; Ahmedna, M.; Watts, D.W.; Warren, J.; Schomberg, H. Characterization of Designer Biochar Produced at Different Temperatures and Their Effects on a Loamy Sand. Ann. Environ. Sci. 2009, 3, 195–206. [Google Scholar]
- Chan, K.Y.A.; Van Zwieten, L.; Meszaros, I.A.; Downie, A.C.; Joseph, S.D. Agronomic Values of Greenwaste Biochar as a Soil Amendment. Soil Res. 2007, 45, 629–634. [Google Scholar] [CrossRef]
- Zimmerman, A.R.; Ouyang, L. Priming of Pyrogenic C (Biochar) Mineralization by Dissolved Organic Matter and Vice Versa. Soil Biol. Biochem. 2019, 130, 105–112. [Google Scholar] [CrossRef]
- Uchimiya, M.; Chang, S.; Klasson, K.T. Screening Biochars for Heavy Metal Retention in Soil: Role of Oxygen Functional Groups. J. Hazard. Mater. 2011, 190, 432–441. [Google Scholar] [CrossRef]
- Vaughn, S.F.; Eller, F.J.; Evangelista, R.L.; Moser, B.R.; Lee, E.; Wagner, R.E.; Peterson, S.C. Evaluation of Biochar-Anaerobic Potato Digestate Mixtures as Renewable Components of Horticultural Potting Media. Ind. Crops Prod. 2015, 65, 467–471. [Google Scholar] [CrossRef]
- Brantley, K.; Savin, M.; Brye, K.; Longer, D. Pine Woodchip Biochar Impact on Soil Nutrient Concentrations and Corn Yield in a Silt Loam in the Mid-Southern U.S. Agriculture 2015, 5, 30–47. [Google Scholar] [CrossRef]
- Gaskin, J.W.; Steiner, C.; Harris, K.; Das, K.C.; Bibens, B. Bibens Effect of Low-Temperature Pyrolysis Conditions on Biochar for Agricultural Use. Trans. ASABE 2008, 51, 2061–2069. [Google Scholar] [CrossRef]
- Gupta, S.C.; Larson, W.E. Estimating Soil Water Retention Characteristics from Particle Size Distribution, Organic Matter Percent, and Bulk Density. Water Resour. Res. 1979, 15, 1633–1635. [Google Scholar] [CrossRef]
- Klute, A. Methods of Soil Analysis: Part 1 Physical and Mineralogical Methods, 5.1, 2nd ed.; American Society of Agronomy-Soil Science Society of America: Madison, WI, USA, 1986; Available online: https://doi.org/10.2136/sssabookser5.1.2ed.c28 (accessed on 20 March 2021).
- Brogowski, Z.; Kwasowski, W.; Madyniak, R. Calculating Particle Density, Bulk Density, and Total Porosity of Soil Based on Its Texture. Soil Sci. Annu. 2014, 65, 139–149. [Google Scholar] [CrossRef]
- Mehlich, A. Mehlich 3 Soil Test Extractant: A Modification of Mehlich 2 Extractant. Commun. Soil Sci. Plant Anal. 1984, 15, 1409–1416. [Google Scholar] [CrossRef]
- Gruss, I.; Twardowski, J.P.; Latawiec, A.; Medyńska-Juraszek, A.; Królczyk, J. Risk Assessment of Low-Temperature Biochar Used as Soil Amendment on Soil Mesofauna. Environ. Sci. Pollut. Res. 2019, 26, 18230–18239. [Google Scholar] [CrossRef] [PubMed]
- Oleszczuk, P.; Jośko, I.; Futa, B.; Pasieczna-Patkowska, S.; Pałys, E.; Kraska, P. Effect of Pesticides on Microorganisms, Enzymatic Activity and Plant in Biochar-Amended Soil. Geoderma 2014, 214–215, 10–18. [Google Scholar] [CrossRef]
- Ojeda, G.; Mattana, S.; Àvila, A.; Alcañiz, J.M.; Volkmann, M.; Bachmann, J. Are Soil–Water Functions Affected by Biochar Application? Geoderma 2015, 249–250, 1–11. [Google Scholar] [CrossRef]
- Omondi, M.O.; Xia, X.; Nahayo, A.; Liu, X.; Korai, P.K.; Pan, G. Quantification of Biochar Effects on Soil Hydrological Properties Using Meta-Analysis of Literature Data. Geoderma 2016, 274, 28–34. [Google Scholar] [CrossRef]
- Šimanský, V.; Horák, J.; Igaz, D.; Balashov, E.; Jonczak, J. Biochar and Biochar with N Fertilizer as a Potential Tool for Improving Soil Sorption of Nutrients. J. Soils Sediments 2018, 18, 1432–1440. [Google Scholar] [CrossRef]
- Jeffery, S.; Verheijen, F.G.; van der Velde, M.; Bastos, A.C. A quantitative review of the effects of biochar application to soils on crop productivity using meta-analysis. Agric. Ecosyst. Environ. 2011, 144, 175–187. [Google Scholar] [CrossRef]
- Burrell, L.D.; Zehetner, F.; Rampazzo, N.; Wimmer, B.; Soja, G. Long-Term Effects of Biochar on Soil Physical Properties. Geoderma 2016, 282, 96–102. [Google Scholar] [CrossRef]
- Dai, Z.; Wang, Y.; Muhammad, N.; Yu, X.; Xiao, K.; Meng, J.; Liu, X.; Xu, J.; Brookes, P.C. The Effects and Mechanisms of Soil Acidity Changes, Following Incorporation of Biochars in Three Soils Differing in Initial PH. Soil Sci. Soc. Am. J. 2014, 78, 1606–1614. [Google Scholar] [CrossRef]
- Gonzaga, M.I.S.; Mackowiak, C.; de Almeida, A.Q.; de Carvalho, J.I.T., Jr.; Andrade, K.R. Positive and Negative Effects of Biochar from Coconut Husks, Orange Bagasse and Pine Wood Chips on Maize (Zea Mays L.) Growth and Nutrition. Catena 2018, 162, 414–420. [Google Scholar] [CrossRef]
- Jones, D.L.; Murphy, D.V.; Khalid, M.; Ahmad, W.; Edwards-Jones, G.; DeLuca, T.H. Short-Term Biochar-Induced Increase in Soil CO2 Release Is Both Biotically and Abiotically Mediated. Soil Biol. Biochem. 2011, 43, 1723–1731. [Google Scholar] [CrossRef]
- Krapfl, K.J.; Hatten, J.A.; Roberts, S.D.; Baldwin, B.S.; Rousseau, R.J.; Shankle, M.W. Soil Properties, Nitrogen Status, and Switchgrass Productivity in a Biochar-Amended Silty Clay Loam. Soil Sci. Soc. Am. J. 2014, 78, S136–S145. [Google Scholar] [CrossRef]
- Cely, P.; Gascó, G.; Paz-Ferreiro, J.; Méndez, A. Agronomic properties of biochars from different manure wastes. J. Anal. Appl. Pyrolysis 2015, 111, 173–182. [Google Scholar] [CrossRef]
- Jönsson, L.J.; Martín, C. Pretreatment of Lignocellulose: Formation of Inhibitory by-Products and Strategies for Minimizing Their Effects. Bioresour. Technol. 2016, 199, 103–112. [Google Scholar] [CrossRef]
- Buss, W.; Graham, M.C.; Shepherd, J.G. Risks and Bene Fi Ts of Marginal Biomass-Derived Biochars for Plant Growth. Sci. Total Environ. 2016, 570, 496–506. [Google Scholar] [CrossRef]
- Jiang, X.; Tan, X.; Cheng, J.; Haddix, M.L.; Cotrufo, M.F. Interactions between Aged Biochar, Fresh Low Molecular Weight Carbon and Soil Organic Carbon after 3.5 Years Soil-Biochar Incubations. Geoderma 2019, 333, 99–107. [Google Scholar] [CrossRef]
- Lin, Y.; Munroe, P.; Joseph, S.; Henderson, R. Migration of Dissolved Organic Carbon in Biochars and Biochar-Mineral Complexes. Pesqui. Agropecu. Bras. 2012, 47, 677–686. [Google Scholar] [CrossRef]
- Zhao, R.; Coles, N.; Wu, J. Catena Carbon Mineralization Following Additions of Fresh and Aged Biochar to an Infertile Soil. Catena 2015, 125, 183–189. [Google Scholar] [CrossRef]
- Kloss, S.; Zehetner, F.; Dellantonio, A.; Hamid, R.; Ottner, F.; Liedtke, V.; Schwanninger, M.; Gerzabek, M.H.; Soja, G. Characterization of Slow Pyrolysis Biochars: Effects of Feedstocks and Pyrolysis Temperature on Biochar Properties. J. Environ. Qual. 2012, 41, 990–1000. [Google Scholar] [CrossRef]
- Tan, Z.; Lin, C.S.K.; Ji, X.; Rainey, T.J. Returning Biochar to Fields: A Review. Appl. Soil Ecol. 2017, 116, 1–11. [Google Scholar] [CrossRef]
- Banik, C.; Lawrinenko, M.; Bakshi, S.; Laird, D.A. Impact of Pyrolysis Temperature and Feedstock on Surface Charge and Functional Group Chemistry of Biochars. J. Environ. Qual. 2018, 47, 452–461. [Google Scholar] [CrossRef]
- Tomczyk, A.; Sokołowska, Z.; Boguta, P. Biochar Physicochemical Properties: Pyrolysis Temperature and Feedstock Kind Effects. Rev. Environ. Sci. Biotechnol. 2020, 19, 191–215. [Google Scholar] [CrossRef]
- Atkinson, C.J.; Fitzgerald, J.D.; Hipps, N.A. Potential Mechanisms for Achieving Agricultural Benefits from Biochar Application to Temperate Soils: A Review. Plant Soil 2010, 337, 1–18. [Google Scholar] [CrossRef]
- Paetsch, L.; Mueller, C.W.; Kögel-Knabner, I.; Von Lützow, M.; Girardin, C.; Rumpel, C. Effect of In-Situ Aged and Fresh Biochar on Soil Hydraulic Conditions and Microbial C Use under Drought Conditions. Sci. Rep. 2018, 8, 1–11. [Google Scholar] [CrossRef] [PubMed]
- Cheng, C.; Lehmann, J.; Thies, J.E.; Burton, S.D.; Engelhard, M.H. Oxidation of Black Carbon by Biotic and Abiotic Processes. Org. Geochem. 2006, 37, 1477–1488. [Google Scholar] [CrossRef]
- Luo, Y.; Durenkamp, M.; De Nobili, M.; Lin, Q.; Brookes, P.C. Soil Biology & Biochemistry Short Term Soil Priming Effects and the Mineralisation of Biochar Following Its Incorporation to Soils of Different PH. Soil Biol. Biochem. 2011, 43, 2304–2314. [Google Scholar] [CrossRef]
- Huang, M.; Li, Z.; Luo, N.; Yang, R.; Wen, J.; Huang, B.; Zeng, G. Science of the Total Environment Application Potential of Biochar in Environment: Insight from Degradation of Biochar-Derived DOM and Complexation of DOM with Heavy Metals. Sci. Total Environ. 2019, 646, 220–228. [Google Scholar] [CrossRef]
- Bednik, M.; Medyńska-Juraszek, A.; Dudek, M.; Kloc, S.; Kręt, A.; Łabaz, B.; Waroszewski, J. Wheat Straw Biochar and NPK Fertilization Efficiency in Sandy Soil Reclamation. Agronomy 2020, 10, 496. [Google Scholar] [CrossRef]
- Liu, Z.; Zhang, F.-S.; Wu, J. Characterization and Application of Chars Produced from Pinewood Pyrolysis and Hydrothermal Treatment. Fuel 2010, 89, 510–514. [Google Scholar] [CrossRef]
- Lim, T.J.; Spokas, K.A.; Feyereisen, G.; Novak, J.M. Predicting the Impact of Biochar Additions on Soil Hydraulic Properties. Chemosphere 2016, 142, 136–144. [Google Scholar] [CrossRef]
- Gámiz, B.; Hall, K.; Spokas, K.; Cox, L. Understanding Activation Effects on Low-Temperature Biochar for Optimization of Herbicide Sorption. Agronomy 2019, 9, 588. [Google Scholar] [CrossRef]
- Aller, D.; Rathke, S.; Laird, D.; Cruse, R.; Hatfield, J. Impacts of Fresh and Aged Biochars on Plant Available Water and Water Use Efficiency. Geoderma 2017, 307, 114–121. [Google Scholar] [CrossRef]
- Abel, S.; Peters, A.; Trinks, S.; Schonsky, H.; Facklam, M.; Wessolek, G. Geoderma Impact of Biochar and Hydrochar Addition on Water Retention and Water Repellency of Sandy Soil. Geoderma 2013, 202–203, 183–191. [Google Scholar] [CrossRef]
- Zhang, X.; Zhang, P.; Yuan, X.; Li, Y.; Han, L. Effect of Pyrolysis Temperature and Correlation Analysis on the Yield and Physicochemical Properties of Crop Residue Biochar. Bioresour. Technol. 2020, 296, 122318. [Google Scholar] [CrossRef]
- Xu, G.; Wei, L.L.; Sun, J.N.; Shao, H.B.; Chang, S.X. What Is More Important for Enhancing Nutrient Bioavailability with Biochar Application into a Sandy Soil: Direct or Indirect Mechanism? Ecol. Eng. 2013, 52, 119–124. [Google Scholar] [CrossRef]
- Al-Wabel, M.I.; Usman, A.R.A.; El-Naggar, A.H.; Aly, A.A.; Ibrahim, H.M.; Elmaghraby, S.; Al-Omran, A. Conocarpus Biochar as a Soil Amendment for Reducing Heavy Metal Availability and Uptake by Maize Plants. Saudi J. Biol. Sci. 2015, 22, 503–511. [Google Scholar] [CrossRef] [PubMed]
- Gwenzi, W.; Muzava, M.; Mapanda, F.; Tauro, T.P. Comparative Short-Term Effects of Sewage Sludge and Its Biochar on Soil Properties, Maize Growth and Uptake of Nutrients on a Tropical Clay Soil in Zimbabwe. J. Integr. Agric. 2016, 15, 1395–1406. [Google Scholar] [CrossRef]
- De Lima, J.R.S.; de Moraes Silva, W.; de Medeiros, E.V.; Duda, G.P.; Corrêa, M.M.; Martins Filho, A.P.; Clermont-Dauphin, C.; Antonino, A.C.D.; Hammecker, C. Effect of Biochar on Physicochemical Properties of a Sandy Soil and Maize Growth in a Greenhouse Experiment. Geoderma 2018, 319, 14–23. [Google Scholar] [CrossRef]
- Nelissen, V.; Kumar, B.; Ruysschaert, G.; Boeckx, P. Soil Biology & Biochemistry Effect of Different Biochar and Fertilizer Types on N2O and NO Emissions. Soil Biol. Biochem. 2014, 70, 244–255. [Google Scholar] [CrossRef]
- Zhao, B.; O’Connor, D.; Zhang, J.; Peng, T.; Shen, Z.; Tsang, D.C.W.; Hou, D. Effect of Pyrolysis Temperature, Heating Rate, and Residence Time on Rapeseed Stem Derived Biochar. J. Clean. Prod. 2018, 174, 977–987. [Google Scholar] [CrossRef]
- Uchimiya, M.; Lima, I.M.; Klasson, K.T.; Wartelle, L.H. Contaminant Immobilization and Nutrient Release by Biochar Soil Amendment: Roles of Natural Organic Matter. Chemosphere 2010, 80, 935–940. [Google Scholar] [CrossRef] [PubMed]
- Liu, L.; Tan, Z.; Gong, H.; Huang, Q. Migration and Transformation Mechanisms of Nutrient Elements (N, P, K) within Biochar in Straw–Biochar–Soil–Plant Systems: A Review. ACS Sustain. Chem. Eng. 2018, 7, 22–32. [Google Scholar] [CrossRef]
- Pandit, N.R.; Mulder, J.; Hale, S.E.; Martinsen, V.; Schmidt, H.P.; Cornelissen, G. Biochar Improves Maize Growth by Alleviation of Nutrient Stress in a Moderately Acidic Low-Input Nepalese Soil. Sci. Total Environ. 2018, 625, 1380–1389. [Google Scholar] [CrossRef] [PubMed]


Publisher’s Note: MDPI stays neutral with regard to jurisdictional claims in published maps and institutional affiliations. |
© 2021 by the authors. Licensee MDPI, Basel, Switzerland. This article is an open access article distributed under the terms and conditions of the Creative Commons Attribution (CC BY) license (http://creativecommons.org/licenses/by/4.0/).