Article

Computer Image Analysis as a Method of Evaluating the Quality of Selected Fine-Grained Food Mixtures

by
Dominika Barbara Matuszek
* and
Łukasz Andrzej Biłos
Faculty of Production Engineering and Logistics, Opole University of Technology, 45-758 Opole, Poland
*
Author to whom correspondence should be addressed.
Sustainability 2021, 13(6), 3018; https://doi.org/10.3390/su13063018
Submission received: 24 January 2021 / Revised: 5 March 2021 / Accepted: 7 March 2021 / Published: 10 March 2021

Abstract

:
This work presents the possibility of using computer image analysis to assess the quality of fine-grained food mixtures. The research was carried out using a mixture of wheat flour and algae. These types of ingredients are used, among others, to produce pasta, which is a functional food due to its enrichment with algae. The tests were carried out for mixtures with different shares of algae: 2%, 3% and 4% w/w. Mixing was carried out in a 3D mixer (Turbula® mixer), in which 20, 40 and 60 mL mixing vessels were placed. At the end of the process, samples were taken from four parts (sectors) of the mixing vessels, and then photos were taken with a digital camera. For this purpose, a specially prepared chamber was used, ensuring stable conditions for taking photos. The obtained images were analyzed in the Patan® program, determining the color on the RGB-256 scale. The obtained values were compared with the previously prepared reference specimen (simple linear regression formula). Based on this, it was possible to determine the share of algae in the samples taken and thus to estimate the homogeneity of the tested mixtures. The obtained results indicate the high reliability of the proposed solution.

Graphical Abstract

1. Introduction

Many food products are in the form of mixtures, which in many cases, may consist of a few or even several ingredients, e.g., spice mixtures and instant products. Interest in these types of products has increased over the last 20 years [1]. A popular statement says that food products that have undergone significant grinding are of low quality and less valuable [2].
Mixing in the food industry refers to the process of combining two or more ingredients in order to achieve a certain level of homogeneity. It is one of the most important production steps affecting the quality of the final product. Food powders can have different characteristics such as particle size, brittleness, viscosity, etc. This diversity favors the segregation process (opposite to mixing) and limits the potential to create homogeneous mixtures [1,2,3]. Moreover, it affects the powder behavior during multiple processes such as storage, transport, mixing and compression [4]. The literature on powder mixing is quite broad, but the understanding of the process (especially the mixture state during mixing, the tendency to separate or the kinetics) is still insufficient and needs to be improved [5,6]. It is therefore required to conduct research in order to provide efficient tools that will improve process efficiency and solve the most common problems [2]. One of the key issues is determining the mixing time that will allow obtaining a mixture of the correct quality (homogeneity and uniformity). Defining the right time in terms of quality and economics is a direct result of kinetics [6,7,8]. It is especially important before the product leaves the processing line. This allows for an appropriate reaction and corrective measures to be taken in order to achieve the appropriate homogeneity of the mixture [9,10].
Assessing the homogeneity of powders is a major challenge for engineers. Quality, in this case, is a subjective notion, and there is no single universal definition of homogeneity. Moreover, there is no single universal methodology to determine the homogeneity of powder mixtures [1]. The required degree of mixing may vary depending on the purpose of the blend [11]. Measuring the homogeneity of fine-grained mixtures comes down to determining the concentration level (share) of each key component (tracer) in the samples. Methods such as liquid or gas chromatography are usually used to determine the tracer fraction (dissolution of the powder) [1]. In the case of feed, several indicator methods have been developed and tested, including chlorides [12,13,14], vitamin B12, zinc, copper [14], microtracers [13,15,16] and fluorescent substances [17]. Most of these methods are time-consuming and expensive (especially those based on chemical analysis). Others require the introduction of a foreign component into the mixing process, called a tracer (such as microtracers or fluorescent tracers). It is sometimes possible to physically separate the components and measure their share. However, this task is very difficult in the case of powders [1]. For nearly two decades, research on new methods for assessing the homogeneity of such mixes has been conducted and published [1]. Among them, the use of computer image analysis has attracted particular interest. Thus, for many years, the authors of this work interested in this tool have been testing its capabilities in assessing the homogeneity of granular mixtures. However, recently, a workbench was developed based on binary and multicomponent mixtures of whole grains (not ground) [18,19]. In the latest tests, interesting results have been obtained by combining the fluorescence phenomenon and computer image analysis to assess the homogeneity of components subjected to grinding [17,18,20,21]. Excellent results have been obtained for vision systems based on grayscale image analysis [22]. Research in this area was carried out, among others, by Realpe and Velảzquez [22]. In their study, the fraction of the key component was estimated on the basis of values in grayscale (0–255) and compared with the prepared standard. The tests were performed on two-component granular mixtures: lactose and chocolate, blue lactose and chocolate, and blue lactose and cellulose. A similar solution was used by Mayer et al. [23]. In the mixing of couscous (colored in black) with white lactose powder, the analysis of the key ingredient (lactose) was conducted by grayscale analysis (0–255), followed by binarization (0 and 1) [23]. Garth used L*a*b* color values to assess the homogeneity of fortified dairy powder. To obtain a color difference, red iron oxide pigment powder was introduced into the mixture [24]. Based on these reports and the authors’ experience, it was decided to test the RGB-256 scale and experimentally prepare standard specimens for assessing the contribution of the key ingredient (and thus the homogeneity of the mixture) while mixing components used in food production: wheat flour and algae.
The mixing device, which was used in the present research, also seems to be interesting. The authors used a 3D mixer (also known as a tubular powder mixer or a tumbler powder mixer). The Turbula® mixer was used in laboratory research and industry to test powder preparations in the 1990s. Research with this device is still being carried out [23,25,26]. The mixing vessel (max. 2 L capacity) is placed in a special structure that moves in many directions (horizontal movement, three-dimensional rotation) to realize the various movements of the mixed materials. The material is subjected to a constantly changing, rhythmically pulsating motion [27]. This mixer has been used, so far, to mix materials with various properties, such as minerals [28], drugs [29], food components [23] or cohesive materials [30]. The authors decided to use the capabilities of this device in mixing powders used for food production, e.g., pasta.
The main aim of this study is to determine whether image analysis in the RGB scale can be used to assess the homogeneity of two-component fine-grained systems (wheat flour–algae) with a slight share of algae. In other words, will the analysis of the photos of the mixture based on the RGB scale allow obtaining information about the content (quantitative method) of the key component (algae)? Therefore, in the first step, a standard specimen (set) of the powder mixtures from 0% to 10% w/w of algae in 1% intervals was prepared. The dependence of the color number (obtained by analyzing the image of the samples) on the percentage share of the tracer (algae) was determined. Then, the mathematical relationship was used to assess the share of algae (in% w/w) after mixing in the Turbula® mixer. The main research problem was formulated into the question: Will image analysis in the RGB scale be precise enough (sufficient) to capture the difference in the color of the mixture samples with a slight share of the tracer (a few percent)? The answer to this question is important for the possibility of using this tool in industrial conditions, where additives are present in slight amounts (a few percent).

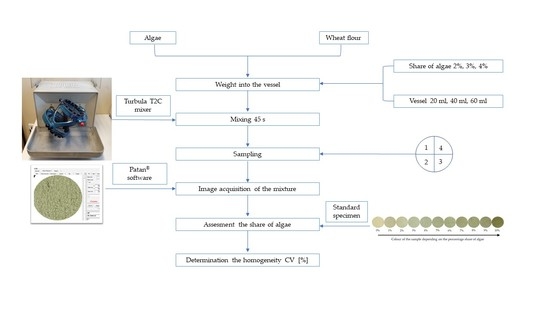
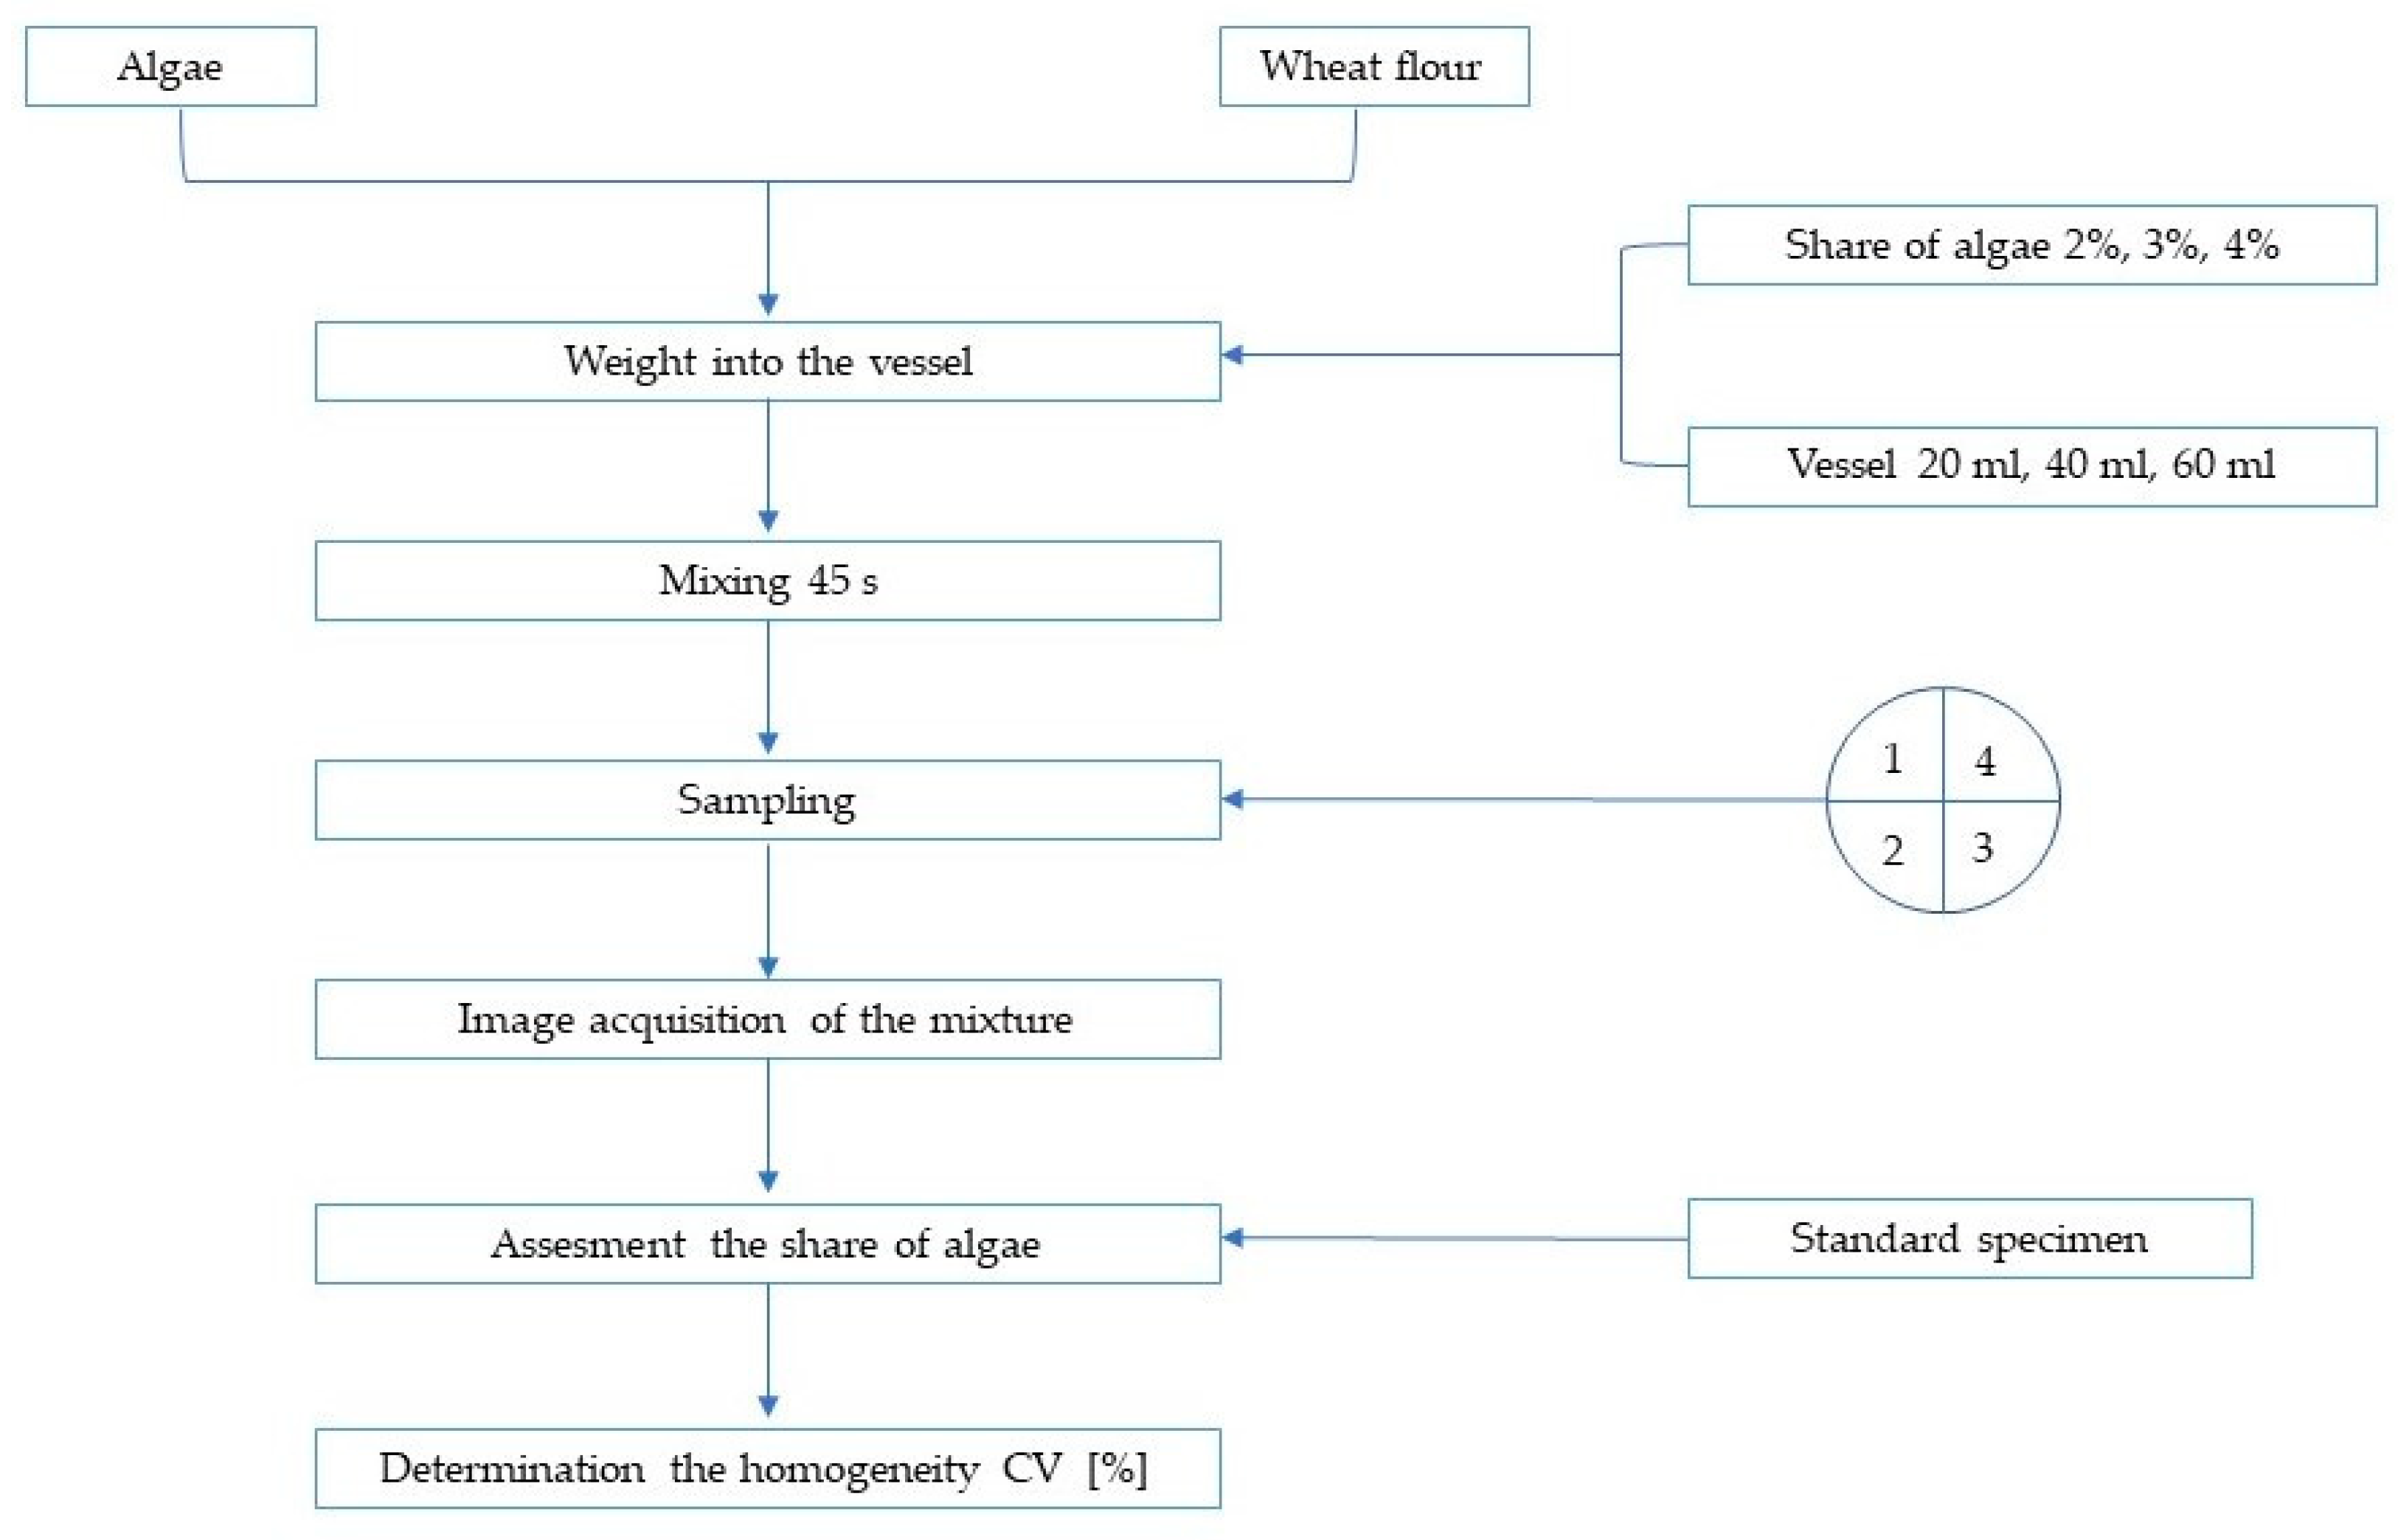
2. Materials and Methods

The first step of the research was the development of a pattern (standard specimen) in which a given share of algae (% w/w) was represented by a color number calculated by RGB values. For this, a set of powder mixtures (wheat flour and algae) from 0% to 10% w/w of the main component (algae) in 1% intervals was prepared. From each mixture, three samples were taken and placed in the chamber prepared for taking pictures. The samples were different in color (Figure 1). The obtained photos were analyzed in the dedicated Patan® program (by Krótkiewicz), determining for each sample three values, respectively, for the RGB scale. Then, the color number (R*65,536 + G*256 + B) was calculated [31]. It turned out that the obtained RGB values for the samples were different depending on the given wt.% of the algae. Moreover, it can be described by a negative linear correlation, where the color number decreases with the proportion of algae share. The intensity of the linear correlation is very high, with a Pearson’s correlation coefficient of −0.9792. Based on this, a simple linear regression was used (least-squares fitting) for the color number and algae proportion variables (Figure 2). This mathematical representation yielded a very high coefficient of determination of 0.9588 and was then used to determine the share of algae in the tested samples. The procedure for obtaining the photos and computer image analysis was the same for all the performed tests, i.e., during the evaluation of the tracer fraction in mixtures of algae with wheat flour (the methodology is described later in the paper).
Mixing of powders containing algae of different fractions (2%, 3% and 4% w/w) and wheat flour was carried out. Wheat flour is an ingredient commonly used in the food industry, and algae are an excellent additive for improving the health properties of the final product, giving the possibility to include it in the so-called functional food category [32]. The characteristics of the ingredients used are presented in Table 1. Algae (chlorella), in this case, was treated as a key ingredient. In powder technology, the assessment of homogeneity is most often based on measuring the concentration of the selected key ingredient (the so-called tracer). Depending on the type of tracer, its content is marked differently [3].
The weighed-out amounts of the individual ingredients were placed in a 20, 40 and 60 mL mixing vessel with a 65% filling ratio (Table 2). However, the flour was placed in the lower part of the vessel and algae in the upper part. The vessel was made of plastic. The mixing process was carried out in the Turbula® T2C mixer (Willy A. Bachofen AG Maschinenfabrik, Basel, Figure 3). This model has a mixing chamber (cage) that can hold a vessel with a capacity of up to 2 L and a rotational speed from 22 to 96 rpm [33]. The technical parameters of the unit and the mixing vessel used for the tests are presented in Table 3.
The time of mixing was 45 s. After the process was completed, samples were taken from four parts (sectors) of the mixing vessel (three samples from each sector). Then, samples were placed in the chamber on prepared plates with circular holes 23 mm in diameter and 5 mm high. The weight of a single sample was 1 mg. The chamber was made of a material resistant to daylight. Therefore, it guaranteed the invariability of parameters during the acquisition of images, which is very important [34]. The samples were evenly illuminated with two T5 8W/642 lamps. The photos were taken with a digital camera (16 MP Panasonic Lumix DMC G7, Hamburg, Germany), which was installed in the upper part of the chamber, directly above the mixture samples. Then, based on the dedicated Patan® program (by Krótkiewicz), RGB-256 scale values were determined for each sample photo. The obtained values (R, G and B) were converted into a color number in accordance with the previously presented formula. In the next step, the previously prepared standard was used (Figure 2). Based on the proposed formula of simple linear regression, the fraction of algae in the taken samples was estimated. Based on this, the content of the key ingredient (algae) was obtained for each series of tests, i.e., depending on the amount of algae introduced and the capacity of the mixing vessel. The obtained data were then used to calculate the coefficient of variation (100 × standard deviation/mean) as a homogeneity index.
The whole procedure is summarized in Figure 4. Each test was performed in three repetitions.

3. Results

The results of algae fraction and the coefficient of variation are presented in Table 4.
A graphical interpretation of the algae share obtained during mixing in a vessel of different capacities (20, 40 and 60 mL), depending on the amount of the tracer introduced, is shown in Figure 5, Figure 6 and Figure 7, and Figure 8 refers to the homogeneity results.
Table 4 shows the results of the color number obtained from the RGB values for the images of the mixture samples and the corresponding algae share estimated based on the simple linear regression formula (Figure 2). Analyzing the presented results, it can be observed that in each case, the tracer fraction was obtained close to the preset amount, especially for 3 %and 4% algae (Table 4, Figure 5, Figure 6 and Figure 7). The average values for the 2% algae input were 2.76%, 2.69% and 4.09% for the 20, 40 and 60 mL mixing vessels, respectively. Whereas for the target content of algae equals o 3%, the average values of the key ingredient were 3.48%, 3.46% and 4.04%; for the target content, of 4% they were 3.80%, 3.96% and 3.98%, respectively. The biggest differentiation of the results (deviation from the mean value) was noted for the 2% and 3% algae mixtures mixed in a 20 mL vessel. For these cases, the maximum values of the standard deviation of 1.14 and 0.53, respectively, were obtained. However, the lowest differentiation occurs in the case of the 4% mixtures mixed in 40 (SD = 0.03) and 60 mL (SD = 0.02) vessels. It can also be observed that in the case of smaller amounts of the key component (2% and 3% of the preset amount), the determination of its fraction based on the analysis of the RGB image leads to the overestimation of its amount in the samples. This is visible especially in the case of mixing wheat flour with 2% algae in a 60 mL vessel. In this case, the computer analysis of the image of the samples showed more than twice as much as the set amount (average value of 4.09%, Table 4, Figure 7). This may be due to the imperfection of the computer image analysis. It seems that with the small share of the coloring substance (algae), grayscale image analysis is not able to accurately detect the differences in the samples’ colors. This problem does not occur during mixing with the greater share of the tracer (for example, 4%). Analyzing the mixing process itself and the obtained algae share, that the key component tends to occupy a specific location (sector) in the mixing vessel was not observed. This may be caused, among other things, by the slight differentiation of the mixed materials in terms of particle size (Table 1). In Figure 5, Figure 6 and Figure 7, the sample number corresponds to the number of sectors from which three samples of the mixture were taken. However, it is worth emphasizing that the obtained mixture was analyzed only in one dimension, i.e., horizontally. No vertical analysis was performed. Although the two-dimensional observation is an important issue for the correct assessment of the quality of the final product [35], this was not the objective of the study at this stage. The aim of the tests was to verify the usefulness of the image analysis on the RGB scale to assess the share of tracer in the two-component powder mixtures and thus to assess the homogeneity of these mixtures. Referring to the standard specimen prepared in the first step, it can be concluded that this method is simple and reliable. A very high linear correlation of the variables (color number, algae share) and a highly reliable model (simple linear regression) were obtained. However, the accuracy of the method depends on the share of coloring substance (algae). The results concerning the homogeneity of the tested mixtures based on the image analysis of samples are presented in Figure 8.
Figure 8 shows the results of the coefficient of variation (CV) depending on the preset amount of the key ingredient (2%, 3% and 4% w/w) and the volume of the mixing vessel (20, 40 and 60 mL). The coefficient of variation determines the degree of variety of the tracer share in the samples taken. For an ideal (homogeneous) state of mixing (distribution of the tracer in the mixture), the CV value is 0. In response to the greater variety of the tracer share in the collected samples, this coefficient also increases. In the pharmaceutical industry, the CV serves as the official standard for the mixing of marketed drugs, and its admissible value is 6% [36]. There is no such standard for the food industry; however, in practice, it is often used [1,37]. The coefficient is also a determinant of feed homogeneity, and its acceptable level is CV ≤ 10% [38]. The results of the coefficient of variation obtained (Table 4, Figure 8) show that only in one case did the homogeneity of the mixture exceed the acceptable level (CV = 12.13%). It concerns mixing 2% algae in the mixture using a 20 mL vessel. This is certainly due to the previously indicated large diversity of the results (max SD = 1.14, Table 4). The remaining results (range between 2.13% and 4.94%) indicate the correct degree of wheat flour and algae mixing (6% was not exceeded). These data not only indicate a slight variation in the share of algae in the samples taken (and thus good homogeneity) but also confirm the usefulness of the proposed method of the research. Image analysis and the referencing of the data with the obtained pattern give repeatable results (only slight diversification). However, it is worth optimizing the method in terms of image acquisition and/or processing especially in the case of a small share of key components.

4. Discussion

This study describes the possibility of using computer image analysis to determine the content of the key component (algae) based on the taken samples. The use of this tool in mixing granular materials is not a novelty. However, it is worth noticing that in the case of fine-grained materials (powders), the vision methods are constantly being improved. Some solutions use highly specialized tools, especially tomographic techniques, such as image analysis, focused on the use of the positron emission particle tracking (PEPT) technique [39,40]. This technique is used to track particles while being mixed; however, its accuracy decreases as the particle speed increases. Moreover, this method is quite expensive [41]. Spectroscopic techniques are also quite popular, especially near-infrared spectroscopy (NIR), which is the cheapest in this group (but still quite expensive). This method has found its application especially in the pharmaceutical industry. Research in this area was carried out, among others, by Wahl et al. to analyze the homogeneity of tablets obtained in industrial tablet press [42]. Osorio et al. used it to analyze the mixing process of pharmaceutical powders [43], whereas He et al. used it to assess the effect of cohesion and granule size on the heterogeneity of pharmaceutical powders [44]. The advantages of this method are reasonable costs and the online/continuous monitoring of samples. On the other hand, the disadvantage is the difficulty of detecting smaller components of the mixture or limited light penetration into the sample. Vision techniques also include methods based on image analysis of the samples taken. They most often require interference with the mixed materials in order to take samples (which is a disadvantage of the method) but are characterized by simplicity and low cost. Another disadvantage is a considerable limitation in the case of mixing components of a similar color [41]. The method presented in this paper also belongs to this group. At this stage, the problem of the need for invasive sampling certainly remains unsolved. It is worth noticing, however, that the first tests give highly promising results and the method at this point has advantages such as low cost and easy performance. It is also worth noticing that the mixed ingredients are contained in food mixtures used by the industry. What is more, the selection of different proportions of the key component was made based on wheat pastas available on the market with the addition of algae. This is an additional advantage of this study. Moreover, no additional/foreign markers were introduced into the powder mixture. Thanks to that, it is possible to use it in industrial conditions, and the method itself takes on proenvironmental features (no waste production). Sampling can take place at any required point of the production line (for example, from the mixer or from bags with the final product), as well as image acquisition and its analysis in an adopted laboratory. So far, the methods based on image analysis required the introduction/use of mixing an ingredient with a color that distinguishes it from other ingredients. Most often, it consisted of dyeing a selected component such as couscous groats in black [23] or maize with a fluorescent substance [34]. The use of the so-called “wet method” can lead to the production of wastes, which, in turn, has a negative impact on the environment. Moreover, the application of a coloring component makes this method quite limited. The obtained content of algae based on grayscale and simple linear regression model (Figure 2) can be used to assess the homogeneity of fine-grained components. Similar observations have been made by Realpe et al. during the evaluation of the fraction of lactose and blue lactose based on image analysis and a model using partial least-squares. The authors developed a calibration model prepared using powder mixtures from 0% to 100% w/w of the main component in 10% intervals [22]. Therefore, the question arose whether it is possible to develop a model in a narrower range, i.e., from 0% to 10% w/w of the main component in 1% intervals. What is the purpose of looking for such a solution? The answer is that in food production, additives such as dyes, preservatives and others are used in small amounts (a few percent of the mixture). Therefore, obtaining this type of tool will allow using it in industrial practice for a quick assessment of the homogeneity of the mixed system and thus the effective determination of the right time of mixing. In the work of Realpe et al., a highly reliable (R2 > 0.9) model was obtained [22].
The presented studies are pilot studies, and the results are highly promising. On top of that, based on the authors’ experience, it seems possible to develop a method to obtain a palette of standards, which will then be used to assess the homogeneity of fine-grained mixtures (for example, pastas fortified with algae, spinach, paprika and others) not only in laboratory conditions. Therefore, tests with different powder components are planned, the methodology will be clarified (especially in the field of the acquisition of sample images), and the procedure for using the proposed tool will be defined. The key component is certainly the issue related to the acquisition of images (the need to separate external factors, as well as digital camera parameters and settings). However, when it comes to RGB data acquisition (analysis of the acquired image), it seems that there is no need to use the Patan® program used by the authors. Another (more widely available) program can probably be used. However, this requires additional analysis. Moreover, it is planned to conduct image analysis based on the CIE L*a*b* method. The usefulness and effectiveness of this method have been confirmed in tests on food products [21,45,46].

5. Conclusions

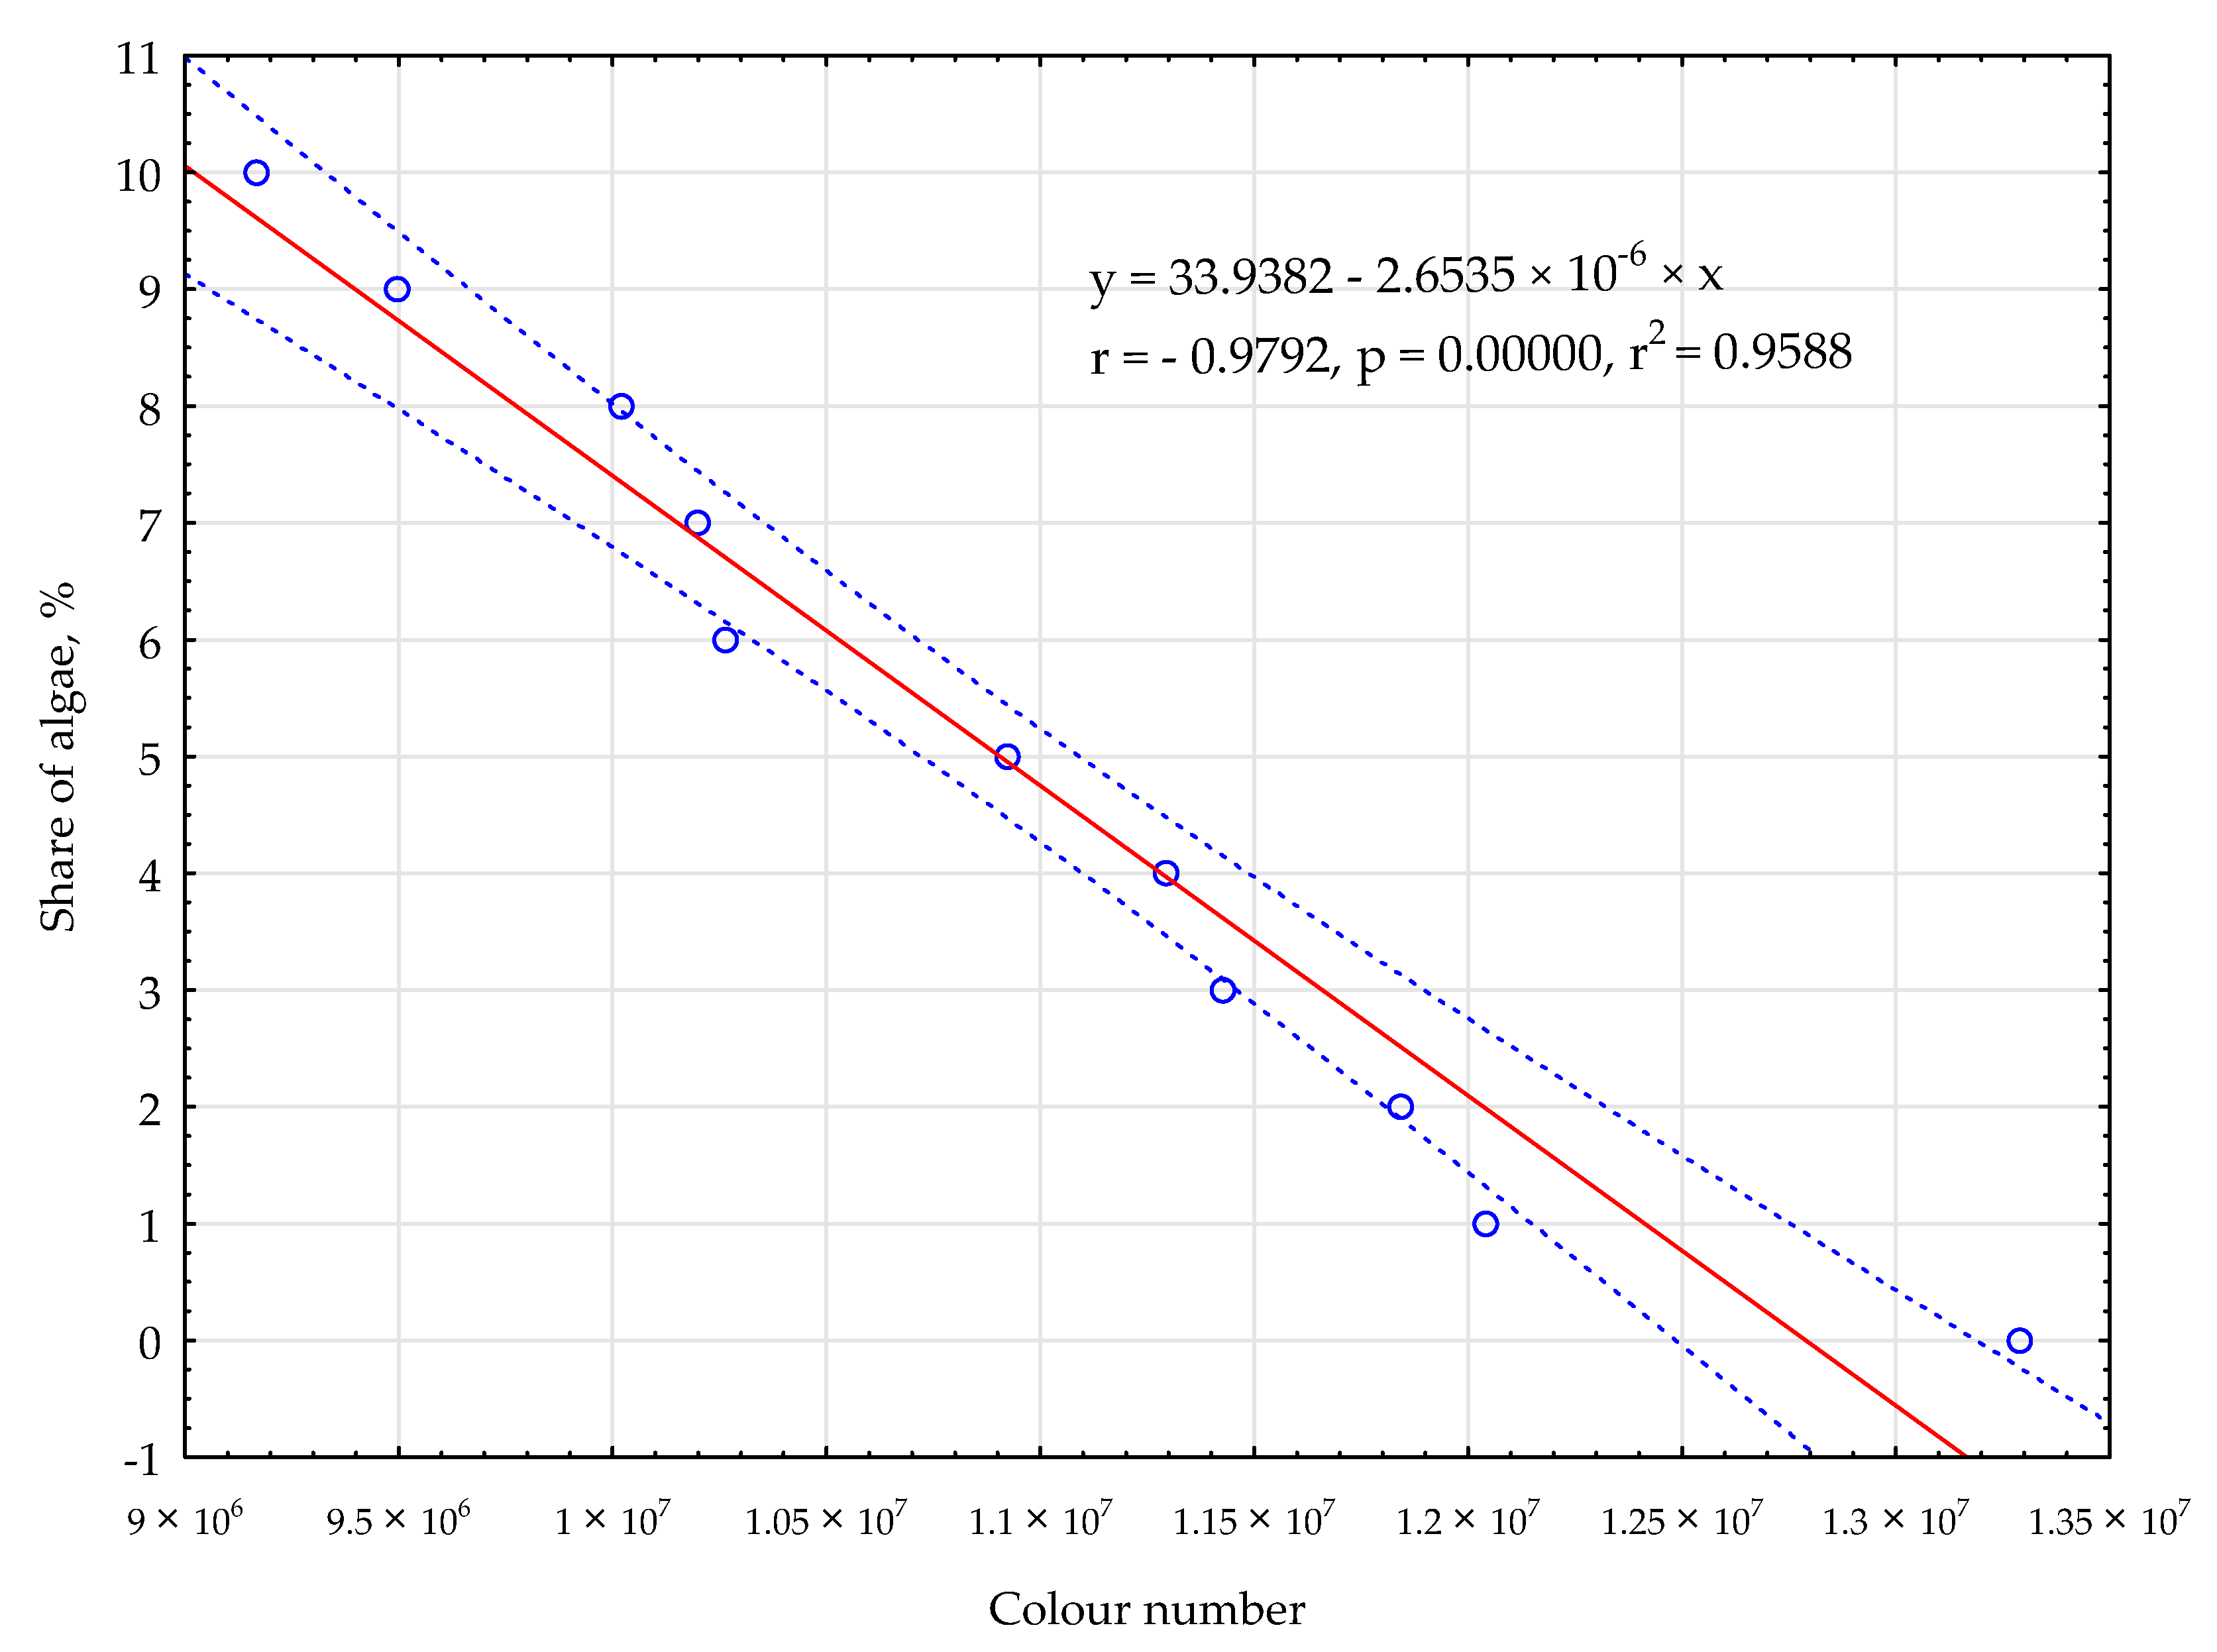
  • The authors obtained a model (simple linear regression) to predict the concentration of algae in a mixture with wheat flour. This model is highly reliable, with an R2 value of 0.9588.
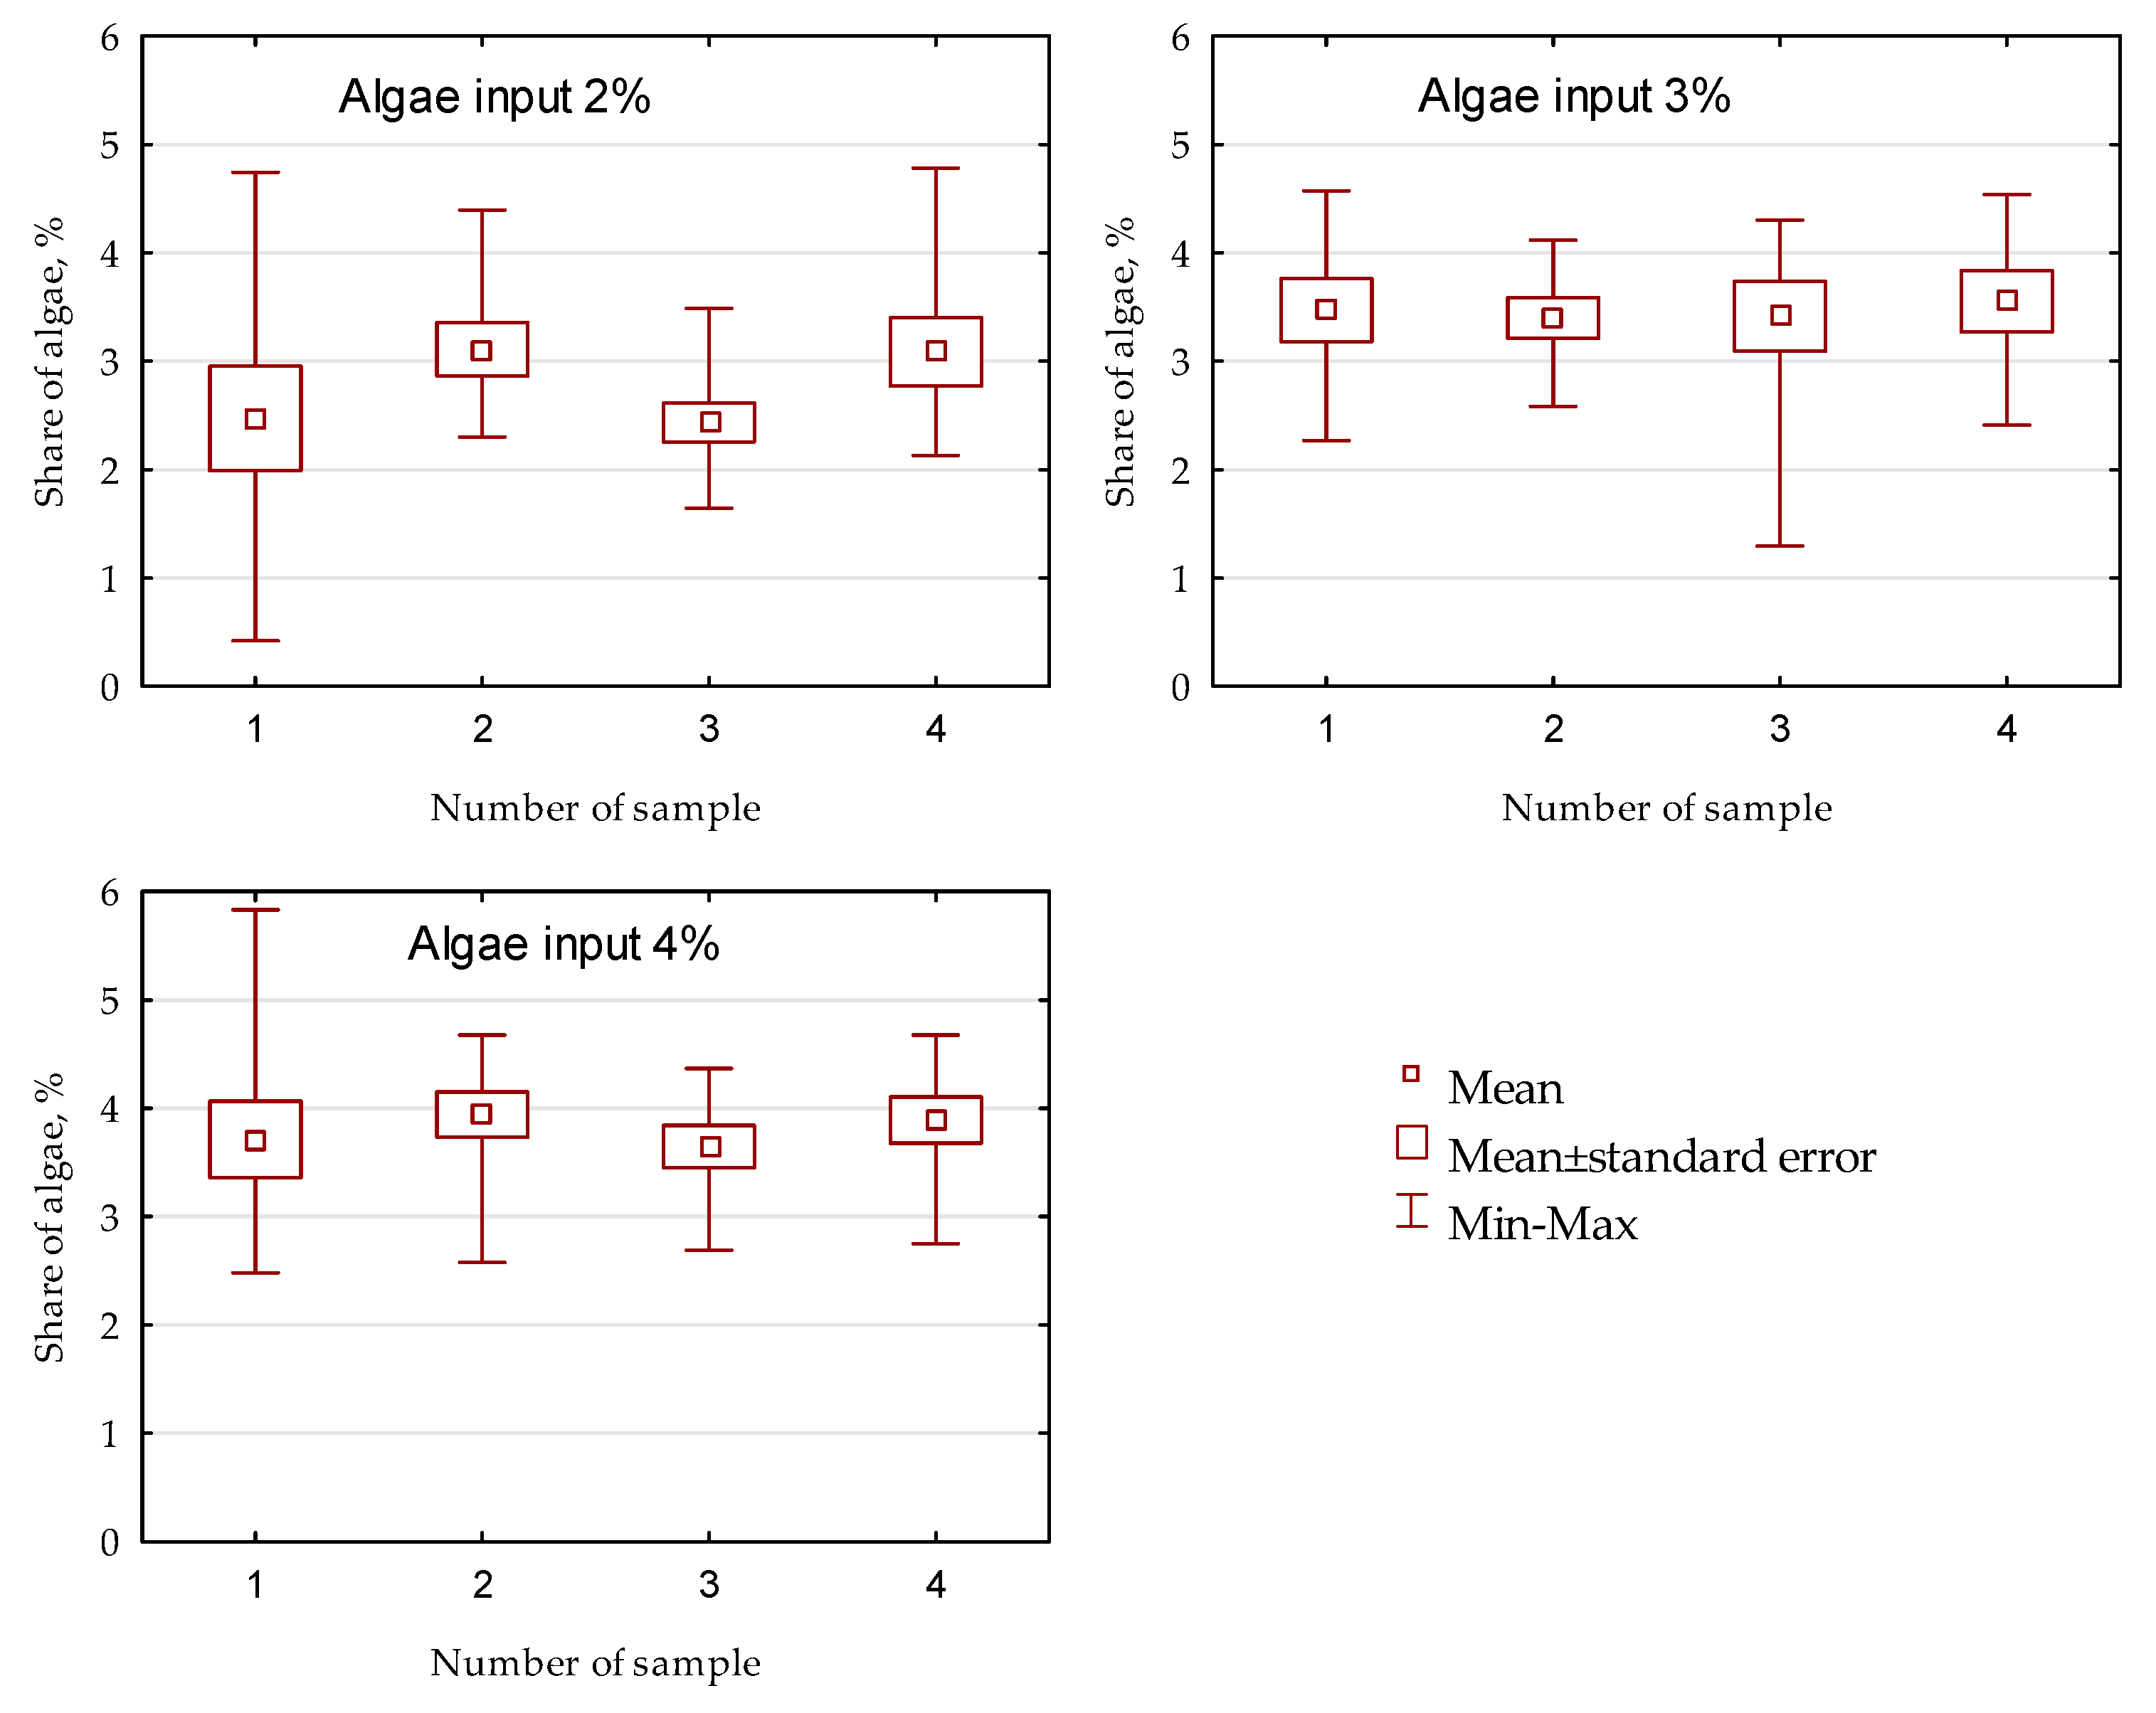
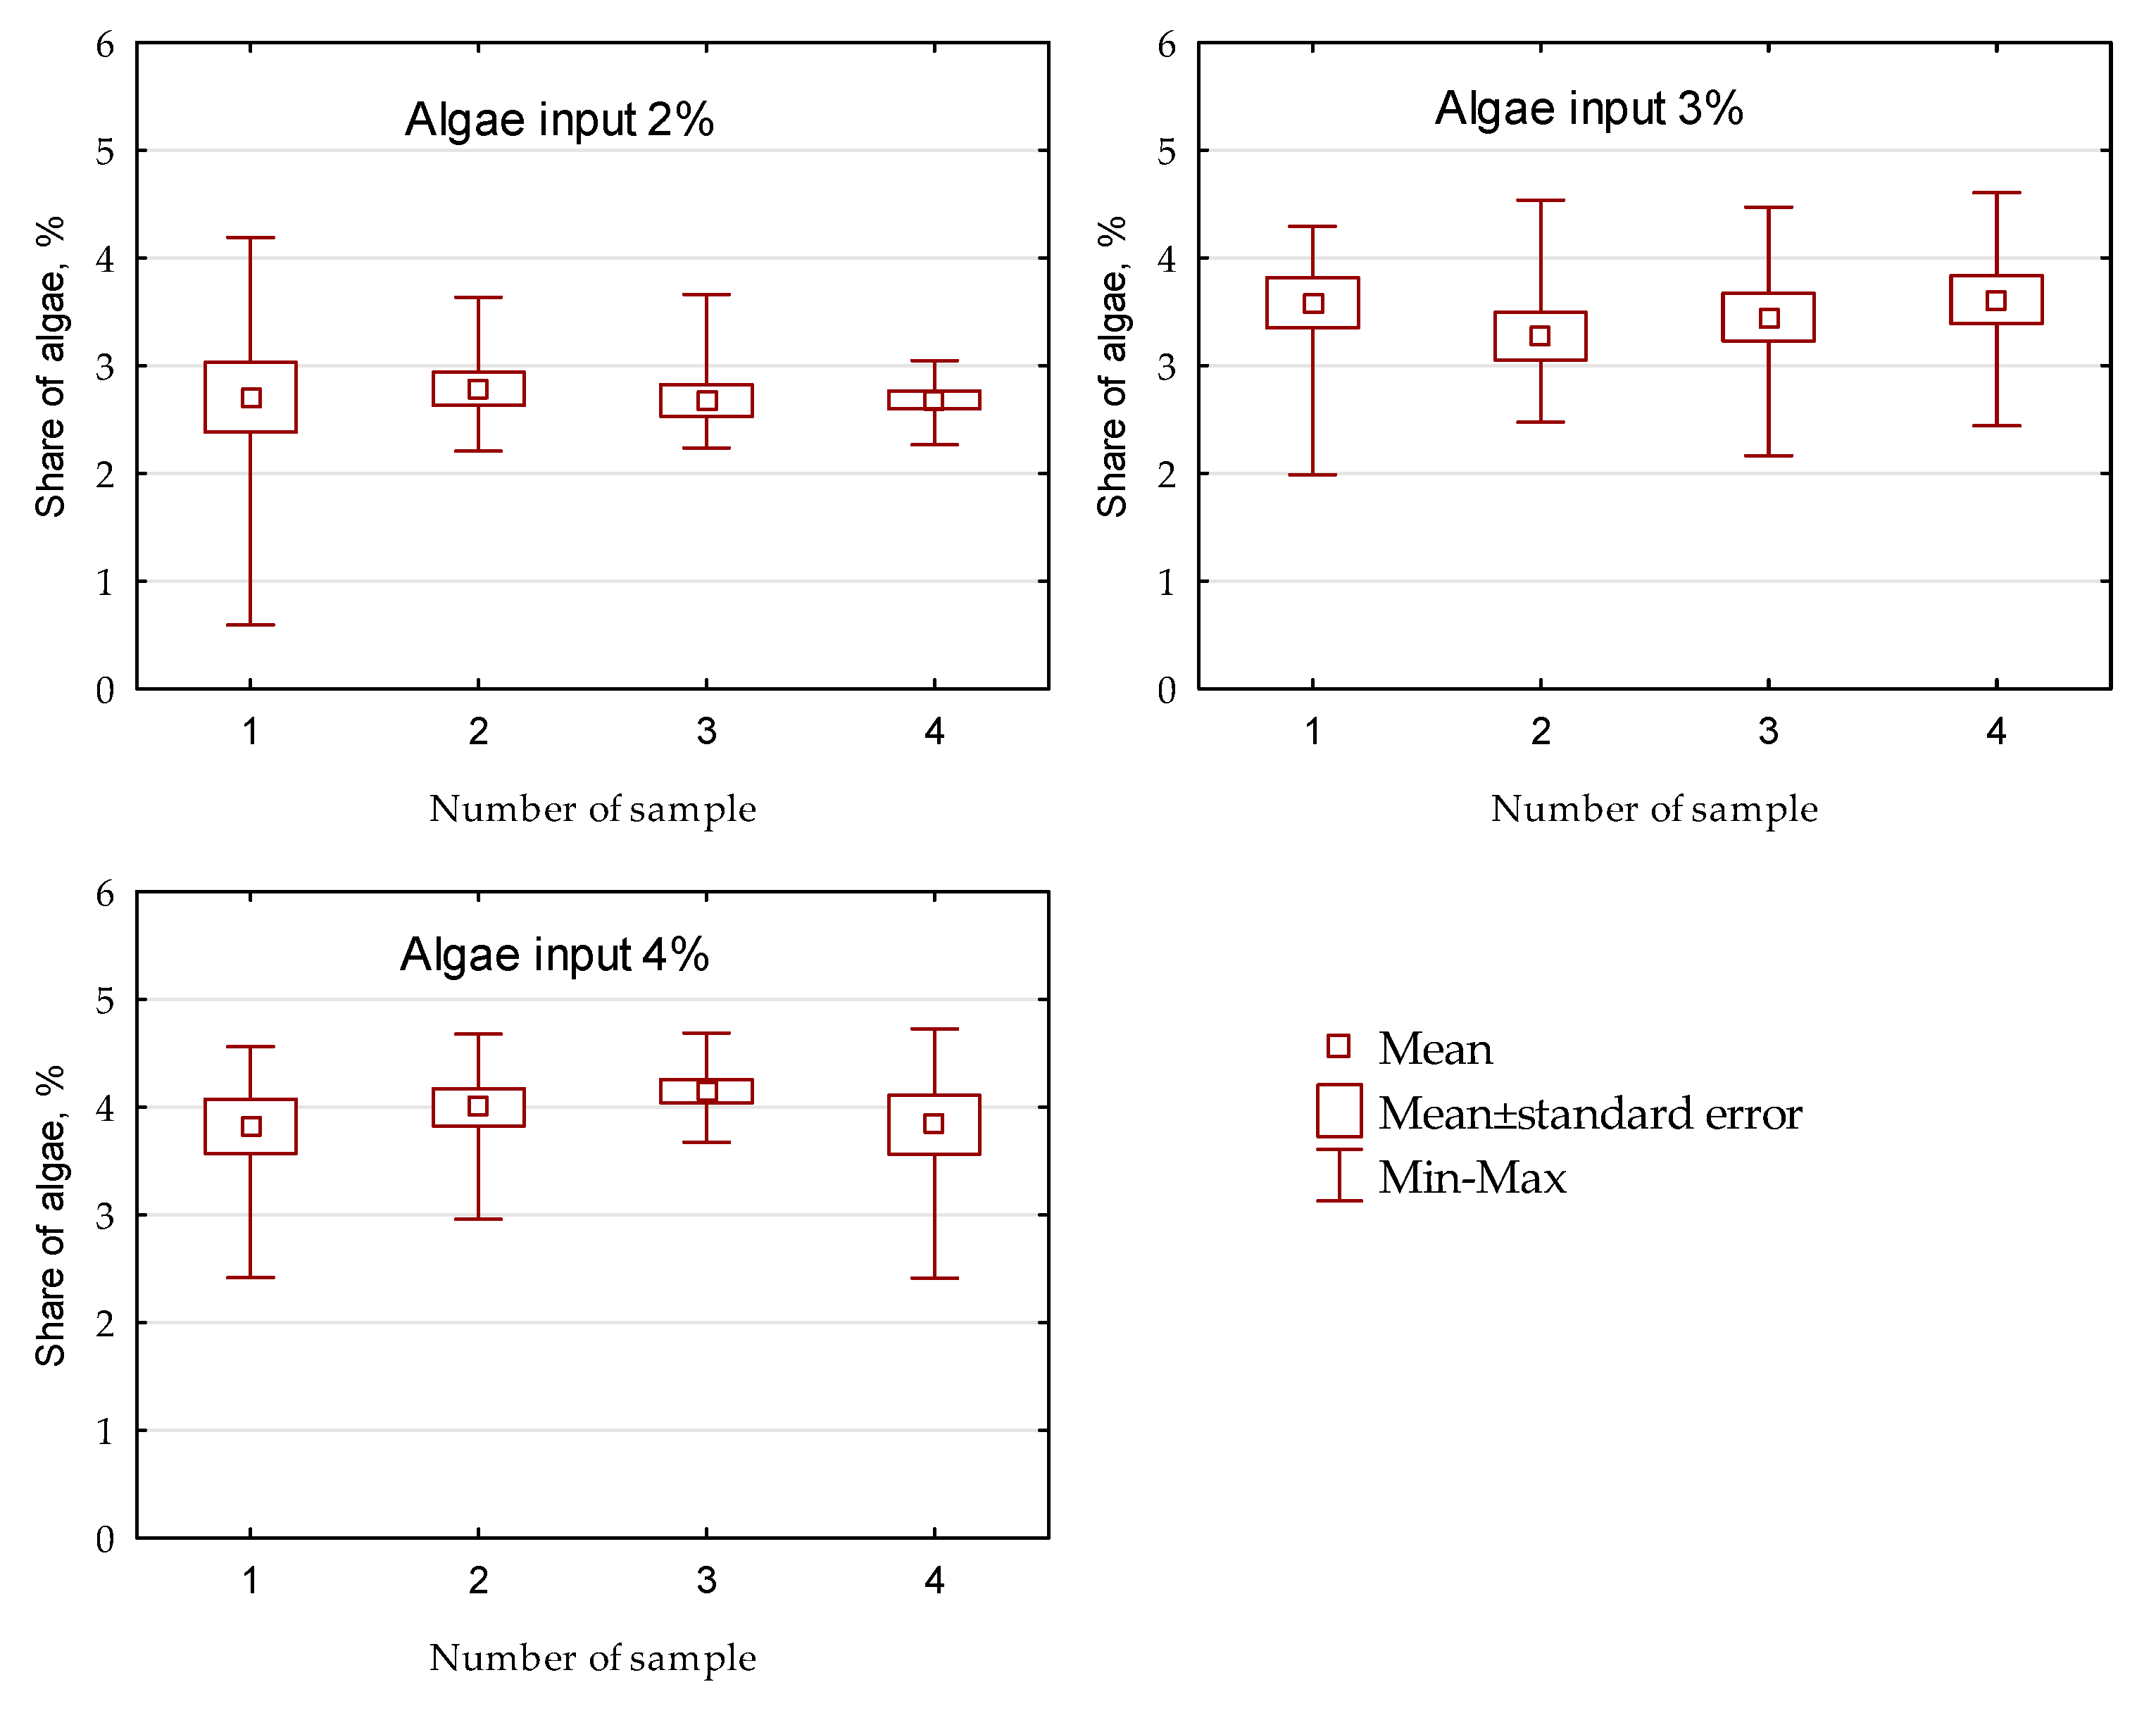
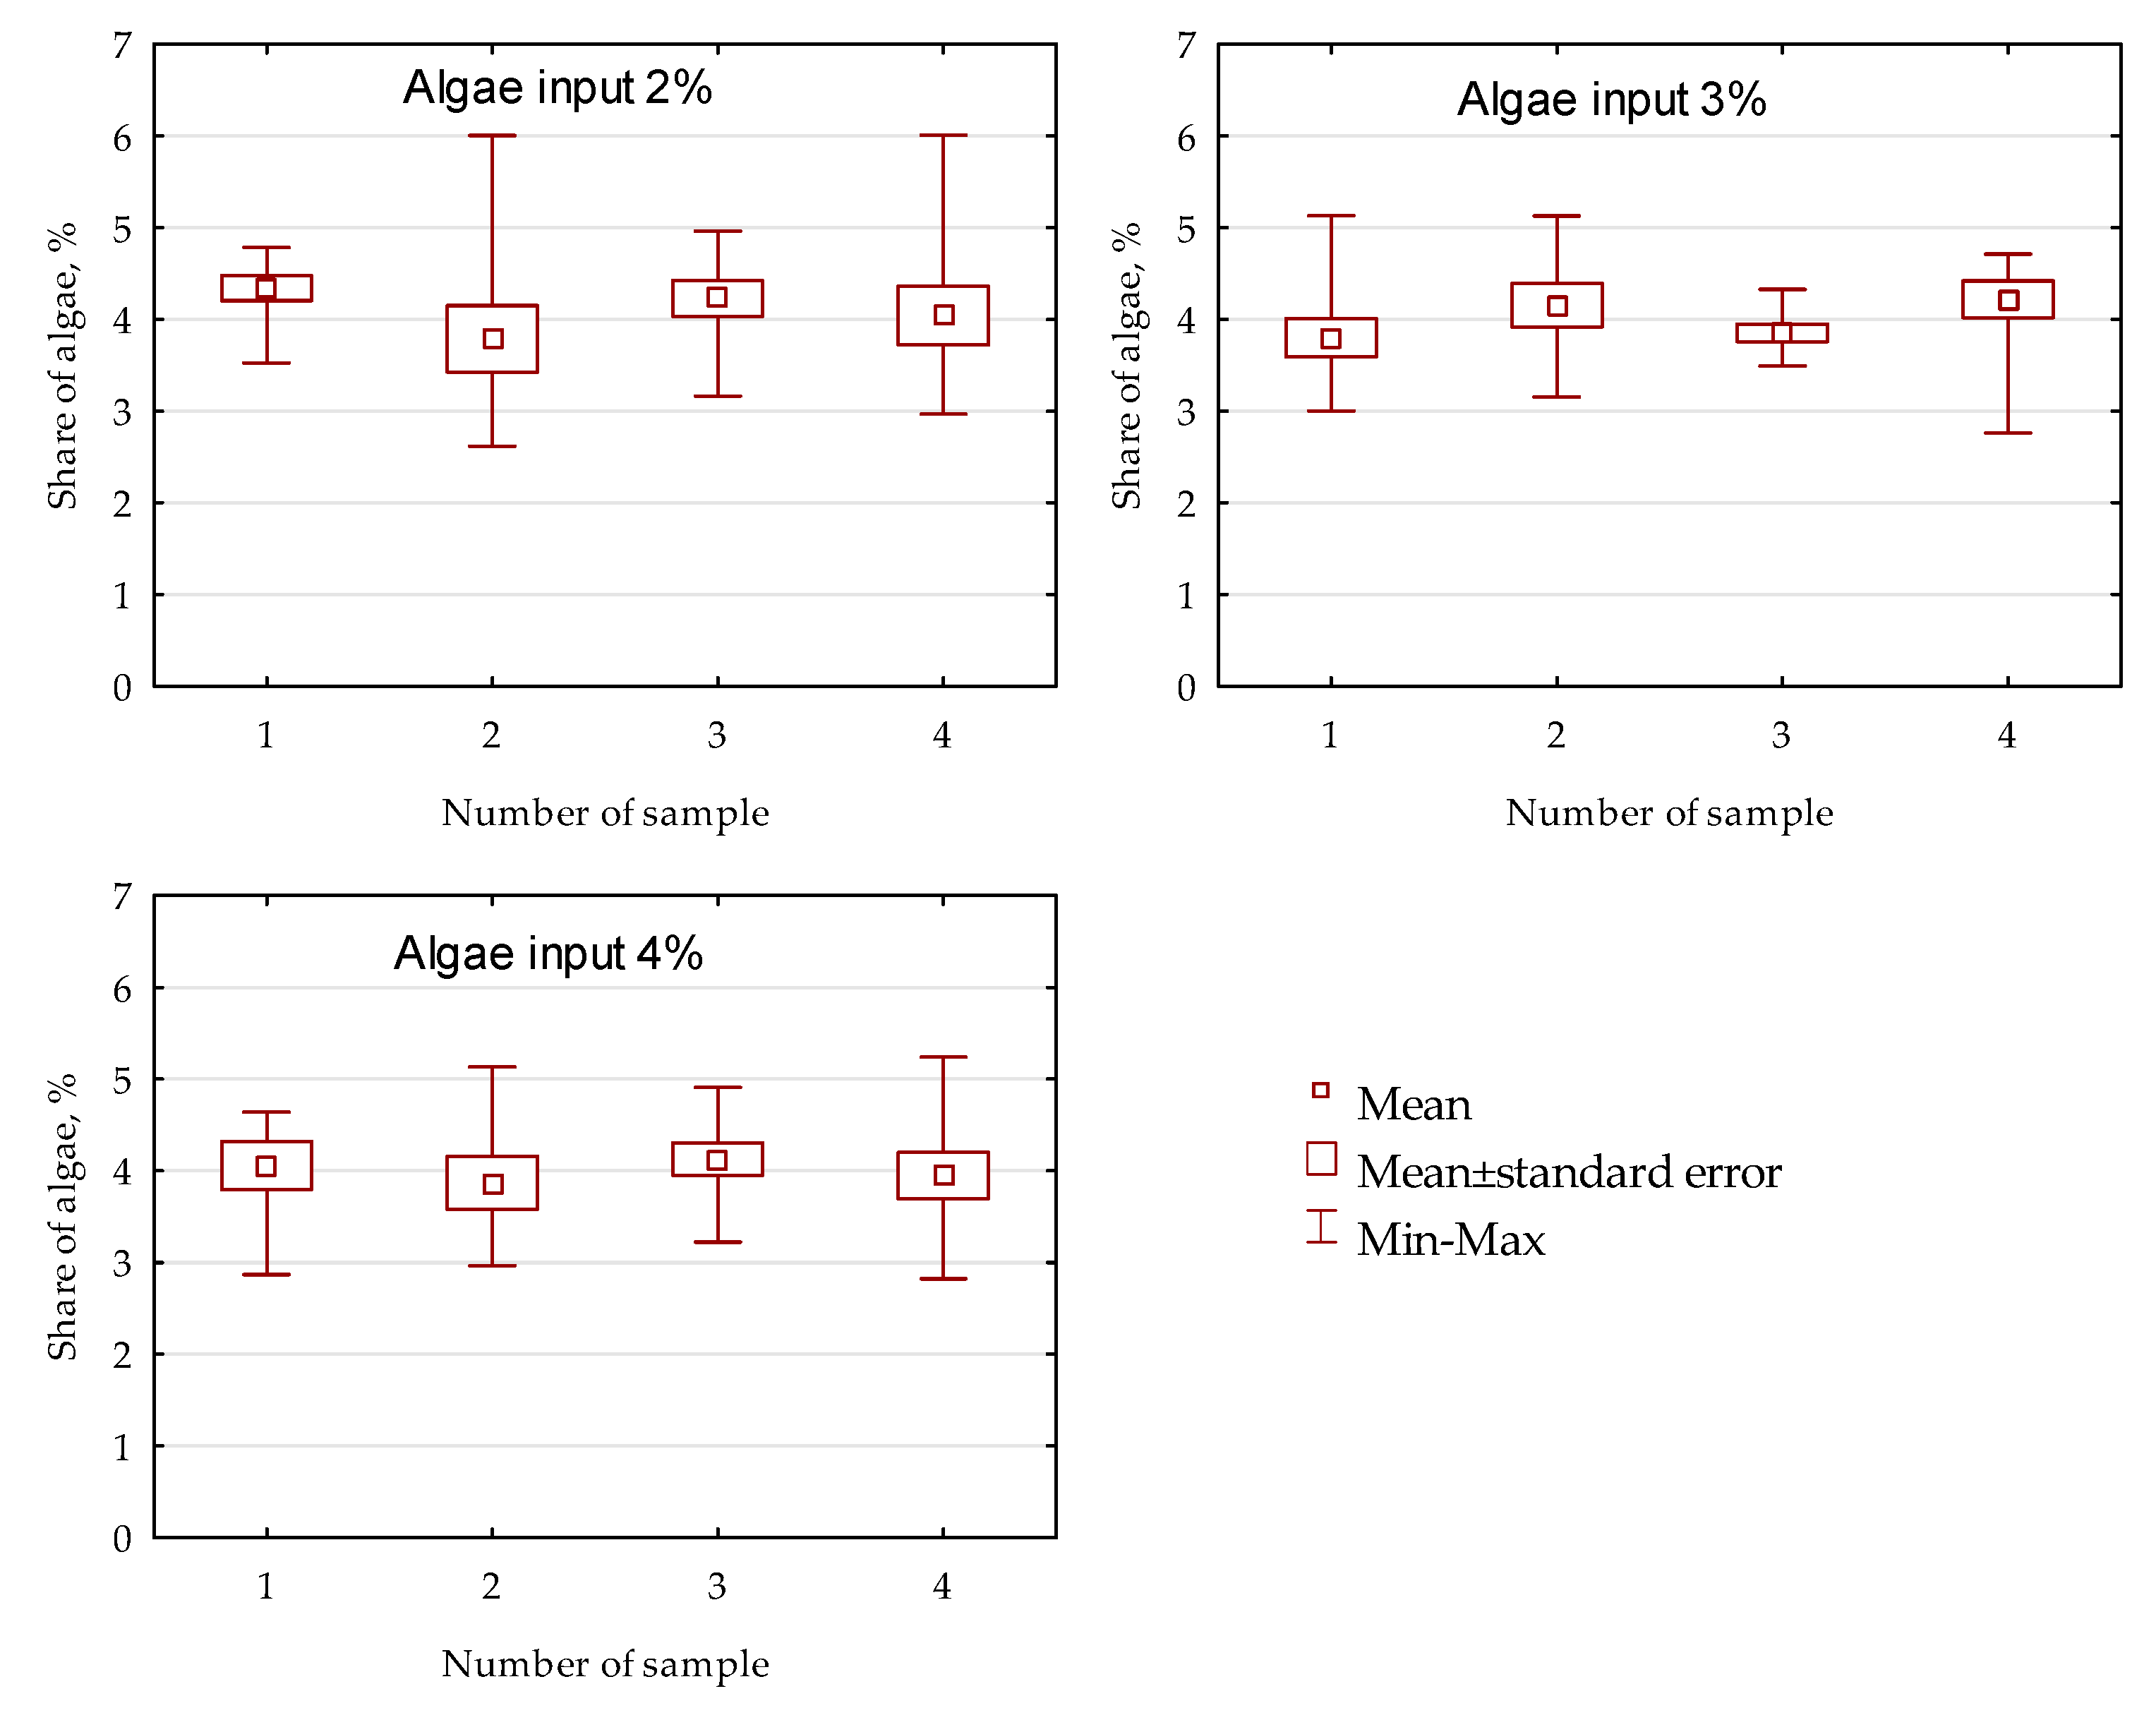
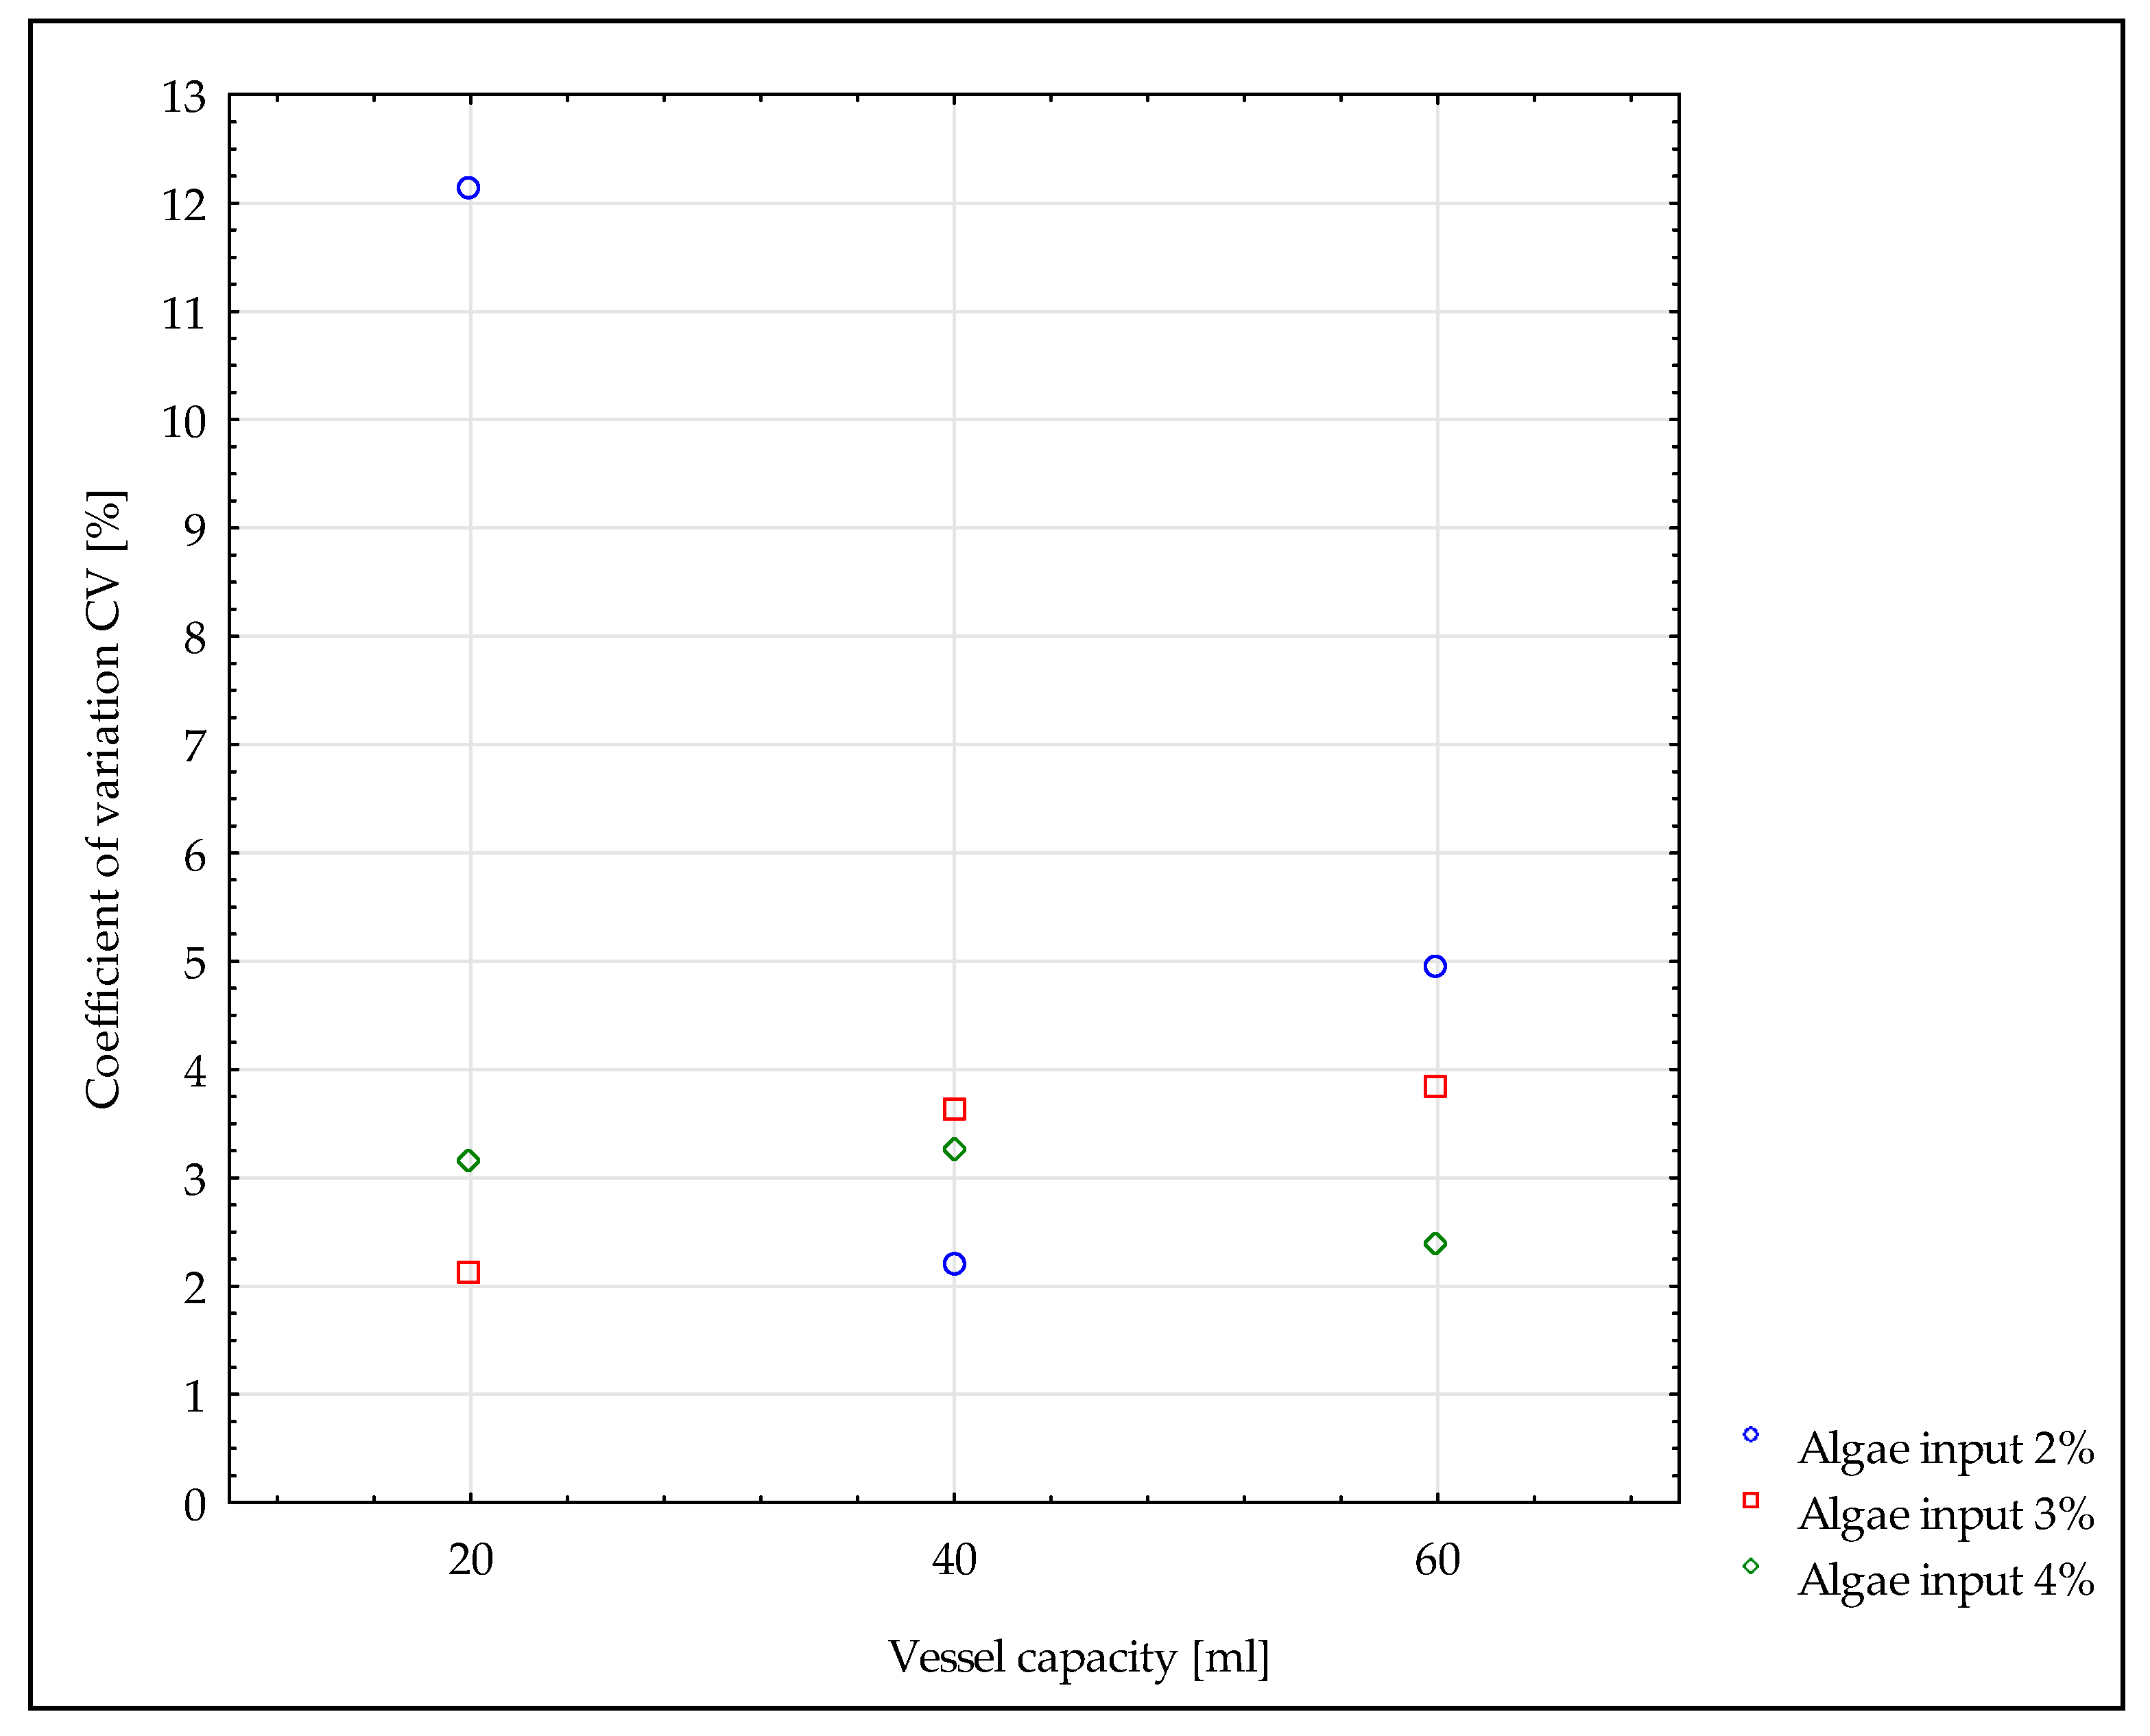
  • The share of key components affects the accuracy of the presented method. Greater differentiation of the results and deviation from the settled amount of algae were noted for the 2% mixture than for the 3% and 4% mixtures.
  • Only in one case (mixture with 2% algae mixed in a 20 mL vessel) did the obtained mixture not have good homogeneity (CV = 12.13%). The coefficient of variation for the remaining mixtures showed good homogeneity (CV < 6%).
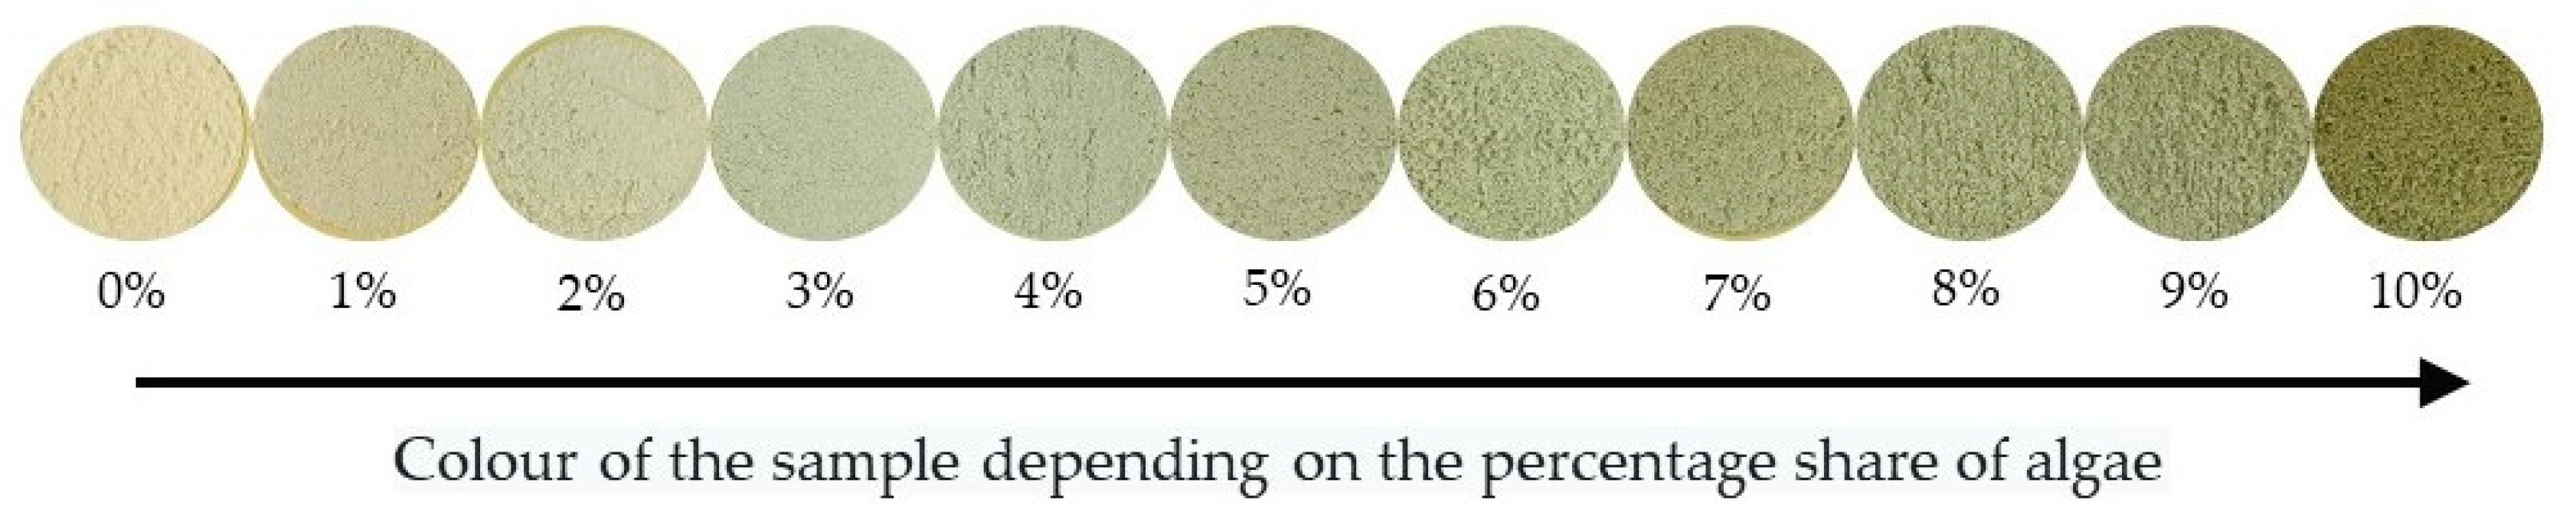
  • The obtained results indicate the possibility of using the RGB scale for image analysis to assess the homogeneity of the two-component powder mixture (in this case, wheat flour–algae). However, the possibilities of the described method seem to be dependent on the share of the coloring component. A small amount of additives (like algae) can be a limitation of this method. Moreover, tests were carried out on two-component systems, so it is not known if (and how) they can be used in multicomponent mixtures.
  • The presented results are a preliminary element of the planned work. The next step will require a closer look at the acquisition and analysis of the image. It is possible that there are available techniques to improve the accuracy of this method for mixtures with a small share of key components. Moreover, tests with other flours, such as maize and rice, or the starch of these flours with additivities, paprika, spinach, tomato and beetroot, are planned.
  • The authors believe it is possible to develop a method to assess the homogeneity of fine-grained mixtures (for example, pastas fortified with algae, spinach, paprika and others) that can be used in industrial conditions (of course also in laboratory conditions).

Author Contributions

D.B.M.: corresponding author, conceptualization, methodology, validation, formal analysis, writing—original draft preparation, writing—review and editing. Ł.A.B.: conceptualization, methodology, resources, investigation, supervision. Both authors have read and agreed to the published version of the manuscript.

Funding

This research received no external funding.

Institutional Review Board Statement

Not applicable.

Informed Consent Statement

Not applicable.

Data Availability Statement

The data are not publicly available due to legal reasons.

Conflicts of Interest

The authors declare no conflict of interest.

References

  1. Cuq, B.; Berthiaux, H.; Gatumel, C. Powder mixing in the production of food powders. In Handbook of Food Powders, Processes and Properties, 1st ed.; Bhandari, B., Bansal, N., Zhang, M., Schuck, P., Eds.; Woodhead Publishing Series in Food Science, Technology and Nutrition: Cambridge, UK, 2013; pp. 200–229. [Google Scholar]
  2. Fitzpatrick, J.J.; Ahrné, L. Food powder handling and processing: Industry problems, knowledge barriers and research opportunities. Chem. Eng. Proces. 2005, 44, 209–214. [Google Scholar] [CrossRef]
  3. Cuq, B.; Rondet, E.; Abecassis, J. Food powders engineering from knowhow to science: Industrial constraints, stakes and research opportunities. Powder Technol. 2011, 208, 244–251. [Google Scholar] [CrossRef]
  4. Barbosa-Canovas, G.V.; Ortega-Rivas, E.; Juliano, P.; Yan, H. Food Powders: Physical Properties, Processing, and Functionality; Kluwer Academic, Plenum Publishers: DorDrecht, The Netherlands, 2005. [Google Scholar]
  5. Pernenkil, L.; Cooney, C.L. A review on the continuous blending of powders. Chem. Eng. Sci. 2006, 61, 720–742. [Google Scholar] [CrossRef]
  6. Królczyk, J.B. The effect of mixing time on the homogeneity of multi-component granular systems. Trans. Famena 2016, XL-1, 45–56. [Google Scholar]
  7. Boss, J. Time of Mixing Granular Materials; Studia i Monografie Wyższa Szkoła Inżynierska: Opole, Poland, 1991. [Google Scholar]
  8. Sobczak, P.; Zawiślak, K.; Panasiewicz, M.; Mazur, J.; Oniszczuk, T. The quality of the mixing process depending on selected technical parameters. TEKA Comm. Mot. Energetics Agric. 2012, 12, 199–202. [Google Scholar]
  9. Bhalode, P.; Ierapetritou, M. A review of existing mixing indices in solid-based continuous blending operations. Powder Technol. 2020, 373, 195–209. [Google Scholar] [CrossRef]
  10. Matuszek, D.; Królczyk, J. Aspects of safety in production of feeds—A review. Anim. Nutr. Feed Technol. 2017, 17, 367–385. [Google Scholar] [CrossRef]
  11. Bridgewater, J. Mixing of powders and granular materials by mechanical means. A perspective. Particuology 2012, 10, 397–427. [Google Scholar] [CrossRef]
  12. Çiftci, I.; Ercan, A. Effects of diets of different mixing homogeneity on performance and carcass traits of broilers. J. Anim. Feed Sci. 2003, 12, 163–171. [Google Scholar] [CrossRef] [Green Version]
  13. Clark, P.M.; Behnke, K.C.; Poole, D.R. Effects of indicator selection and mix time on the coefficient of variation (mix uniformity) of broiler feed. J. Appl. Poultry Res. 2007, 16, 464–470. [Google Scholar] [CrossRef]
  14. Rocha, A.G.; Montanhini, R.N.; Dilkin, P.; Tamiosso, C.D.; Mallmann, C.A. Comparison of different indicators for the evaluation of feed mixing efficiency. Anim. Feed Sci. Technol. 2015, 209, 249–256. [Google Scholar] [CrossRef]
  15. Eisenberg, D.A. Mixer performance, cross-contamination testing examined. Feedstuffs 2004, 76, 1–2. [Google Scholar]
  16. Krzaczek, P.; Sobczak, P.; Stamirowska-Krzaczek, E.; Zawiślak, K.; Maj, G.; Żukiewicz-Sobczak, W.; Piekarski, W.; Królczyk, J. Assessment of Reliability of Mixing Process in Diverse Mixers. Tehnički Vjesn. 2020, 27, 1181–1185. [Google Scholar]
  17. Matuszek, D.B. Ultraviolet fluorescence in the assessment of quality in the mixing of granular material. Sustainability 2020, 12, 1546. [Google Scholar] [CrossRef] [Green Version]
  18. Matuszek, D. Modelling selected parameters of granular elements mixing process. Int. Agrophys. 2015, 29, 75–81. [Google Scholar] [CrossRef]
  19. Królczyk, J.; Matuszek, D.; Tukiendorf, M. Modelling of quality changes in a multicomponent granular mixture during mixing Electon. J. Pol. Agric. Univ. 2010, 3, 11. [Google Scholar]
  20. Matuszek, D.B. The use of UV-induced fluorescence for the assessment of homogeneity of granular mixtures. Open Chem. 2019, 17, 485–491. [Google Scholar] [CrossRef]
  21. Matuszek, D.; Biłos, Ł. Use of fluorescent tracers for the assessment of the homogeneity of multicomponent granular feed mixtures. Przem Chem. 2017, 96, 2356–2359. [Google Scholar] [CrossRef]
  22. Realpe, A.; Velảzquez, C. Image processing and analysis for determination of concentrations of powder mixtures. Powder Technol. 2003, 134, 193–200. [Google Scholar] [CrossRef]
  23. Mayer, C.; Gatumel, C.; Berthiaux, H. Mixing dynamics for easy flowing powders in a lab scale Turbula® mixer. Chem. Eng. Res. Des. 2015, 95, 248–261. [Google Scholar] [CrossRef] [Green Version]
  24. Garth, A.L. Blend Uniformity and Vitamin Stability in Dairy-Based Foods Fortified with Lipid-Encapsulated Ferrous Sulfate. Master’s Thesis, Theses and Dissertations, 8138. Brigham Young University, Provo, UT, USA, 1 March 2020. [Google Scholar]
  25. Marigo, M.; Cairns, D.L.; Davies, M.; Ingram, A.; Stitt, E.H. Developing mechanistic understanding of granular behaviour in complex moving geometry using the Discrete Element Method: Part B: Investigation of flow and mixing in the Turbula® mixer. Powder Technol. 2011, 212, 17–24. [Google Scholar] [CrossRef]
  26. Marigo, M.; Cairns, D.L.; Davies, M.; Ingram, A.; Stitt, E.H. A numerical comparison of mixing efficiencies of solids in a cylindrical vessel subject to a range of motions. Powder Technol. 2012, 217, 540–547. [Google Scholar] [CrossRef]
  27. Sommier, N.; Porion, P.; Evesque, P.; Leclerc, B.; Tchoreloff, P.; Couarraze, G. Magnetic resonance imaging investigation of the mixing-segregation process in a pharmaceutical blender. Int. J. Pharm. 2001, 222, 243–258. [Google Scholar] [CrossRef]
  28. Bauman, I.; Duška, Ć.; Boban, M. Mixing of solids in different mixing devices. Sādhanā 2008, 33, 721–731. [Google Scholar] [CrossRef] [Green Version]
  29. Sundell-Bredenberg, S.; Nyström, C. The possibility of achieving an interactive mixture with high dose homogeneity containing an extremely low proportion of a micronised drug. Eur. J. Pharm. Sci. 2001, 12, 285–295. [Google Scholar] [CrossRef]
  30. Obadele, B.A.; Masuku, Z.H.; Olubambi, P.A. Turbula mixing characteristics of carbide powders and its influence on laser processing of stainless steel composite coatings. Powder Technol. 2012, 230, 169–182. [Google Scholar] [CrossRef]
  31. Jankowski, M. Elements of Computer Graphics; Wydawnictwa Naukowo-Techniczne: Warsaw, Poland, 2006. (In Polish) [Google Scholar]
  32. Zouari, N.; Abid, M.; Fakhfakh, N.; Ayadi, M.A.; Zorgui, L.; Ayadi, M.; Attia, H. Blue-green algae (Arthrospira platensis) as an ingredient in pasta: Free radical scavenging activity, sensory and cooking characteristics evaluation. Int. J. Food Sci. Nutr. 2011, 62, 811–813. [Google Scholar] [CrossRef]
  33. Willy, A.; Bachofen, A.G. Turbula® Shaker Mixer Type T2C Operating Instruction. Available online: https://www.novatechuk.com/content/products/f/turbula-t2c-manual.pdf (accessed on 20 December 2020).
  34. Matuszek, D.B.; Królczyk, J.B. Fluorescence optical analysis method for assessing homogeneity of granular mixtures. Metrol. Meas. Syst. 2021, 28. (In press) [Google Scholar]
  35. Tukiendorf, M. Characteristics of mixing granular materials achieved by using methods of variance analysis and geostatistical functions. J. Pol. Agric. Univ. 2003, 6, 1. Available online: http://www.ejpau.media.pl/volume6/issue1/engineering/art-03.html (accessed on 20 December 2020).
  36. Berthiaux, H.; Marikh, K.; Gatumel, C. Continuous mixing of powder mixtures with pharmaceutical process constraints. Chem. Eng. Process Process Intensifi Cation 2008, 47, 2315–2322. [Google Scholar] [CrossRef] [Green Version]
  37. Shenoy, P.; Innings, F.; Tammel, K.; Fitzpatrick, J.; Ahrné, L. Evaluation of a digital colour imaging system for assessing the mixture quality of spice powder mixes by comparison with a salt conductivity method. Powder Technol. 2015, 286, 48–54. [Google Scholar] [CrossRef]
  38. Kwiatek, K.; Przeniosło-Siwczyńska, M. Instructions for Testing the Homogeneity of Medicated Feeds and Intermediate Products on the Basis of Testing the Degree of Mixing of the Active Substance; Państwowy Instytut Weterynaryjny: Puławy, Poland, 2007. (In Polish) [Google Scholar]
  39. Marigo, M.; Davies, M.; Leadbeater, T.; Cairns, D.L.; Ingram, A.; Stitt, E.H. Application of positron emission particle tracking (PEPT) to validate a Discrete Element Method (DEM) model of granular flow and mixing in the Turbula mixer. Int. J. Pharm. 2013, 446, 46–58. [Google Scholar] [CrossRef] [PubMed]
  40. Mihailova, O.; Lim, V.; McCarthy, M.J.; McCarthy, K.L.; Bakalis, S. Laminar mixing in a SMX static mixer evaluated by positron emission particle tracking (PEPT) and magnetic resonance imaging (MRI). Chem. Eng. Sci. 2015, 137, 1014–1023. [Google Scholar] [CrossRef] [Green Version]
  41. Asachi, M.; Nourafkan, E.; Hassanpour, A. A review of current techniques for the evaluation of powder mixing. Adv. Powder Technol. 2018, 29, 1525–1549. [Google Scholar] [CrossRef]
  42. Wahl, P.R.; Fruhmann, G.; Sacher, S.; Straka, G.; Sowinski, S.; Khinast, J.G. PAT for tableting: Inline monitoring of API and excipients via NIR Spectroscopy. Eur. J. Pharm. Biopharm. 2014, 87, 271–278. [Google Scholar] [CrossRef] [PubMed]
  43. Osorio, J.G.; Stuessy, G.; Kemeny, G.J.; Muzzio, F.J. Characterization of pharmaceutical powder blends using in situ near-infrared chemical imaging. Chem. Eng. Sci. 2014, 108, 244–257. [Google Scholar] [CrossRef]
  44. He, X.; Han, X.; Ladyzhynsky, N.; Deanne, R. Assessing powder segregation potential by near infrared (NIR) spectroscopy and correlating segregation tendency to tabletting performance. Powder Technol. 2013, 236, 85–99. [Google Scholar] [CrossRef]
  45. Nawara, P.; Jakubowski, T.; Sobol, Z. Application of the CIE L*a*b* method for the evaluation of the colour of fried products from potato tubers exposed to C band ultraviolet light. E3S Web Conf. Polsita. 2019, 132, 1–6. [Google Scholar] [CrossRef] [Green Version]
  46. Sobol, Z.; Jakubowski, T.; Nawara, P.R. The effect of UV-C stimulation of potato tubers and soaking of potato strips in water on color and analyzed color by CIE L*a*b*. Sustainability 2020, 12, 3487. [Google Scholar] [CrossRef] [Green Version]
Figure 1. Standard specimen photos of samples with the share of algae from 0% to 10% w/w.
Sustainability 13 03018 g001
Figure 2. Standard specimen-graph of algae proportional dependence on the color number with a simple linear regression formula.
Sustainability 13 03018 g002
Figure 3. Turbula® mixer.
Sustainability 13 03018 g003
Figure 4. Step-by-step experimental procedure.
Sustainability 13 03018 g004
Figure 5. Box plot graph of the algae proportion in the samples for mixing in a 20 mL vessel.
Sustainability 13 03018 g005
Figure 6. Box plot graph of the algae proportion in the samples for mixing in a 40 mL vessel.
Sustainability 13 03018 g006
Figure 7. Box plot graph of the algae proportion in the samples for mixing in a 60 mL vessel.
Sustainability 13 03018 g007
Figure 8. Interpretation of the coefficient of variation depending on the target amount of algae and the capacity of the mixing vessel.
Sustainability 13 03018 g008
Table 1. Characteristics of the materials used for mixing.
ParameterAlgaeWheat Flour
Geometric weighted mean of particle size dg (mm)0.160.24
Humidity (%)4.617.98
Table 2. Mixture compositions.
ParameterAlgaeWheat FlourMixture
Mixture 1
Mixing ratio (%)298100
Mass of constituents a (mg)0.26/0.52/0.7812.74/25.48/38.2213/26/39
Mixture 2
Mixing ratio (%)397100
Mass of constituents a (mg)0.39/0.78/1.1712.61/25.22/37.8313/26/39
Mixture 3
Mixing ratio (%)496100
Mass of constituents a (mg)0.52/1.04/1.5612.48/24.96/37.4413/26/39
a For the 20, 40 and 60 mL mixing vessel, respectively.
Table 3. Mixer parameters of Turbula® Type T2C.
ParameterTurbula Mixer
Volume of the vessel (mL)20/40/60
Diameter of the vessel (mm)37
Length of the vessel (mm)19/38/57
Rotational speed of mixer (rpm)67
Table 4. Assessment of algae fraction and the coefficient of variation.
Vessel Capacity (mL)Assigned Share of Algae (%)Number of SampleColor Number aShare of Algae (%) a,bCV (%)
202111,858,063 ± 427,9542.47 ± 1.1412.13
211,617,468 ± 55,0783.11 ± 0.15
311,889,742 ± 106,8252.39 ± 0.28
411,627,086 ± 160,5093.09 ± 0.43
3111,481,165 ± 198,2113.47 ± 0.532.13
211,508,667 ± 145,9463.40 ± 0.39
311,495,189 ± 83,5183.44 ± 0.22
411,434,678 ± 90,3233.60 ± 0.24
4111,387,343 ± 35,8413.72 ± 0.103.15
211,304,299 ± 80,1703.94 ± 0.21
311,415,133 ± 68,7083.65 ± 0.18
411,324,020 ± 91,7423.89 ± 0.24
402111,802,365 ± 183,9602.62 ± 0.492.21
211,740,319 ± 65,5992.79 ± 0.17
311,781,122 ± 71,2602.68 ± 0.19
411,779,214 ± 63,6452.68 ± 0.17
3111,460,124 ± 63,7153.53 ± 0.173.61
211,556,436 ± 110,0433.27 ± 0.29
311,490,209 ± 49,7293.45 ± 0.13
411,428,864 ± 84,1123.61 ± 0.22
4111,344,044 ± 45,5103.84 ± 0.123.26
211,283,480 ± 50,8814.00 ± 0.14
311,227,395 ± 33,6134.15 ± 0.09
411,344,248 ± 12,0743.84 ± 0.03
602111,162,919 ± 105,1214.32 ± 0.284.94
211,361,941 ± 79,1233.79 ± 0.21
311,196,296 ± 149,1294.23 ± 0.40
411,267,031 ± 102,8964.04 ± 0.27
3111,313,492 ± 62,5543.92 ± 0.173.84
211,223,985 ± 163,1674.16 ± 0.43
311,338,202 ± 19,4653.85 ± 0.05
411,199,466 ± 114,1124.22 ± 0.30
4111,285,418 ± 89003.99 ± 0.022.38
211,331,834 ± 35,9783.87 ± 0.10
311,233,732 ± 141,8064.13 ± 0.38
411,302,818 ± 49,9653.95 ± 0.13
a Mean of three samples and three series ± standard deviation; b values obtained using the formula (simple linear regression, Figure 2).
Publisher’s Note: MDPI stays neutral with regard to jurisdictional claims in published maps and institutional affiliations.

