Abstract
Building sector is associated with high energy consumption and greenhouse gas emissions, which contribute to climate change. Sustainable development emphasizes any actions to reduce climate change and its effect. In Malaysia, half of the energy utilized in buildings goes towards building cooling. Thermal comfort studies and adaptive thermal comfort models reflect the high comfort temperatures for Malaysians in naturally conditioned buildings, which make it possible to tackle the difference between buildings’ indoor temperature and the required comfort temperature by using proper passive measures. This study investigates the effectiveness of building’s retrofitting with phase change materials (PCMs) as a passive cooling technology to improve the indoor thermal environment for more comfortable conditions. PCM sheets were numerically investigated below the internal finishing of the walls. The investigation involved an optimization study for the PCMs transition temperatures and quantities. The results showed significant improvement in the indoor thermal environment, especially when using lower transition temperatures and higher quantities of PCMs. Therefore, the monthly thermal discomfort time has decreased completely, while the thermal comfort time has increased to as high as 98%. The PCM was effective year-round and the optimum performance for the investigated conditions was achieved when using 18mm layer of PCM27-26.
1. Introduction
One of the globally recognized Sustainable Development Goals aims to take urgent action to reduce climate change and its effect. Greenhouse gas (GHG) emissions are major contributors to climate change [1]. In Malaysia, the energy sector is responsible for 76% of the GHG emissions [2], which is linked to the large energy production from fossil fuels combustion [3]. Therefore, efforts were made to reduce the GHGs emissions associated with the energy sector [4]. In line with these efforts, buildings offer a high potential to reduce energy consumption and the associated GHGs emission, since they are responsible for 50.5% of the total electricity consumption [5]. The tropical climate in Malaysia causes thermally uncomfortable conditions in buildings. Therefore, occupants tend to use air-conditioning for cooling [6], which accounts for 45% of the total electricity consumption in buildings [7].
Thermal comfort is defined as “the condition of mind that expresses satisfaction with the thermal environment” [8]. Generally, it is difficult to satisfy all people in space due to the large physiological and psychological variations between them. Besides, thermal comfort requirements for naturally conditioned spaces vary from those required for other air-conditioned spaces [8]. As a result, the adaptive model was developed for the naturally conditioned buildings, which rely on the active relationship between people and their environment, i.e., people react to restore their thermal comfort if discomfort conditions have occurred [9,10].
Moreover, the comfort perception of the individuals is closely linked to their thermal history, and a long-term thermal experience might shift their thermal expectation [11]. Therefore, people might prefer higher temperatures in warm to hot climates. For instance, thermal comfort studies in Malaysia have reported a comfort temperature averaging 28 °C and an acceptable temperature up to 30–32 °C, as can be seen in Table 1 [12,13,14,15,16]. Similarly, by using thermal comfort models, such as ASHRAE Standard 55 [8], BS EN 15251 [17], and MS 2680 [18], to estimate the comfort temperature and range for naturally conditioned spaces based on an average outdoor air temperature (Tₒ) of 28 °C, the results agreed well with that obtained from the field thermal comfort studies, and the estimated comfort temperature was mostly above 28 °C, while the upper acceptable temperature ranged between 29.98 °C and 32.18 °C, Table 2.

Table 1.
Comfort temperatures and comfort range based on field thermal comfort studies in Malaysia, which shows the comfort temperature averaging 28 °C and the upper limit of the comfort range reach up to 30–32 °C in naturally conditioned buildings.
Table 2.
Estimated comfort temperatures and comfort range using thermal comfort models for naturally conditioned buildings based on an average Tₒ of 28 °C. The results agreed well with the field thermal comfort studies.
Several field studies for buildings in Malaysia have reported that the maximum indoor temperature averages between 31 °C and 35.5 °C, as can be seen in Table 3 [6,15,19,20,21,22,23]. Comparing buildings’ indoor temperature with the required comfort temperature for naturally conditioned buildings indicates that implementing proper building design and passive measures to lower the indoor temperatures can decrease the need for air-conditioning.
Table 3.
Indoor air temperature (Tᵢ) based on different field studies conducted in various buildings in Malaysia.
One of the passive cooling strategies, which has been implemented in buildings worldwide and its usage is increasing more and more, is the use of phase change materials (PCMs) [24]. PCMs are the type of thermal energy storages that can absorb and release large quantities of latent heat within a small temperature change during their phase-change [25]. The interest in using PCMs to enhance the thermal comfort can be attributed to (1) PCMs applied in the walls significantly reduces the overheating as they absorb the heat and release it during the lower temperature time, (2) the surface temperature of the PCM-based walls is reduced, which enhances the thermal comfort through the radiative heat transfer, and (3) less uncomfortable thermal stratifications can be produced due to the improvement of the natural convection mixing of the air [26]. PCMs can be implemented in the construction of new buildings, as well as the retrofitting of the existing buildings without the need for major renovations. This provides an opportunity to improve the thermal performance and energy efficiency of the existing building stock.
Different studies have reported the role of PCMs application in improving thermal comfort. For example, Ramakrishnan et al. [27] refurbished a residential house by applying macro-encapsulated PCM mats on the inner linings of the house’s walls, which resulted in a lower severe discomfort period by 65%. Ascione et al. [24] retrofitted the inner surface of the external walls in an educational building with PCM in the inner surface of the external walls and achieved 215 h higher summer comfort. Sarı et al. [28] also found improvement in thermal comfort time with a PCM-based plaster. Evola et al. [29] found a reduction in the seasonal thermal discomfort up to 35% with PCM application in combination with night ventilation (NV).
Within the context of Malaysia, PCMs application in buildings is still new and can be regarded as a promising area of research. The climate in Malaysia is characterized by a uniform diurnal temperature throughout the year, which gives opportunities for year-round benefits from PCMs application rather than the seasonal benefits like in other climates [30]. Moreover, previous studies in Malaysia have reported the effective role of NV in cooling down the indoor environment in buildings [6,19,31]. Besides, the performance of NV improves with a high level of thermal mass [32]. Therefore, by combining NV and PCMs, the passive cooling of PCMs for the naturally conditioned buildings projected potentials and can be further improved. However, the climate has a narrow temperature variation, which might restrict the thermal cycles of the PCMs and can reduce their effectiveness. Therefore, this work aims to investigate the effectiveness of retrofitting a naturally conditioned building with PCMs to improve the building’s indoor thermal environment for more thermally comfortable conditions.
2. Materials and Methods
2.1. Simulation Investigation
EnergyPlus, developed by the U.S. Department of Energy, is a highly accredited simulation software, which is globally accepted by researchers and engineers to predict a building’s energy and thermal performance [27,33,34]. It is one of the few simulation software that can model the PCMs [35]. Many researchers have used it to evaluate the energy and thermal performance of buildings. It has shown accurate prediction for the thermal performance of buildings incorporated with PCMs compared to other simulation software [27,35,36,37,38,39,40]. Moreover, various researchers have validated the PCM model in EnergyPlus. For instance, Tabares et al. [41] used analytical verification, comparative testing, and empirical validation, i.e., similar to ASHRAE Standard 140, to verify and validate the PCM model in EnergyPlus. Accordingly, they have provided guidelines for using this PCM model in EnergyPlus. Other researchers have validated their PCM models in EnergyPlus with experimental and field data, which showed good agreements [38,42,43,44,45]. The recent versions of EnergyPlus (i.e., starting from v8.9) have implemented a new method, which can include the hysteresis of the PCMs. This method provides more accuracy compared to the previously used method (i.e., single enthalpy-temperature curve), especially when modelling PCMs with distinct hysteresis [35]. Furthermore, several graphical interfaces are available for EnergyPlus, which simplify its use by various types of users, i.e., researchers, engineers, architects, and students [46]. For instance, DesignBuilder is a simulation software platform, which provides a graphical user interface for EnergyPlus [47,48] and was used by many researchers to investigate PCMs application in buildings [47,49,50,51,52]. Therefore, DesignBuilder (v6.1), which uses EnergyPlus (v8.9) as the simulation engine [50,52], was used in this research. Moreover, the used weather data is a typical metrological year (TMY) for Penang Island based on 15 years-long historical weather data between 2003 and 2017 [53], Figure 1.
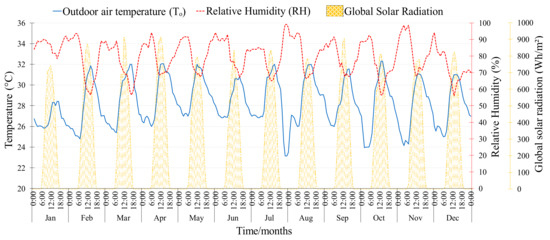
Figure 1.
Monthly averages of the outdoor weather for Penang Island based on typical metrological year (TMY) [48,53].
To simulate the phase-change process of the PCMs, a conduction finite difference (CondFD) solution algorithm was incorporated in EnergyPlus to calculate the heat balance [54]. Two schemes are available under the finite difference model, namely Crank Nicholson and fully implicit [54,55]. The fully implicit scheme is first-order in time, provides more stability, and was suggested and used in [40,55,56]. Furthermore, modelling PCM’s phase-change in EnergyPlus provides two options, namely basic and hysteresis. The hysteresis option models PCMs’ phase-change using different temperature/enthalpy curves. This option allows to model PCMs’ effects similar to the actual buildings. Other required settings for PCMs modelling were implemented based on what was suggested by the developers of the EnergyPlus [41] and DesignBuilder help [55] and according to what was implemented in previous studies [40,56], as shown in Table 4.
Table 4.
Key settings that are required for phase change materials (PCMs) modeling, which were implemented in the current work.
2.2. Building Model
The selected building is a high-rise residential building of the single-loaded corridor access type, which is common for residential buildings in Malaysia, Figure 2. The building is located in Penang Island and consists of 32 floors, and each floor has eight identical apartments oriented toward the south. The investigated apartment is a corner unit on the 8th floor and consists of a living area, a kitchen, three bedrooms, and two bathrooms, with a total floor area of 65 m2. The main bedroom is a corner space with a floor area of 12.3 m2. It has a south-oriented wall and an east-oriented wall with a window to wall ratio of 50% and 18%, respectively.
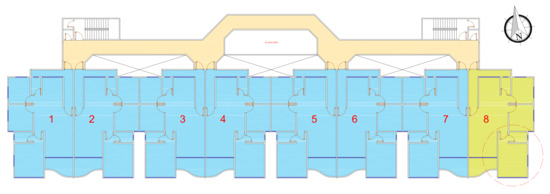
Figure 2.
The layout of the selected building shows the arrangement and orientation of the apartments and the investigated apartment (no. 8) and space.
The building model was developed based on the actual dimensions of its external form to account for the effect of solar radiation, shading, and wind, while not all the details were assigned to the building to reduce its complexity and, therefore, the simulation process [57]. However, the investigated apartment was developed in detail, including all spaces and openings, Figure 3. Besides, it was assumed to be thermally isolated from the above and below apartments, by setting the roof and the floor to be adiabatic in terms of the adjacency (i.e., heat is not transferred across) [58]. The building materials that were assigned for the model with their properties are presented in Table 5.
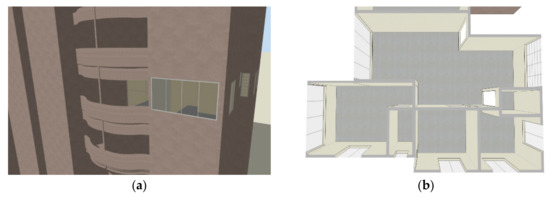
Figure 3.
The developed building model for the simulation investigation: (a) External view of the building; (b) internal view of the apartment [48].
Table 5.
Building materials and their properties, which were assigned for the building model.
For model validation, field measurements for the indoor air temperature (Tᵢ) were performed in the main bedroom within the period of 1–4 February 2018. The same period used for field measurements was modified in the weather data file using real outdoor weather data, and the modified file was used to predict the Tᵢ. The results showed that the predicted Tᵢ agreed well with the measured Tᵢ. The average deviation was 1.75%, which is comparable to previous studies [45,59]. More details can be found in [48].
2.3. PCMs Application
Infinite R™ 29 °C is a commercially available macro-encapsulated PCM produced from mineral-based raw materials and available in sheets with a thickness of 6mm (Figure 4) [60]. This PCM was applied in this study. For an optimization purpose, the transition temperatures of the PCM were varied between 30 °C and 26 °C with a melting range of 1 °C [61,62] to account for PCM’s hysteresis effects [35], whereas all other properties were kept similar to that of the Infinite R™ 29 °C, see Table 6.
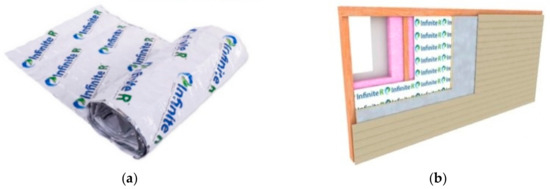
Figure 4.
(a) Infinite R™ PCMs sheet; (b) its application in the walls [60].
Table 6.
Properties of the PCMs that were used in the current study for optimization purpose.
Additionally, to optimize the PCM quantity, three PCMs’ layer thicknesses were considered in the optimization study, i.e., 6mm, 12mm, and 18mm, which reflects the application of a single PCM sheet (1-PCM), two PCM sheets (2-PCM), or three PCM sheets (3-PCM), respectively. Higher thickness was not considered as Lei et al. [63] found that the efficiency and the cost-benefit of the PCMs application decreased with high thickness up to 20mm. The PCMs layer was applied below the internal finishing of all walls, Figure 5.
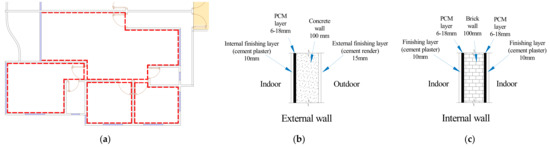
Figure 5.
Position of PCMs retrofitting in the walls; (a) layout of the apartment; (b) external wall section; (c) internal wall section.
The optimization study involved 12 different alternatives for PCM’s transition temperatures and quantity. All these alternatives were investigated firstly without NV. However, if the results showed signs of accumulated heat due to the uncompleted solidification, the PCMs were reinvestigated in combination with NV at 8ACH [27]. All PCMs alternatives were investigated, analyzed, and evaluated throughout December in comparison to the reference-case (without PCM). Finally, the PCMs with the best performance were evaluated annually to examine their performance and effectiveness under year-round conditions as the performance might vary based on the seasons [64].
The evaluation of the PCMs performance was performed using the operative temperature (Tₒₚ), which combined the effects of both Tᵢ and the radiation from the walls and takes into account the influence of the airspeed [8,65]. The PCMs applied in the internal surface of the walls affects the internal surface temperature and the radiation from the wall, which make Tₒₚ the best indicator to evaluate thermal comfort. The Tₒₚ profiles for the various alternatives of PCMs’ transition temperatures and quantities were compared to that of the reference-case. Besides, the PCMs’ effectiveness was evaluated based on the achieved improvement for the thermal comfort time, which is the main target of PCMs retrofitting. Based on Table 1 and Table 2, the comfort temperature and the upper limit of the comfort range were taken as 28 °C and 30 °C, respectively. Therefore, three levels for the indoor thermal environment were considered in this evaluation as follows:
- Thermal comfort time (TCT), if Tₒₚ is below or equal to 28 °C,
- relative thermal comfort time (RTCT), if Tₒₚ is above 28 °C and below or equal to 30 °C,
- thermal discomfort time (TDT), if Tₒₚ is above 30 °C.
3. Results and Discussion
3.1. Optimization Study
A period of 7 days was selected to analyze the Tₒₚ with PCMs retrofitting. This period includes days with min-Tₒ that is lower and higher than the minimum solidification temperature of the investigated PCMs. Figure 6 illustrates the Tₒₚ for all PCMs’ transition temperatures when using 1-PCM, 2-PCM, and 3-PCM. It is observed that retrofitting of the walls with PCMs managed to decrease the Tₒₚ compared to the reference-case. However, the achieved reduction varied between the investigated PCMs’ transition temperatures and quantities. For instance, when using 1-PCM, Figure 6a, PCM27-26 achieved the lowest Tₒₚ during the first two days, while its profile started to increase on the third day. This can be linked to the high min-Tₒ on the night before the third day, which restricts the PCM’s solidification process. Therefore, PCM27-26 was not able to release the latent heat during the night and stayed in the liquid state during the following day, which reduced its effectiveness. Besides, as the high min-Tₒ continued for the following nights, the Tₒₚ profile with PCM27-26 continued to increase more and more until it reached close to the reference-case on the last day.
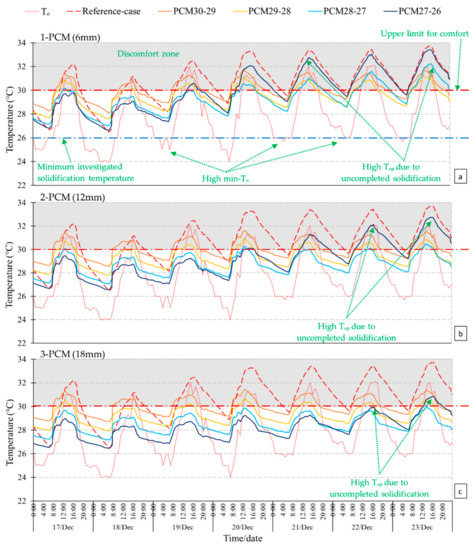
Figure 6.
Tₒₚ for all PCM’s transition temperatures when using (a) 1-PCM, (b) 2-PCM, and (c) 3-PCM in comparison with the reference-case.
Moreover, PCM28-27 achieved the lowest Tₒₚ on the third and the fourth days, while its profile increased for the following days due to higher min-Tₒ. It is clearly seen that both PCM27-26 and PCM28-27 have lost their effectiveness with the high ambient temperature. In contrast, the Tₒₚ profile with PCM30-29 and PCM29-28 was consistent throughout the period regardless of the high min-Tₒ. This indicates that they managed to complete the solidification process during the night and, therefore, were ready for the following days, which is linked to their high solidification temperatures. On the other hand, when using 2-PCM, Figure 6b, all PCMs achieved slightly lower Tₒₚ profiles compared to using 1-PCM. Besides, PCM27-26 achieved the lowest Tₒₚ for the first three days, while its profile increased for the following days. However, PCM28-27 had almost a consistent profile during the whole period, unlike the use of 1-PCM, in which it started to lose its effectiveness on the fifth day. This is attributed to the higher PCM quantity, which prolongs the PCM’s performance and effectiveness. The use of higher PCMs quantity increases the heat storage capacity. Therefore, the additional quantity of the PCMs can function if uncompleted PCMs solidification occurred due to high min-Tₒ. However, once all of the PCM’s quantity melted, the PCM’s effectiveness decreases. Moreover, the higher PCM’s thickness provides additional insulation effects due to the PCM’s lower conductivity, which reduces the external heat gain and provides lower indoor temperatures. The positive effect of the higher PCM’s quantity was confirmed when using 3-PCM, Figure 6c, as all PCMs have achieved better and slightly lower Tₒₚ profiles. Additionally, PCM27-26 achieved the lowest Tₒₚ profile for the first five days, even though the high min-Tₒ started three days earlier. Additionally, its profile for the last two days was lower than PCM30-29 and slightly lower than PCM29-28.
The use of PCMs with higher transition temperatures (i.e., PCM30-29 and PCM29-28) achieved daily completed melting-solidification cycles, which ensure the full utilization of the phase-change latent heat storage. In contrast, using PCMs with the lower transition temperatures (i.e., PCM28-27 and PCM27-26) achieved lower Tₒₚ profiles, which is more desirable to achieve a comfortable condition. However, these PCMs suffered from uncompleted solidification during the hot nights, which reduced their effectiveness. Nevertheless, increasing their quantities resulted in improved performance. Furthermore, these PCMs were reinvestigated in combination with NV, Figure 7. The results showed that NV reduces the Tₒₚ profiles during the night for all alternatives. However, there were noticeable reductions during the daytime with 2-PCM27-26 and 3-PCM27-26 when combined with NV on the days that suffered from uncompleted solidifications during the previous nights. The NV can bring in the outdoor cooler air and remove the indoor heat, which help to improve the PCM’s solidification process.
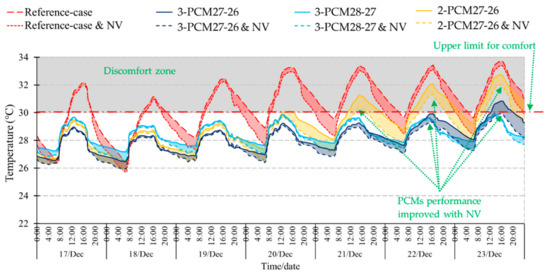
Figure 7.
Effects of combining night ventilation (NV) at 8ACH with PCM27-26 and PCM28-27, which suffered from uncompleted solidification during the hot nights.
Furthermore, the figure shows that PCM27-26 and PCM28-27 managed to lower the Tₒₚ profile below the upper limit of thermal comfort, which can provide more comfortable conditions. Figure 8 illustrates a one-day comparison between the Tₒₚ profiles of these PCMs compared to the reference-case. This figure clearly shows the effect of applying the PCMs on reducing the maximum Tₒₚ and improving the thermal comfort time. On this day, the maximum Tₒₚ was reduced from 34 °C for the reference-case to 29 °C with 3-PCM27-26 (i.e., a reduction of 5 °C). Besides, the thermal discomfort time was decreased completely compared to 16 h for the reference-case.
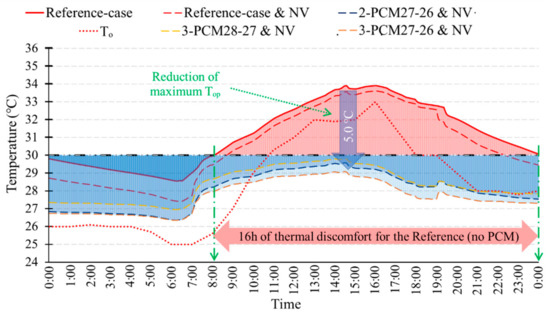
Figure 8.
One-day comparison between Tₒₚ for the 3-PCM27-26, 3-PCM28-27, and 2-PCM27-26 compared to the reference-case shows their effects on reducing the maximum Tₒₚ, which results in more thermally comfortable conditions.
Figure 9 shows the monthly averages of the daily maximum Tₒₚ with PCMs application. The highest reduction was 3.5 °C achieved with 3-PCM27-26 followed by 3-PCM28-27. Although PCM27-26 experienced uncompleted solidifications more than other PCMs, it achieved the highest reduction when used with the higher quantity. Using PCMs with lower transition temperatures can maintain the indoor temperatures in lower levels, which explains the higher reduction on the maximum Tₒₚ. This figure confirms that the use of lower transition temperatures and higher quantities achieved lower Tₒₚ.
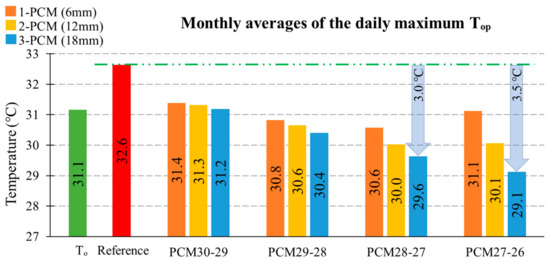
Figure 9.
Monthly averages of the daily maximum Tₒₚ with the application of PCMs compared to the reference-case, which shows improved performance with lower transition temperatures and higher quantity.
Figure 10 shows the TCT, RTCT, and TDT for the various investigated transition temperatures and quantities of PCMs compared to the reference-case. Even though the Tₒ reached above 30 °C only at 16.7% of the time, the TDT reached up to 56.1% in the reference-case (zone A). Applying the NV for the reference-case decreased TDT by 12.5% and increased the TCT by 9.8%. On the other hand, the PCMs application showed different influences on the thermal comfort levels based on the used transition temperatures and quantities. The performance improved with the use of lower transition temperatures and higher quantities, as found earlier. For instance, both PCM30-29 and PCM29-28 (zones B and C, respectively) managed to decrease the TDT compared to the reference-case. However, they also decreased the TCT. This is attributed to the heat that is being absorbed by PCMs during the daytime and released during the night-time, which reduces the day maximum Tₒₚ and increases the night minimum Tₒₚ. Additionally, more reductions in TDT and TCT were observed when using higher quantities of these PCMs due to the higher heat being absorbed and released. For example, using 3-PCM30-29 (zone B) decreased the TCT to 0% compared to 14% with the reference-case. PCM30-29 and PCM29-28 have solidification temperatures of 29 °C and 28 °C, respectively. Therefore, they start solidifying and releasing the latent heat above 28 °C, which reduces the TCT. Figure 6 also confirms this phenomenon as both PCMs had high Tₒₚ during the night-time.
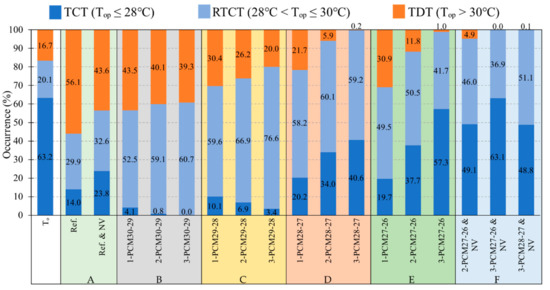
Figure 10.
The thermal comfort time (TCT), relative thermal comfort time (RTCT), and thermal discomfort time (TDT) for all PCM alternatives in comparison to the reference-case. The figure demonstrates the favorability of using lower transition temperatures and higher quantities of PCMs to achieve more thermally comfortable conditions.
Conversely, both PCM28-27 and PCM27-26 (zones D and E, respectively) managed to decrease the TDT and increase the TCT. Besides, their effectiveness was influenced by their quantities as well. For instance, when using 1-PCM, the lowest TDT and highest TCT were achieved with PCM28-27 (21.7% and 20.2%, respectively). In contrast, when using 2-PCM and 3-PCM, the lowest TDT was achieved with PCM28-27 (5.9% and 0.2%, respectively), while the highest TCT was achieved with PCM27-26 (37.7% and 57.3%, respectively). As found earlier, PCM27-26 reduces the Tₒₚ more than the PCM28-27, which explains its higher TCT. However, PCM27-26 also experiences the uncompleted solidification process more than PCM28-27, particularly with high ambient temperatures during the night-time, which reduces its effectiveness to absorb the heat and decreases the maximum temperature during the following days. Therefore, higher TDT was observed with PCM27-26.
Furthermore, by combining NV with 2-PCM27-26, 3-PCM27-26, and 3-PCM28-27 (zone F), better performance was achieved. The TCT has increased further by 11.4%, 5.8%, and 8.2%, while the TDT has decreased further by 6.9%, 1%, and 0.1% with 2-PCM27-26, 3-PCM27-26, and 3-PCM28-27, respectively. Applying NV to the indoor environment removes the accumulated heat from the daytime and the released heat from the PCMs during the night-time and replaces them with the night cooler outdoor air. This process results in lower indoor temperatures, which contributes to more TCT. Besides, it improves the PCMs’ solidification process, which results in more PCMs effectiveness and, therefore, lower TDT. However, the reduction in TDT with NV was high with 2-PCM27-26, while it was very minimal with 3-PCM27-26 and 3-PCM28-27, which reflects the influence of using higher PCMs quantity on improving their performances. This also highlights that the use of 3-PCM is adequate for the investigated conditions and there is no need to investigate higher quantities.
Finally, the optimum performance was achieved when using 3-PCM27-26 combined with NV (i.e., TDT decreased completely, and TCT increased up to 63.1%) followed by 3-PCM28-27 and 2-PCM27-26. However, using 2-PCM27-26 (i.e., lower quantity with lower transition temperatures) showed slightly higher TCT compared to 3-PCM28-27 (i.e., higher quantity with higher transition temperatures), which is attributed to the ability of PCM27-26 to regulate the indoor temperatures in lower levels as discussed earlier. This also indicates that the optimum transition temperatures of the PCMs for the investigated conditions are the lowest temperatures that can achieve an adequate solidification process.
3.2. PCMs Performance Year-Round
The effectiveness of 3-PCM27-26 was investigated year-round and compared to the reference-case, 3-PCM28-27, and 2-PCM27-26 (all combined with NV). Figure 11 shows that all PCMs managed to improve the TDT and TCT year-round. For instance, the TDT was decreased completely in 12, 9, and 4 months with 3-PCM28-27, 3-PCM27-26, and 2-PCM27-26, respectively, and did not increase more than 15% in the other months, compared to 59% for the reference-case. Although the TDT was decreased completely in all months with 3-PCM28-27, the TCT was higher with 3-PCM27-26 in all months. Besides, the maximum TCT in a month reached as high as 98% with 3PCM27-26 and up to 78% with 3-PCM28-27 compared to 56% for the reference-case.

Figure 11.
Year-round TCT, RTCT, and TDT for PCMs applications combined with NV compared to the reference. The figure confirms the effectiveness of a single optimum PCM year-round.
Moreover, the maximum yearly average TCT reached 78% with 3-PCM27-26, followed by 65% and 60% with 2-PCM27-26 and 3-PCM28-27, respectively, while their yearly average TDT were 1%, 4%, and 0%, respectively. This confirms that 3-PCM27-26 with NV has achieved optimum performance year-round. It also shows that using 2-PCM27-26 is more desirable than 3-PCM28-27 from an economical point of view due to the lower PCM quantity and the higher TCT.
4. Conclusions
This study investigated the potential of buildings retrofitting with PCMs to enhance the indoor thermal environment of naturally conditioned buildings in tropical climate of Malaysia for more thermally comfortable conditions. The following points can be concluded:
- PCMs application showed effectiveness in reducing the Tₒₚ profile, which improved the TCT in buildings and managed to decrease the TDT completely.
- Better performance was observed when using PCMs with lower transition temperatures and higher quantities.
- Combining NV with PCMs improves their performance and effectiveness. Therefore, higher TCT and lower TDT were achieved. The effect of NV was observed more in PCMs with lower transition temperatures.
- In the investigated conditions, the optimum performance was achieved with an 18mm layer of PCM27-26, which increased the TCT to 78% (i.e., 45% more TCT) and decreased the TDT to 1% (i.e., 33% less TDT) for the year-round.
Author Contributions
Funding acquisition, M.I.M.H.; investigation, Z.A.A.-A.; methodology, Z.A.A.-A. and M.I.M.H.; project administration, M.I.M.H.; software, Z.A.A.-A.; supervision, M.I.M.H. and M.I.; validation, Z.A.A.-A. and A.G.; writing original draft, Z.A.A.-A.; writing review and editing, Z.A.A.-A., M.I.M.H., and M.I. All authors have read and agreed to the published version of the manuscript.
Funding
This research was funded by Universiti Sains Malaysia, Research University Grant number (1001/PPBGN/814285).
Institutional Review Board Statement
Not applicable.
Informed Consent Statement
Not applicable.
Data Availability Statement
Not applicable.
Acknowledgments
The authors would like to thank the School of Housing, Building, and Planning, Universiti Sains Malaysia for providing financial support. The first author also acknowledges the Department of Architecture, Faculty of Engineering, Sana’a University for support through a scholarship.
Conflicts of Interest
The authors declare no conflict of interest.
References
- Röck, M.; Ruschi, M.; Saade, M.; Balouktsi, M.; Nygaard, F.; Birgisdottir, H.; Frischknecht, R.; Habert, G.; Lützkendorf, T. Embodied GHG emissions of buildings—The hidden challenge for e ff ective climate change mitigation. Appl. Energy 2020, 258, 114107. [Google Scholar] [CrossRef]
- Tang, K.H.D. Climate change in Malaysia: Trends, contributors, impacts, mitigation and adaptations. Sci. Total Environ. 2019, 650, 1858–1871. [Google Scholar] [CrossRef] [PubMed]
- Energy Commission. Malaysia Energy Statistics Handbook 2019; Suruhanjaya Tenaga (Energy Commission): Putrajaya, Malaysia, 2019.
- Economic Planning Unit. Eleventh Malaysia Plan 2016–2020: Anchoring Growth on People; Economic Planning Unit: Putrajaya, Malaysia, 2015.
- Energy Commission. National Energy Balance 2017; Suruhanjaya Tenaga (Energy Commission): Petaling Jaya, Malaysia, 2017.
- Tuck, N.W.; Zaki, S.A.; Hagishima, A.; Rijal, H.B.; Zakaria, M.A.; Yakub, F. Effectiveness of free running passive cooling strategies for indoor thermal environments: Example from a two-storey corner terrace house in Malaysia. Build. Environ. 2019, 160. [Google Scholar] [CrossRef]
- Sadeghifam, A.N.; Zahraee, S.M.; Meynagh, M.M.; Kiani, I. Combined use of design of experiment and dynamic building simulation in assessment of energy efficiency in tropical residential buildings. Energy Build. 2015, 86, 525–533. [Google Scholar] [CrossRef]
- American National Standards Institute; The American Society of Heating, Refrigerating and Air-Conditioning Engineers. ANSI/ASHRAE Standard 55:2017. Thermal Environmental Conditions for Human Occupancy; ASHRAE: Atlanta, GA, USA, 2017. [Google Scholar]
- Al-Absi, Z.A.; Abas, N.F. Subjective assessment of thermal comfort for residents in naturally ventilated residential building in Malaysia. In Proceedings of the IOP Conference Series: Materials Science and Engineering, Penang, Malaysia, 9–10 May 2018; IOP Publishing: Bristol, UK, 2018; Volume 401. [Google Scholar]
- Toe, D.H.C.; Kubota, T. Development of an adaptive thermal comfort equation for naturally ventilated buildings in hot–humid climates using ASHRAE RP-884 database. Front. Archit. Res. 2013, 2, 278–291. [Google Scholar] [CrossRef]
- Luo, M.; de Dear, R.; Ji, W.; Bin, C.; Lin, B.; Ouyang, Q.; Zhu, Y. The dynamics of thermal comfort expectations: The problem, challenge and impication. Build. Environ. 2016, 95, 322–329. [Google Scholar] [CrossRef]
- Abdulshukor, A.B. Human Thermal Comfort in Tropical Climates. Ph.D. Thesis, University College London, London, UK, 1993. [Google Scholar]
- Dahlan, N.D.; Jones, P.J.; Alexander, D.K.; Salleh, E.; Dixon, D. Field measurement and subjects’ votes assessment on thermal comfort in high-rise hostels in Malaysia. Indoor Built Environ. 2008, 17, 334–345. [Google Scholar] [CrossRef]
- Hussein, I.; Rahman, M.H.A.; Maria, T. Field studies on thermal comfort of air-conditioned and non air-conditioned buildings in Malaysia. In Proceedings of the 2009 3rd International Conference on Energy and Environment (ICEE), Malacca, Malaysia, 7–8 December 2009; pp. 360–368. [Google Scholar]
- Djamila, H.; Chu, C.-M.; Kumaresan, S. Field study of thermal comfort in residential buildings in the equatorial hot-humid climate of Malaysia. Build. Environ. 2013, 62, 133–142. [Google Scholar] [CrossRef]
- Damiati, S.A.; Zaki, S.A.; Rijal, H.B.; Wonorahardjo, S. Field study on adaptive thermal comfort in office buildings in Malaysia, Indonesia, Singapore, and Japan during hot and humid season. Build. Environ. 2016, 109, 208–223. [Google Scholar] [CrossRef]
- The British Standards Institution. BS EN 15251:2007. Indoor Environmental Input Parameters for Design and Assessment of Energy Performance of Buildings Addressing Indoor Air Quality, Thermal Environment, Lighting and Acoustics; BSI: Brussels, Belgium, 2007. [Google Scholar]
- Malaysian Standard. MS 2680:2017. Energy Efficiency and Use of Renewable Energy for Residential Buildings—Code of Practice; Department of Standards Malaysia: Cyberjaya, Malaysia, 2017.
- Kubota, T.; Chyee, D.T.H.; Ahmad, S. The effects of night ventilation technique on indoor thermal environment for residential buildings in hot-humid climate of Malaysia. Energy Build. 2009, 41, 829–839. [Google Scholar] [CrossRef]
- Omar, N.A.M.; Fadzil, S.F.S. Effects of high mass on thermal performance of heritage buildings in George Town, Penang. J. Built Environ. Technol. Eng. 2016, 1, 196–204. [Google Scholar]
- Omar, N.A.M.; Syed-Fadzil, S.F. Assessment of passive thermal performance for a Penang heritage shop house. Procedia Eng. 2011, 20, 203–212. [Google Scholar] [CrossRef][Green Version]
- Hassan, A.S.; Ramli, M. Natural Ventilation of Indoor Air Temperature: A Case Study of the Traditional Malay House in Penang. Am. J. Eng. Appl. Sci. 2010, 3, 521–528. [Google Scholar] [CrossRef]
- Hafizal, M.I.M.; Hiroshi, Y.; Goto, T. Comparative Study of Indoor Environment in Residential Buildings in Hot Humid Climate of Malaysia. Int. J. Civil Archit. Struct. Constr. Eng. 2012, 6, 1004–1009. [Google Scholar]
- Ascione, F.; Bianco, N.; De Masi, R.F.; Mastellone, M.; Vanoli, G.P. Phase change materials for reducing cooling energy demand and improving indoor comfort: A step-by-step retrofit of a Mediterranean educational building. Energies 2019, 12, 3661. [Google Scholar] [CrossRef]
- Al-Absi, Z.A.; Mohd Isa, M.H.; Ismail, M. Phase Change Materials (PCMs) and Their Optimum Position in Building Walls. Sustainability 2020, 12, 1294. [Google Scholar] [CrossRef]
- Kuznik, F.; Virgone, J. Experimental assessment of a phase change material for wall building use. Appl. Energy 2009, 86, 2038–2046. [Google Scholar] [CrossRef]
- Ramakrishnan, S.; Wang, X.; Sanjayan, J.; Wilson, J. Thermal performance of buildings integrated with phase change materials to reduce heat stress risks during extreme heatwave events. Appl. Energy 2017, 194, 410–421. [Google Scholar] [CrossRef]
- Sarı, A.; Bicer, A.; Karaipekli, A.; Al-Sulaiman, F.A. Preparation, characterization and thermal regulation performance of cement based-composite phase change material. Sol. Energy Mater. Sol. Cells 2018, 174, 523–529. [Google Scholar] [CrossRef]
- Evola, G.; Marletta, L.; Sicurella, F. A methodology for investigating the effectiveness of PCM wallboards for summer thermal comfort in buildings. Build. Environ. 2013, 59, 517–527. [Google Scholar] [CrossRef]
- Lei, J.; Kumarasamy, K.; Zingre, K.T.; Yang, J.; Wan, M.P.; Yang, E.H. Cool colored coating and phase change materials as complementary cooling strategies for building cooling load reduction in tropics. Appl. Energy 2017, 190, 57–63. [Google Scholar] [CrossRef]
- Aflaki, A.; Mahyuddin, N.; Manteghi, G.; Baharum, M. Building height effects on indoor air temperature and velocity in high rise residential buildings in tropical climate. OIDA Int. J. Sustain. Dev. 2014, 7, 39–48. [Google Scholar]
- Solgi, E.; Hamedani, Z.; Fernando, R.; Kari, B.M.; Skates, H. A parametric study of phase change material behaviour when used with night ventilation in different climatic zones. Build. Environ. 2019, 147, 327–336. [Google Scholar] [CrossRef]
- Kośny, J. PCM-Enhanced Building Components: An Application of Phase Change Materials in Building Envelopes and Internal Structures; Derby, B., Ed.; Springer: Boston, MA, USA, 2015; ISBN 9783319142852. [Google Scholar]
- Kamal, R.; Moloney, F.; Wickramaratne, C.; Narasimhan, A.; Goswami, D.Y. Strategic control and cost optimization of thermal energy storage in buildings using EnergyPlus. Appl. Energy 2019, 246, 77–90. [Google Scholar] [CrossRef]
- Al-Janabi, A.; Kavgic, M. Application and sensitivity analysis of the phase change material hysteresis method in EnergyPlus: A case study. Appl. Therm. Eng. 2019, 162. [Google Scholar] [CrossRef]
- Zhang, Y.; Cui, H.; Tang, W.; Sang, G.; Wu, H. Effect of summer ventilation on the thermal performance and energy efficiency of buildings utilizing phase change materials. Energies 2017, 10, 1214. [Google Scholar] [CrossRef]
- Huang, K.T.; Hwang, R.L. Future trends of residential building cooling energy and passive adaptation measures to counteract climate change: The case of Taiwan. Appl. Energy 2015, 184, 1230–1240. [Google Scholar] [CrossRef]
- Sage-Lauck, J.S.; Sailor, D.J. Evaluation of phase change materials for improving thermal comfort in a super-insulated residential building. Energy Build. 2014, 79, 32–40. [Google Scholar] [CrossRef]
- Kosny, J.; Stovall, T.; Shrestha, S.; Yarbrough, D. Theoretical and Experimental Thermal Performance Analysis of Complex Thermal Storage Membrane Containing Bio-Based Phase Change Material (PCM); Oak Ridge National Lab.(ORNL): Oak Ridge, TN, USA, 2010. [Google Scholar]
- Wijesuriya, S.; Tabares-Velasco, P.C.; Biswas, K.; Heim, D. Empirical validation and comparison of PCM modeling algorithms commonly used in building energy and hygrothermal software. Build. Environ. 2020, 173. [Google Scholar] [CrossRef]
- Tabares-Velasco, P.C.; Christensen, C.; Bianchi, M. Verification and validation of EnergyPlus phase change material model for opaque wall assemblies. Build. Environ. 2012, 54, 186–196. [Google Scholar] [CrossRef]
- Ling, H.; Chen, C.; Qin, H.; Wei, S.; Lin, J.; Li, N.; Zhang, M.; Yu, N.; Li, Y. Indicators evaluating thermal inertia performance of envelops with phase change material. Energy Build. 2016, 122, 175–184. [Google Scholar] [CrossRef]
- Cui, H.; Memon, S.A.; Liu, R. Development, mechanical properties and numerical simulation of macro encapsulated thermal energy storage concrete. Energy Build. 2015, 96, 162–174. [Google Scholar] [CrossRef]
- Chan, A.L.S. Energy and environmental performance of building façades integrated with phase change material in subtropical Hong Kong. Energy Build. 2011, 43, 2947–2955. [Google Scholar] [CrossRef]
- Alam, M.; Jamil, H.; Sanjayan, J.; Wilson, J. Energy saving potential of phase change materials in major Australian cities. Energy Build. 2014, 78, 192–201. [Google Scholar] [CrossRef]
- Saffari, M.; de Gracia, A.; Ushak, S.; Cabeza, L.F. Passive cooling of buildings with phase change materials using whole-building energy simulation tools: A review. Renew. Sustain. Energy Rev. 2017, 80, 1239–1255. [Google Scholar] [CrossRef]
- Sovetova, M.; Memon, S.A.; Kim, J. Thermal performance and energy efficiency of building integrated with PCMs in hot desert climate region. Sol. Energy 2019, 189, 357–371. [Google Scholar] [CrossRef]
- Al-Absi, Z.A.; Hafizal, M.I.M.; Ismail, M.; Ahmad, M.I.; Ghazali, M.A. Peak indoor air temperature reduction for buildings in hot-humid climate using phase change materials. Case Stud. Therm. Eng. 2020, 22. [Google Scholar] [CrossRef]
- Venegas, T.; Vasco, D.A.; García, F.E.; Salinas, C. Effect of the insulation level on the thermal response of a PCM-modified envelope of a dwelling in Chile. Appl. Therm. Eng. 2018, 141, 79–89. [Google Scholar] [CrossRef]
- Auzeby, M.; Wei, S.; Underwood, C.; Tindall, J.; Chen, C.; Ling, H.; Buswell, R. Effectiveness of using phase change materials on reducing summer overheating issues in UK residential buildings with identification of influential factors. Energies 2016, 9, 605. [Google Scholar] [CrossRef]
- Auzeby, M.; Wei, S.; Underwood, C.; Chen, C.; Ling, H.; Pan, S.; Ng, B.; Tindall, J.; Buswell, R. Using Phase Change Materials to Reduce Overheating Issues in UK Residential Buildings. Energy Procedia 2017, 105, 4072–4077. [Google Scholar] [CrossRef]
- Curpek, J.; Hraska, J. Simulation study on thermal performance of a ventilated PV façade coupled with PCM. Appl. Mech. Mater. 2016, 861, 167–174. [Google Scholar] [CrossRef]
- Climate.OneBuilding.Org. Repository of Free Climate Data for Building Performance Simulation. Available online: http://climate.onebuilding.org/WMO_Region_5_Southwest_Pacific/MYS_Malaysia/index.html#IDPG_Pulau_Pinang- (accessed on 13 November 2019).
- EnergyPlus. EnergyPlusTM Version 9.1.0 Documentation: Engineering Reference; Department of Energy: Washington, DC, USA, 2019.
- DesignBuilder. DesignBuilder Help V6. Available online: https://designbuilder.co.uk/helpv6.0/ (accessed on 23 June 2020).
- Evola, G.; Marletta, L.; Sicurella, F. Simulation of a ventilated cavity to enhance the effectiveness of PCM wallboards for summer thermal comfort in buildings. Energy Build. 2014, 70, 480–489. [Google Scholar] [CrossRef]
- DesignBuilder. DesignBuilder Help—Working with Large Models. Available online: https://designbuilder.co.uk/helpv6.0/#Working_with_Large_Models.htm?Highlight=largmodel (accessed on 1 November 2019).
- DesignBuilder. DesignBuilder Help—Adjacency. Available online: https://designbuilder.co.uk/helpv6.0/#Adjacency.htm?Highlight=adjacency (accessed on 18 November 2019).
- Kuznik, F.; Virgone, J. Experimental investigation of wallboard containing phase change material: Data for validation of numerical modeling. Energy Build. 2009, 41, 561–570. [Google Scholar] [CrossRef]
- Insolcorp Infinite-RTM—Product Handout. Available online: https://www.insolcorp.com/for-designers/ (accessed on 1 March 2020).
- Zhou, G.; Yang, Y.; Wang, X.; Zhou, S. Numerical analysis of effect of shape-stabilized phase change material plates in a building combined with night ventilation. Appl. Energy 2009, 86, 52–59. [Google Scholar] [CrossRef]
- Zhou, D.; Tian, Y.; Qu, Y.; Chen, Y.K. Thermal analysis of phase change material board (PCMB) under weather conditions in the summer. Appl. Therm. Eng. 2016, 99, 690–702. [Google Scholar] [CrossRef]
- Lei, J.; Yang, J.; Yang, E.H. Energy performance of building envelopes integrated with phase change materials for cooling load reduction in tropical Singapore. Appl. Energy 2016, 162, 207–217. [Google Scholar] [CrossRef]
- Xie, J.; Wang, W.; Liu, J.; Pan, S. Thermal performance analysis of PCM wallboards for building application based on numerical simulation. Sol. Energy 2018, 162, 533–540. [Google Scholar] [CrossRef]
- Ling, H.; Chen, C.; Wei, S.; Guan, Y.; Ma, C.; Xie, G.; Li, N.; Chen, Z. Effect of phase change materials on indoor thermal environment under different weather conditions and over a long time. Appl. Energy 2015, 140, 329–337. [Google Scholar] [CrossRef]


Publisher’s Note: MDPI stays neutral with regard to jurisdictional claims in published maps and institutional affiliations. |
© 2021 by the authors. Licensee MDPI, Basel, Switzerland. This article is an open access article distributed under the terms and conditions of the Creative Commons Attribution (CC BY) license (http://creativecommons.org/licenses/by/4.0/).