Abstract
Due to increase in the public and stakeholders’ awareness regarding economic, environmental, and social issues, the construction industry tends to follow the sustainability policies and practices in supply chain management. Hence, one of the most crucial aspects for a construction company in this regard is sustainable supplier selection, and, to this end, an accurate and reliable model is required. In this paper a hybrid fuzzy best-worst method and fuzzy inference system model is developed for sustainable supplier selection. In the first phase of this study, after determining 19 criteria in three main aspects, the final weight of each aspect and criterion is obtained using fuzzy best-worst method approach. In the second phase, the most sustainable supplier is selected by running the weighted fuzzy inference system both in aspect and criterion level, providing more accurate results compared to the use of other available models. Finally, two different tests are employed to validate the results and evaluate the robustness of the proposed model. The novel developed model enables the decision-maker to simulate the decision-making process, reduce the calculations loads, consider a large number of criteria in decision making, and resolve the inherited uncertainties in experts’ responses.
1. Introduction
Sustainability is a comprehensive concept for integrating environmental, social, and economic issues [1,2]. This concept was introduced in the Brundtland report as “meeting today’s requirement without compromising the ability of future generations for meeting their requirement” [3]. Literally, Končar et al. [4] indicate that sustainability is an efficient strategy to manage upcoming challenges that exist in global supply chains, while it also enhances competitiveness and financial performance [5]. Given the increasing trend in the adoption of sustainable practices [6], the related literature shows that one of the most influential activities for promoting sustainability is Sustainable Supply Chain Management (SSCM) in firms [7].
Supply chain is a concept that links upstream, midstream, and downstream. Moreover, Supply Chain Management (SCM) receives the applicable information from downstream to improve the quality of the goods provided by upstream and downstream. As it is seen in Figure 1, upstream of the SC is a supplier (suppliers are responsible to provide raw material for manufacturers), midstream is the manufacturer (the ordered goods is produced in this echelon of a supply chain), and downstream is customers (the end-users) [8].
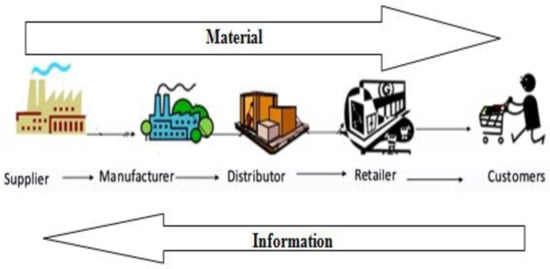
Figure 1.
The procedure of supply chain [9].
Nimsai et al. [10] report that sustainability is considered a key factor in the evolution of SCM in manufacturing industries. This has led management experts and scholars to explore how SSCM could lead to waste reduction, more efficient resource usage, energy conservation, and less detrimental environmental effects [11]. Moreover, quick changes in the patterns of customer demand, competition growth, and pressures from governments and other stakeholder groups have motivated most firms to implement SSCM [12].
Sustainable suppliers have played an important role in promoting and achieving a balance in between the key pillars of sustainable supply chain; hence, Sustainable Supplier Selection (SSS) is of strategic importance in managing an environmentally, economically and socially conscious supply chain [13]. Reportedly, both the traditional supplier selection—particular focus on economic profit and cost optimization—and green supplier evaluation—environmental performance is a priority—disregard the social pillar, which is required to make the supply chain truly sustainable [14]. Therefore, due to the conflicting sustainability legislation and organizational goals, suppliers’ performance evaluation and selection are considered as a complicated process. Moreover, it should be noted that since human assessments are usually vague due to the multiple selection benchmarks with different levels of significance, the fuzzy concept has been often applied in this subject to resolve the uncertainties [15].
Reportedly, there are two main phases in suppliers’ performance selection: (a) determining the importance degree of each aspect and their corresponding criteria using Hierarchy Process (AHP)/Fuzzy AHP, Analytical Network Process (ANP)/Fuzzy ANP, experts’ experience (questionnaire-based survey); (b) assessing and ranking the suppliers’ performance using Simple Additive Weighting (SAW)/Fuzzy SAW, Technique of Order Preference Similarity to the Ideal Solution (TOPSIS)/Fuzzy TOPSIS, VlseKriterijumska Optimizcija I Kaompromisno Resenje (VIKOR)/Fuzzy VIKOR, etc. By focusing on the literature, it is clear that most of the weighting methods are very time-consuming and need tremendous calculations. In addition, most of the mentioned evaluation techniques are merely used for ranking. That is, these techniques are not able to simulate the suppliers’ behavior and cannot predict their performance in different situations.
Most of the studies on SSS use fuzzy MCDM techniques with complex calculations. This reduces the desire of SC managers in practical application of those models, especially where adding/removing several supplier alternatives is needed [16]. To solve this problem, one of the MCDM approaches that can be used is the Fuzzy Best-Worst Method (FBWM), which was developed by Guo and Zhao [17]. The advantage of this method is that it can obtain the relative weights of evaluative criteria using fewer calculations and paired comparisons accompanied with a lower level of inconsistency [18]. This method is capable of obtaining higher accuracy compared to the traditional methods, as it requires only the preference of the best criterion over other criteria and the preference of other criteria over the worst one [19].
However, due to the involvement of considerable mathematical calculations [20], fuzzy logic integrated MCDM techniques have some difficulties in handling a large number of sustainability criteria and suppliers. Besides, unlike common MCDM techniques like AHP, TOPSIS and VIKOR which are only capable of ranking the decision-making alternatives, the FIS method is not only capable of simulating the decision-making process but also of considering any possible changes in the future. FIS employs Rule-Based Architecture (RBA) which is more capable of capturing the input parameter through the membership function and rule base of FIS. Besides, FIS incorporates the expert’s knowledge to form the fuzzy rules set which improves supplier performance evaluation and presents more precise and acceptable results [21]. As a result it can be mentioned that FIS system outperforms other fuzzy MCDM techniques [22] in SSS. However, in the FIS approach, the higher the number of criteria, the more complex the RBA, which would be a challenge for decision-makers (DMs). There are some other challenges related to the formulating FIS model for an optimized SSS such as: (1) identifying the most critical sustainability criteria in economic, social, and environmental aspects; (2) establishing quantified sub-criteria for each sustainability criteria based on current industry approaches; and (3) assessing the sustainability performance index for any supplier [23].
With the above in mind, this study aims at developing a novel hybrid model by integrating FBWM and FIS to compute both the weight of the criteria and simulate the suppliers’ performance. The novelty of the research is to develop a hybrid model in SSS which is capable of simulating the decision-making process, considering a large number of criteria, and providing more accurate results.
2. Literature Review
Different models were presented for selecting suitable suppliers towards green and sustainable approaches over a wide range of methods [20]. These methods can be categorized into two main categories, namely, single models (i.e., qualitative methods, mathematical programming, Multi-Criteria Decision Making (MCDM) methods, artificial intelligence), and hybrid models. Integrated techniques have been broadly employed in the supplier selection process since this decision naturally needs multiple goals incorporating criteria in an uncertain environment [21] (Figure 2).
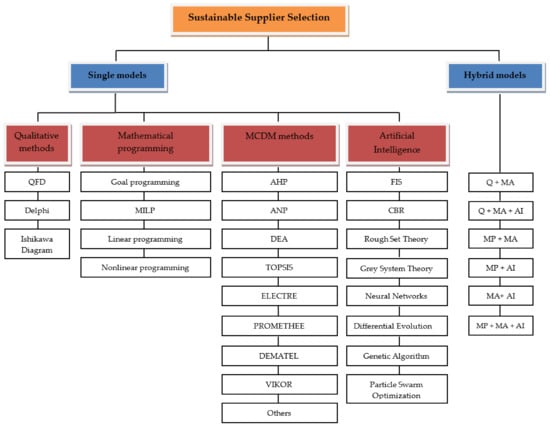
Figure 2.
Classifying the modeling approaches, as classified by Zimmer et al. [15].
Abbreviations: Quality Function Deployment (QFD); Mixed Integer Linear Program-ming (MILP); Data Envelopment Analysis (DEA); Preference Ranking Organization Method for Enrichment of Evaluations (PROMETHEE); Elimination and Choice Express-ing Reality (ELECTRE); Decision Making Trial and Evaluation Laboratory (DEMATEL); Case-Based Reasoning (CBR); Qualitative (Q); Mathematical programming (MP); Mathe-matical Analytical (MA); Artificial Intelligence (AI)
2.1. Application of FBWM and FIS in SSS
This research aimed at developing a hybrid FBWM and FIS model for SSS, which has not attained attention in previous studies. Thus, the literature on SSS employing FBWM or FIS technique is reviewed.
As mentioned earlier, the FBWM approach was first presented by Guo and Zhao [17]. Of course, previously, the BWM approach had been presented by Rezaei [24]. Regardless, this approach is relatively new, thus, there are not many studies employing FBWM in the field of SSS. Jafarzadeh Ghoushchi et al. [19] integrated FBWM with a piecewise linear value function for selecting sustainable suppliers in the oilseed industry of a food supply chain, in which the first technique is aimed at weigh supplier selection criteria and the second one is employed to rank suppliers. Hendiani et al. [25] developed a hierarchical fuzzy index-based approach using FBWM for SSS, in which sustainable suppliers can be selected based on sustainability triple bottom line criteria. Moreover, they applied Graded Mean Integration Representation Method for prioritizing the suppliers based on their performance value, in order to improve the accuracy of the process. Furthermore, Ecer and Pamucar [26] combined FBWM and fuzzy CoCoSo with Bonferroni (CoCoSo’B) for selecting sustainable suppliers. Apart from FBWM, which is used for obtaining the weights of criteria, the traditional Combined Compromise Solution (CoCoSo) approach is improved by integrating the normalized weights and the normalized weighted geometric Bonferroni mean functions for selecting the sustainable suppliers. Finally, Amiri et al. [27] developed a novel FBWM approach for selecting sustainable suppliers in SCM. They employed α-cut analysis, where the decision-maker can specify the “α” value between 0.1 and 0.9, based on the uncertainty level, such that a high “α” value represents low uncertainty and a low “α” value represents high uncertainty in the process of decision-making.
Like FBWM, the FIS model is almost rarely used in the field of SSS. Jain and Singh [23] developed a two-phase decision model using FIS combined with the Fuzzy Kano technique for selecting sustainable suppliers for a large-scale iron and steel industry. In the first phase, the fuzzy Kano model was employed to identify ‘Must-be’ criteria in economic, environmental, and social aspects for sustainability criteria clustering. In the second phase, the three distinct FIS were developed to assess the Sustainability Performance Index (SPI) values of each supplier in three sustainability aspects. Finally, weights were assigned to SPI in any aspect, and suppliers were ranked regarding final selection. The sensitivity analysis showed the robustness of the proposed model.
Amindoust and Saghafinia [20] employed a modular fuzzy inference system model for selecting sustainable supplier(s) in the textile industry. In this research, the relative importance of criteria and the suppliers’ performance considering criteria were evaluated based on decision-makers’ preferences. In their study, the fuzzy set theory and a modular model on the basis of FIS were developed to resolve the subjectivity of decision-makers’ opinions. The feasibility and validity of the proposed model were confirmed by utilizing it in a real-life supplier selection problem. Ghadimi et al. [21] selected sustainable suppliers through scoring their performance by audition check-list-based fuzzy inference system in the automotive spare part industry. First, the audition check-list approach as a requirement gathering approach was designed to facilitate the process of data gathering for evaluating suppliers based on three aspects of sustainability. Next, the gathered data was processed by a proposed FIS for removing impreciseness and vagueness in the sustainability-related data.
Furthermore, Jain et al. [28] developed FIS and integrated fuzzy MCDM techniques for selecting sustainable suppliers in the iron and steel industry of India. In their work, for calculating SPI, three distinct FIS engines have been generated for each sustainability aspect and then fuzzy AHP and TOPSIS techniques are employed for the MCDM environment. The robust results show the sustainability performance of each supplier and the ranks were interchanged among the top two suppliers. Pérez-Velázquez and Leysdian Oro-Carralero [29] integrated fuzzy inference and the VIKOR Method for selecting appropriate supplier in photovoltaic module installation. Their method combines a diffuse inference technique along the VIKOR approach and the weight assigned to the aspects using the entropy method, according to the amounts of the decision matrix obtained from the diffuse inference technique. The results of the study show that data collecting from multiple sources and based on input variables can present measures about the suppliers for the selection criteria. Amindoust [30] developed a resilient-sustainable framework based on the supplier selection aspects. In her study, a modular FIS is designed for calculating the affinity indices of suppliers regarding resiliency and sustainability issues. The modular FIS system shapes a comprehensive supplier selection model with any number of aspects and suppliers. Then, the results of the presented modular FIS are passed to an Assurance Region DEA method (AR-DEA) for determining the weights of indices to rank the suppliers. The validity and effectiveness of the proposed are confirmed by sensitivity analysis and implementation in a real case. Paunović et al. [31] proposed a new approach to supplier pre-qualification, supplier selection, and assessment. In the first phase, multi expression programming (MEP) techniques are employed for supplier prequalification. MEP techniques generate experiential models using the knowledge contained in the experimental information. Next, evaluating the qualified suppliers is performed in the second stage by fuzzy logic and FIS. The results show that the proposed model is flexible and can be implemented on different scales. Therefore, given the pros and cons of the reviewed methods, this paper seeks to overcome the traditional shortcomings through a hybrid model providing more reliable and accurate results for selecting the most sustainable supplier.
2.2. SSS Criteria
One of the most critical problems in selecting a sustainable supplier is considering appropriate criteria [32]. The criteria used in SSS are commonly categorized into three environmental, social, and economic aspects. Table 1 shows the sustainability criteria in sustainable selection process.

Table 1.
Common supplier selection criteria in the literature.
In terms of the criteria used in SSS, Luthra et al. [14] introduced “Environmental costs,” “Quality of the product,” “Price of product,” “Occupational health and safety systems,” and “Environmental competencies” as the top five sustainable supplier selection criteria in the Indian automobile industry. N. Muhammad et al. [13] in their study on the Avionics Industry of Pakistan found that traceability, quality, cost, and risk are ranked as the most effective criteria. On the other hand, delivery and after-sales services are ranked as the less effective criteria. Durmic [33] concluded that the economic aspect is the most important aspect for SSS. Social and Environmental aspects are the second and third important aspects, respectively. Furthermore, the study reported that generally quality, price, reliability, long-term partnerships, safety, flexibility, financial ability, and pollution control are the most effective criteria among all aspects in descent order. It should be noted that green competence and resource consumption are determined as the less important criteria in her study. Moreover, Stevic et al. [34] in their study concluded that economic aspect is the most significant aspect for SSS and the next ranks are dedicated to social and environmental aspects, same as the previous study conducted by Durmic [33]. They also referred to quality and price criteria as the most important ones. Song et al. [35] in their study showed that criteria including quality, training, and community development as well as delivery are the most effective criteria for SSS. Their model simultaneously considered the criteria strength and the cause–effect relationships between different criteria, making the result more comprehensive and reasonable.
3. Methodology
In this model, FBWM and FIS techniques are employed, in which the first one is aimed to obtain the final weight of each criterion and the second one is aimed to obtain the overall performance of suppliers based on the sustainability criteria and rank the units. The details of implementing this hybrid method are presented in Figure 3.
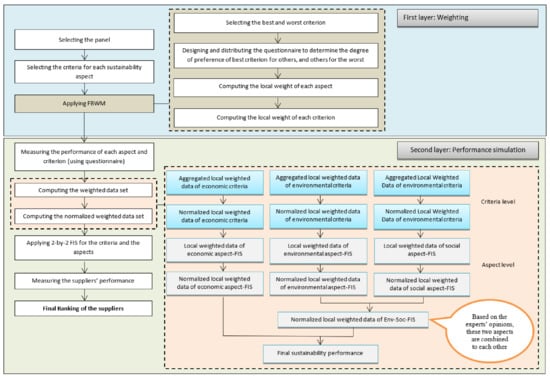
Figure 3.
The proposed FBWM-FIS model.
According to Figure 3, this model has two layers. In the first layer, the first step is selecting the experts as the panel. In the second step, the most suitable sustainability criteria are determined based on the opinion of the panel and the literature. In the last step of this layer, the weights of each aspect and their corresponding criteria are computed by applying FBWM. In the second layer, there are four sections. In the first section, a questionnaire-based survey is done to collect the experts’ opinions (linguistic data set). In the second section of this layer, first the weighted data set is computed. Then the normalized weighted data set for each aspect and criteria are calculated. Finally, the 2-by-2 FIS model is run for simulating the suppliers’ behavior (as the last step of this section). The output result of this section is the suppliers’ performance (as the third section of the second layer). At the end, after obtaining each supplier’s performance value, ranking is done in the last section. It is worth mentioning that the collected linguistic data set is converted to the crisp values. Then, the crisp data set is multiplied with the weights of each aspect and criterion to obtain the weighted data set.
Once computing the normalized weighted data in criteria and the aspect levels, the 2-by-2 FIS (Fuzzy Inference System) model for the criteria level is run for each aspect. While obtaining the FIS results at the criteria level, the performance value is multiplied with the local weights of the aspects. Same as the criteria level, the normalized weighted values are obtained. Based on the experts’ opinions, to apply the 2-by-2 FIS model for the aspect level, the results of normalized weighted data of environment (env) and social (soc) aspects—which are shown as FISenv and FISsoc, respectively—are combined with each other. After these calculations, the final performance of each supplier is computed and the ranking of each supplier is determined. The required calculations for the developed FIS-FBWM are shown in the following sub-sections.
3.1. Fuzzy Best-Worst Method
The following steps should be conducted to obtain the weights of aspects and criteria. The process of local weight calculation for the aspects and criteria are the same.
Step 1: Selecting the best (B) and worst (W) aspects (i.e., economic, environmental, and social aspects) based on the opinions of three experts (,
Step 2: Determining the degree of preference of the best aspects for other aspects presented by three experts. Each expert presents their preference degree. Best-to-others (BO) vector for the aspects is displayed as = (, , ), where shows the fuzzy linguistic preference of aspect B versus other aspects.
Step 3: Determining the degree of preference of all aspects to the worst aspect presented by three experts. Each expert presents their preference degree. Others-to-worst (OW) vector for the aspects is displayed as = (, , ), where shows the fuzzy linguistic preference of each aspect versus the worst aspect.
Step 4: The optimal weights of aspects should be calculated through BO and OW vectors presented by three experts using the model developed by Guo and Zhao [17], which is shown as follows. Then the average of three fuzzy weight values should be obtained.
Considering , assume = (, , , then Equation (1) can be transferred as follows:
By solving Equation (2), the optimal fuzzy weights for aspects (, … ) can be obtained in terms of the opinion of each expert. Then the fuzzy average weights of three experts can be presented.
Step 5: Determining the necessary criteria for each aspect based on the previous literature and the opinions of experts. They are shown as (, ).
Step 6: Determining the degree of preference of the best criterion for other criteria in each aspect presented by three experts. Each expert presents their preference degree. BO vector for the criteria is displayed as = (, , …, ), where shows the fuzzy linguistic preference of criterion B versus other criteria.
Step 7: Determining the degree of preference of all criteria to the worst criterion presented by three experts. Each expert presents their preference degree. OW vector for the criteria is displayed as = (, ), where shows the fuzzy linguistic preference of each criterion versus the worst criteria.
Step 8: Same as Step 4, the optimal weights of criteria should be calculated through BO and OW vectors (for criteria) presented by three experts using the model developed by Guo and Zhao, which is shown in Equations (1) and (2). Then, for each aspect, the average of three fuzzy weight values should be obtained. Equations (3) and (4) for obtaining the optimal weights of criteria change as follows:
Considering , assume = (, , , then Equation (4) can be transformed as
By solving Equation (4), the optimal fuzzy weights for criteria in each aspect (, …, ) can be obtained in terms of the opinion of each expert. Then the fuzzy average weights of three experts can be presented for each aspect.
It should be noted that the experts express their subjective preferences (both for aspects and criteria) as linguistic terms in the form of fuzzy numbers. The complete set of linguistic terms is shown in Table 2.
Table 2.
Transformation rules of linguistic terms and fuzzy sets for the FBWM.
3.2. Fuzzy Inference System (FIS)
Step 1: Measuring the performance of aspects and criteria
In the second section and as the starting point of second layer, FIS technique is employed to finally rank the projects, imitating Fallahpour et al. [36]. In this technique, fuzzy rules are defined through the experts’ opinions, such that if “C” and “M” are the criteria and membership functions, respectively, the number of rules becomes . In this regard, the experts develop the rules by two inputs (if C = 2 and M = 5, the number of rules is 25), in order to prevent a larger number of rules and attributes [36]. For this research, according to the opinions of the relevant experts, the fuzzy rule base is developed based on the following five membership functions:
- Very Poor = (1,2,3) = (VP)
- Poor = (2,3,4) = (P)
- Moderate = (3,4,5) = (M)
- Good = (4,5,6) = (G)
- Very Good = (5,6,7) = (VG)
The fuzzy performance numbers can be defuzzified into precise values using Equation (5) (the Graded Mean Integration (GMI) representation method) [37]:
where are lower, medium, and upper bounds, respectively, and is the performance precise value as a crisp number.
Moreover, Table 3 shows the fuzzy rule base according to the opinions of experts.
Table 3.
The fuzzy rule base.
Step 2: Computing the weighted data set
After specifying the crisp values, they were entered as an input to FIS. For running the FIS, two inputs were employed for obtaining one output regarding the reason explained above. During the selection of two-by-two inputs, if any remained, it would be considered as an output in that specific aspect [38]. As long as all the criteria were included in the hierarchical FIS and the output for each category was reduced to one, this process is continued. Additionally, if the number of experts is more than one, the aggregated weight for each criterion is calculated as (assuming that is the TFN of the weight or value of jth criterion):
where is the number of experts and shows the kth expert’s opinion about the weight or value of the jth criterion.
Step 3: Computing the normalized weighted data set
In this step, the obtained crisp data set is multiplied with the weights of each criterion for each aspect, separately. As the weights are between 0 and 1, the range of the weighted data set is reduced. Therefore, all the suppliers are considered Very Poor (VP). For solving this problem, the weighted data set should be normalized using Equation (7):
where NWD is the normalized weighted data for a supplier’s criterion, WD is the weighted data for a supplier’s criterion, and MPWD is the maximum possible weighted data for a supplier’s criterion. The computed values of NWD will be placed in the range from 0 to 100; however, the range of the primary linguistic terms or membership functions employed by the experts is between 1 and 7. For addressing this problem, in this phase, a new membership functions will be considered between 0 and 100 as below:
- VP = (0,20,40)
- P = (20,40,60)
- M = (40,60,80)
- G = (60,80,100)
- VG = (80,100,100)
Step 4: Applying 2-by-2 FIS for the criteria and the aspects to measure the suppliers’ performance and final rankings
As noted previously, after computing the normalized weighted for the level of criteria and the aspects, the 2-by-2 FIS model for the criteria level is run for each aspect. After obtaining the FIS results at the criteria level, the performance value is multiplied with the local weights of the aspects. Same as the criteria level, the normalized weighted values are obtained and again new membership function value will be between 0 to100 (same as criteria level). Based on the experts’ opinions, the FIS results of the criteria level should be considered as with as the 2-by-2 FIS and the should be combined as the separated FIS. After the above-mentioned calculations, the final performance of each supplier is computed and the ranking of each supplier is determined.
4. Results and Discussion
4.1. Computing the Weights of the Aspects and Their Criteria Using FBWM
The selected case study includes six suppliers of a construction company, in which the company is aimed at selecting the most sustainable supplier. In the first step, the criteria related to the three traditional aspects are obtained by reviewing the related literature. Then, the criteria are refined by the experts’ opinions and the final list is provided in Table 4.
Table 4.
The discussed aspects and their criteria.
In the next step, according to the steps in using FBWM, the best and worst aspects are determined. Regarding the general opinions of three experts, the economic aspect is considered as the best and the social aspect is considered as the worst. Following Table 2, the linguistic terms for fuzzy BO and OW preferences concerning the opinions of three experts are shown in Table 5 and Table 6.
Table 5.
Fuzzy best-to-others (BO) preferences for aspects.
Table 6.
Fuzzy others-to-worst (OW) preferences for aspects.
Then, for each expert, Equation (2) is solved and the optimal fuzzy weights for aspects are obtained; then, the fuzzy average weights for any aspect can be presented as follows:
- = (0.467572, 478603, 0.50416)
- = (0.231213, 0.24788, 0.266431)
- = (0.155178, 0.160825, 0.186293)
As can be seen, the highest weight is related to the economic aspect, and the environmental and social aspects are the second and third most important aspects. Moreover, this ranking is consistent with the initial opinions regarding the importance of the aspects. According to the procedure mentioned, to obtain the final weight of each criterion in all aspects, the best and worst criteria and also the BO and OW vectors for the criteria in each aspect (aspect) are determined. Table 7, Table 8, Table 9, Table 10, Table 11 and Table 12 show the data used for weight calculation for economic, environmental, and social aspects.
Table 7.
Fuzzy BO preferences for the criteria in the economic aspect.
Table 8.
Fuzzy OW preferences for the criteria in the economic aspect.
Table 9.
Fuzzy BO preferences for the criteria in the environmental aspect.
Table 10.
Fuzzy OW preferences for the criteria in environmental aspect.
Table 11.
Fuzzy BO preferences for the criteria in the social aspect.
Table 12.
Fuzzy OW preferences for the criteria in the social aspect.
Then, for each expert, Equation (4) is solved by the values of BO and OW vectors, and the optimal fuzzy weights for all criteria are obtained. According to each aspect, a relative consistency between the final weights of criteria and the initial opinions of experts can be seen. Moreover, the economic aspect is the most important one, and the criteria “Cost” and “Quality” are the most important criteria. The fuzzy average weights for the aspects and criteria are shown in Table 13 and Table 14, respectively.
Table 13.
Fuzzy average weights for the aspects.
Table 14.
Fuzzy average weights for all criteria.
The results in this phase show that among these three aspects, the “economic” aspect with a local weight of 0.481024 is the most crucial aspect according to the opinions of the experts following by “environmental” and “social” with local weights of 0.248194 and 0.164129, respectively. These rankings for aspects are consistent with the ranking of the average local weights of their corresponding criteria. As all criteria in three aspects are compared together, it can be can observed that “cost” is the most important criterion among all criteria in three aspects with a local weight of 0.634467, followed by “quality,” “pollution control,” “hazardous wastes,” and “workers’ contract.”
When it comes to consistency of the findings, as mentioned by Guo and Zhao [17] in order to validate the FBWM model, the consistency ratio (CR) must be obtained, and a CR value between 0 and 0.1 shows a high consistency degree of pairwise comparison. The closer the CR to the upper limit (0.1), the more consistent the model. Thus, CRs for economic, environmental, and social aspects are obtained as 0.0874, 0.0791, 0.0914, respectively.
4.2. Evaluating and Ranking the Suppliers Using the Weighted FIS
In order to rank the suppliers, the linguistic data sets (from fuzzy rule-based system) were collected from the three experts, and these data were aggregated (Table 15). Then, the crisp performance values were calculated by the GMI representation method.
Table 15.
The experts’ opinions about the projects.
As explained in Section 3 and represented in Figure 3, the rest of the process is continued. The FISs were implemented in MATLAB 2017b. As mentioned, each FIS in the developed model has two inputs and five membership functions. Therefore, the number of rules was 25. Once completing the operations in all the phases, the performance value of a supplier was computed. This process was performed for each supplier and among the six alternatives. As terminating the whole process, the final sustainability performance for the six suppliers and their ranking are provided in Table 16.
Table 16.
Final sustainability performance and ranking.
After running the model, the results show that they are consistent with the findings of the studies of Fallahpour et al. [36] and Hendiani et al. [25]. In order to verify the results, after evaluating the consistency ratio for FBWM, the robustness and validity of the developed model was tested using several defuzzification techniques, i.e., Center of Area (COA), Bisector of Area (BOA), Mean of Maximum (MOM), Smallest of Maximum (SOM), and Largest of Maximum (LOM) for FIS [20].
A comprehensive list of criteria was gathered from reviewing the related literature (Table 1) and a case study was selected. An appropriate selection of the criteria leads to an appropriate and reliable measurement of the suppliers’ performance, thus selecting criteria is a crucial step in this process. In addition, the results of the study show that the criteria including “Cost,” “Quality,” “Pollution Control,” “Hazardous wastes,” and “Workers’ Contract” are the most effective ones compared to the other criteria in this study. This result is consistent with the results of related SSS studies [19,23,25,28,36].
4.3. Model Validaiton
A sensitivity analysis through changing the defuzzification method is performed for verifying the robustness of the FIS model. In this regard, five different defuzzification methods, i.e., COA, BOA, MOM, SOM and LOM, were employed for the analyses. The values presented in Table 17 prove that the rankings of the suppliers are highly similar even by changing the defuzzification approach and suppliers’ rankings remain constant, meaning that the model is valid.
Table 17.
Validation of the model by different defuzzification methods.
4.4. Managerial Implications
This paper presents several managerial implications by the proposed decision-making framework for supply chain managers and decision-makers. The developed model has a wide practical efficiency in medium- and large-scale construction industry.
Construction supply chain managers can adopt this model for evaluating the sustainability performance of their suppliers to select the most appropriate one, when there are many criteria in particular. Furthermore, the developed model incorporates the knowledge of managers and experts of the construction industry to promote the effectiveness of the SSS process, allowing them to have a detailed vision into the suppliers’ sustainability performance.
This study (considering 19 criteria classified in three main aspects of sustainability concept) developed a more comprehensive model for evaluating suppliers’ performance. Moreover, the model employed the FIS technique as an expert system for assessing the suppliers, in order to deal with the common uncertainties and vagueness in such decision-making problems. As an important point, the results of this study, which introduces the most effective criteria to improve the sustainability performance, is useful for the SC managers to cooperate with their suppliers and provide a time- and cost-saving model for an efficient SSS. The developed hybrid model in this paper is applicable in every stage of construction project as the managers’ assistant in assessing the sustainability performance of the suppliers.
5. Conclusions
In this paper, a novel hybrid FBWM-FIS model is developed to enhance the process of SSS in construction industry. To this end, 19 evaluative criteria in three main aspects of SSS are considered and the suppliers’ sustainability performance in a construction company are measured. The results show that Supplier 6, Supplier 1, and Supplier 4 have the highest sustainability performances (93. 93701, 85. 35375, and 82. 17549 respectively) in a descending manner. In addition, the analysis represents that the results of the model are consistent with the previous studies and also with other defuzzification methods (Table 17). To the best of authors’ knowledge, there is no study performing FBWM-FIS as a hybrid method in the field of SSS. The proposed FBWM-FIS model reduces the inherited uncertainties and complexities existing in previous models, providing a more practical model in real-life cases. The FBWM-FIS contributions are threefold: (1) it is capable of dealing with the large numbers of criteria, which is hardly achievable by other MCDM techniques; (2) it reduces the calculation difficulties; (3) it simulates the decision-making process—which is necessary for enabling the model to consider the possible changes in future.
It is worth mentioning that although the model can be generally used for any case study in every region, the findings of this research are case-specific. As a result, it is recommended to reconsider the criteria used prior to their adoption for other cases. Another point is that increasing the number of inputs would raise the number of fuzzy rules, making the process more complicated; as a result, the necessary calculations would be increased. For future studies, it is recommended to consider running of this hybrid FBWM-FIS model under fuzzy type-2 condition, which is applicable in higher uncertainty degree situations. In addition, the potential relationships among the decision criteria should be investigated using suitable MCDM techniques (e.g., Fuzzy Decision Making Trial and Evaluation Laboratory or Fuzzy Analytic Network Process) and their results can be compared with the current study.
Author Contributions
S.A.H.: writing, model development; software; A.F.: writing—original draft, data curation, model development. K.Y.W.: writing—original draft, supervision; A.M.: writing—original draft, reviewing and editing, supervision; funding M.S.: writing—original draft, supervision; S.D.: writing—reviewing and editing. All authors have read and agreed to the published version of the manuscript.
Funding
The APC was funded by Universiti Sains Malaysia.
Data Availability Statement
The data presented in this study are available on request from fallahpour.a@utm.my.
Acknowledgments
The authors would like to express their sincere appreciation to the editors and anonymous reviewers for their valuable and constructive comments.
Conflicts of Interest
The authors declare no conflict of interest.
References
- Arabsheybani, A.; Paydar, M.M.; Safaei, A.S. An integrated fuzzy MOORA method and FMEA technique for sustainable supplier selection considering quantity discounts and supplier’s risk. J. Clean. Prod. 2018, 190, 577–591. [Google Scholar] [CrossRef]
- Durdyev, S.; Zavadskas, E.; Thurnell, D.; Banaitis, A.; Ihtiyar, A. Sustainable Construction Industry in Cambodia: Awareness, Drivers and Barriers. Sustainability 2018, 10, 392. [Google Scholar] [CrossRef]
- Goyal, S.; Routroy, S.; Shah, H. Measuring the environmental sustainability of supply chain for Indian steel industry. Bus. Process. Manag. J. 2018, 24, 517–536. [Google Scholar] [CrossRef]
- Končar, J.; Grubor, A.; Marić, R.; Vučenović, S.; Vukmirović, G. Setbacks to IoT Implementation in the Function of FMCG Supply Chain Sustainability during COVID-19 Pandemic. Sustainability 2020, 12, 7391. [Google Scholar] [CrossRef]
- Sánchez-Flores, R.B.; Cruz-Sotelo, S.E.; Ojeda-Benitez, S.; Ramírez-Barreto, M.E. Sustainable Supply Chain Management—A Literature Review on Emerging Economies. Sustainability 2020, 12, 6972. [Google Scholar] [CrossRef]
- Tokbolat, S.; Karaca, F.; Durdyev, S.; Calay, R.K. Construction professionals’ perspectives on drivers and barriers of sustainable construction. Environ. Dev. Sustain. 2019, 22, 4361–4378. [Google Scholar] [CrossRef]
- Carter, C.R.; Washispack, S. Mapping the Path Forward for Sustainable Supply Chain Management: A Review of Reviews. J. Bus. Logist. 2018, 39, 242–247. [Google Scholar] [CrossRef]
- Zingbagba, M.; Nunes, R.; Fadairo, M. The impact of diesel price on upstream and downstream food prices: Evidence from São Paulo. Energy Econ. 2020, 85, 104531. [Google Scholar] [CrossRef]
- Schniederjans, D.G.; Curado, C.; Khalajhedayati, M. Supply chain digitisation trends: An integration of knowledge management. Int. J. Prod. Econ. 2020, 220, 107439. [Google Scholar] [CrossRef]
- Nimsai, S.; Yoopetch, C.; Lai, P.-L. Mapping the Knowledge Base of Sustainable Supply Chain Management: A Bibliometric Literature Review. Sustainability 2020, 12, 7348. [Google Scholar] [CrossRef]
- Ebinger, F.; Omondi, B. Leveraging Digital Approaches for Transparency in Sustainable Supply Chains: A Conceptual Paper. Sustainability 2020, 12, 6129. [Google Scholar] [CrossRef]
- Cantelmi, R.; Di Gravio, G.; Patriarca, R. Learning from Incidents: A Supply Chain Management Perspective in Military Environments. Sustainability 2020, 12, 5750. [Google Scholar] [CrossRef]
- Muhammad, N.; Gang, F.Z.; Shah, S.A.A.; Akbar, M.A.; AlSanad, A.; Gumaei, A.; Solangi, Y.A. A Hybrid Multi-Criteria Approach for Evaluation and Selection of Sustainable Suppliers in the Avionics Industry of Pakistan. Sustainability 2020, 12, 4744. [Google Scholar] [CrossRef]
- Luthra, S.; Govindan, K.; Kannan, D.; Mangla, S.K.; Garg, C.P. An integrated framework for sustainable supplier selection and evaluation in supply chains. J. Clean. Prod. 2017, 140, 1686–1698. [Google Scholar] [CrossRef]
- Memari, A.; Dargi, A.; Jokar, M.R.A.; Ahmad, R.; Rahim, A.R.A. Sustainable supplier selection: A multi-criteria intuitionistic fuzzy TOPSIS method. J. Manuf. Syst. 2019, 50, 9–24. [Google Scholar] [CrossRef]
- Hendiani, S.; Bagherpour, M. Development of sustainability index using Z-numbers: A new possibilistic hierarchical model in the context of Z-information. Environ. Dev. Sustain. 2020, 22, 6077–6109. [Google Scholar] [CrossRef]
- Guo, S.; Zhao, H. Fuzzy best-worst multi-criteria decision-making method and its applications. Knowl. Based Syst. 2017, 121, 23–31. [Google Scholar] [CrossRef]
- Mahdiyar, A.; Mohandes, S.R.; Durdyev, S.; Tabatabaee, S.; Ismail, S. Barriers to green roof installation: An integrated fuzzy-based MCDM approach. J. Clean. Prod. 2020, 269, 122365. [Google Scholar] [CrossRef]
- Ghoushchi, S.J.; Khazaeili, M.; Amini, A.; Osgooei, E. Multi-criteria sustainable supplier selection using piecewise linear value function and fuzzy best-worst method. J. Intell. Fuzzy Syst. 2019, 37, 2309–2325. [Google Scholar] [CrossRef]
- Amindoust, A.; Saghafinia, A. Textile supplier selection in sustainable supply chain using a modular fuzzy inference system model. J. Text. Inst. 2016, 108, 1–9. [Google Scholar] [CrossRef]
- Ghadimi, P.; Dargi, A.; Heavey, C. Sustainable supplier performance scoring using audition check-list based fuzzy inference system: A case application in automotive spare part industry. Comput. Ind. Eng. 2017, 105, 12–27. [Google Scholar] [CrossRef]
- Pourjavad, E.; Shahin, A. The Application of Mamdani Fuzzy Inference System in Evaluating Green Supply Chain Management Performance. Int. J. Fuzzy Syst. 2018, 20, 901–912. [Google Scholar] [CrossRef]
- Jain, N.; Singh, A. Sustainable supplier selection under must-be criteria through Fuzzy inference system. J. Clean. Prod. 2020, 248, 119275. [Google Scholar] [CrossRef]
- Rezaei, J. Best-worst multi-criteria decision-making method. Omega 2015, 53, 49–57. [Google Scholar] [CrossRef]
- Hendiani, S.; Mahmoudi, A.; Liao, H. A multi-stage multi-criteria hierarchical decision-making approach for sustainable supplier selection. Appl. Soft Comput. 2020, 94, 106456. [Google Scholar] [CrossRef]
- Ecer, F.; Pamučar, D. Sustainable supplier selection: A novel integrated fuzzy best worst method (F-BWM) and fuzzy CoCoSo with Bonferroni (CoCoSo’B) multi-criteria model. J. Clean. Prod. 2020, 266, 121981. [Google Scholar] [CrossRef]
- Amiri, M.; Hashemi-Tabatabaei, M.; Ghahremanloo, M.; Keshavarz-Ghorabaee, M.; Zavadskas, E.; Banaitis, A. A new fuzzy BWM approach for evaluating and selecting a sustainable supplier in supply chain management. Int. J. Sustain. Dev. World Ecol. 2020, 1–18. [Google Scholar] [CrossRef]
- Jain, N.; Singh, A.; Upadhyay, R.K. Sustainable supplier selection under attractive criteria through FIS and integrated fuzzy MCDM techniques. Int. J. Sustain. Eng. 2020, 13, 441–462. [Google Scholar] [CrossRef]
- Pérez-Velázquez, A.; Oro-Carralero, L.L.; Rodríguez, J.L.M. Supplier Selection for Photovoltaic Module Installation Utilizing Fuzzy Inference and the VIKOR Method: A Green Approach. Sustainability 2020, 12, 2242. [Google Scholar] [CrossRef]
- Amindoust, A. A resilient-sustainable based supplier selection model using a hybrid intelligent method. Comput. Ind. Eng. 2018, 126, 122–135. [Google Scholar] [CrossRef]
- Paunović, M.; Ralević, N.; Milutinović, O.; Vojinović, Ž.; Mladenović-Vojinović, B. Integrated Fuzzy System and Multi-Expression Programming Techniques for Supplier Selection. Teh. Vjesn. Tech. Gaz. 2019, 26, 122–127. [Google Scholar] [CrossRef]
- Fallahpour, A.; Olugu, E.U.; Musa, S.N.; Wong, K.Y.; Noori, S. A decision support model for sustainable supplier selection in sustainable supply chain management. Comput. Ind. Eng. 2017, 105, 391–410. [Google Scholar] [CrossRef]
- Durmić, E. The Evaluation of the Criteria for Sustainable Supplier Selection by Using the FUCOM Method. Oper. Res. Eng. Sci. Theory Appl. 2019, 2, 91–107. [Google Scholar] [CrossRef]
- Stević, Ž.; Pamučar, D.; Puška, A.; Chatterjee, P. Sustainable supplier selection in healthcare industries using a new MCDM method: Measurement of alternatives and ranking according to COmpromise solution (MARCOS). Comput. Ind. Eng. 2020, 140, 106231. [Google Scholar] [CrossRef]
- Song, W.; Xu, Z.; Liu, H.-C. Developing sustainable supplier selection criteria for solar air-conditioner manufacturer: An integrated approach. Renew. Sustain. Energy Rev. 2017, 79, 1461–1471. [Google Scholar] [CrossRef]
- Fallahpour, A.; Wong, K.Y.; Rajoo, S.; Olugu, E.U.; Nilashi, M.; Turskis, Z. A FUZZY DECISION SUPPORT SYSTEM FOR SUSTAINABLE CONSTRUCTION PROJECT SELECTION: AN INTEGRATED FPP-FIS MODEL. J. Civ. Eng. Manag. 2020, 26, 247–258. [Google Scholar] [CrossRef]
- Chen, S.H.; Hsieh, C.H. Optimization of fuzzy simple inventory models. In Proceedings of the FUZZ-IEEE’99. 1999 IEEE International Fuzzy Systems. Conference Proceedings (Cat. No.99CH36315), Seoul, Korea, 22–25 August 1999. [Google Scholar]
- Singh, S.; Olugu, E.U.; Musa, S.N.; Mahat, A.B. Fuzzy-based sustainability evaluation method for manufacturing SMEs using balanced scorecard framework. J. Intell. Manuf. 2018, 29, 1–18. [Google Scholar] [CrossRef]
Publisher’s Note: MDPI stays neutral with regard to jurisdictional claims in published maps and institutional affiliations. |
© 2021 by the authors. Licensee MDPI, Basel, Switzerland. This article is an open access article distributed under the terms and conditions of the Creative Commons Attribution (CC BY) license (http://creativecommons.org/licenses/by/4.0/).