Abstract
In order to explore the modification effect of carbonization time on nano-MgO-modified cement soil, unconfined compressive strength tests of nano-MgO-modified cement soil with carbonization times of 0 h, 6 h, 1 d, 2 d and 4 d were carried out. A method for normalizing the stress–strain curve was proposed, and the influence of nano-MgO content and carbonization time was investigated from the three aspects of compressive strength, peak strain and energy dissipation. The test results show the following: (1) The compressive strength of the modified cement soil can be significantly improved by adding 1.0% nano-MgO and after 1 d carbonization. (2) Under the same nano-MgO content, the peak strain of the modified cement soil after 2 d carbonization reaches the maximum, which can significantly increase its ductility. However, the nano-MgO content has little influence on the peak strain of the modified cement soil. (3) Under the same nano-MgO content, the energy dissipation rate of the modified cement soil after 1 d carbonization reaches the maximum, which can better resist the damage of external load.
1. Introduction
Nowadays, with the rapid development of infrastructure construction, there are fewer land resources available. In the process of building construction, soft soil foundations with lower strength are often encountered. Cement and lime [1,2,3,4] are often used to improve the bearing capacity of soft soil foundations to make them meet the needs of different engineering fields, such as highways, slopes and residential construction [5,6]. However, soft soil has many undesirable engineering properties, such as high compressibility and high porosity and obvious thixotropy and creep properties [7], which require a large amount of cement to solidify the soft soil foundation. Moreover, CO2 produced by cement production accounts for 5–7% of the total amount of human-generated CO2 [8]. Therefore, in order to reduce the dosage of cement and CO2 emissions, many scholars have found suitable materials and methods to further improve cement soil on the basis of adding new engineering materials as a curing agent [9,10,11,12].
Nanomaterials are widely used in the field of construction engineering due to their characteristics of small particle size, large surface area and good stability. Commonly used nanomaterials are nano-SiO2 [13,14,15], nano-clay [16,17,18] and nano-MgO. Among them, nano-MgO is mainly made by sintering magnesite at 700 °C, while the temperature of cement in the production process is above 1450 °C [19]. Therefore, using nano-MgO to replace part of cement can also reduce energy consumption [20]. Gao et al. [21,22] explored through tests that 6% nano-MgO content could significantly increase the compressive strength and stability of clay, and better improve the shear strength and cohesion of the modified cement soil. However, it had little influence on the internal friction angle. Moradpour et al. [23] found that the compressive strength and flexural strength of cement-based materials was significantly improved with 1.0% nano-MgO content. In addition, nano-MgO had expansibility, and the microstructure of nano-MgO-modified cement-based materials was denser than the ordinary cement-based materials. Wang et al. [24] found that under the erosion of sulfuric acid solution, the shear strength of modified cement soil reached the maximum with 0.5% nano-MgO content. Yao et al. [25,26] investigated through unconfined tests that the addition of nano-MgO could better improve the strength of cement soil. Moreover, the cohesion of modified cement soil reached the maximum, with the 1.0% nano MgO content, and the internal microstructure was more compact. Yuan et al. [27] and Hou et al. [28] found that the addition of nano-MgO would form a large amount of fluffy and acicular aluminate hydration products inside the cement paste, which could effectively fill the larger pores inside the cement paste and improve the stability of the structure.
As CO2 will lead to the corrosion of steel bars, research mainly focuses on the prevention and control measures of the carbonation of concrete [29,30,31]. However, the corrosion of steel bars is not considered in solidified soft soil, so CO2 can be injected into solidified soft soil to improve its engineering performance. Moreover, CO2 could react with hydration products to consume CO2 and reduce greenhouse gas emission. Yi et al. [32] found that after carbonization, the unconfined compressive strength of solidified soil with 5% MgO content was about 200% of that of ordinary cement solidified soil. However, with 10% MgO content, the increase in strength decreased. Cai et al. [33] found that with the increase in carbonization time, the number of cracks on the surface of MgO solidified sand gradually increased. Vandeperre et al. [34] found that MgO generated rankinite after carbonization, which had a larger volume expansion rate and could fill the pores of the mixture, so as to improve the strength and toughness of the mixture. Mo et al. [35] found that under the action of carbonization, the pore size and porosity of MgO-modified cement paste decreased, while the apparent density and microscopic density increased.
In sum, the research on the mechanical properties of nano-MgO-modified cement soil has been gradually carried out. However, there are few studies on the mechanical properties of the modified cement soil by carbonization, which requires further exploration. In this paper, on the basis of cement soil with 20% mass fraction of cement, the unconfined compressive strength tests were carried out on the modified cement soil with different nano-MgO contents and carbonized times. From the angle of strength and ductility, the influence of carbonization time on the mechanical properties of the nano-MgO-modified cement soil was investigated.
2. Test Materials and Preparation
2.1. Materials
The materials used throughout the experimental tests include subgrade soil, water, cement and nano-MgO. The subgrade soil was collected from a coastal area in Shaoxing city of Zhejiang province, China. The main physical and mechanical indexes are shown in Table 1. Guyue brand P.C 42.5 composite Portland cement produced by Shaoxing Keqiao Third Cement Co., Ltd. (Shaoxing City, China) was used as shown in Figure 1a, and the main physical and mechanical parameters are shown in Table 2. The nano-MgO was a 50 nm spherical MgO produced by Shanghai Macklin Biochemical Technology Co., Ltd (Shanghai City, China). The appearance was white to light yellow powder, as shown in Figure 1b, and its physical and mechanical properties are shown in Table 3.

Table 1.
The physical indexes of subgrade soil in coastal area of Shaoxing.
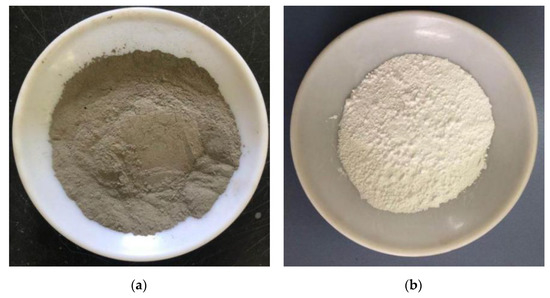
Figure 1.
Physical picture of cement and nano MgO. (a) Composite Portland cement; (b) nano-MgO.
Table 2.
The physical and mechanical parameters of P.C 42.5 cement.
Table 3.
The physical and mechanical parameters of nano MgO.
2.2. Test Program
The samples were divided into 25 groups according to different nano-MgO contents and carbonization times, and the mix proportion of each group of materials is shown in Table 4. MCS represents nano-MgO-modified cement soil. Unconfined compressive strength tests were carried out on 25 groups of MCS. In order to reduce the random error and the discreteness of the test data in the test process, five repeated tests were performed on each group of samples.
Table 4.
The sample mix proportion and carbonation time design.
2.3. Sample Preparation
- (1)
- Soil sample preparation. The subgrade soil was soaked in water for 7 days until it was softened and turned into silt. Next, large particles, stones or other impurities were removed from the subgrade soil through a sieve with a diameter of 2 mm.
- (2)
- Determination of the moisture content. The subgrade soil was stirred evenly and stood for 2–3 weeks. Then, a small amount of subgrade soil was taken out to measure its moisture content.
- (3)
- Sample mixing. Appropriate amounts of subgrade soil, cement and nano-MgO were weighed according to the experimental mix proportion, and placed into a mixer and stirred for 5 min.
- (4)
- Unconfined sample preparation. The prepared mixture was poured into a cylindrical mold with a diameter of 39.1 mm and a height of 80 mm three times. Each time the mixture was poured, it was vibrated. The sample was left to stand for 2 h after completion, and the upper and lower surfaces of the samples were flattened with a scraper, wrapped with filter paper and placed into water for curing.
- (5)
- Sample curing. The moisture content of the sample was high, so it was difficult to form; therefore, it needed to soak in water for 3 days before demolding. Then, it was placed into a standard curing box or carbonization curing box to continue curing. The curing methods and conditions are shown in Figure 2 and Table 5, and the soaking and carbonization curing are shown in Figure 3a,b, respectively.
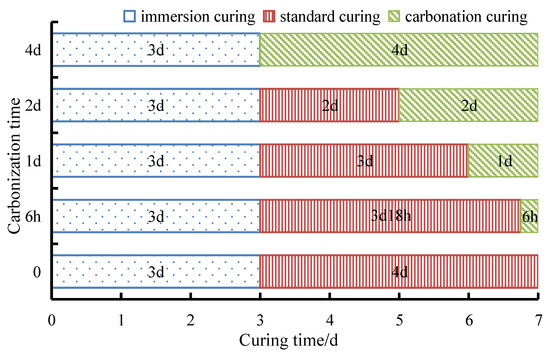 Figure 2. The relationship between carbonation time and curing age.
Table 5. The maintenance conditions.
Figure 2. The relationship between carbonation time and curing age.
Table 5. The maintenance conditions.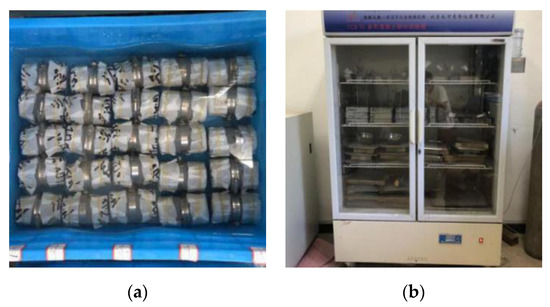 Figure 3. Maintenance method. (a) Immersion curing; (b) carbonization curing.
2.4. Mechanical Test
TKA-WXY-1F automatic unconfined pressure gauge produced by Nanjing TKA Technology Co., Ltd. was used in the unconfined compressive strength test. The loading rate was set to 1 mm/min during the test. According to the GB/T 50123-2019 Geotechnical Test Standard, when the axial force reaches its peak value, the test can be stopped by performing another 3–5% axial strain value. In this paper, the test was stopped when the axial strain of uncarburized MCS reached 10%. The test was stopped when the axial strain of carburized MCS reached 12%.
3. Unconfined Data Analysis
3.1. Stress–strain Curve Analysis
The stress–strain curves of MCS with different nano-MgO contents and carbonization times are shown in Figure 4, Figure 5, Figure 6, Figure 7 and Figure 8. It can be seen from the figures that the stress–strain curves of MCS are all softening curves. At the initial stage of loading, the stress of MCS increases linearly with the increase in strain. As the strain continued to increase, the upward trend of stress gradually slowed down, and finally, the stress reaches the peak value. At this point, the strain corresponding to the peak stress is the peak strain of the sample. When the peak strain occurs, the sample will be destroyed and inclined cracks will appear, and the force on the sensor will drop sharply, so the stress attenuation rate will increase. With the increase in strain, the sample will be compressed, and the friction force will be generated at the inclined cracks, so the stress attenuation rate will decrease. With the continuous increase in strain, the sample will be further compressed, and the force on the sensor will not change.
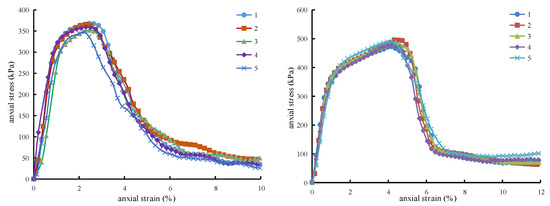
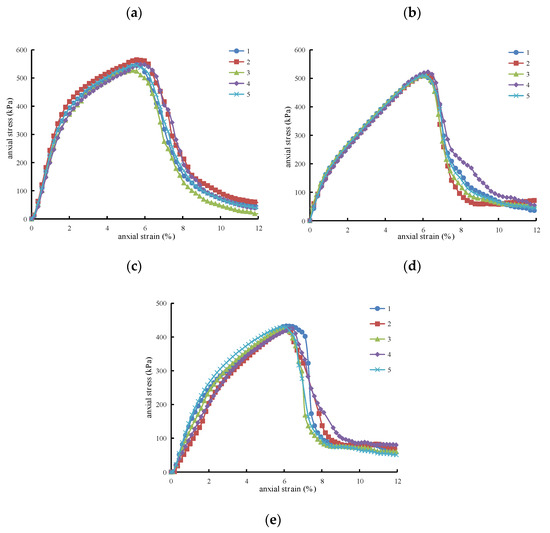
Figure 4.
The stress–strain curve of MCS with 0% nano-MgO content. (a) Carbonization 0 d; (b) carbonization 6 h; (c) carbonization 1 d; (d) carbonization 2 d; (e) carbonization 4 d.
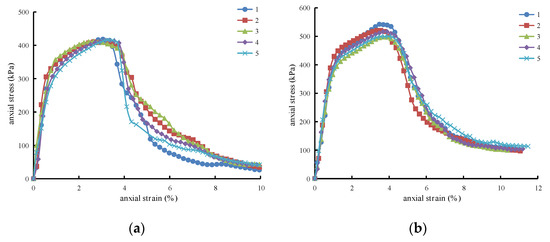
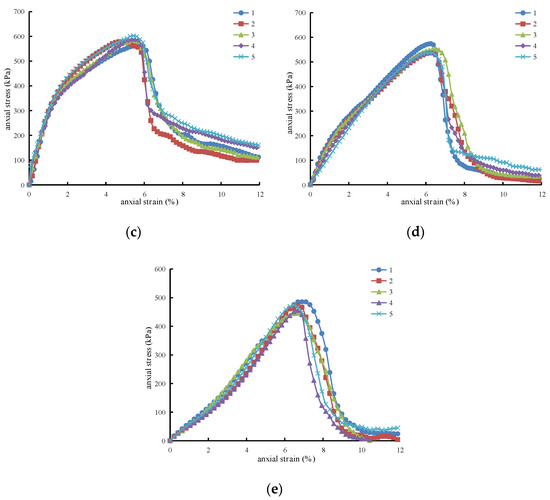
Figure 5.
The stress–strain curve of MCS with 0.5% nano-MgO content. (a) Carbonization 0 d; (b) carbonization 6 h; (c) carbonization 1 d; (d) carbonization 2 d; (e) carbonization 4 d.
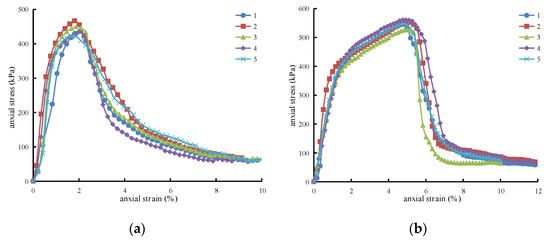
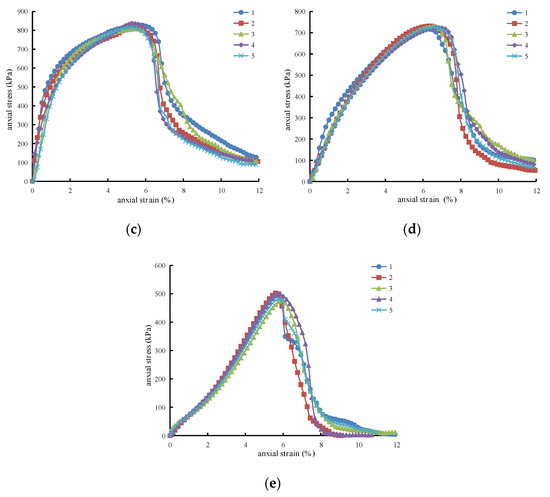
Figure 6.
The stress–strain curve of MCS with 1.0% nano-MgO content. (a) Carbonization 0 d; (b) carbonization 6 h; (c) carbonization 1 d; (d) carbonization 2 d; (e) carbonization 4 d.
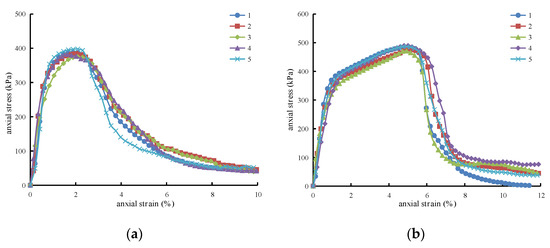
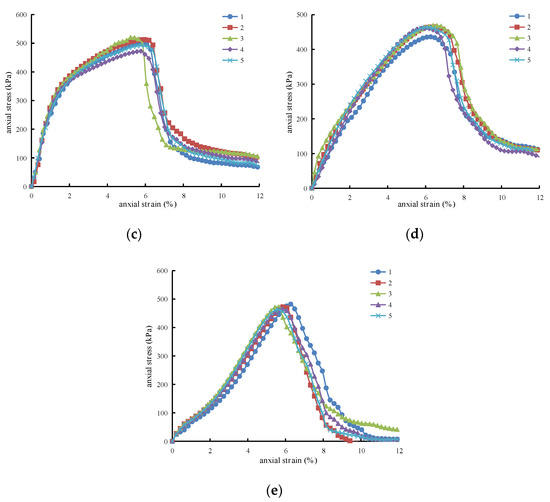
Figure 7.
The stress–strain curve of MCS with 1.5% nano-MgO content. (a) Carbonization 0 d; (b) carbonization 6 h; (c) carbonization 1 d; (d) carbonization 2 d; (e) carbonization 4 d.
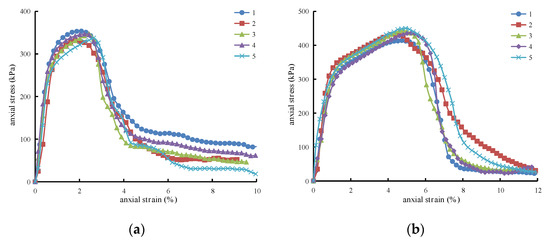
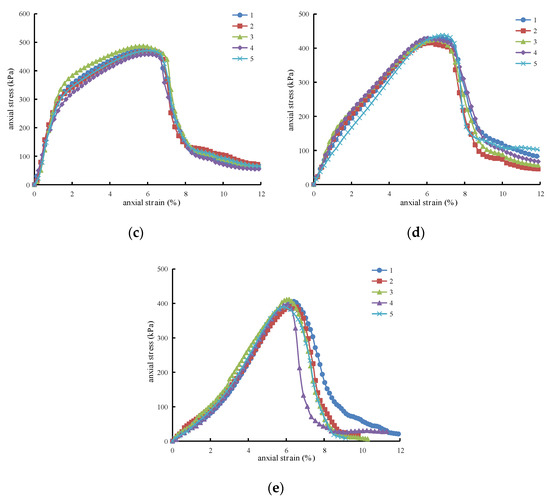
Figure 8.
The stress–strain curve of MCS with 2.0% nano-MgO content. (a) Carbonization 0 d; (b) carbonization 6 h; (c) carbonization 1 d; (d) carbonization 2 d; (e) carbonization 4 d.
3.2. Curve Normalization
During the test, five repeated tests were conducted for all the tests designed in Table 4 to reduce the test error. The results of five repeated samples are different, so obtaining a reasonable standard value from these five results is particularly critical. In this paper, the deviation of five peak stresses were taken as the research object, and the weight of each peak stress was calculated. Then, the weight of each peak stress was taken as the weight of this curve, and the five curves were further normalized to one curve. The normalization method is as follows:
- Determination of the average value of peak stress? .where σi is the peak stress of each stress–strain curve of the sample, and N is the number of repeated tests in this group of samples. In this study, there were five repeated tests in each group, so N = 5, and i is the serial number of the data in the sample.
- Determination of the deviation Δσi of each peak stress.
- Determination of the variance S of the peak stress.
- Determination of the initial weight pi of each peak stress. In order to ensure that the initial weight is between [0,1], the maximum value Δσimax of peak stress deviation is introduced to calculate the initial weight of each peak stress.
- Determination of the weight mapping function f(x). In the above equations, the greater the deviation of the peak value is, the greater the weight of the peak stress is. Therefore, it is necessary to assign the weight of peak stress, so that the larger the deviation of the peak stress is, the smaller the weight after assignment is. The mapping function is shown in Equation (5). As the function decreases monotonously, the greater the Δσi is, the smaller the weight after conversion is.
- Determination of the converted weight mi of each peak stress.
- Determination of the weighting factor ni of each peak stress.
- Determination of the standard value σ of peak stress.
Five curves of MCS with 1.0% nano-MgO after 6 h carbonization were taken as examples and weighted by the above methods. Five test curves and the weighted curves are shown in Figure 9. It can be seen from the figure that the normalized curve has a good correlation with the original five test curves.
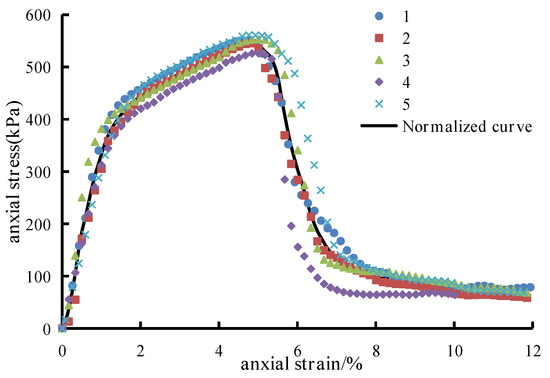
Figure 9.
Weighted curve of MCS with 1.0% nano-MgO content after 6 h carbonization.
Five stress–strain curves of MCS with different nano MgO contents and carbonization times were normalized by the above method. The normalized curve is shown in Figure 10.
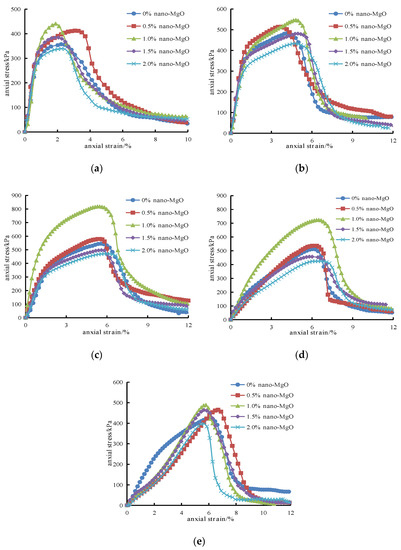
Figure 10.
The Normalized stress–strain curves of MCS. (a) Carbonization 0 d; (b) carbonization 6 h; (c) carbonization 1 d; (d) carbonization 2 d; (e) carbonization 4 d.
4. Discussion
4.1. The Influence of Nano-MgO Content
The maximum value of the normalization curve of each group of samples is taken as the peak stress of each group of samples. The compressive strength of MCS with different nano-MgO contents is shown in Figure 11. It can be seen from the figure that under the same carbonization time, the compressive strength of MCS increases first and then decreases with the increase in nano-MgO content. When the nano-MgO content is 1.0%, the compressive strength of MCS reaches the maximum. When the carbonization time is 0 h, 6 h, 1 d, 2 d and 4 d, the compressive strength is 440.69 Pa, 547.33 kPa, 818.25 kPa, 724.10 kPa and 489.18 kPa, respectively, which is 23.3%, 13.3%, 50.2%, 41.5% and 15.1% higher than that of cement soil without nano-MgO.
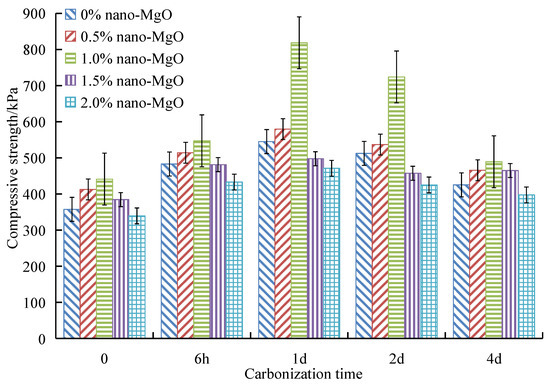
Figure 11.
The influence of different nano-MgO contents on the compressive strength of MCS.
This is mainly because when the nano-MgO content is between 0% and 1.0%, cement and nano-MgO generate carbonate precipitation after hydration and carbonization, and the volume increases and gradually fills the pores inside MCS. As a result, the internal structure of the soil is denser. However, with the increase in nano-MgO content, the reaction generates excessive carbonate precipitation, and the volume expansion exceeds the volume of the pores inside MCS [25,36], which gradually compresses the surrounding soil, resulting in the failure of cementation between soil particles. Microcracks appear inside MCS, and the compressive strength decreases.
4.2. The Influence of Carbonization Time
The influence of different carbonization times on the compressive strength of MCS is shown in Figure 12. It can be seen from the figure that the compressive strength of MCS with the same nano-MgO content increases first and then decreases with the increase in carbonization time, so there is an optimal carbonization time. Under the five nano-MgO contents, the optimal carbonization time is 1 d. At this time, the compressive strength of MCS is 544.92 kPa, 579.36 kPa, 818.25 kPa, 497.55 kPa and 470.92 kPa, respectively, which is 52.5%, 40.5%, 85.7%, 29.5% and 38.8% higher than that of non-carbonized MCS. When the carbonization time is 4 d, the compressive strength of MCS under five nano-MgO contents is 425.01 kPa, 465.68 kPa, 489.18 kPa, 461.74 kPa and 397.26 kPa, respectively, which is still 18.9%, 12.9%, 11.0%, 20.2% and 17.08% higher than that of non-carbonized MCS.
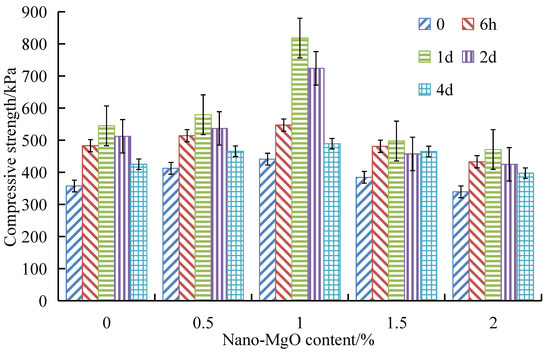
Figure 12.
The influence of carbonization time on the compressive strength of MCS.
The mechanism of action is similar to the influence of nano-MgO content. When the carbonization time is short, the carbonate precipitation formed by carbonization can fill the internal pores. However, as the carbonization time increases, excessive carbonate precipitation causes cracks inside MCS, leading to a decrease in the compressive strength.
5. Ductility and Energy Dissipation Analysis
5.1. Curve Simplification
According to the change trend of the normalized stress–strain curve, the stress–strain curve of MCS can be divided into four stages, as shown in Figure 13:
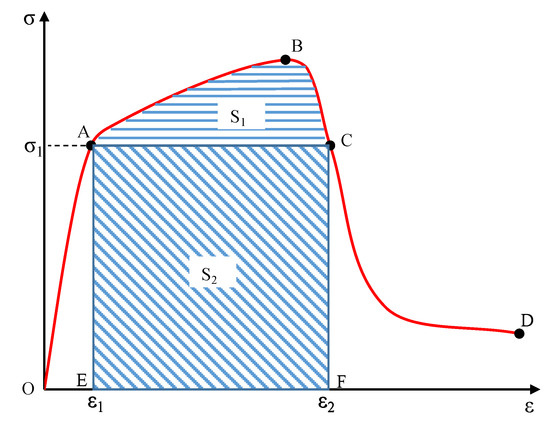
Figure 13.
The change trend of stress–strain curve.
- (1)
- Elastic stage (OA section). At this stage, the pores inside the sample are compressed, the volume is reduced, and there are no cracks on the surface (Figure 14a). The contact between the soil particles is closer, and the structure becomes stronger. The stress increases linearly with the increase in strain and reaches the stress corresponding to strengthening point A.
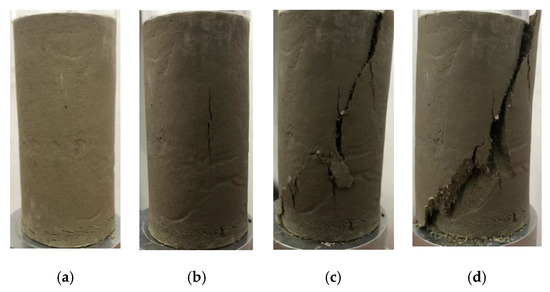 Figure 14. Failure mode. (a) OA section; (b) AB section; (c) BC section; (d) CD section.
 - (2)
- Strengthening stage (AB section). As the axial load increases, the sample undergoes plastic deformation, and small cracks appear on the surface (Figure 14b). At this stage, the stress growth trend of the sample slows down and gradually reaches the stress corresponding to the peak point B.
- (3)
- Falling stage (BC section). As the axial load continues to increase, the sample shows uneven plastic deformation, and the cracks on the surface gradually spread expand to the surroundings (Figure 14c). At this stage, as the strain increases, the stress begins to decrease, and the downward trend gradually increases until it drops to the stress at point A, at which point, the stress–strain corresponds to the drop point C.
- (4)
- Failure stage (CD section). As the axial load continues to increase, the cracks on the surface gradually expand to the surroundings and are interconnected to one another to form a penetrating crack, accompanied by soil shedding (Figure 14d). The stress decreases rapidly with the increase in strain, but the downward trend gradually slows down and finally approaches a fixed value. At this time, the point corresponding to the stress and strain is the failure point D.
5.2. Ductility Analysis
The strain at point B of the normalized curve of each group of samples was taken as the peak strain of the group. The influence of different carbonization times on the peak strain of MCS is shown in Figure 15. It can be seen from the figure that when the nano-MgO content is 0 and 0.5%, the peak strain of MCS increases with the increase in carbonization time. However, when the carbonization time increases from 0 to 2 d, the peak strain of MCS increases significantly, and the difference between the peak strain of MCS and the non-carbonized MCS is 3.8% and 3.0%, respectively; when the carbonization time increases from 2 d to 4 d, the peak strain increases by 0.1% and 0.6%, respectively. Therefore, the effect of 2 d carbonization on the peak strain of MCS is more obvious, which can significantly increase the ductility of MCS.
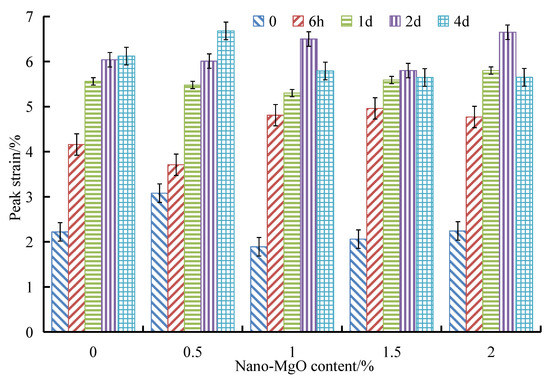
Figure 15.
The influence of carbonation time on the peak strain of MCS.
When the nano-MgO content is 1.0%, 1.5% and 2.0%, the peak strain of MCS first increases and then decreases with the increase in carbonization time. When the carbonization time is 2 d, the peak strain reaches the maximum, which is 6.5%, 6.2% and 6.7%, respectively, and the difference between the peak strain of MCS and non-carbonized MCS is 4.6%, 4.2% and 4.4%, respectively.
When the carbonization time is 0 h, 6 h, 1 d, 2 d and 4 d, the difference between the maximum and minimum peak strains of MCS with different nano-MgO contents is 1.2%, 1.3%, 0.7%, 0.6% and 1.1%, respectively. It can be found that the influence of different nano-MgO contents on the peak strain is far less significant than that of carbonization time.
Therefore, under the same nano-MgO content, 2 d carbonization has the best effect on improving the peak strain of MCS, which can significantly increase the ductility of MCS. Under the same carbonization time, the nano-MgO content has little effect on the peak strain of MCS.
5.3. Energy Dissipation Analysis
During the loading process, energy dissipation leads to the process of the formation of internal cracks. In the elastic stage, there are almost no cracks inside MCS, so the energy storage and release are reversible. In the strengthening stage, damage and cracks occur inside MCS, leading to energy dissipation. The greater the energy dissipation is, the stronger the ability of MCS to resist damage is. Therefore, energy dissipation can be used to measure the ability of MCS to resist damage.
As shown in Figure 13, the area enclosed by ABCFE is the total energy dissipation density S of the sample; the area enclosed by ABC is the enhanced energy dissipation density S1 of the sample; the area enclosed by ACFE is the basic energy dissipation density S2 of the sample. The calculation formula is shown in Equation (9), and the unit is kJ/m3.
σ1 is the stress at point A on the f(x) curve; ε1 and ε2 are the strains at point A and point C on the f(x) curve, respectively. As shown in Figure 10, the normalized curve of each group of samples can be obtained by using the above curve normalization method, so as to better determine the specific location of points A, B, C and D. In order to better measure the degree of energy dissipation of MCS, the ratio of S1 and S is taken as the energy dissipation rate K of MCS to reflect the ability to resist external damage. The larger the K is, the stronger the ability of MCS to resist external damage is. The influence of different carbonization times on the energy dissipation rate of MCS is shown in Figure 16.
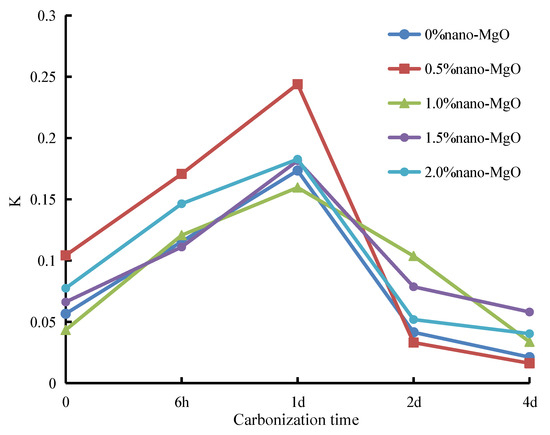
Figure 16.
The influence of carbonization time on the energy dissipation rate of MCS.
It can be seen from Figure 16 that the K of MCS increases first and then decreases with the increase in carbonization time under the same content of nano-MgO. When the carbonization time is 1 d, the K of MCS with five nano-MgO content reaches the maximum, which is 0.17, 0.24, 0.16, 0.18 and 0.18, respectively. This is much higher than that of non-carbonized MCS. Therefore, under five nano-MgO contents, the MCS after 1 d carbonization can better resist external damage.
When the carbonization time is 0 h, 6 h and 1 d, the K of MCS with 0.5% nano-MgO content is the largest, which is 0.10, 0.17 and 0.24, respectively. When the carbonization time is 2 d, the K of MCS with 1.0% nano-MgO content reaches the maximum value, 0.10. When the carbonization time is 4 d, the K of MCS under five nano-MgO contents is 0.02, 0.02, 0.03, 0.05 and 0.04, respectively, and the range of change is small. Therefore, when the carbonization time is 4 d, different nano-MgO contents have no significant influence on the K of MCS.
In summary, MCS with 0.5% nano-MgO content has the largest energy dissipation rate after 1 d carbonization, which is much greater than the other MCS with other nano-MgO contents and after other carbonization times. This indicates that MCS with 0.5% nano-MgO content can better resist external damage after 1 d carbonization.
6. Conclusions and Discussion
6.1. Conclusions
Through the unconfined compressive strength tests, the influence of different nano-MgO contents and carbonization times on MCS was explored from the three aspects of compressive strength, peak strain and energy dissipation. The following conclusions can be drawn:
- (1)
- A method for normalizing the stress–strain curve was proposed, and the normalized curve had a good correlation with the five stress–strain curves obtained through the tests.
- (2)
- Under the same carbonization time, the compressive strength of MCS first increases and then decreases with the increase in nano-MgO content. When the nano-MgO content is 1.0%, the compressive strength of MCS reaches the maximum, which is 23.4%, 13.3%, 50.2%, 41.4% and 15.0% higher than that of cement soil without nano-MgO. Under the same nano-MgO content, the compressive strength of MCS first increases and then decreases with the increase in carbonization time under five nano-MgO contents. Therefore, when the nano-MgO content is 1.0%, the compressive strength of MCS after 1 d carbonization reaches the maximum.
- (3)
- When the nano-MgO content is 0% and 0.5%, the peak strain of MCS increases with the increase in carbonization time. When the carbonization time increases from 2 d to 4 d, the increase in peak strain is smaller, so the modification effect of 2 d carbonization is optimal. When the nano-MgO content is 1.0%, 1.5% and 2.0%, the peak strain of MCS first increases and then decreases with the increase in carbonization time. When the carbonization time is 2 d, the peak strain reaches the maximum. Therefore, under five nano-MgO contents, 2 d carbonization can significantly increase the peak strain of MCS and its ductility. However, the nano-MgO content has little influence on the peak strain of MCS.
- (4)
- Under the same nano-MgO content, the energy dissipation rate of MCS first increases and then decreases with the increase in carbonization time. When the carbonization time is 1 d, the energy dissipation rate of MCS reaches the maximum under five nano-MgO contents, which can better resist the damage of external load. However, when the carbonization time is 4 d, the energy dissipation rate of MCS is the smallest, and different nano-MgO contents have almost no effect on the energy dissipation rate.
6.2. Discussion
- (1)
- In this paper, the CO2 concentration during the carbonization process is 20% ± 3%, and the influence of CO2 concentration on MCS is not considered.
- (2)
- During the curing process, the samples were carbonized in the later period of the curing, and the effect of carbonization at the early and middle stages of the curing on the test results was not explored in depth.
Author Contributions
Conceptualization, B.Q. and P.J.; formal analysis, F.T. and C.L.; investigation, H.Z. and J.L.; writing—review and editing, W.W. All authors have read and agreed to the published version of the manuscript.
Funding
This research was funded by the National Natural Science Foundation of China (grant number 41772311), the Scientific Research Projects of Zhejiang Department of Housing and Urban and Rural Construction of China (grant number 2017K179, 2019K171) and the International Scientific and Technological Cooperation Projects of Shaoxing University (grant number 2019LGGH1007).
Institutional Review Board Statement
Not applicable.
Informed Consent Statement
Not applicable.
Data Availability Statement
The data presented in this study are available on request from the corresponding author.
Conflicts of Interest
The authors declare no conflict of interest.
References
- Liu, Y.; He, L.Q.; Jiang, Y.J.; Sun, M.M.; Chen, E.J.; Lee, F.-H. Effect of in situ water content variation on the spatial variation of strength of deep cement-mixed clay. Géotechnique 2019, 69, 391–405. [Google Scholar] [CrossRef]
- Federico, A.; Vitone, C.; Murianni, A. On the mechanical behaviour of dredged submarine clayey sediments stabilized with lime or cement. Can. Geotech. J. 2015, 52, 2030–2040. [Google Scholar] [CrossRef]
- Wang, W.; Li, J.; Hu, J. Unconfined Mechanical Properties of Nanoclay Cement Compound Modified Calcareous Sand of the South China Sea. Adv. Civ. Eng. 2020, 2020, 1–16. [Google Scholar] [CrossRef]
- Jha, A.K.; Sivapullaiah, P. Susceptibility of strength development by lime in gypsiferous soil—A micro mechanistic study. Appl. Clay Sci. 2015, 115, 39–50. [Google Scholar] [CrossRef]
- Xu, B.; Low, B.K. Probabilistic Stability Analyses of Embankments Based on Finite-Element Method. J. Geotech. Geoenviron. Eng. 2006, 132, 1444–1454. [Google Scholar] [CrossRef]
- Liu, Y.; Zhang, W.; Zhang, L.; Zhu, Z.; Hu, J.; Wei, H. Probabilistic stability analyses of undrained slopes by 3D random fields and finite element methods. Geosci. Front. 2018, 9, 1657–1664. [Google Scholar] [CrossRef]
- Qiao, F.; Bo, J.; Qi, W.; Wang, L.; Chang, C.; Zhang, Z.; Wang, J. Study on the dynamic characteristics of soft soil. RSC Adv. 2020, 10, 4630–4639. [Google Scholar] [CrossRef]
- Heede, P.V.D.; Belie, N.D. Environmental impact and life cycle assessment (LCA) of traditional and ‘green’ concretes: Liter-ature review and theoretical calculations. Cem. Concr. Compos. 2012, 34, 431–442. [Google Scholar] [CrossRef]
- Lin, D.F.; Luo, H.L.; Hsiao, D.H.; Chen, C.T.; Cai, M.D. Enhancing soft subgrade soil with a sewage sludge ash/cement mixture and nano-silicon dioxide. Environ. Earth Sci. 2016, 75, 619. [Google Scholar] [CrossRef]
- Ghasabkolaei, N.; Janalizadeh, A.; Jahanshahi, M.; Roshan, N.; Ghasemi, S.E. Physical and geotechnical properties of cement-treated clayey soil using silica nanoparticles: An experimental study. Eur. Phys. J. Plus 2016, 131, 134. [Google Scholar] [CrossRef]
- Jongpradist, P.; Jumlongrach, N.; Youwai, S.; Chucheepsakul, S. Influence of Fly Ash on Unconfined Compressive Strength of Cement-Admixed Clay at High Water Content. J. Mater. Civ. Eng. 2010, 22, 49–58. [Google Scholar] [CrossRef]
- Kong, D.; Du, X.; Wei, S.; Zhang, H.; Yang, Y.; Shah, S.P. Influence of nano-silica agglomeration on microstructure and properties of the hardened cement-based materials. Constr. Build. Mater. 2012, 37, 707–715. [Google Scholar] [CrossRef]
- Mao, J.; Wu, Q.; Tao, F.; Xu, W.; Hong, T.; Dong, Y. Facile fabrication of porous BiVO4hollow spheres with improved visible-light photocatalytic properties. RSC Adv. 2020, 10, 6395–6404. [Google Scholar] [CrossRef]
- Land, G.; Stephan, D. The influence of nano-silica on the hydration of ordinary Portland cement. J. Mater. Sci. 2012, 47, 1011–1017. [Google Scholar] [CrossRef]
- Hou, P.; Qian, J.; Cheng, X.; Shah, S.P. Effects of the pozzolanic reactivity of nano SiO2 on cement-based materials. Cem. Concr. Compos. 2015, 55, 250–258. [Google Scholar] [CrossRef]
- Farzadnia, N.; Abang, A.A.A.; Demirboga, R.; Parvez, A.M. Effect of halloysite nanoclay on mechanical properties, thermal behavior and microstructure of cement mortars. Cem. Concr. Res. 2013, 48, 97–104. [Google Scholar] [CrossRef]
- Wang, W.; Li, J.; Hu, J. Triaxial Mechanical Properties and Micromechanism of Calcareous Sand Modified by Nanoclay and Cement. Geofluids 2021, 2021, 1–9. [Google Scholar] [CrossRef]
- Li, N.; Lv, S.; Wang, W.; Guo, J.; Jiang, P.; Liu, Y. Experimental investigations on the mechanical behavior of iron tailings powder with compound admixture of cement and nano-clay. Constr. Build. Mater. 2020, 254, 119259. [Google Scholar] [CrossRef]
- Meyer, C. The greening of the concrete industry. Cem. Concr. Compos. 2009, 31, 601–605. [Google Scholar] [CrossRef]
- Ruan, S.; Unluer, C. Comparative life cycle assessment of reactive MgO and Portland cement production. J. Clean. Prod. 2016, 137, 258–273. [Google Scholar] [CrossRef]
- Gao, L.; Ren, Z.; Yu, X. Experimental Study of Nanometer Magnesium Oxide-Modified Clay. Soil Mech. Found. Eng. 2015, 52, 218–224. [Google Scholar] [CrossRef]
- Gao, L.; Ren, K.Y.; Ren, Z.; Yu, X.J. Study on the shear property of nano-MgO-modified soil. Mar. Georesour. Geotechnol. 2018, 36, 465–470. [Google Scholar] [CrossRef]
- Moradpour, R.; Taheri-Nassaj, E.; Parhizkar, T.; Ghodsian, M. The effects of nanoscale expansive agents on the mechanical properties of non-shrink cement-based composites: The influence of nano-MgO addition. Compos. Part B 2013, 55, 193–202. [Google Scholar] [CrossRef]
- Wang, W.; Li, Y.; Yao, K.; Li, N.; Zhou, A.; Zhang, C. Strength properties of nano-MgO and cement stabilized coastal silty clay subjected to sulfuric acid attack. Mar. Georesour. Geotechnol. 2020, 38, 1177–1186. [Google Scholar] [CrossRef]
- Yao, K.; Wang, W.; Li, N.; Zhang, C.; Wang, L.X. Investigation on strength and microstructure characteristics of Nano-MgO admixed with cemented soft soil. Constr. Build. Mater. 2019, 206, 160–168. [Google Scholar] [CrossRef]
- Yao, K.; An, D.L.; Wang, W.; Li, N.; Zhang, C.; Zhou, A.Z. Effect of nano-MgO on mechanical performance of cement stabilized silty clay. Mar. Georesour. Geotechnol. 2020, 38, 250–255. [Google Scholar] [CrossRef]
- Yuan, H.W.; Shi, Y.; Xu, Z.Z.; Lu, C.H.; Ni, Y.R.; Lan, X.H. Effect of nano-MgO on thermal and mechanical properties of alu-minate cement composite thermal energy storage materials. Ceram. Int. 2014, 40, 4811–4817. [Google Scholar] [CrossRef]
- Hou, P.K.; Cai, Y.M.; Cheng, X.; Zhang, X.Z. Effects of the hydration reactivity of ultrafine magnesium oxide on cement-based materials. Mag. Concr. Res. 2017, 69, 1135–1145. [Google Scholar] [CrossRef]
- Liu, J.H.; Hou, F.F.; Song, S.M.; Jia, B.Y. Effects of Compressive Strength and Carbonation of HCSA Amount on High Volume Fly Ash Concrete. Adv. Mater. Res. 2011, 261–263, 333–337. [Google Scholar] [CrossRef]
- Cui, H.Z.; Tang, W.C.; Liu, W.; Dong, Z.J.; Xing, F. Experimental study on effects of CO2 concentrations on concrete carbona-tion and diffusion mechanisms. Constr. Build. Mater. 2015, 93, 522–527. [Google Scholar] [CrossRef]
- Yoon, I.-S.; Çopuroğlu, O.; Park, K.-B. Effect of global climatic change on carbonation progress of concrete. Atmos. Environ. 2007, 41, 7274–7285. [Google Scholar] [CrossRef]
- Yi, Y.; Liska, M.; Unluer, C.; Al-Tabbaa, A. Carbonating magnesia for soil stabilization. Can. Geotech. J. 2013, 50, 899–905. [Google Scholar] [CrossRef]
- Cai, G.H.; Liu, S.Y.; Du, Y.J.; Zhang, D.W.; Zheng, X. Strength and deformation characteristics of carbonated reactive magnesia treated silt soil. J. Cent. South Univ. 2015, 22, 1859–1868. [Google Scholar] [CrossRef]
- Vandeperre, L.J.; Al-Tabbaa, A. Accelerated carbonation of reactive MgO cements. Adv. Cem. Res. 2007, 19, 67–79. [Google Scholar] [CrossRef]
- Mo, L.; Panesar, D.K. Effects of accelerated carbonation on the microstructure of Portland cement pastes containing reactive MgO. Cem. Concr. Res. 2012, 42, 769–777. [Google Scholar] [CrossRef]
- Unluer, C.; Al-Tabbaa, A. Impact of hydrated magnesium carbonate additives on the carbonation of reactive MgO cements. Cem. Concr. Res. 2013, 54, 87–97. [Google Scholar] [CrossRef]


Publisher’s Note: MDPI stays neutral with regard to jurisdictional claims in published maps and institutional affiliations. |
© 2021 by the authors. Licensee MDPI, Basel, Switzerland. This article is an open access article distributed under the terms and conditions of the Creative Commons Attribution (CC BY) license (http://creativecommons.org/licenses/by/4.0/).