Article

Integration of a MSF Desalination System with a HDH System for Brine Recovery

1
Interdisciplinary Research Center for Membranes and Water Security, KFUPM, Dhahran 31261, Saudi Arabia
2
Mechanical Engineering Department, KFUPM, Dhahran 31261, Saudi Arabia
*
Author to whom correspondence should be addressed.
Sustainability 2021, 13(6), 3506; https://doi.org/10.3390/su13063506
Submission received: 13 February 2021 / Revised: 13 March 2021 / Accepted: 17 March 2021 / Published: 22 March 2021
(This article belongs to the Special Issue Energy and Water Integration System)

Abstract

:
A hybrid Multi-Stage Flash–Humidification Dehumidification (MSF-HDH) desalination system is investigated for energy recovery from an MSF system. The hybrid MSF-HDH system increases total productivity and performance ratio and reduces brine rejection. Hot condensed steam that leaves the MSF brine heater is used to warm the rejected pretreated brine from MSF to a higher temperature suitable for HDH system operation (about 60 °C). This allows us to increase the product (desalinated water) without additional “external” energy input to the hybrid system. Four different layouts of the integrated MSF-HDH system are presented and compared. The results show that an HDH system can utilize over 66% of an existing MSF brine blowdown, while the hybrid system can achieve a gained output ratio—GOR, water recovery ratio—RR, productivity and freshwater cost of 8.73, 44.86%, 30,549 m3/day and 1.068 $/m3 of freshwater, respectively. Utilizing 66.96% of MSF brine blowdown by the HDH system leads to a daily HDH productivity of about 670 m3 of drinking water, which is enough to support 134,000 persons considering a daily consumption of 5 L of drinking water per person.

1. Introduction

Global water scarcity has become a major concern in many countries since freshwater resources are limited compared to the rising population. Therefore, new sources of fresh and clean water must be found to meet this demand. Brackish water or seawater desalination offers a promising choice for water security, since saline water is the only water source that could be termed as “unrestrained/unlimited” (since over 96% of the world’s water resources is saline water found in the ocean) [1]. The Worldwatch Institute stated that a huge number of the world population will suffer from water drought by 2025 [2]. By 2050, water demand is forecasted to increase to over 60 billion m3 per annum [3]. At present, in many countries, desalination is the key water treatment approach for potable water production. Many desalination processes have been developed, and each year, the global desalination processes consume about 75.2 Terawatt hour (TWh) of energy. Furthermore, the carbon dioxide (CO2) emission from desalination plants is about 76 million tons (Mt) and is expected to increase to 218 Mt per annum by 2040 [3,4,5]. With these environmental and energy issues, water desalination is still the key solution to the problem of water scarcity. Therefore, to minimize these problems, energy efficient and enhanced water production desalination systems are needed. Desalination processes can be classified into two broad categories: membrane based desalination processes and thermal based desalination processes. The major membrane based desalination process is reverse osmosis (RO), while the main thermal desalination processes include Multi-Stage Flash (MSF) desalination and Multi Effect desalination (MED). To improve processes’ performance (including efficiency and productivity), both MED and MSF have been hybridized with several other technologies [6,7]. For instance, MED has been integrated with the adsorption desalination (AD) cycle to improve freshwater water production [8,9]. MED has also been integrated with evaporative crystallization for brine treatment [10]. MED has been energized by thermocline energy from the sea for the green desalination process of low global warming risk [11]. In a similar manner, the MSF process has also been integrated with several other desalination systems in order to enhance its performance. To date, the multi-stage flash desalination process is considered to be one of the major thermal desalination technologies. It is one of the most widely used thermal desalination techniques in many countries, especially in Saudi Arabia and the Arabian Gulf states. Brine Recycle Multistage Flash Desalination (BR–MSF) design is a type of MSF process that consists of three basic sections: a heat addition, a heat rejection and a heat recovery section, with reduced chemical treatment procedure.
The performance of BR–MSF has been investigated by several researchers. For instance, Shaaban [12] proposed and optimized a BR–MSF desalination system driven by an integrated solar combined cycle (ISCC) power plant. The study proposed a two-stage intercooled compressor for the gas turbine unit of the power plant, whose heat drives the MSF desalination plant. The results indicate that with zero thermal energy from the solar field and a top brine temperature (TBT) of 105 °C, the system recorded about 18.5% improvement in the net power output, while net power and distillate of about 126.2 MW and 16,364.2 m3/day, respectively, can be produced by one module of the proposed cycle. The proposed system was also reported to be suitable for the Red Sea or the Mediterranean Sea.
Garg et al. [13] examined the performance of a BR-MSF desalination system driven by a nanofluid-based direct absorption solar collector (DASC). The collector incident flux, solar collector length, solar collector height and volume fraction of the nanoparticle were reported to affect the total dissolved solids (TDS) and gained output ratio (GOR) of the combined system. The GOR of the DASC-MSF system was compared to the parabolic trough collector (PTC-MSF) system, and was 11% higher than PTC-MSF. Exergy analysis was also performed to determine the degree of irreversibility of each component of the system.
El-Ghonemy [14] presented the performance of a BR-MSF desalination plant situated in the Al-Khafji operations plant in Saudi Arabia (KSA). The plant produces about 600,000 gallons of freshwater per day with a total number of 20 distillation stages. The performance of the system was presented for two different operating conditions (case I and case II). In case I, the plant operates at 70% capacity during summer, while in case II, the plant operates at 100% full capacity during winter. The system performance was assessed based on performance ratio (PR) and specific cooling water flowrates. The results revealed a system maximum GOR of 7.8, a ratio of circulation flow rate/distillate flow rate of 12.9 and a concentration ratio of 1.5. For case I and case II, the cooling water flowrate decreases from 47.1% to 20.1%, respectively, at full capacity. Consequently, the pumping power decreases by the same ratio, with a corresponding PR of 7.5 and 7.61.
Harandi et al. [15] applied a genetic algorithm (GA) to optimize the performance of a thermal vapor compression MSF-BR-TVC desalination unit. Four different layouts of MSF-BR-TVC systems were presented. Additional details were provided for the system with a higher performance ratio of 9.9 (double ejectors with a mixing ratio of 2.62 and 2.33 for each ejector). Hot steam, last stage temperature and TBT were found to be the most influential parameters. Single objective GA optimization of the system resulted in a maximum PR of 12.8 with high uneconomical specific area. Double-objective GA optimization using non-dominated sorting genetic algorithm (NSGA II) was further used to produce the Pareto front of two-objective optimization problem. The optimum PR increases from 9.97 to 15.27 when the number of stages increases from 20 to 30.
Choi [16] proposed and provided detailed operating principles of a brine re-utilization MSF desalination system. The proposed brine re-utilization of a few top evaporators can easily be attained in the existing MSF plants by increasing the system piping length. The results revealed that brine re-utilization improves both energy efficiency and freshwater productivity, with a 1.18–2.10% increase in the freshwater distillation rate. Increasing the connecting pipes between 3 and 4 inches decreases the specific thermal energy consumption between 1.90 and 3.35%. On the other hand, Abdel-Nasser and Mabrouk [17] changed the orientation of tube bundle and investigated the impact of the orientation. The investigation was performed on long tube bundle and cross tube bundle orientations. The results revealed that the heat transfer area for the long tube bundle is about 25% lower than that of the cross tube bundle, and recorded about 8% reduction in pumping power. For a large scale system of 100 million gallons per day (MIGD) capacity, the long tube bundle attained a 15% reduction in the total capital investment over the cross tube bundle.
Al-Sofi et al. [18] presented a hybrid desalination plant by combining the BR-MSF process with a nano-filtration (NF) and reverse osmosis (RO) system. The system was reported to be capable of elevating TBT from 120 °C to 160 °C and increasing the yield output by about 46%, which is equivalent to 1.15% for every 1 °C rise in the evaporation range. Hamed et al. [19] conducted a comparative study on energy and exergy analysis of different MSF plants. They collected and analyzed data of the design and operating variables of various Saline Water Conversion Corporation (SWCC) MSF plants in KSA. The impact of the design and operating parameters such as the TBT and the number of flashing stages is highlighted. They indicated that most of the exergy destruction is found in the brine heater. The study also revealed that increasing the number of stages increases the plant second law efficiency.
Compared to once through MSF (OT-MSF), BR-MSF reduces the amount of chemical treatment for the incoming seawater, and also ensures better utilization of seawater in producing fresh water with reduced brine blowdown. However, both OT-MSF and BR-MSF processes still discharge a large volume of brine downstream to the sea from the heat rejection section, which may pose threats to the immediate marine habitats near the discharge point. The discharged volume of the highly saline MSF brine blowdown can be minimized by further recovering its freshwater through a system that is not affected by high salinity and can be driven by renewable energy or waste energy, such as the condensate leaving the MSF brine heater. One of the appropriate candidates for this task is a humidification dehumidification (HDH) desalination system. The HDH process has a simple design and can treat extremely high saline water without biological fouling or sediment. Although a massive amount of research is available in the literature on the investigation and development of the HDH process and technology, the possibility of hybridizing an HDH system with the MSF process is missing in the open literature. The humidification dehumidification (HDH) desalination process is one of the promising thermal based desalination processes that can be driven by low-grade or waste energy, such as condensate leaving the MSF brine heater. A typical HDH process consists of three major components: heater, humidifier/evaporator, and dehumidifier/condenser.
A detailed review on different configurations of HDH cycles and different energy sources for driving the HDH process has been presented [1,20]. A theoretical analysis on the thermodynamic performance of various HDH configurations has been evaluated [21], and their performance parameters were compared in terms of GOR. The analysis showed that a modified air heated cycle attained higher energy efficiency as compared to the conventional air heated HDH cycle. In this regard, waste heat from the heat pump has been used to drive the HDH system with different energy recovery options [22,23,24]. A novel solar HDH desalination system with an enhanced performance has been proposed Xu et al. [25]. The proposed system replaced the vapor chamber and compressor of a convectional mechanical vapor compression desalination system with an evaporative condenser and an air blower, respectively. The system also used internal heat recovery and weakly compressed air. The heat input to the system was provided by solar water collectors, which was only needed to start up the HDH system. The additional heat sources and saline water cooling were no longer required at the steady state operation. A test rig of a solar powered HDH desalination system has been designed and constructed by Li and Zhang [26]. The humidifier of the system is made of a hollow fiber membrane module, while the dehumidifier is equipped with a fin-and-tube heat exchanger. The water stream was heated by an evacuated tube solar collector with an effective absorption area of 4.13 m2. A solar driven cross flow HDH desalination system has been assessed by Zhao et al. [27]. The system is made up of four stages with direct contact humidifiers and dehumidifiers, which are arranged horizontally. The packed bed for both humidifiers and dehumidifiers is made of polypropylene corrugated plastic structured packing, while the solar water collector is of 42 m2 area. Rafiei et al. [28] theoretically investigated the performance of the solar driven HDH process by using different shapes of solar receiver cavities, including cubical, cylindrical, and hemispherical shapes, with a total aperture area of 2.545 m2 each. The saline water temperature was elevated by thermal oil from the solar collector, while photovoltaic panels were used to pre-heat the saline water and to produce the needed power by the system. The heat input from the solar collector to the saline water varies between 30 and 15 kW. The results revealed that the net positive power output of the system is 42 W. The hemispherical cavity collector yielded the lowest GOR and the highest freshwater production.
The literature survey has shown that most of the existing MSF plants are stand-alone desalination plants with few hybrid systems such as RO-MSF hybridization. Compared to the stand-alone desalination process, hybridized desalination systems can provide lower freshwater cost, efficient energy utilization and better environmental solutions. Therefore, the present study is aimed at assessing the performance of a hybrid MSF-HDH system for enhanced productivity and brine volume minimization of discharged MSF brine blowdown. The hybrid configurations considered are the brine recirculation MSF and the closed air open water (CAOW) water-heated HDH cycle. The energy input for the HDH water heater is provided by the condensate leaving the MSF brine heater. Meanwhile, a portion of the discharged MSF brine blowdown is desalted by the HDH system. Therefore, this study presents a thermal and economic performance analysis of four different configurations of MSF-HDH hybridizations.

2. System Description

The hybrid MSF-HDH desalination system under consideration consists of a 29,880 m3/day brine recirculation multi-stage flash (BR-MSF) unit and a water-heated humidification dehumidification (WH-HDH) unit. The system is analyzed under four different hybrid configurations. Calculations for each configuration are performed and the results are compared with a stand-alone MSF plant. The schematic diagrams of these arrangements are shown in Figure 1a–d. In Figure 1a Configuration A, the rejected brine (70,000 ppm at 38 °C) from the BR-MSF plant is fed to the HDH through the dehumidifier, while the condensate leaving the MSF brine heater is fed to the HDH water heat exchanger for heating saline water leaving the dehumidifier, before it is sprayed in the humidifier. Figure 1b Configuration B is similar to Configuration A, except that the condensate from the MSF brine heater is splashed in a single-stage flash (SSF) chamber to generate vapor. The latent heat of the generated vapor is utilized to heat saline water leaving the dehumidifier. In Figure 1c Configuration C, the MSF rejected brine is fed directly to the HDH water heat exchanger, where its temperature is elevated to HDH top brine temperature by the MSF brine heater condensate. Meanwhile, cooling seawater at 28 °C is fed to the dehumidifier for vapor condensation in the dehumidifier. Figure 1d Configuration D is similar to Configuration C, except that the exiting cooling seawater from the dehumidifier is utilized to sensibly preheat the discharged MSF brine. Thereafter, the preheated brine is further heated in the HDH water heater.
The adopted input MSF data for the plant analysis are listed in Table 1. These data are based on an existing MSF plant’s live operation data, obtained from an MSF unit in Al-Jubail plant phase-2, KSA. The following assumptions are considered for the hybrid system code [22,29]: (a) steady state operating conditions, (b) heat loss to the surroundings is neglected, (c) the efficiencies of the pumps and air blower are considered to be 80%, (d) the effectiveness of the humidifier, dehumidifier and water heat exchangers is taken to be 85% [29], (e) the kinetic and potential energy terms are reasonably ignored in mass and energy balance, (f) the specific heat and heat of vaporization are taken at the average temperature of the process, (g) and the sub-cooling of condensate or superheating of the incoming steam to the brine heater are not considered.

3. Mathematical Model

The simplified mathematical model for BR-MSF is summarized in Table A1 in the Appendix A.

3.1. Mass and Energy Balance

The mass and energy balance for major components of the WH-HDH system are as follows:
  • Water Heater (Plate Type Heat Exchanger)
The heat transfer rate for the water heater is given as:
Q ˙ cd = m ˙ cd ( h cd , in h cd , out ) = m ˙ ff ( h ff , out h ff , in )
where Q ˙ cd is the heat transfer rate of the plate heat exchanger, m ˙ ff is the mass flowrate of the portion of MSF brine blowdown entering the HDH unit, and m ˙ cd is the mass flowrate of the MSF brine heater condensate entering the HDH water heater.
Q ˙ cd = A PHX U × LMDT
1 U = 1 α h + t plate k plate + 1 α c + R f , h + R f , c
where Rf,h and Rf,c are the corresponding hot and cold side fouling factors for plate heat exchangers [30], while αh and αc are the hot side and cold side heat transfer coefficient, respectively. αh and αc can be obtained from the Nusselt number expressed as [30]:
Nu = C h Re n Pr 1 3 ( μ μ w ) 0.17
The pressure drop in the plate heat exchanger is the summation of the channel pressure drop and port duct pressure drop given as [30]:
P channel = 4 fL eff N pass G channel 2 D h .2 ρ ( μ μ w ) 0.17
f = k p Re m
P port = 1.4 N pass G port 2 2 ρ
P Total = P channel + P port
where G = m ˙ area is the mass velocity.
For a 45° Chevron angle, the constant Ch = 0.3, n = 0.663, kp = 1.441 and m = 0.206 are taken from Table 11.6 [30]. The plate heat exchanger design input data are given in Table 2.
  • Dehumidifier
The energy, mass and salinity balance for the dehumidifier are expressed as:
m ˙ ff ( h ff , in h ff , out ) = m ˙ fw h fw + m ˙ a ( h a , out h a , in )
m ˙ fw = m ˙ a ( ω a , in ω a , out )
m ˙ ff X b = m ˙ bf X bf
where m ˙ bf ,   X bf   and   X b are the HDH rejected brine flowrate, HDH rejected brine salinity and HDH feed water salinity (MSF brine blowdown), respectively.
For the plate type dehumidifier, the heat transfer coefficient (α) for dry air can be obtained from Equation (4). For wet air (humid air), the updated heat transfer coefficient is expressed as [32,33]:
α a , wet = α a , dry ( 0.164 × lnRe 0.02 )
  • Humidifier
The energy and mass balance for the humidifier are given as:
m ˙ ff h ff , in m ˙ bf h bf = m ˙ a ( h a , out h a , in )
m ˙ bf = m ˙ ff m ˙ a ( ω a , in ω a , out )
where m ˙ bf is the HDH discharged brine flowrate.
The humidifier cross-sectional area (Ahum) can be obtained from [34]:
A hum = m ˙ ff F
where F is the water flux taken as 1.5 kg/s·m2 [34].
The packing height (H) is evaluated from the correlation given in [34]:
Me = h d av m ˙ ff = 2.049 × MR 0.779 × H 0.632
where MR is the mass ratio and Me is the Merkel number.
  • Pre-Heater (Plate Type Heat Exchanger)
The balance equation for the pre-heat heat exchanger in configuration D can be represented as:
m ˙ cw ( h cw , in h cw , out ) = m ˙ ff ( h ff , out h ff , in )
Note that the HDH cooling water flowrate has the same value as the HDH feed water flowrate.
The heat transfer area and pressure drop in the heat exchanger can be obtained by using Equations (2)–(8).
  • Component Effectiveness
The effectiveness expression for devices of simultaneous heat and mass transfer is similar to effectiveness for general heat and mass exchange devices. This is defined as the ratio of actual enthalpy change ( H ˙ ) . of either stream to maximum possible enthalpy change ( H ˙ max ), and can be expressed as [34,35]:
ε = H min ( H max , h , H max , c )
  • Blower
The power consumption of the blower which circulates air between the humidifier and dehumidifier can be expressed as:
W ˙ blower = m ˙ a ρ a η blower ( P Hum + P Dehum )
where ηblower is the blower efficiency of 80% [33].
  • Pumps
The power consumption by the pump can be estimated by:
W ˙ pump = m ˙ ff ρ b η pump ( P Hum + P Dehum + P PHX + P steam )
where ηpump is the pump efficiency of 80% [33].

3.2. Performance Indices

The thermal performance of the HDH system is represented by the gained-output-ratio (GOR). The GOR is estimated based on the input thermal energy and freshwater production. The expression for the GOR is given as [34]:
GOR HDH = m ˙ fw h fg Q ˙ cd
GOR Hybrid = m ˙ d h fg , s + m ˙ fw h fg Q ˙ cd + Q ˙ s
where Q ˙ s   and   Q ˙ cd are the MSF and HDH heat inputs, respectively.
A common platform known as universal performance ratio (UPR) was proposed to evaluate all kinds of desalination technologies [36,37,38,39,40]:
UPR = h fg , vapor 3.6 { CF 1 ( kWh m 3 ) Electrical + CF 2 ( kWh m 3 ) Thermal + CF 3 ( kWh m 3 ) Renewable }
where h fg , vapor . is the vapor energy equivalent, CF1 is the electricity to the primary energy conversion factor, CF2 is the thermal input to the primary energy conversion factor and CF3 is the renewable to primary energy conversion factor. The term kWh/m3 is the electrical, thermal and renewable specific energy consumption.
Another performance indicator for the desalination system is the water recovery ratio (RR). It depends on the freshwater and saline water flowrates, and can be expressed as [34,41]:
RR = m ˙ fw m ˙ ff
where m ˙ fw and m ˙ ff are the freshwater and feed water flowrates, respectively. The recovery ratio of the hybrid MSF-HDH system is evaluated as:
RR Hybrid = RR MSF + RR HDH
The expression for the portion of MSF brine blowdown taken as feed by the HDH unit is represented by:
Ratio HDH _ MSF = m ˙ ff m ˙ b × 100 %
Mass flowrate ratio (MR) is defined as the ratio of feed water flowrate to air flowrate, and can be expressed as [34,41]:
MR HDH = m ˙ ff m ˙ a
The performance ratio of the hybrid MSF-HDH system can be expressed as:
PR hybrid = m ˙ d + m ˙ fw m ˙ s
where m ˙ d   and   m ˙ fw are the MSF and HDH productivities, respectively.

3.3. Economic Analysis

The economic model for the HDH unit is adopted from Zhang et al. [42,43], where:
The capital recovery factor (CRF) is given as:
CRF = i ( i + 1 ) n ( i + 1 ) n 1
The sinking fund factor (SFF) is expressed as:
SFF = i ( i + 1 ) n 1
where i is the interest rate per annum, given as 5% [44], while n is the plant’s expected lifetime, given as 30 years [45].
The fixed annual cost (FAC) is given as:
FAC = PC × CRF
where PC is the system’s present capital cost, which can be estimated from the equations given in Table 3.
The annual maintenance operational cost (AMC) can be expressed as:
AMC = 0.15 × FAC
The salvage value (S) of the system is given as:
S = 0.2 × PC
The annual salvage value (ASV) can be given as:
ASV = S × ( SFF )
The annual running cost (ARC) of the plant is expressed as [42]:
ARC = 365 × τ × ( W ˙ pumps + W ˙ blower ) × COE
where τ = 24 h/day plant operation, while the unit cost of electricity is COE = 0.05 $/kWh [45].
The annual cost (AC) is given as:
AC = FAC + AMC + ARC ASV
CPL HDH = AC M HDH
where M HDH is the annual freshwater productivity, ( m ˙ fw × 86.4 ) .
The cost of water production from the MSF unit and hybrid MSF-HDH system is evaluated based on the procedure presented by El-Dessouky and Ettouney [45]. The following assumptions are made in the cost analysis: plant life (n) of 30 years, energy cost (COE) of 0.05 $/kWh, heating steam cost (CHS) of 1.466 $/MkJ, specific operating labor cost (COL) of 0.1 $/m3, interest rate of 5%, plant availability (PA) of 0.9, direct capital cost (DC) of $ 64 × 10 6 and specific chemicals cost (COC) of 0.025 $/m3.
The annual fixed charges for the stand-alone MSF unit and hybrid MSF-HDH unit are given by:
C 1 = CRF × DC
C 1 h = CRF × ( DC + Z HDH )
The annual cost of heating steam for the stand-alone MSF unit and hybrid MSF-HDH unit can be expressed as:
C 2 = CHS × h fg , s × PA × M MSF × 365 1000 × PR MSF
C 2 h = CHS × h fg , s × PA × ( M MSF + M HDH ) × 365 1000 × PR MSF , HDH
where M MSF = ( m ˙ d × 86.4 ) is the annual freshwater productivity.
The annual cost of electric power for the stand-alone MSF unit and hybrid MSF-HDH unit is represented by:
C 3 = COE × SEC MSF × PA × M MSF × 365
C 3 h = COE × SEC HYB × PA × ( M MSF + M HDH ) × 365
where SEC MSF = power pumps m ˙ d × ( 1000 3600 )   and   SEC HYB = power pumps + W ˙ pumps + W ˙ blower m ˙ d + m ˙ fw × ( 1000 3600 ) .
The annual cost of chemicals for the stand-alone MSF unit and hybrid MSF-HDH unit can be expressed as:
C 4 = COC × PA × M MSF × 365
C 4 h = COC × PA × ( M MSF + M HDH ) × 365
The annual cost of labor for the stand-alone MSF unit and hybrid MSF-HDH unit is given by:
C 5 = COL × PA × M MSF × 365
C 5 h = COL × PA × ( M MSF + M HDH ) × 365
The total annual cost for the stand-alone MSF unit and hybrid MSF-HDH unit is represented by:
C TOT , MSF = C 1 + C 2 + C 3 + C 4 + C 5
C TOT , HYB = C 1 h + C 2 h + C 3 h + C 4 h + C 5 h
Therefore, the water cost for the stand-alone MSF unit and hybrid MSF-HDH unit can be expressed as:
CPL MSF = C TOT , MSF PA × M MSF × 365
CPL HYB = C TOT , MSF PA × ( M MSF + M HDH ) × 365
This section may be divided by subheadings. It should provide a concise and precise description of the experimental results, their interpretation, as well as the experimental conclusions that can be drawn.

4. Results and Discussion

The Engineering Equation Solver (EES) software with updated seawater properties compiled by Sharqawy et al. [49] is utilized for the numerical simulation. The prediction capability of the developed MSF and HDH codes is verified independently because similar hybrid layouts are not available in the literature. The HDH code was validated against the experimental work of Zubair et al. [50], and was found to be in close agreement with a maximum 2.9% percentage deviation from the experimental data, as shown in Figure 2. The developed MSF model was validated against the live data obtained on 1 January 2019 from the Al-Jubail MSF plant phase-2 main control room. Table 4 presents the comparison of some of the key parameters of the code and those obtained from the plant’s live data at a plant production rate of 1245 m3/h (29,880 m3/day).
The discussed key performance parameters for the proposed hybrid layouts (A, B, C and D) are the amount of feed water treated by the HDH, the gained output ratio, the water recovery ratio, water productivity and product cost. The influence of the mass flowrate ratio on these key performance indicators is presented and discussed. Figure 3 illustrates the variation of the utilized MSF brine by the HDH unit with MR. The percentage of MSF brine blowdown utilized as feed water in the HDH unit is calculated using Equation (26), while the expression for the MR is given in Equation (27). Optimum MR is noticed for each configuration except for system configuration C, whose optimum MR is out of MR range. Variation in MR in the current HDH layouts causes variations in both feed water flowrate and circulated air flowrate. Increasing MR leads to an increase in air flowrate. At the same time, increasing the MR increases the feed water flowrate to a peak value, and then it decreases after reaching an optimum MR. The optimum MR where the peak utilized MSF brine occurs corresponds to the highest feed water flowrate. Optimum MR signifies the correct flowrates for the circulated air and sprayed feed water that yield the best HDH performance. It can be observed that system A, which can accommodate nearly 67% of the rejected MSF brine at 60 °C HDH Tmax, attained the highest utilized MSF brine when compared to other configurations, whereas system C, whose HDH unit can handle a maximum of about 24% MSF rejected brine, yielded the least utilized MSF brine. The high value associated with system A may be due to the fact that the feed intake by the HDH system is preheated in the dehumidifier before entering the HDH water heat exchanger, where the feed water was further heated to the HDH top brine temperature. Preheating in the dehumidifier decreases the heat demand at the HDH water heater. This leads to increasing the intake feed water by the HDH water heater. System C takes less MSF rejected brine due to the absence of heat recovery at the dehumidifier. For comparison at 60 °C HDH Tmax, system A handled about 180% HDH feed water intake over system C. It can also be seen that at higher HDH Tmax (80 °C), less MSF brine is accommodated by the HDH unit when compared to lower TBT (60 °C). This may be attributed to the fact that at high TBT, more energy is demanded by the water heat exchanger, which decreases the allowable HDH feed water intake. At low TBT, lower energy is demanded. Hence, more feed water is accommodated by the HDH unit. For instance, decreasing the HDH Tmax from 80 °C to 60 °C in system A resulted in about 167% increment in the feed intake. It is worth mentioning that the intake feed water temperature is 38 °C (MSF blowdown temperature).
Demonstrated in Figure 4 is the influence of MR on the gained output ratio of the HDH unit (Figure 4a) and hybrid MSF-HDH system (Figure 4b) at different top brine temperatures. The GOR of the stand-alone MSF unit is added to Figure 4b for comparison. According to Equation (21), increasing the productivity or decreasing the input energy increases the system GOR. As observed from Figure 4, increasing MR increases the system GOR to a peak value and then decreases it with a further increase in MR. The peak GOR occurs at the optimum MR where the feed water flowrate is maximum and the input energy is minimized. In this study, both low input energy and high feed water flowrate (high productivity) yield the highest gained output ratio. It should be noted that variation in MR is greatly influenced by the variation in feed water flowrate, so the maximum GOR occurred at the maximum feed water flowrate, as illustrated in Figure 3. It can also be noticed that the GOR is higher (2.047) at lower HDH Tmax (60 °C) as compared to higher HDH Tmax (80 °C), where the peak GOR is 1.723. This is around a 19% drop in the GOR when HDH Tmax is increased from 60 °C to 80 °C. In addition, at a low value of Tmax, lower input energy is needed to raise the feed water temperature. Both systems (A and B, which are very similar except that one uses a water heat exchanger and the other uses latent heat in a single-stage flash unit to heat feed water) are seen to exhibit a higher GOR when compared to system D, while system C is the least in terms of GOR. For example, in Figure 4a at 60 °C, the peak GOR of system A exceeds that of system C by more than 135%. The higher GOR in configurations A and B may be attributed to better energy recovery in the dehumidifier, which leads to higher feed water intake and consequently a higher GOR. Figure 4b portrays the GOR of the hybrid HDH-MSF unit and stand-alone MSF unit. It is obvious that the hybrid MSF-HDH unit shows a better GOR. For instance, the peak GOR at 60 °C for system A, system C and stand-alone MSF is 8.731, 8.641, and 8.521, respectively, which corresponds to a 2.46% and 1.41% increment in hybrid systems A and C, respectively, over the stand-alone MSF unit. The recorded higher GOR in the hybrid system may be due to higher productivity and better energy recovery options. Similarly, the highest performance ratio (PR) at 60 °C for hybrid system A, hybrid system C and stand-alone MSF is 8.795, 8.687 and 8.603, respectively. This corresponds to a 2.23% and nearly 1% increment in hybrid systems A and C, respectively, over the stand-alone MSF unit. The plots for the conventional performance ratio (PR) are not presented here, since it serves the same purpose as the GOR (Figure 4). However, a plot representing universal performance ratio (UPR) is presented in Figure 4. It can also be noticed that the UPR for the hybrid MSF-HDH is slightly better as compared to the stand-alone MSF plant. The hybrid system demonstrates a maximum UPR of 76.03, while the UPR for the stand-alone MSF is 75.75. The better UPR of the hybrid system over the stand-alone MSF may be due to the extra freshwater recovered by the HDH unit without accounting for its thermal energy consumption.
The influence of MR on the system freshwater productivity for the HDH unit, hybrid MSF-HDH and stand-alone MSF unit at different HDH Tmax is presented in Figure 5. Peak productivity is observed at the optimum MR for each figure. It can be observed that increasing MR enhances system productivity till the optimum MR, where freshwater production is maximum. Thereafter, freshwater production decreases with a further increase in MR. As noticed in Figure 3, the optimum MR corresponds to the peak feed water flowrate. At maximum feed water flowrate, a large volume of feed water is sprayed in the humidifier. This implies that more vapor is generated and air moisture content is increased. This leads to a higher rate of vapor condensation and productivity in the dehumidifier. In line with earlier observations in Figure 3 and Figure 4, a lower HDH Tmax leads to higher freshwater production, which is due to a higher feed water intake and higher mass transfer to the dehumidifier.
Decreasing TBT from 80 °C to 60 °C in Figure 5a leads to about a 43% rise in the system’s productivity. Moreover, the HDH unit in system A, which can accommodate a higher feed water flowrate (due to a better energy recovery option), shows superior productivity (maximum of 670 m3/day) when compared to the HDH unit in other layouts. The lowest system productivity (293 m3/day at peak) is associated with the HDH unit of system C, which has no energy recovery option and the lowest feed water intake. This implies that the HDH unit in system A recorded a more than 128% enhancement in productivity over the HDH unit of system C. Figure 5b reveals that the hybridized MSF-HDH of system A with a peak productivity of 30,549 m3/day portrayed a higher freshwater production when compared to the stand-alone MSF unit, whose productivity is 29,880 m3/day. In fact, all the hybrid systems show better productivity over the stand-alone MSF plant. Note that hybrid productivity is the summation of both MSF productivity and that of the HDH unit.
Presented in Figure 6 is the variation in the water recovery ratio (RR) with MR for the hybrid MSF-HDH unit and stand-alone MSF unit at different Tmax of 60, 70, and 80 °C. As defined by Equations (24) and (25), the RR depends on both the feed water flowrate entering the system and the freshwater flowrate produced by the system. Maximum RR is observed for each hybrid system at optimum MR, where the feed water flowrate is maximum. Contrary to the previous observations, the water recovery ratio for system C and system D is higher than that of system A and system B. It is also noticed that operating each system at a higher feed water temperature favors a higher water recovery ratio, which is also contrary to the previous observations, in which lower HDH Tmax favors a higher GOR and productivity. The observed enhancement in the water recovery ratio of systems C and D may be attributed to the low cooling seawater temperature (28 °C) utilized for vapor condensation in the dehumidifiers of systems C and D. This yielded better vapor condensation as a result of the larger temperature difference between the cooling water and hot humidified air entering the dehumidifier. For systems A and B, the feed water enters the dehumidifier at 38 °C, which decreases the temperature difference between the cooling water and hot humidified air entering the dehumidifier. Consequently, lower water productivity per unit feed water flowrate is recorded. Similarly, higher HDH Tmax (water temperature entering humidifier) and lower HDH Tmin (water temperature entering the dehumidifier) create a larger temperature difference in the dehumidifier. This enhances the vapor condensation and leads to higher productivity per unit feed water flowrate. This observation indicates that a system with better energy recovery and higher productivity does not guarantee a better water recovery ratio. Again, all the proposed hybrid layouts show a better water recovery ratio (Figure 6b) when compared to the water recovery ratio of the stand-alone MSF unit.
The effect of changing MR on freshwater cost for the HDH unit, hybrid MSF-HDH system and stand-alone MSF unit at an HDH top brine temperature of 70 °C is demonstrated in Figure 7. The water production cost depends on equipment capital cost, steam cost, chemical cost, energy cost and freshwater productivity. It has been noticed earlier that MR strongly depends on feed water flowrate, which directly affects the freshwater production. Therefore, variation in MR translates to variation in freshwater cost. The optimum MR corresponds to the maximum feed water flowrate, which translates to maximum productivity, and consequently lowest freshwater cost. For the HDH units in the hybrid systems A to D, systems A and B yielded the lowest freshwater cost of about 0.289 $/m3, while the water cost for system C and system D is 0.3336 $/m3 and 0.4854 $/m3, respectively, although the HDH unit in system D attained the highest productivity and GOR when compared to system C. However, due to the presence of an additional heat exchanger in system D, which requires extra component cost and pumping power, its freshwater cost is higher than that of configuration C. The freshwater cost for the hybrid MSF-HDH system is 1.068 $/m3, which is a bit lower than that of the stand-alone MSF system (1.087 $/m3). It is worth mentioning that the integrated HDH system is characterized by low direct capital cost or equipment cost when compared to the MSF system. Depending on the operating conditions, the percentage of the estimated direct capital cost for the HDH system is in the range of 0.14–1.01% of MSF direct capital cost. In addition, the running cost for the HDH is negligible in comparison with the MSF system’s cost. This shows that the cost of building the HDH system is quite low in comparison to the complex MSF system. Therefore, in general, one can conclude that the hybridization of the MSF unit with the HDH system provides better energy recovery, enhanced productivity, better environmental protection in terms of brine treatment and cost effectiveness.

5. Concluding Remarks

In this work, the performance of a water-heated humidification dehumidification (WH-HDH) system driven by rejected steam condensate from an MSF brine heater is presented and discussed. Various hybridization options between a brine-recycled multi-stage flash (BR-MSF) desalination system and a WH-HDH desalination system are proposed and discussed. The influence of the HDH mass flowrate ratio during humidification and dehumidification on various desalination performance parameters is reported. The stand-alone BR-MSF plant operates at 1245 m3/h (29,880 m3/day), a brine blowdown temperature of 38 °C, a seawater temperature of 28 °C and a 103 °C top brine temperature.
The following are the main conclusions drawn from this study:
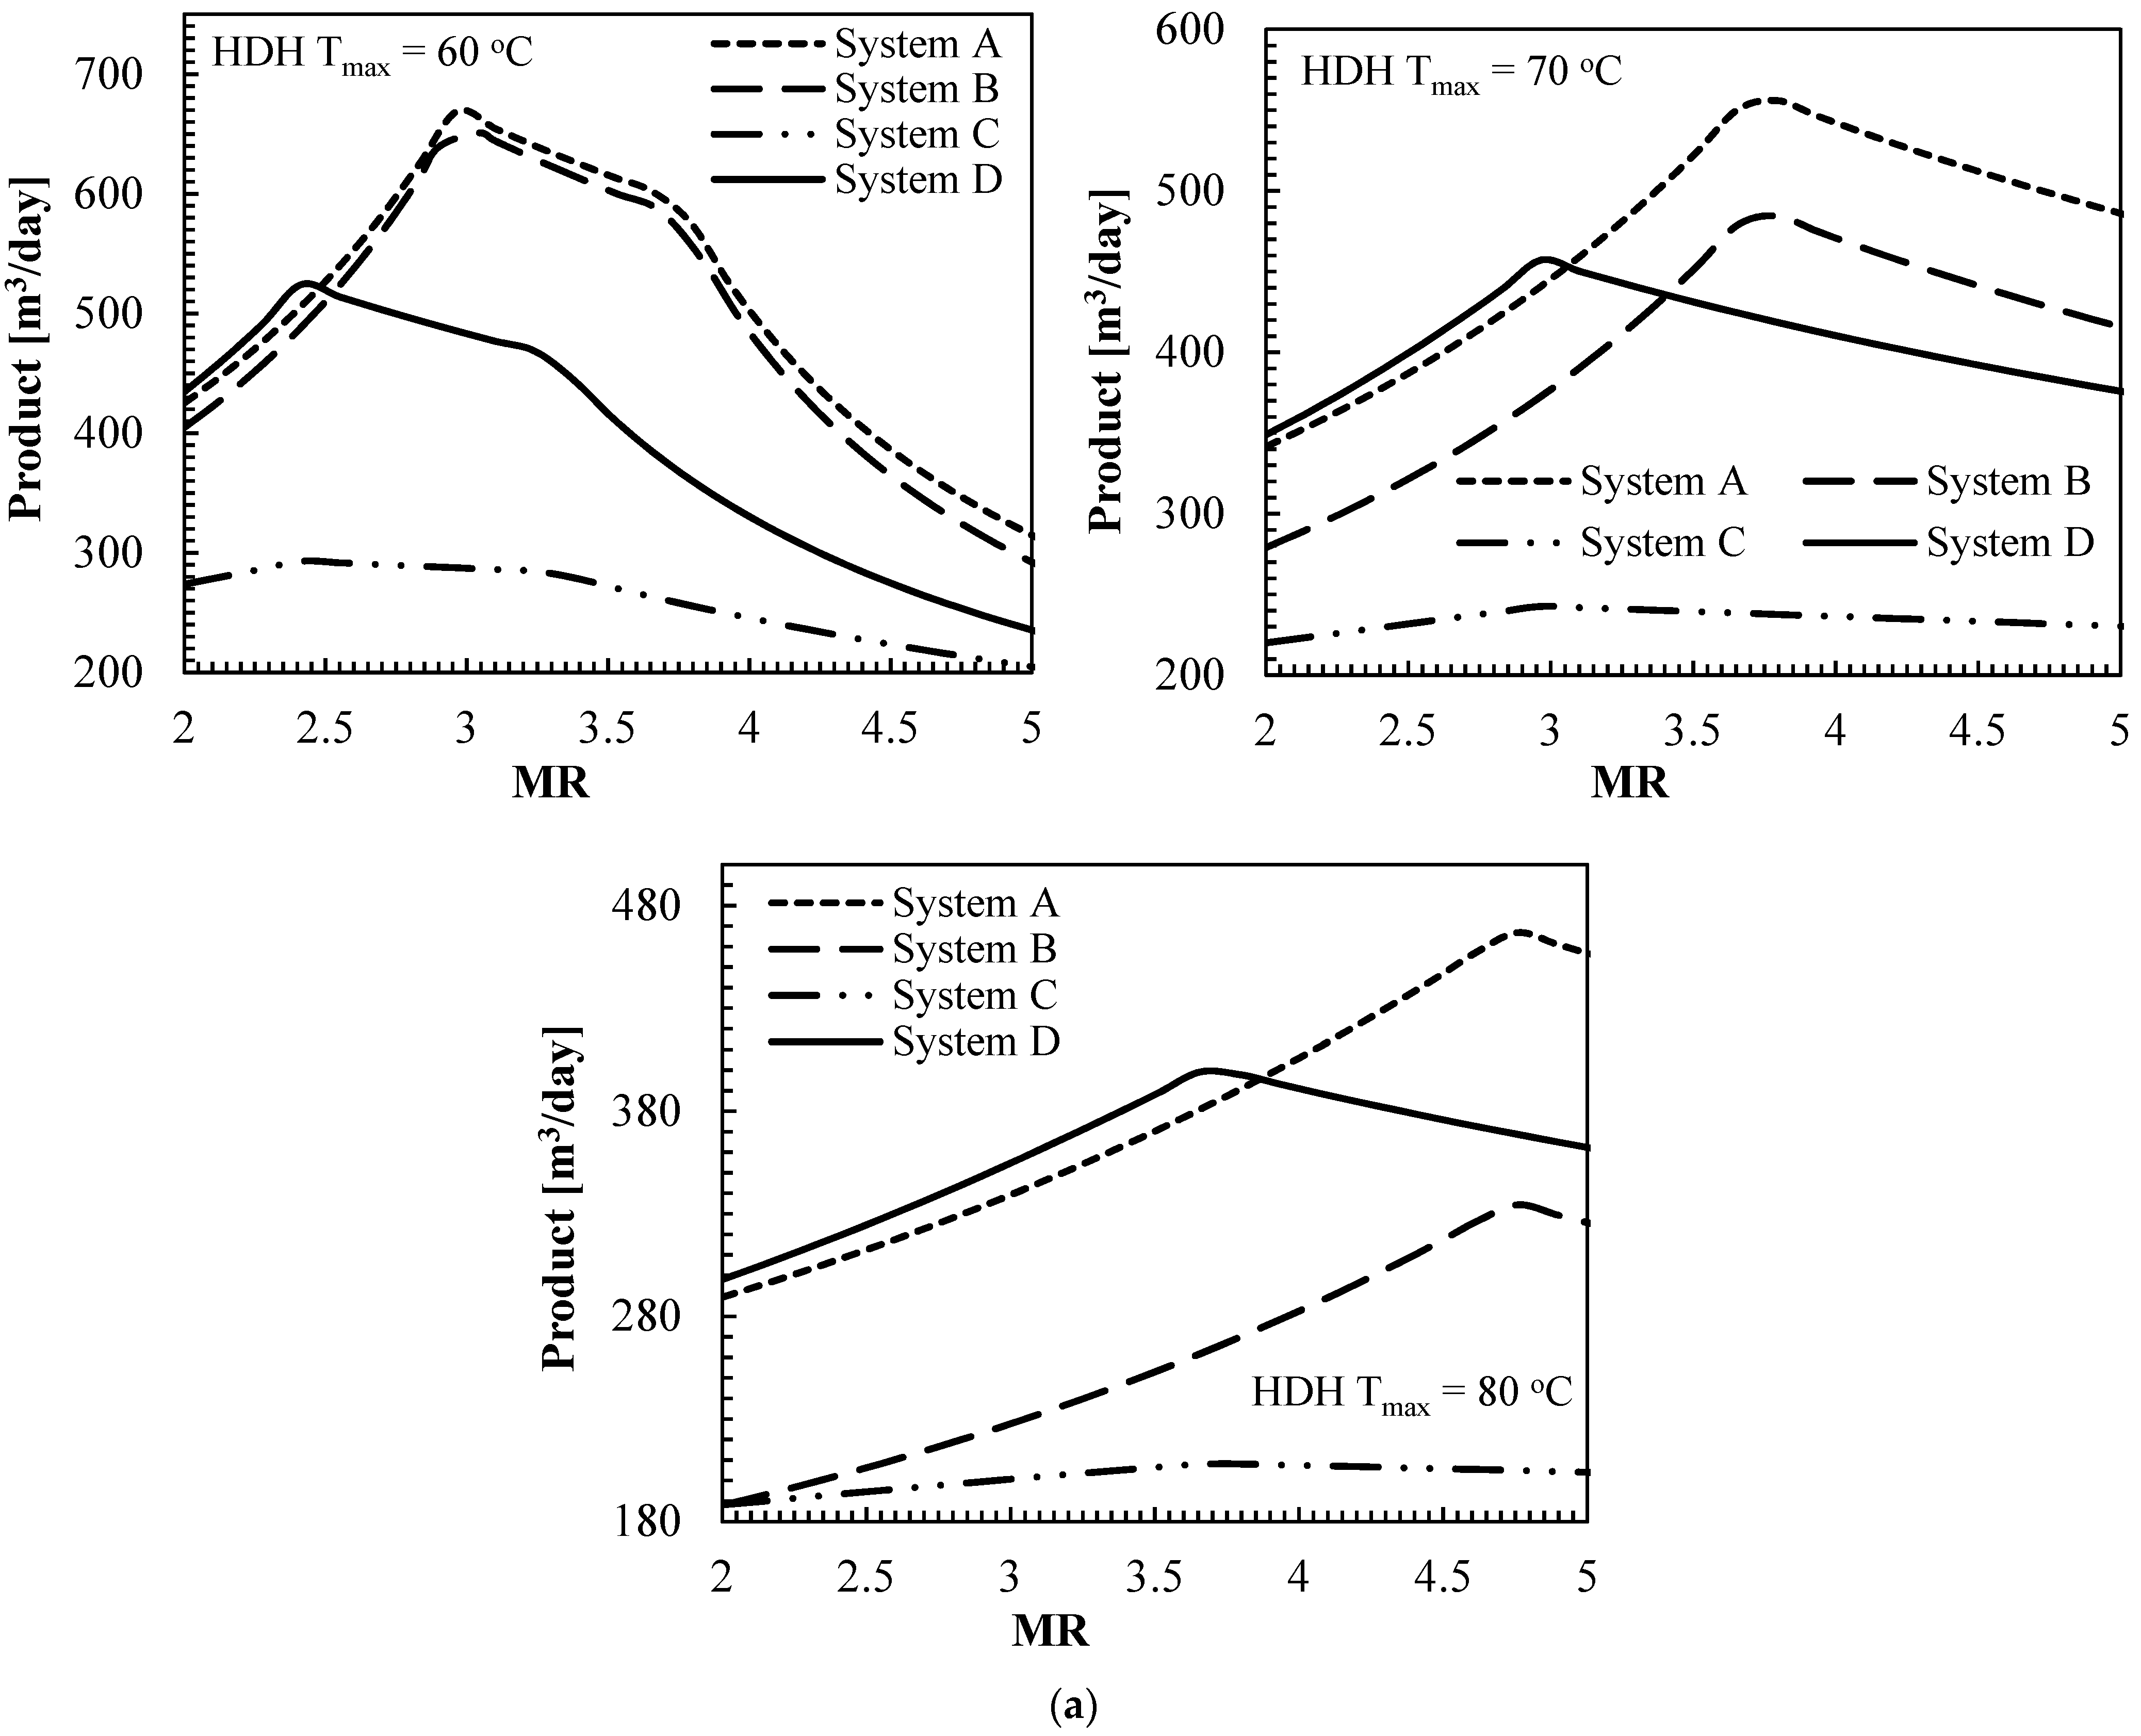
  • Optimum MR exists at the best system performances. The optimum MR corresponds to the peak HDH feed water flowrate.
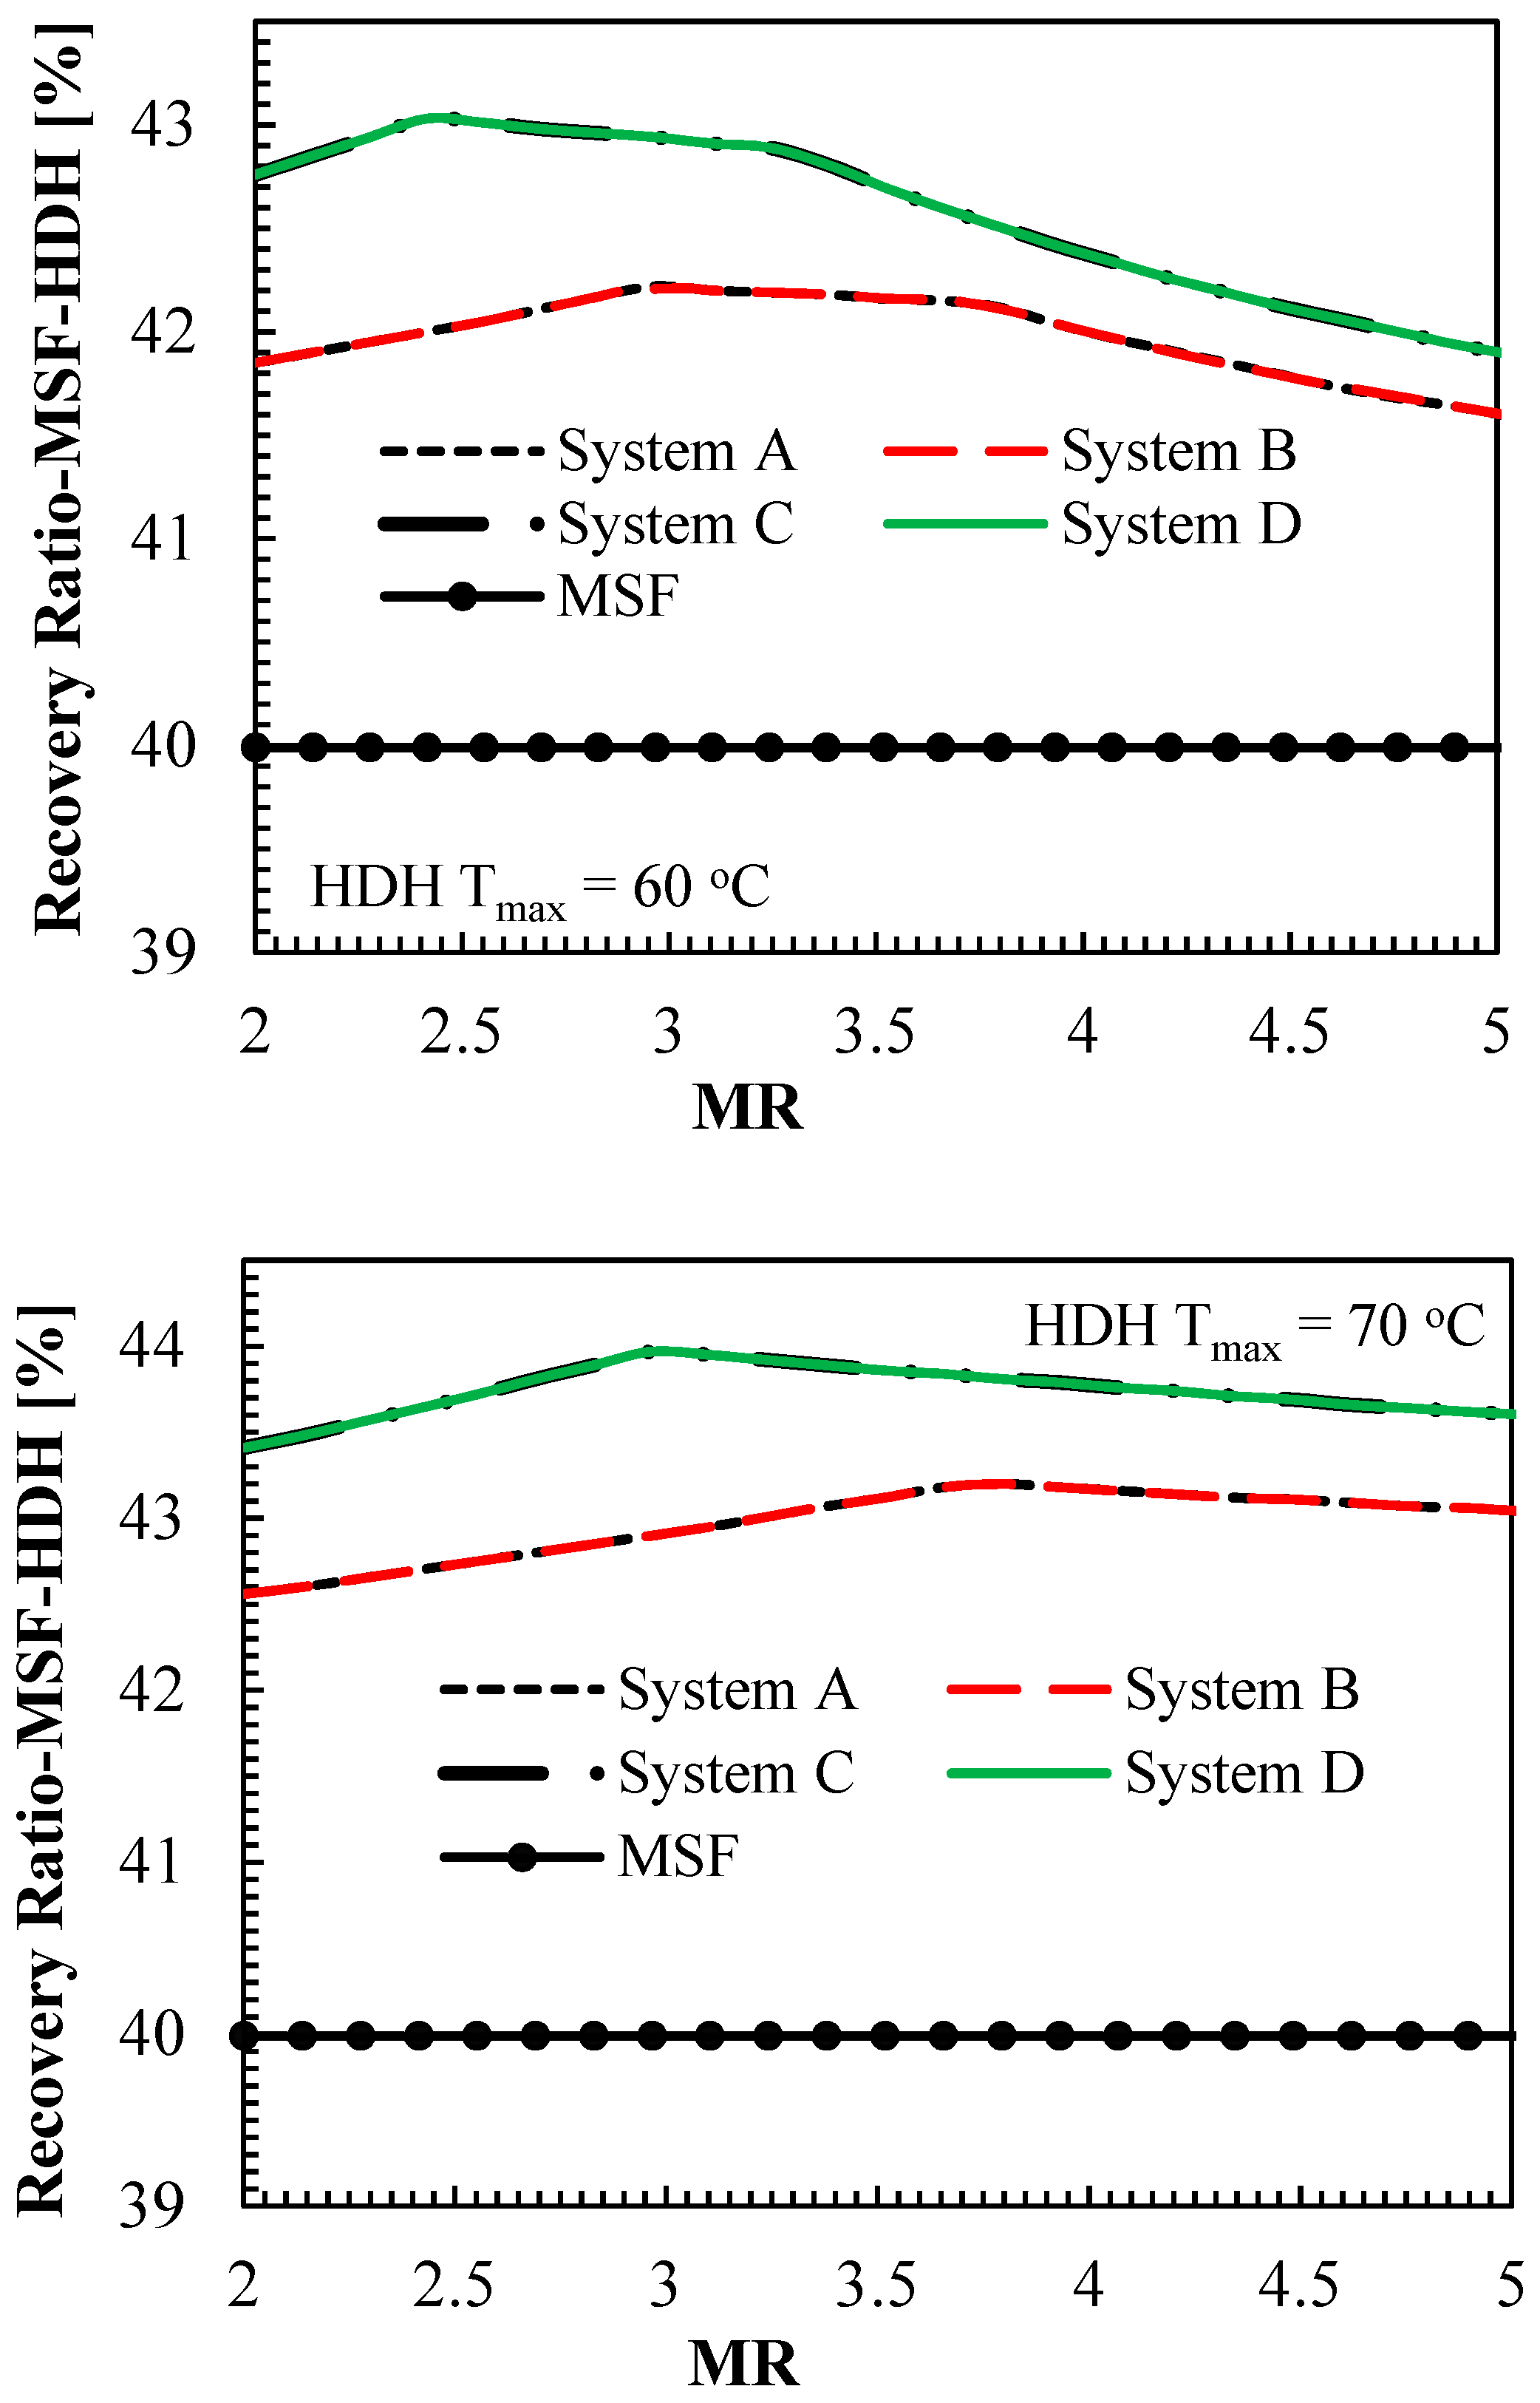
  • System A with a better energy recovery option provides superior performance over the other proposed layouts, while configuration C, which has no energy recovery option, exhibited the worst performance in terms of GOR, productivity and PR. However, system C has better freshwater recovery, predominantly due to lower temperature cooling water.
  • The highest MSF rejected brine blowdown that can be utilized by the HDH unit is about 67% of the MSF brine. This corresponds to the highest HDH freshwater productivity of about 670 m3/day.
  • The best GOR, productivity and water recovery ratio of 8.731, 30,549 m3/day, and 44.86%, respectively, are attained at the optimum MR of 2.966 for the hybrid system.
  • Without considering the cost of condensate/steam (condensate of the rejected MSF brine heater) in the HDH system, the freshwater cost from the HDH unit can be as low as 0.289 $/m3, which is achieved at an MR of 3.655. The lowest freshwater cost from the hybrid system and stand-alone MSF unit is about 1.068 $/m3 and 1.087 $/m3, respectively.
The current hybridized desalination system minimizes environmental hazards by further recovery of sweet water from warm, concentrated, pretreated and deaerated MSF brine reject, which could have been discharged to the ambient. Therefore, the present integrated systems can be considered as a brine volume minimization (BVM) system. Meanwhile, it is expected that further recycling of the MSF brine in the HDH system to a higher concentration and the application of a crystallization subsystem, which can yield freshwater and salt crystals from the highly concentrated brine, will lead to zero liquid discharged (ZLD) and zero marine environmental hazards.

Author Contributions

Conceptualization, M.A. and A.K.; methodology, M.A. and D.L.; software, D.L.; validation, D.L. and A.K.; writing—original draft preparation, D.L.; writing—review and editing, M.A. and A.K.; project administration, M.A. All authors have read and agreed to the published version of the manuscript.

Funding

This research received no external funding.

Institutional Review Board Statement

Not applicable.

Informed Consent Statement

Not applicable.

Data Availability Statement

Not applicable.

Acknowledgments

The authors acknowledge the financial support provided by the Deanship of Scientific Research (DSR), King Fahd University of Petroleum and Minerals under the Project # DF191044.

Conflicts of Interest

The authors declare no conflict of interest.

Nomenclature

Acronyms
ACannual cost
ACRactual concentration ratio
AMCannual maintenance operational cost
ARCannual running cost
ASVannual salvage value
BBTbottom brine temperature
BRbrine recycled
CF1conversion factor for electricity to the primary energy
CF2conversion factor for thermal input to the primary energy
CF3conversion factor for renewable to the primary energy
CHSheating steam cost
COCchemical cost
COEcost of electricity
COLlabor cost
CPLcost of freshwater
CRdesign concentration ratio
CRFcapital recovery factor
DCdirect cost
FACfixed annual cost
GORgained output ratio
HDHhumidification-dehumidification
HRJSheat rejection section
HRSheat recover section
LMTDlogarithmic mean temperature difference
MeMerkel number
MRmass flowrate ratio
MSFmulti-stage flash desalination
NuNusselt number
PCpresent capital cost
PrPrandtl number
PRthermal performance ratio
ReReynolds number
RRrecovery ratio
SECspecific electric energy consumption
SFFsinking fund factor
TBTtop brine temperature
WHwater heated
Symbols
aeffective surface area per unit volume
Across-sectional area
Cannual cost
c ˙ electunit electricity cost
Cpspecific heat capacity at constant pressure
dtube diameter
Dhhydraulic diameter
ffriction factor
Fwater flux
Gmass velocity
henthalpy
Hheight
hdmass transfer coefficient
hfglatent heat of vaporization
iinterest rate per annum
kthermal conductivity
Llength
Maverage annual productivity
m ˙ mass flow rate
nplant life expectancy
Nnumber
Ppressure
PrPrandtl number
Q ˙ heat transfer rate
Q ˙ cd heat input from MSF condensate to HDH water heater
Q ˙ s heat input from steam to MSF brine heater
ReReynolds number
Rffouling factor
Ssalvage value
tthickness
Ttemperature
Uoverall heat transfer coefficient
vvolume
W ˙ power
yspecific ratio
Xsalinity
Zequipment cost
Greek letters
ɛeffectiveness
ωhumidity ratio
αheat transfer coefficient
$US dollars
ηefficiency
μdynamic viscosity
ρdensity
change/difference/drop
τhours of plant operation per day
Subscripts
1, 2, 3, …state points
aair
bMSF brine blowdown
bfHDH rejected brine
brMSF brine recycle
ccold side
cdMSF brine heater condensate used by HDH water heater
cwcooling seawater
dMSF distillate
D, dehumdehumidifier
Electelectricity
fMSF feed/make-up water
ffHDH feed water
fwHDH distillate
hhot side
H, humhumidifier
inentering/input
maxmaximum
minminimum
nany stage
outoutput/exiting
PHXplate type heat exchanger
ssteam
T/ttotal

Appendix A

The equations in A1 are used to determine the size and performance of the BR-MSF system.
Table A1. Simplified MSF mathematical model.
Models
m ˙ f = m ˙ d m ˙ b Mass balance
m ˙ s w = m ˙ c w + m ˙ f , X f m ˙ f = X b m ˙ b Mass and salt balance
y = cP · Δt/ΔhvapSpecific heat ratio
m ˙ d = m ˙ b r ( 1 ( 1 y ) n ) Total production
m ˙ d , i = m ˙ b r · y · ( 1 y ) n 1 Stage production
m ˙ b r , n = m ˙ b r i = 1 ( n ) ( m ˙ d , i ) Next stage brine
X n = X b r · m ˙ b r / m ˙ b r , n Salinity at stage
m ˙ b r X b r + m ˙ b b d X b = m ˙ f X f + ( m ˙ b r m ˙ d ) X b Recycle stream balance
X b r = ( X f X b ) m ˙ f + m ˙ b r X b m ˙ b r Salinity of recycled brine
m ˙ s h f g = m ˙ s w Cp ( BBT T cw ) + m ˙ bbd Cp ( BBT T cw ) + m ˙ d Cp ( BBT T cw ) Energy balance
m ˙ s h f g = m ˙ s w ( h o u t h i n ) + m ˙ b b d ( h o u t h i n ) + m ˙ d ( h out h _ i n )
m ˙ s h f g = m ˙ b r C p ( TBT TB i ) B H energy balance
ΔT = (TBT − BBT)/nStage temperature drop
Tav = (TBT + BBT)/2Brine av. temperature
T i = TBT i ( Δ T ) Brine temperature at (i)
T r i = BBT + ( n j ) Δ T ( i 1 ) Δ T Condenser temperature (i)
BPE i = X i ( B s + X b C s ) 10 3 Boiling point elevation
B s = ( 6.71 + 6.34 × 10 2 T b + 9.74 × 10 5 T b 2 ) 10 3
C s = ( 22.238 + 9.59 × 10 3 ( T b ) + 9.42 × 10 5 ( T b 2 ) 10 8
T ev = T b BPE i Vapor stage temperature
ΔTj = (BBT − Tcw)/j
PR MSF = m ˙ d m ˙ s Thermal performance ratio
s A = ( A b h + A r + A j ) / m ˙ d Specific heat transfer area
sM _ sw = m ˙ sw m ˙ d Specific cooling water flow rate
RR MSF = m ˙ d m ˙ f GOR MSF = m ˙ d h f g , s Q ˙ B H s Water recovery ratio, Gained output ratio
CR = XBR/XfConcentration ratio
Pump load = ( Discharge   pressure ) × m ˙ br ɳ × ρ sw Pump load
Spower = Power c o n s m ˙ d · 1000 MSF total power consumption (MW)

References

  1. Lawal, D.U.; Qasem, N.A.A. Humidification-dehumidification desalination systems driven by thermal-based renewable and low-grade energy sources: A critical review. Renew.Sustain. Energy Rev. 2020. [Google Scholar] [CrossRef]
  2. Karagiannis, I.C.; Soldatos, P.G. Water desalination cost literature: Review and assessment. Desalination 2008, 223, 448–456. [Google Scholar] [CrossRef]
  3. Shahzad, M.W.; Burhan, M.; Ang, L.; Ng, K.C. Energy-water-environment nexus underpinning future desalination sustainability. Desalination 2017, 413, 52–64. [Google Scholar] [CrossRef]
  4. Global Clean Water Desalination Alliance. “H2O Minus CO2”. Concept Paper; 1 December 2015. Available online: https://www.diplomatie.gouv.fr/IMG/pdf/global_water_desalination_alliance_1dec2015_cle8d61cb.pdf (accessed on 18 October 2020).
  5. International Energy Agency (IEA). World Energy Outlook Special Report: Redrawing the Energy-Climate Map. 2013. Available online: https://webstore.iea.org/weo-2013-special-report-redrawing-the-energy-climate-map (accessed on 18 October 2020).
  6. Shahzad, M.W.; Burhan, M.; Ng, K.C. Pushing desalination recovery to the maximum limit: Membrane and thermal processes integration. Desalination 2017, 416, 54–64. [Google Scholar] [CrossRef]
  7. Ng, K.C.; Thu, K.; Oh, S.J.; Ang, L.; Shahzad, M.W.; Ismail, A.B. Recent developments in thermally-driven seawater desalination: Energy efficiency improvement by hybridization of the MED and AD cycles. Desalination 2015, 356, 255–270. [Google Scholar] [CrossRef]
  8. Shahzad, M.W.; Ng, K.C.; Thu, K.; Saha, B.B.; Chun, W.G. Multi effect desalination and adsorption desalination (MEDAD): A hybrid desalination method. Appl. Therm. Eng. 2014, 72, 289–297. [Google Scholar] [CrossRef]
  9. Shahzad, M.W.; Thu, K.; Kim, Y.D.; Ng, K.C. An experimental investigation on MEDAD hybrid desalination cycle. Appl. Energy 2015, 148, 273–281. [Google Scholar] [CrossRef]
  10. Chen, Q.; Burhan, M.; Shahzad, M.W.; Ybyraiymkul, D.; Akhtar, F.H.; Li, Y.; Ng, K.C. A zero liquid discharge system integrating multi-effect distillation and evaporative crystallization for desalination brine treatment. Desalination 2021, 502, 114928. [Google Scholar] [CrossRef]
  11. Shahzad, M.W.; Burhan, M.; Ghaffour, N.; Ng, K.C. A multi evaporator desalination system operated with thermocline energy for future sustainability. Desalination 2018, 435, 268–277. [Google Scholar] [CrossRef]
  12. Shaaban, S. Performance optimization of an integrated solar combined cycle power plant equipped with a brine circulation MSF desalination unit. Energy Convers. Manag. 2019, 198, 111794. [Google Scholar] [CrossRef]
  13. Garg, K.; Khullar, V.; Das, S.K.; Tyagi, H. Performance evaluation of a brine-recirculation multistage flash desalination system coupled with nanofluid-based direct absorption solar collector. Renew. Energy 2018, 122, 140–151. [Google Scholar] [CrossRef]
  14. El-Ghonemy, A.M.K. Performance test of a sea water multi-stage flash distillation plant: Case study. Alexandria Eng. J. 2018, 57, 2401–2413. [Google Scholar] [CrossRef]
  15. Harandi, H.B.; Rahnama, M.; Jahanshahi Javaran, E.; Asadi, A. Performance optimization of a multi stage flash desalination unit with thermal vapor compression using genetic algorithm. Appl. Therm. Eng. 2017, 123, 1106–1119. [Google Scholar] [CrossRef]
  16. Choi, S.-H. On the brine re-utilization of a multi-stage flashing (MSF) desalination plant. Desalination 2016, 398, 64–76. [Google Scholar] [CrossRef]
  17. Mabrouk, A.-N.A. Techno-economic analysis of tube bundle orientation for high capacity brine recycle MSF desalination plants. Desalination 2013, 320, 24–32. [Google Scholar] [CrossRef]
  18. Al-Sofi, M.A.K.; Hassan, A.M.; Mustafa, G.M.; Dalvi, A.G.I.; Kither, M.N.M. Nanofiltration as a means of achieving higher TBT of ≥120 °C in MSF. Desalination 1998, 118, 123–129. [Google Scholar] [CrossRef]
  19. Hamed, O.A.; Al-Sofi, M.A.K.; Imam, M.; Mustafa, G.M.; Ba Mardouf, K.; Al-Washmi, H. Thermal performance of multi-stage flash distillation plants in Saudi Arabia. Desalination 2000, 128, 281–292. [Google Scholar] [CrossRef]
  20. Faegh, M.; Behnam, P.; Shafii, M.B. A review on recent advances in humidification-dehumidification (HDH) desalination systems integrated with refrigeration, power and desalination technologies. Energy Convers. Manag. 2019, 196, 1002–1036. [Google Scholar] [CrossRef]
  21. Narayan, G.P.; Sharqawy, M.H.; Lienhard, V.J.H.; Zubair, S.M. Thermodynamic analysis of humidification dehumidification desalination cycles. Desalin. Water Treat. 2010, 16, 339–353. [Google Scholar] [CrossRef] [Green Version]
  22. Lawal, D.U.; Antar, M.A. Investigation of heat pump-driven humidification-dehumidification desalination system with energy recovery option. J. Therm. Anal. Calorim. 2020. [Google Scholar] [CrossRef]
  23. Lawal, D.U.; Jawad, S.A.; Antar, M.A. Experimental and theoretical study on a heat pump driven open-air humidification dehumidification desalination system. Energy 2020. [Google Scholar] [CrossRef]
  24. Lawal, D.U.; Antar, M.A.; Khalifa, A.; Zubair, S.M. Heat pump operated humidification-dehumidification desalination system with option of energy recovery. Sep. Sci. Technol. 2020. [Google Scholar] [CrossRef]
  25. Xu, H.; Sun, X.Y.; Dai, Y.J. Thermodynamic study on an enhanced humidification-dehumidification solar desalination system with weakly compressed air and internal heat recovery. Energy Convers. Manag. 2019, 181, 68–79. [Google Scholar] [CrossRef]
  26. Li, G.-P.; Zhang, L.-Z. Investigation of a solar energy driven and hollow fiber membrane-based humidification–dehumidification desalination system. Appl. Energy 2016, 177, 393–408. [Google Scholar] [CrossRef]
  27. Zhao, Y.; Zheng, H.; Liang, S.; Zhang, N.; Long Ma, X. Experimental research on four-stage cross flow humidification dehumidification (HDH) solar desalination system with direct contact dehumidifiers. Desalination 2019, 467, 147–157. [Google Scholar] [CrossRef]
  28. Rafiei, A.; Alsagri, A.S.; Mahadzir, S.; Loni, R.; Najafi, G.; Kasaeian, A. Thermal analysis of a hybrid solar desalination system using various shapes of cavity receiver: Cubical, cylindrical, and hemispherical. Energy Convers. Manag. 2019, 198, 111861. [Google Scholar] [CrossRef]
  29. He, W.F.; Wu, F.; Wen, T.; Kong, Y.P.; Han, D. Cost analysis of a humidification dehumidification desalination system with a packed bed dehumidifier. Energy Convers. Manag. 2018, 171, 452–460. [Google Scholar] [CrossRef]
  30. Sadik Kakac, H.L. Heat Exchangers: Selection, Rating, and Thermal Design, 3rd ed.; Taylor & Francis Group, LLC: Boca Raton, FL, USA; London, UK; New York, NY, USA; Washington, DC, USA, 2012. [Google Scholar]
  31. Jamil, M.A.; Zubair, S.M. On thermoeconomic analysis of a single-effect mechanical vapor compression desalination system. Desalination 2017, 420, 292–307. [Google Scholar] [CrossRef]
  32. Sievers, M.; Lienhard, J.H., V. Design of Flat-Plate Dehumidifiers for Humidification–Dehumidification Desalination Systems. Heat Transf. Eng. 2013, 34, 543–561. [Google Scholar] [CrossRef] [Green Version]
  33. He, W.; Yang, H.; Wen, T.; Han, D. Thermodynamic and economic investigation of a humidification dehumidification desalination system driven by low grade waste heat. Energy Convers. Manag. 2019, 183, 848–858. [Google Scholar] [CrossRef]
  34. Sharqawy, M.H.; Antar, M.A.; Zubair, S.M.; Elbashir, A.M. Optimum thermal design of humidification dehumidification desalination systems. Desalination 2014, 349, 10–21. [Google Scholar] [CrossRef]
  35. Narayan, G.P.; Mistry, K.H.; Sharqawy, M.H.; Zubair, S.M.; Lienhard, J.H. Energy effectiveness of simultaneous heat and mass exchange devices. Front. Heat Mass Transf. 2010, 1, 1–13. [Google Scholar] [CrossRef]
  36. Wakil Shahzad, M.; Burhan, M.; Soo Son, H.; Jin Oh, S.; Choon Ng, K. Desalination processes evaluation at common platform: A universal performance ratio (UPR) method. Appl. Therm. Eng. 2018, 134, 62–67. [Google Scholar] [CrossRef] [Green Version]
  37. Jamil, M.A.; Shahzad, M.W.; Zubair, S.M. A comprehensive framework for thermoeconomic analysis of desalination systems. Energy Convers. Manag. 2020, 222, 113188. [Google Scholar] [CrossRef]
  38. Ng, K.C.; Shahzad, M.W.; Son, H.S.; Hamed, O.A. An exergy approach to efficiency evaluation of desalination. Appl. Phys. Lett. 2017, 110, 184101. [Google Scholar] [CrossRef] [Green Version]
  39. Shahzad, M.W.; Burhan, M.; Ybyraiymkul, D.; Ng, K.C. Desalination Processes’ Efficiency and Future Roadmap. Entropy 2019, 21, 84. [Google Scholar] [CrossRef] [Green Version]
  40. Shahzad, M.W.; Burhan, M.; Ng, K.C. A standard primary energy approach for comparing desalination processes. NPJ Clean Water 2019, 2, 1. [Google Scholar] [CrossRef] [Green Version]
  41. Lawal, D.U.; Antar, M.A.; Khalifa, A.; Zubair, S.M.; Al-Sulaiman, F. Experımental investigation of heat pump driven humidification-dehumidification desalination system for water desalination and space conditioning. Desalination 2020, 475, 114199. [Google Scholar] [CrossRef]
  42. Zhang, Y.; Zhu, C.; Zhang, H.; Zheng, W.; You, S.; Zhen, Y. Experimental study of a humidification-dehumidification desalination system with heat pump unit. Desalination 2018, 442, 108–117. [Google Scholar] [CrossRef]
  43. Zhang, Y.; Zhang, H.; Zheng, W.; You, S.; Wang, Y. Numerical investigation of a humidification-dehumidification desalination system driven by heat pump. Energy Convers. Manag. 2019, 180, 641–653. [Google Scholar] [CrossRef]
  44. Kabeel, A.E.; Elmaaty, T.A.; El-Said, E.M.S. Economic analysis of a small-scale hybrid air HDH–SSF (humidification and dehumidification–water flashing evaporation) desalination plant. Energy 2013, 53, 306–311. [Google Scholar] [CrossRef]
  45. El-Dessouky, H.T.; Ettouney, H.M. Fundamentals of Salt Water Desalination; Elsevier: Amsterdam, The Netherlands, 2002. [Google Scholar] [CrossRef]
  46. Panjeshahi, M.H.; Ataei, A. Application of an environmentally optimum cooling water system design in water and energy conservation. Int. J. Environ. Sci. Technol. 2008, 5, 251–262. [Google Scholar] [CrossRef] [Green Version]
  47. Rostamzadeh, H.; Namin, A.S.; Ghaebi, H.; Amidpour, M. Performance assessment and optimization of a humidification dehumidification (HDH) system driven by absorption-compression heat pump cycle. Desalination 2018, 447, 84–101. [Google Scholar] [CrossRef]
  48. El-Sayed, Y.M. Designing desalination systems for higher productivity. Desalination 2001, 134, 129–158. [Google Scholar] [CrossRef]
  49. Sharqawy, M.H.; Lienhard, V.J.H.; Zubair, S.M. Thermophysical properties of seawater: A review of existing correlations and data. Desalin. Water Treat. 2010, 16, 354–380. [Google Scholar] [CrossRef]
  50. Zubair, S.M.; Antar, M.A.; Elmutasim, S.M.; Lawal, D.U. Performance evaluation of humidification-dehumidification (HDH) desalination systems with and without heat recovery options: An experimental and theoretical investigation. Desalination 2018. [Google Scholar] [CrossRef]
Figure 1. (a) Configuration A: Brine blowdown is preheated in the dehumidifier, HDH water heater then heats the preheated brine blowdown, energy for water heater is supplied by the condensate from MSF brine heater. (b) Configuration B: Brine blowdown is preheated in the dehumidifier, vapor in the SSF then heats the preheated brine blowdown, condensate from MSF brine heater is flashed in the SSF to generate vapor for heating the preheated brine blowdown. (c) Configuration C: Brine blowdown is directly heated by water heater without preheating in the dehumidifier, cooling water is used for vapor condensation in the dehumidifier, energy for HDH water heater is supplied by the condensate from MSF brine heater. (d) Configuration D: Cooling water is used for vapor condensation in the dehumidifier, brine blowdown is preheated by cooling water leaving the dehumidifier, HDH water heater then heats the preheated brine blowdown, energy for HDH water heater is supplied by the condensate from MSF brine heater.
Sustainability 13 03506 g001aSustainability 13 03506 g001b
Figure 2. HDH model validation.
Sustainability 13 03506 g002
Figure 3. Effect of MR with used MSF brine by the HDH system at different HDH top brine temperature (Tmax) values. (a) 60 °C, (b) 70 °C, (c) 80 °C.
Sustainability 13 03506 g003aSustainability 13 03506 g003b
Figure 4. (a) Impact of MR on the gained output ratio of HDH system at different top brine temperatures, (b) effect of MR on the GOR and universal performance ratio (UPR) of hybrid HDH-MSF system at different HDH top brine temperatures.
Sustainability 13 03506 g004aSustainability 13 03506 g004b
Figure 5. (a) Variation in HDH system productivity with MR at different top brine temperatures, (b) effect of MR on the productivity of hybrid MSF-HDH system at different top brine temperatures.
Sustainability 13 03506 g005aSustainability 13 03506 g005b
Figure 6. Influence of MR on the water recovery ratio of hybrid HDH-MSF system at different HDH top brine temperatures.
Sustainability 13 03506 g006aSustainability 13 03506 g006b
Figure 7. Influence of MR on freshwater cost of HDH unit, hybrid MSF-HDH system and MSF unit.
Sustainability 13 03506 g007
Table 1. MSF plant input.
DataValue
Number of stages in heat rejection section (HRJS)3
Number of stages in heat recovery section (HRS)19
Top brine temperature, °C103
Brine blowdown temperature, °C38
Seawater temperature, °C28
Seawater salinity, ppm42,000
Seawater cooling, m3/h8920
Plant capacity, m3/h1245
Table 2. Heat exchanger input data [30,31].
ParameterValue
Chevron angle45°
Plate thickness0.0006 m
Number of passes1
Effective Channel Width0.63 m
Enlargement factor, φ1.25
All port diameters0.2 m
Compressed plate pack length0.38 m
Horizontal port distance0.43 m
Vertical port distance1.55 m
Table 3. Components capital cost correlations.
ComponentCorrelationRef.
Humidifier Z hum = 746.749 m ˙ b 0.79 R 0.57 S 0.9924 ( 0.022 T wb , out + 0.39 ) 2.447
R = T b , in T b , out   &   S = T b , in T a , out
[46,47]
Plate heat exchangersZPHX = 781 × 1.8 × A0.7514[37]
DehumidifierZdehum = 2143 × A0.514[47]
Pumps Z pump = 2100 ( W ˙ pump 10 ) 0.26 ( 1 η pump η pump ) 0.5 [47]
Blower Z blower = m ˙ a ( P Hum + P Dehum ) 0.1 ( η blower 1 η blower ) 0.7 [48]
Total CostZHDH = Zblower + Zpump + Zdehum + Zhum + ZPHX
Table 4. Comparison of MSF model results with plant parameters.
ParameterPlantModel% Error
Brine recycle flowrate11,939 m3/h11,405 m3/h4.47
Steam flowrate145 m3/h144.7 m3/h0.21
Recirculation ratio9.589.23.97
Recovery ratio0.400.3990.25
Performance ratio8.588.603−0.27
Publisher’s Note: MDPI stays neutral with regard to jurisdictional claims in published maps and institutional affiliations.

