Article

Investigation of Corrosion Rate and Rust Expansion Form of Segment Reinforcement for Shield Tunnel by Combined Action of Soil Loading, Chloride Ion and Stray Current

1
The Key Laboratory of Road and Traffic Engineering, Ministry of Education, Shanghai 201804, China
2
Shanghai Key Laboratory of Rail Infrastructure Durability and System Safety, Tongji University, Shanghai 201804, China
3
School of Transportation, Southeast University, Nanjing 211189, China
*
Author to whom correspondence should be addressed.
Sustainability 2021, 13(6), 3444; https://doi.org/10.3390/su13063444
Submission received: 9 February 2021 / Revised: 17 March 2021 / Accepted: 18 March 2021 / Published: 19 March 2021

Abstract

:
Segment reinforcement corrosion can cause bearing-capacity degradation of shield tunnel, which is unsafe for the metro operation. Therefore, a three-dimensional computational model was proposed in this paper to study the corrosion rate and rust expansion form of segment reinforcement by the combined action of soil loading, chloride ion and stray current. The results show that the arch waist segment steel corrosion rate in the middle is larger than the ends. The rust expansion form of segment reinforcement appears be an eccentric circle. The radius size and circular center are related to the non-uniform corrosion coefficient and the maximum corrosion current density.

1. Introduction

The metro is one kind of important underground vehicle in the city. As the shield tunneling method has little impact on the surrounding environment, the shield tunnel has been widely used in metro construction in places such as Tokyo, Shanghai, London and other cities [1,2,3,4]. The shield tunnel is buried deeply underground; the external loading may cause cracks on the outer surface of the shield segment [5,6,7,8]. The external erosive medium (such as chloride) can infiltrate the steel bar surface through the crack, which will induce segment reinforcement corrosion [9,10,11].
The corrosion of steel bars not only reduces the bonding performance between steel bars and concrete, but also causes concrete cracking due to corrosion expansion pressure, which seriously threatens the safety of metro operations. Chloride ions will increase the rate of electrochemical corrosion in steel bars. According to the survey results of “Shanghai Geological Environmental Bulletin” in 2014, the chloride ion content of groundwater in Shanghai is as high as 96.9 mg/L, which has an adverse effect on the structural safety of underground tunnels. Moreover, with the accumulation of leakage water and dust, the insulation effect of the metro rail to the ground gradually decreases, and the stray current leaked from the rail will accelerate segment reinforcement corrosion [12,13]. As corrosion product volume is 2–7 times that of the initial steel bar [14], the rust expansion force will easily lead to concrete cracking. During the service period, many shield tunnel intervals show reinforcement corrosion and even cause concrete cracking [15,16], which seriously threatens the safety of metro operation. In order to ensure the safety of metro operation, when reinforced concrete components have insufficient bearing capacity due to corrosion, they need to be repaired or reinforced, resulting in waste of resources. Therefore, the durability failure of reinforced concrete caused by chloride salt corrosion not only causes huge economic waste, but also brings huge pressure on resources and the environment. Sustainable development requires that concrete develops a long-life-cycle and reduces waste of resources. Therefore, in order to evaluate the safety state of a shield tunnel, it is necessary to study the reinforcement corrosion characteristic of the shield tunnel segments.
In the last 20 years, shield segment steel’s initial corrosion time and corrosion rate have been studied through numerical simulation and experiment. For example, Yang [17] proposed a finite element model for chloride ion transport in a concrete tunnel lining, setting 0.5% as the critical chloride-concentration-induced steel bar corrosion and studying the maximum allowable value of chloride diffusion coefficient for different age factors. Lei [18] analyzed the diffusion coefficient of chloride ion in the segment under load by test, setting the critical chloride concentration of rebar depassivation as the initial corrosion time and developing a calculation method for segmented concrete under the integrative effect of environmental corrosion and structural load. Li [19] designed a test of model segment to study the corrosion of a segment steel bar in corrosion solution and stray current; the results show that, for the same segment, the corrosion rate of the stirrup is bigger than for the main bar. Jin [20] analyzed the effect of a DC stray current on rebar corrosion in a cracked segment of shield tunnel; the result shows that when the stray current output locations remain unchanged, the maximum current density in the rebar under bilateral leakage is approximately from two to three times that under unilateral leakage. However, although each factor of corrosive medium, stray current and external load will affect the corrosion of the segment steel bar, only one or two kinds of factor are considered in the above work; little work has been done on shield segment steel bar corrosion under the coupling effects of three kinds of factor.
Focusing on other steel concrete structures, such as RC beams, a number of studies have been carried out on the corrosion characteristic under three kind of factors. Yoon et al. [21], Ballim and Reid [22], Malumbela et al. [23,24], Hariche [25] found that loading level has significant effects on both corrosion initiation and the rate of corrosion propagation; in their test, they all consider the effects of external load, impressed current and sodium chloride solution. In fact, the corrosion characteristics accelerated by impressed current and sodium chloride are quite different from those only accelerated by sodium chloride under a sustained load. Ye [26] adopted two accelerated corrosion methods to study the corrosion characteristics of RC beams under flexural loads; the result shows that, at the same mass loss ratio of rebar, galvanic method tends to generate lower amounts of expansive rusts around the rebar than in the artificial climate exposure method. Looking at addictions, Dong [27] analyzed the corrosion difference between tension reinforcement and stirrups under sustained loading, impressed current and sodium chloride solution; the result shows the corrosion of the tension reinforcement occurs more slowly than that of the stirrups. However, the external environment, external load and type of shield segment reinforcement are all different from the RC beams, and therefore these conclusions may not be applicable to analysis of the reinforcement corrosion characteristics of shield segment.
The current research on steel corrosion in tunnels is based on one or two factors [17,18,19,20]. The existing three-field calculation models are mostly aimed at the RC beam structure [21,22,23,24,25,26,27]. However, the structure type, external load, and stray current of the RC beam are completely different from those of the shield tunnel, which causes the rust layer of the steel bar to be different. Hence, considering the influence of external loading, stray current and chloride ion on reinforcement corrosion, a three-dimensional segment numerical model coupled with an electric–mechanical–chemical field is established in this paper, and the corrosion rate and rust expansion form of segment reinforcement are studied. The results may provide engineers with insight into the design, condition evaluation, and crack path prediction of shield tunnel.

2. Numerical Model of 3D Shield Tunnel

2.1. Segment Details

The segment outer diameter is 6.2 m and the thickness is 0.38 m. It consists of 1 seal roof block (K), 2 adjacent blocks (B1 and B2) and 3 standard blocks (A1, A2, A3); the seal roof block corresponds to the center angle of 21.5°, the adjacent block corresponds to the center angle of 68°, and the standard block corresponds to the center angle of 67.5°. The segment of inner steel is composed of main steel, longitudinal steel, stirrup and bolt hand hole steel. The main steel bar contains two rows; the main steel bar diameter is 16 mm, the longitudinal steel bar diameter is 10 mm, the stirrup diameter is 6 mm. The bolt hand hole steel bar consists of the longitudinal joint bolt hand hole steel and the ring joint bolt hand hole steel. Its diameter is 16 mm, as shown in Figure 1 and Figure 2.

2.2. Model Configuration

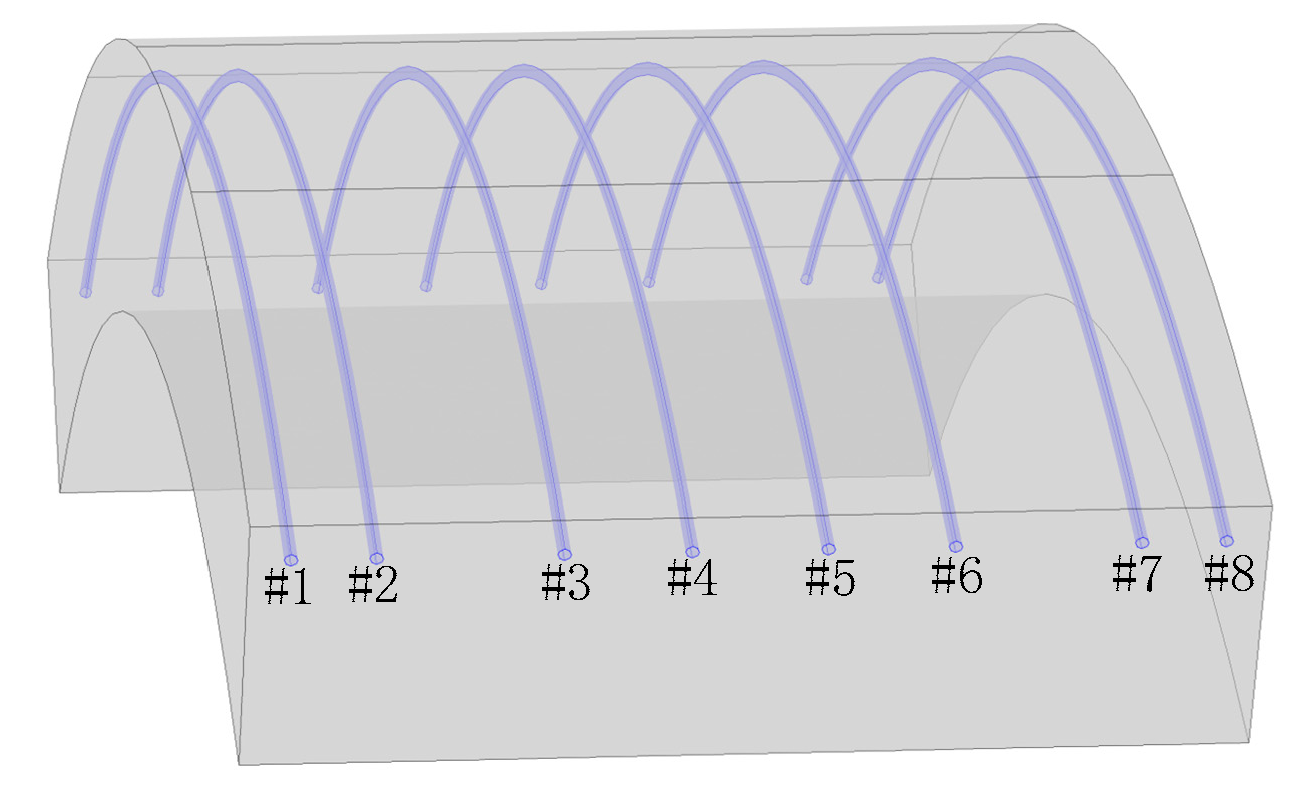
The standard block A1 is selected as the model analysis object; the joints are simplified as a flat surface and constrained displacement in the model. As the segment outside is prone to cracking under the external load, the corrosion of the main steel bars will first be caused by chloride ion diffusion through concrete cracks, then the outer row of the main steel bar is analyzed in the model. The number of outer row main steel bars is 8, the main steel bar is 50 mm from the concrete edge. The adjacent steel bars’ distance, from left to right, is: 100 mm, 200 mm, 150 mm, 160 mm, 150 mm, 200 mm, 100 mm. Each steel bar is numbered from #1 to #8, as shown in Figure 3. Both concrete and steel bars are equivalent to elastic material; the elastic modulus of concrete is 34.5 GPa, Poisson’s ratio is 0.2; the elastic modulus of concrete is 200 GPa, Poisson’s ratio is 0.3.

2.3. Boundary Conditions

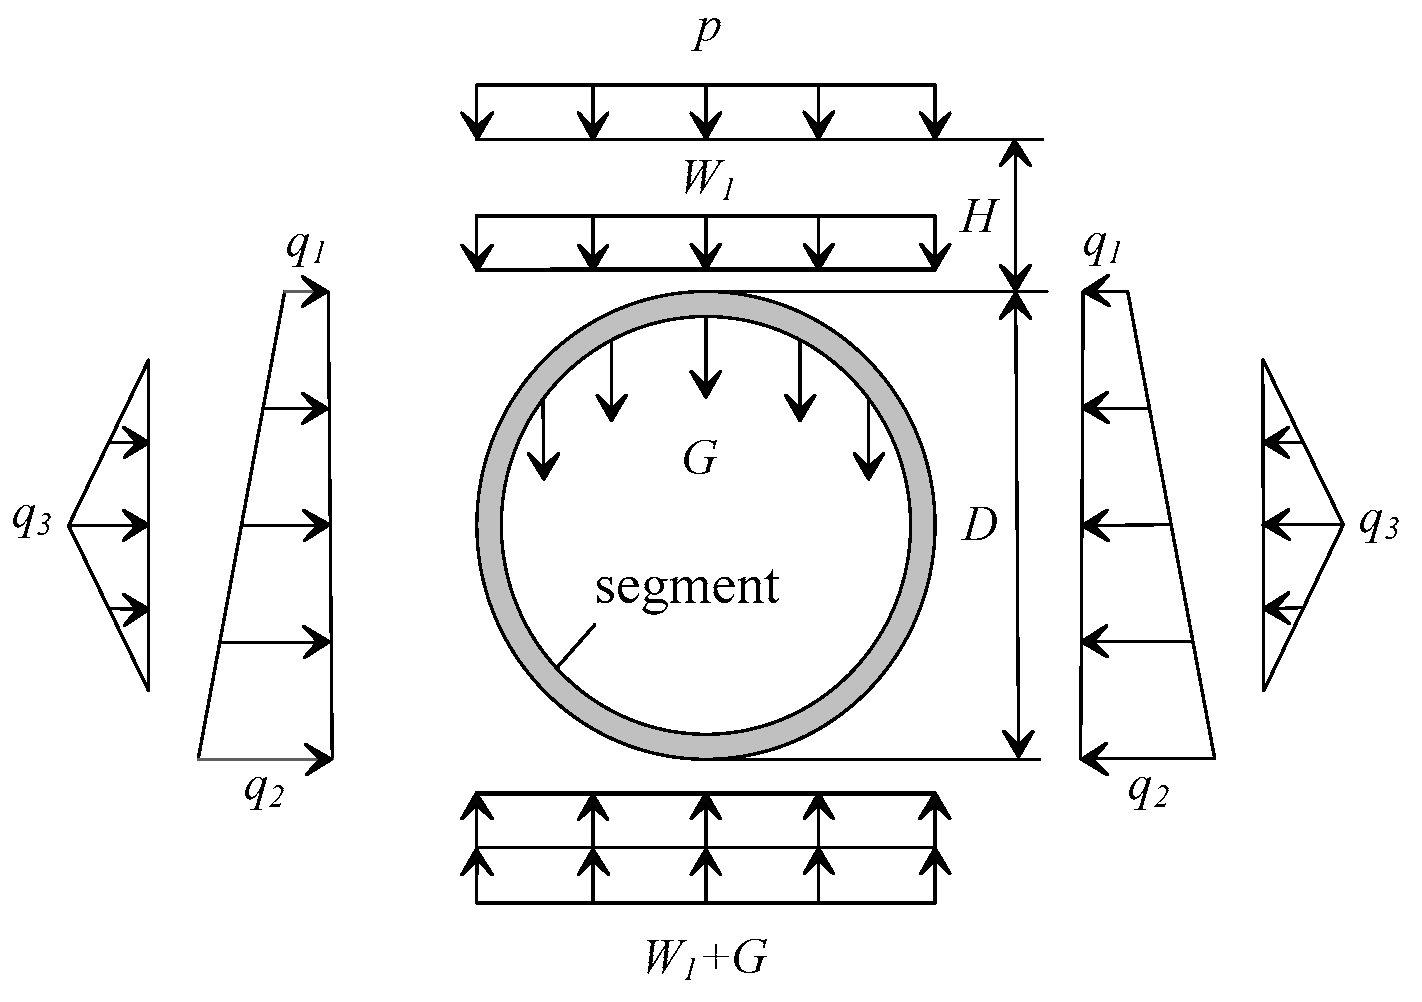
The load on the segment outside is calculated by the water and soil load model [28], as shown in Figure 4, where q1 and q2 are the horizontal water and soil pressure, G is the gravity, q3 is the horizontal soil resistance, p is the surface load, and W is the vertical water and soil pressure. Fixed constraints at both ends of the segment model, without considering the influence of surface load, the horizontal water and soil pressure and horizontal soil resistance, are applied on the arc surface of the segment. The buried depth of the shield tunnel is 12 m; the soil parameters and the load are shown in Table 1 and Table 2.
The chloride ion in the groundwater will penetrates into the interior of segment and corrosion in the steel bar. Assuming that chloride ions are uniformly distributed in the concrete, the chloride ion content value is 0.4%~0.9%, and the critical chloride content for steel bar depassivation is chosen as 0.4%, by the weight of cement [29].
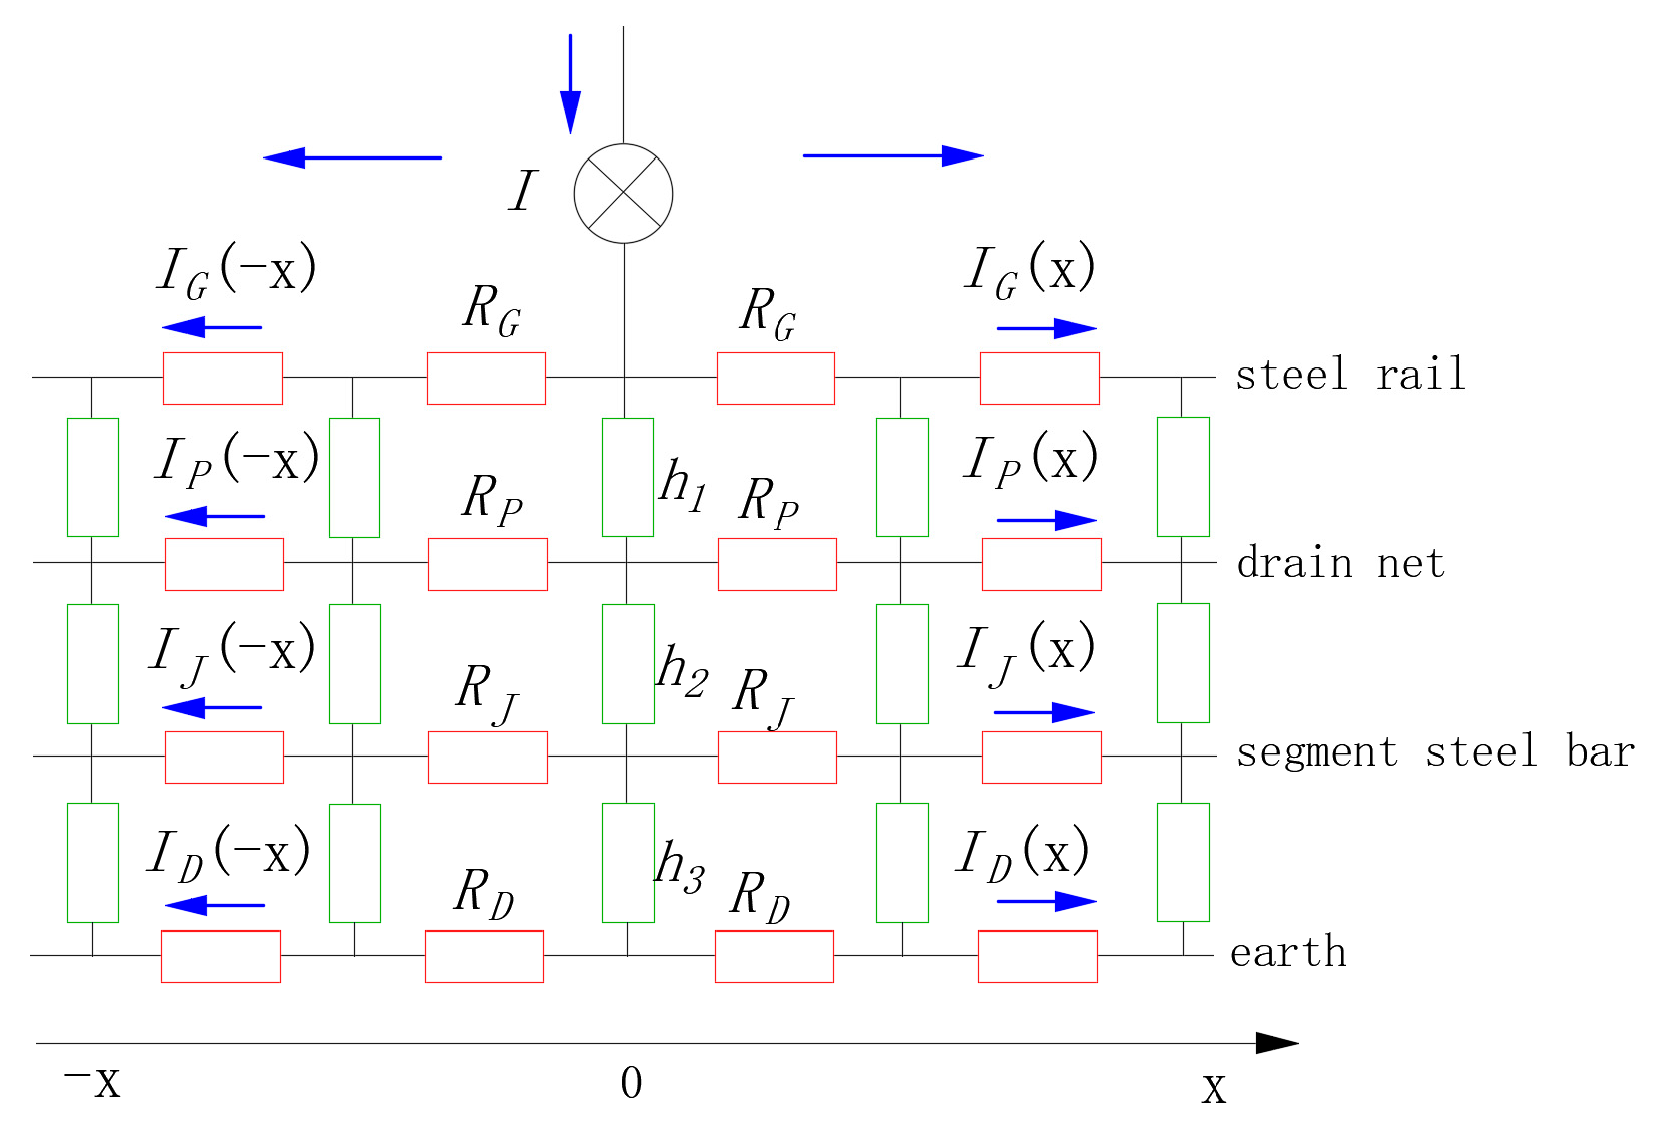
Due to the coupling of the acceleration and deceleration of multiple trains, the leakage stray current may flow in and out of the steel bar at any position. Aiming to analysis the change rule of stray current, Ogunsola [30] set up a double-layer resistance model under single-train operation. Considering that the stray current may cause the segment steel bar corrosion, a four-layer resistance of the stray current distribution model, including the segment steer bar, was developed. Taking the train location as the boundary point, the power supply section is divided into two parts; the single-power model is shown in Figure 5.
In Figure 5, RG, Rp, RG and RD are the longitudinal resistances of track, drainage network, structural steel bar and earth respectively, The h1, h2 and h3 are the transitional conductance of track, drainage network, structural steel bar and earth, respectively. UG (x), UP (x) and UJ (x) are the voltages of the track, drainage network, structural steel bar and earth, respectively. IG (x), IP (x), IJ (x), ID (x) is the current of track, drain net, structural reinforcement and earth, respectively.
According to Kirchhoff’s law of voltage and current [31], the relationship of voltage and current can be expressed as follows.
{ d U G ( x ) d x = ( R G + R D ) I G ( x ) R D ( x ) I P ( x ) R D ( x ) I J ( x ) + I R D / 2 d U P ( x ) d x = R D ( x ) I G ( x ) ( R P + R D ) I P ( x ) R D ( x ) I J ( x ) + I R D / 2 d U J ( x ) d x = R D ( x ) I G ( x ) R D ( x ) I P ( x ) ( R J + R D ) I J ( x ) + I R D / 2
{ d I G ( x ) d x = h 1 U G ( x ) + h 1 U P ( x ) d I P ( x ) d x = h 2 U P ( x ) + h 2 U J ( x ) d I J ( x ) d x = h 3 U J ( x )
After simplification, Equations (1) and (2) can be expressed as
[ U G ( x ) U P ( x ) U J ( x ) I G ( x ) I P ( x ) I J ( x ) ] = [ b 11   b 12   b 13   b 14   b 15   b 16   b 21   b 22   b 23   b 24   b 25   b 26   b 31   b 32   b 33   b 34   b 35   b 36   b 41   b 42   b 43   b 44   b 45   b 46   b 51   b 52   b 53   b 54   b 55   b 56   ] [ C 1 e λ 1 x C 2 e λ 2 x C 3 e λ 3 x C 4 e λ 4 x C 5 e λ 5 x C 6 e λ 6 x ] + [ f 1 f 2 f 3 f 4 f 5 f 6 ]
Considering that the subway operation system is controlled by several traction substations, in order to make the model more realistic, the multi-power model was developed, as in Figure 6. In the model, a train is equivalent to a current supply, the current injected by the traction substation is negative and the current injected by the train is positive. It is assumed that the running line is one-way, and the regenerative braking of trains is not considered.
In the Figure 6, IQ1~IQs is the injection current of s substations, ID1~IDk is the injection current of k trains, dQ1~dQs is the distance between the s substations and the starting point, and dD1~dDk is the distance between k trains and the starting point. Assume that the location of the train’s starting point on the line is x = 0. Taking the injection current location as the cut-point, the whole line is divided into several sections, with the UJ expression as
0 x < d D 1 :
U J ( x ) = i = 1 k j = 1 6 [ C j ( I D i ) b 3 j e λ j ( d D i x ) + f 3 ( I D i ) ] + i = 1 s j = 1 6 [ C j ( I Q i ) b 3 j e λ j ( d Q i x ) + f 3 ( I Q i ) ]
d D 1 x < d Q 1 :
U J ( x ) = j = 1 6 [ C j ( I D 1 ) b 3 j e λ j ( x d D 1 ) + f 3 ( I D i ) ] + i = 2 k j = 1 6 [ C j ( I D i ) b 3 j e λ j ( d D i x ) + f 3 ( I D i ) ] + i = 1 s j = 1 6 [ C j ( I Q i ) b 3 j e λ j ( d Q i x ) + f 3 ( I Q i ) ]
Followed by analogy d D K x L :
U J ( x ) = i = 1 k j = 1 6 [ C j ( I D i ) b 3 j e λ j ( x d D i ) + f 3 ( I D i ) ] + i = 1 s j = 1 6 [ C j ( I Q i ) b 3 j e λ j ( x d Q i ) + f 3 ( I Q i ) ]
The parameters of resistance and conductance in the calculation model are assumed as follows: RG is 0.0115 Ω/km, RP is 0.04 Ω/km, RJ is 0.02 Ω/km, RD is 0.002 Ω/km, H1 is 0.125 S/m, H2 is 0.3 S/m.
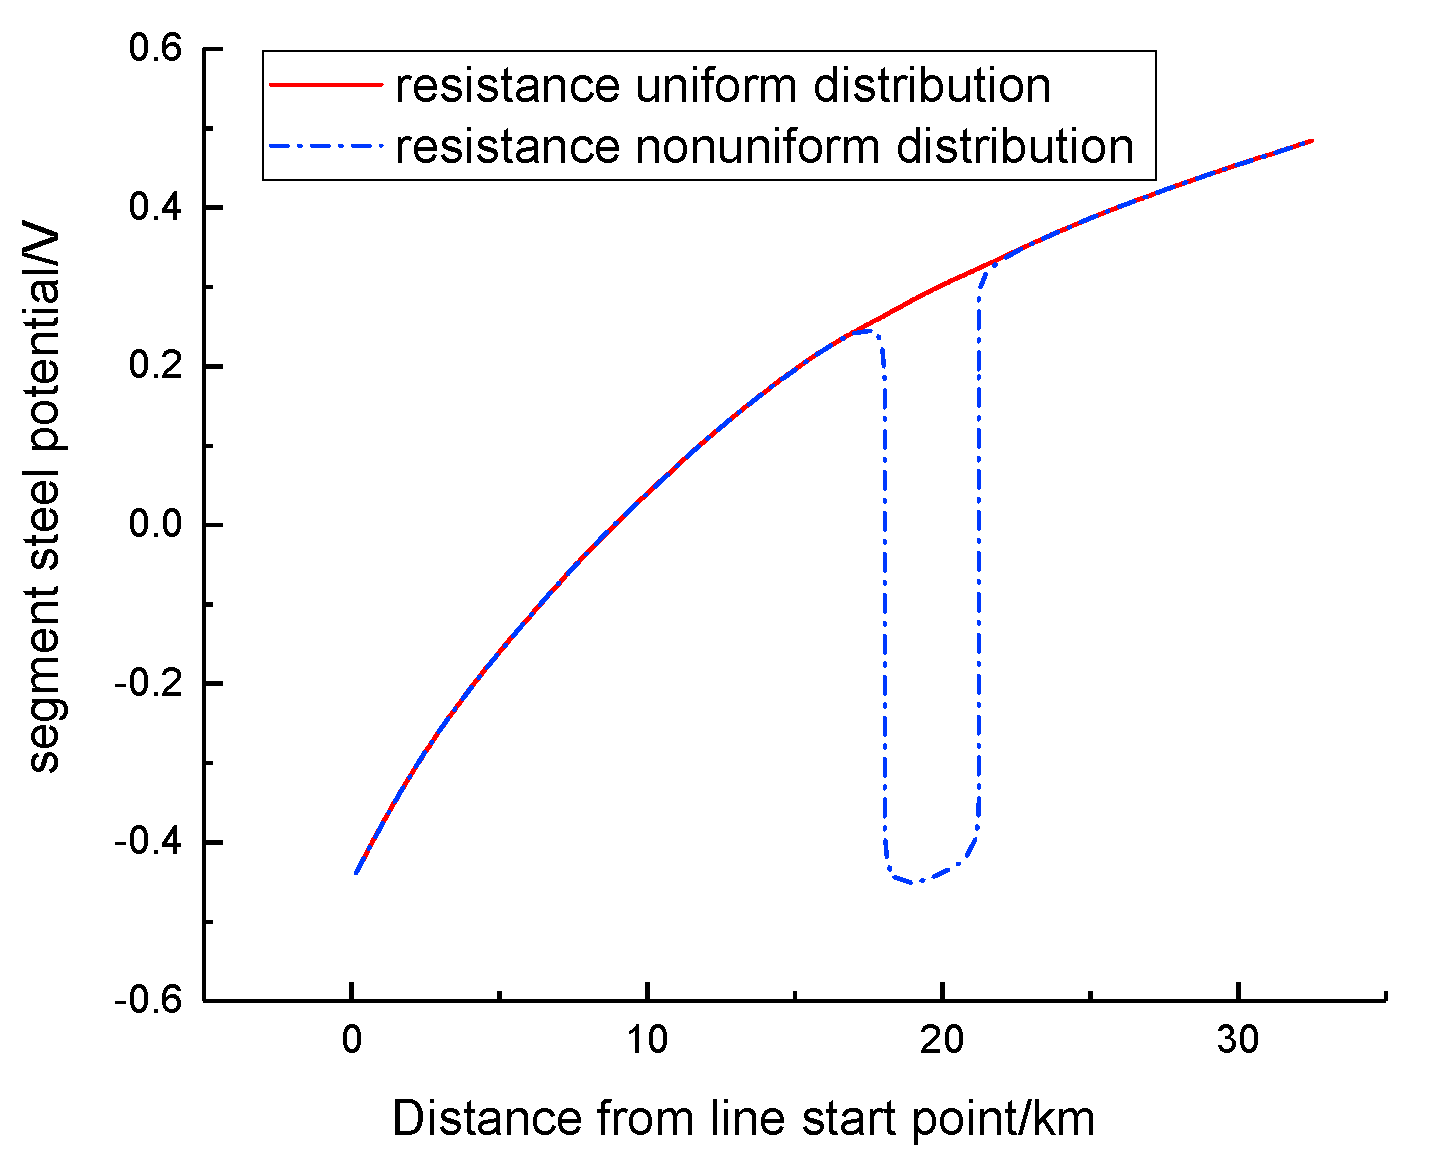
As the aging of insulation devices and the leakage water appear on the ballast bed during the metro service period, the resistance of individual intervals will change greatly. It is assumed that the longitudinal resistances of drainage network increased from 0.125S /m to 50 S/m between 18 m and 21 m, due to the leakage water. Through numerical simulation, the distribution of segment steel potential is shown in Figure 7.
From Figure 7, it can be seen that when the resistance is not uniform, the potential of segment steel will change greatly. Considering the difference in steel bar corrosion rates under different area ratios of cathode to anode, four types of area ratios can be chosen to study the main steel bar corrosion of standard block A1, as shown in Table 3. The external applied voltage of the anode steel is 0.2~0.4 V, and the external applied voltage of the cathode steel is −0.4 V~−0.2 V.

2.4. Segment Steel Corrosion Process

When the segment steel reinforcement is depassivated, the corrosion of reinforcement can generally be described by the following reactions:
(a)
Dissolution of iron at the anodic sites:
F e F e 2 + + 2 e
(b)
Reaction of dissolved oxygen in the pore water with the electrons on the cathode:
O 2 + 2 H 2 O + 4 e 4 O H
(c)
Transport of hydroxyl ions to the anode, where corrosion products forms:
F e 2 + + 2 O H F e ( O H ) 2 4 F e ( O H ) 2 + 2 H 2 O + O 2 4 F e ( O H ) 3

2.4.1. Oxygen Diffusion and Consumption

When the segment external load is within the design load range, the external surface does not show macro-cracks, and the external load mainly affects the diffusion behavior of oxygen by changing the segment concrete porosity. The diffusion of oxygen can be expressed by the Fick diffusion law
C O 2 t = ( D O 2 C O 2 )
where C O 2 is oxygen concentration in pore solution, where D O 2 is effective oxygen diffusion coefficient. Note that the convective part is neglected, due to the assumption that the water saturation of concrete is uniform.
The consumption of oxygen in the cathodic regions of the steel surface is considered as an internal boundary condition for the oxygen diffusion problem, and is governed by
C O 2 n = i O 2 4 F D O 2
where i O 2 is the cathodic current density, and F is the Faraday’s constant (9.65 × 10⁴ C/mol).
The effective oxygen diffusion coefficient is mainly affected by the porosity of concrete and relative humidity. Papadakis [32] et al. have proposed the following effective oxygen diffusion coefficient, which is also used in the present model:
D O 2 = 1.92 × 10 6 p 1.8 ( 1 R H / 100 ) 2.2
where RH is the relative humidity. IThis is taken as RH = 0.7, and p is the porosity of water-saturated cement paste, as the p will change under external loading. Du [33] analyzed the relationship between the external loading (i.e., the volumetric strain) and porosity of water-saturated cement paste; the model is:
{ p = p 0 1 ε v [ 1 ( 3 λ + φ ) Θ φ + 3 λ p 0 ] 3 Θ = 1 1 ε v 3 λ = K m K w φ = 3 K m + 4 μ m
where the Km and μm mean the bulk and shear modulus of the cement paste matrix, respectively, which is taken as Km = 22.5 GPa, μm = 11.8 GPa [33]. The Kw means the bulk modulus of the pore-water, which is taken as Kw = 2.25 Gpa [34], where the εv is volumetric strain, and the p0 means the initial porosity, which is taken as p0 = 0.3 [35].

2.4.2. Polarization of Anode and Cathode

According to Butler–Volmer’s kinetics, the model kinetics of the reaction at the anode and cathode on the surface of the steel bar are:
i F e = i F e 0 e 2.3 ( Φ Φ F e 0 ) / β F e
i O 2 = i O 2 0 C O 2 C o b e 2.3 ( Φ O 2 0 Φ ) / β O 2
where the i F e and i O 2 mean the anodic current density and cathodic current density, respectively. The i F e 0 and i O 2 0 mean the exchange current density of the anodic reaction and cathodic reaction, respectively. The β F e and β O 2 mean the Tafel slope for anodic reaction and cathodic reaction, respectively. The Φ means the electric potential in the pore solution near reinforcement surface. The Φ F e 0 and Φ O 2 0 are the anodic equilibrium potential and cathodic equilibrium potential, respectively. The C o b is oxygen concentration at boundary surface of concrete; the inner surface of the segment is connected with the atmosphere, and the content of oxygen is 0.0085 kg/m3 [35]. As the oxygen content in the soil is lower than that of the atmosphere, it is assumed that the content of oxygen at the outer surface is 0.7 times that of the inner surface, where the content of oxygen at the outer surface is taken as 0.006 kg/m3. The reference concrete resistivity is taken as 140 Ω m [35]. Other related parameters used in the analysis are presented in Table 4 [36].
When the segment steel bar electric potential is affected by a stray current, the electric potential in the pore solution near the reinforcement surface will be shifted, as follows
Φ = Φ e x t Φ 1
where the Φ e x t is the voltage applied on the segment steel bar affect by the stray current, and Φ 1 is the potential at the concrete–steel bar interface [35].
The corrosion rate of the steel bar mainly depends on the corrosion current density of the anode, and the effect of chloride ion on the corrosion current density is reflected in the anode potential of the steel bar and the Tafel slope of the anode. By analyzing the experimental data, Hussain [37] gives the relationship between the chlorine ion and the anode potential and Tafel slope.
After the threshold chloride ion content is reached and the passive layer is completely destroyed, both the anodic Tafel slope and anodic potential are influenced by chloride ion content. Hussain [37] presents a model of the free chlorine ion content and the anodic Tafel slope with anodic potential
β a = ( 2.303 R T 0.5 z F e F ) f p
f p = 3.17 × 10 2 C c l , f 0.826
φ F e = φ F e Θ + R T z n F l n C F e 2 + F C l
F C l = 1 + 3 × 10 3 l n ( 10 4 × C c l , f + 1 ) + 1.2 C C l , f C C l , f + 1
where the φ F e is a non-standard anodic electrode potential, φ F e Θ is standard anodic electrode potential, R is gas constant, F is Faradays constant, T is absolute temperature, z n is the number of electrons taking part in the reaction, C F e 2 + is the concentration of Fe2+ in moles per liter of electrolyte, and C C l , f is free chlorine ion content. Substituting [37], then φ F e Θ = 0:44 V, R = 8.314 J/°K, F = 96487 C, T = 25 °C, z n = 2, C F e 2 + = 1.65 × 10⁻⁴ mol/L.

3. Corrosion Rate of the Steel Bar Surface

3.1. Corrosion Rate of Steel Bar under Different Area Ratios of Cathode to Anode

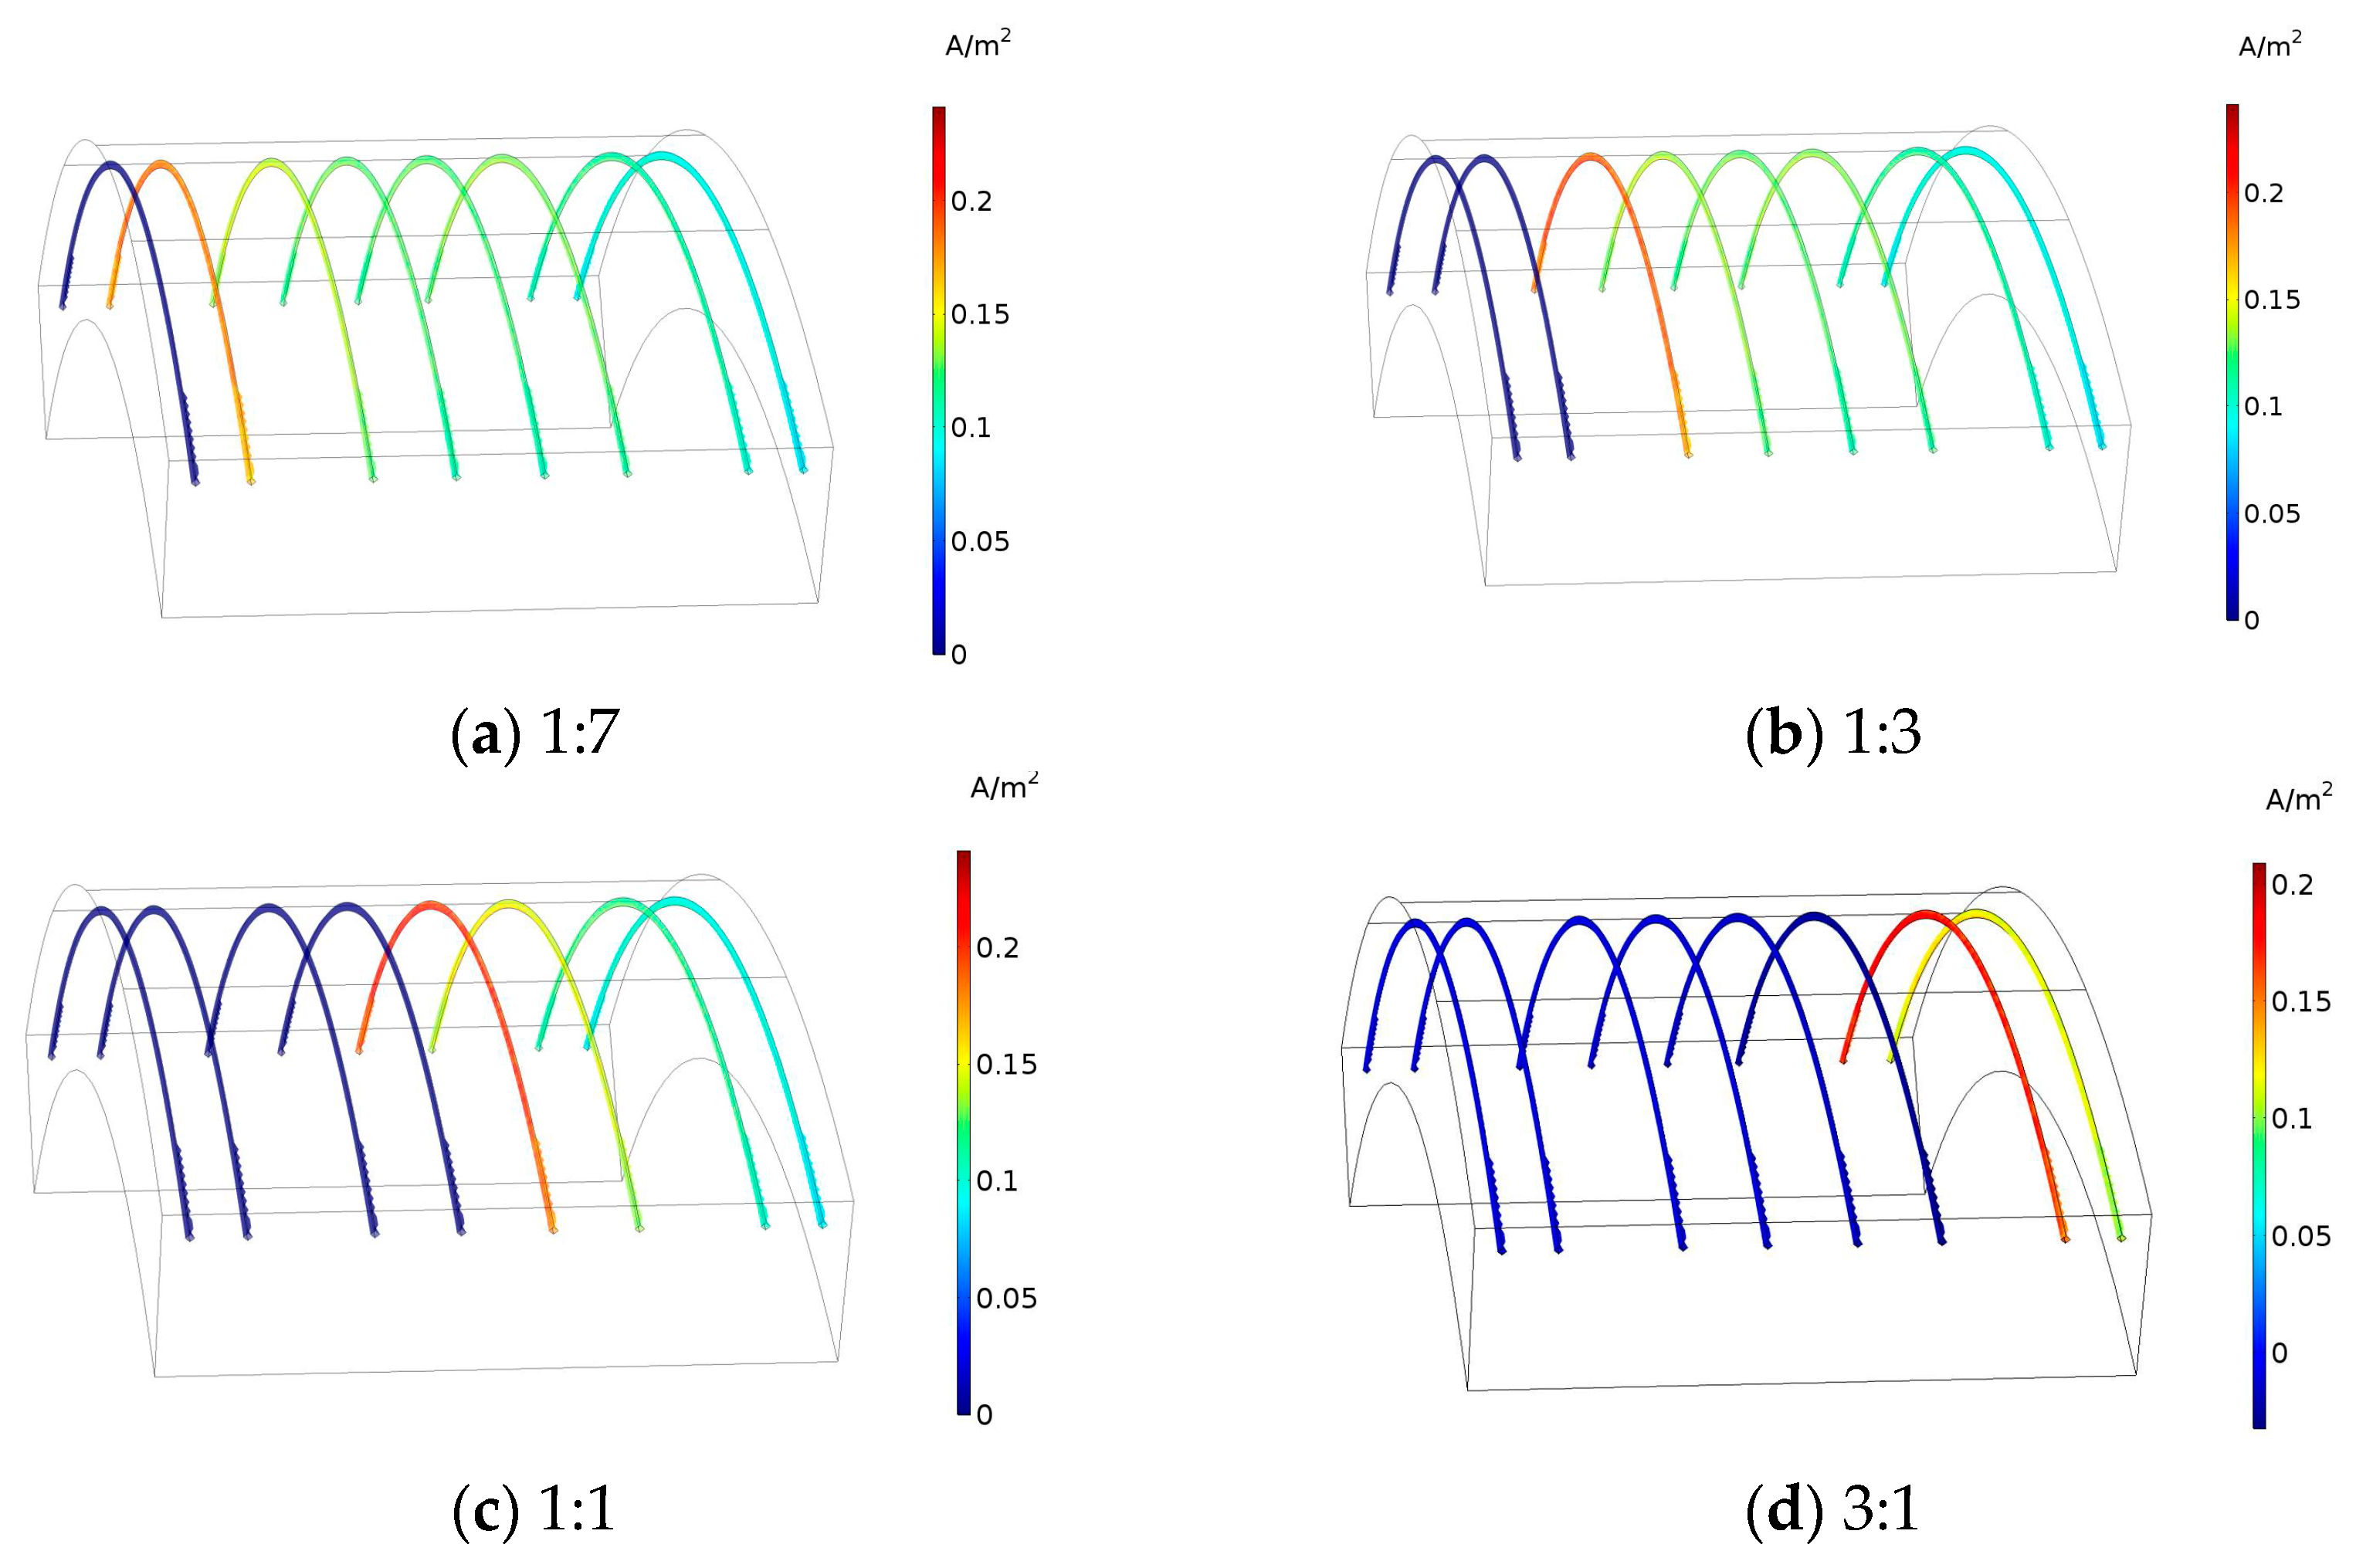
Figure 8 is the corrosion current density distribution of the steel bar under different area ratios of cathode to anode; the chloride ion content value is 0.4%, and the external potentials of steel bar at anode and cathode are 0.4 V and −0.4 V, respectively. The drawing process is as follows: Use AutoCAD software to establish a geometric model——>Import the geometric model into the COMSOL software for multi-field coupling calculations——>Construct three physical fields of solid mechanics, secondary current distribution, and the transfer of dilute substances in the COMSOL software——>Perform coupling calculations——>Obtain the corrosion current density distribution of anodic steel under different area ratios of cathode to anode——>Hide the outer contour of the segment——>Show the current density of the inner steel bar.
It can be seen from that the closer the cathode to the anode distance, the larger the corrosion rate of anode steel, and the corrosion current density of the anodic steel bar is between 0.05 and 0.25 A/m2.
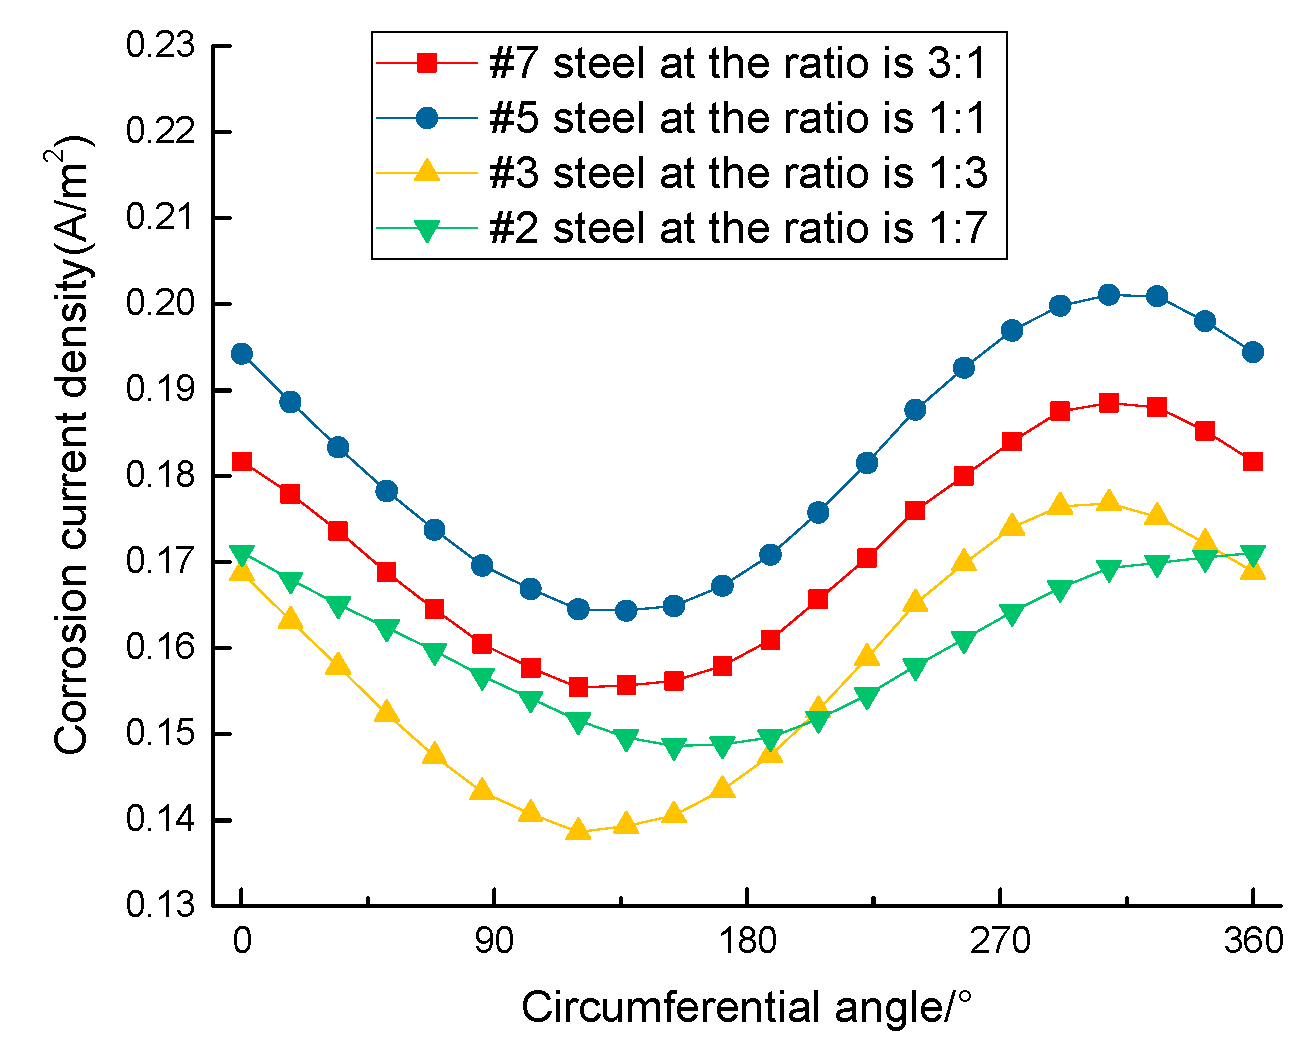
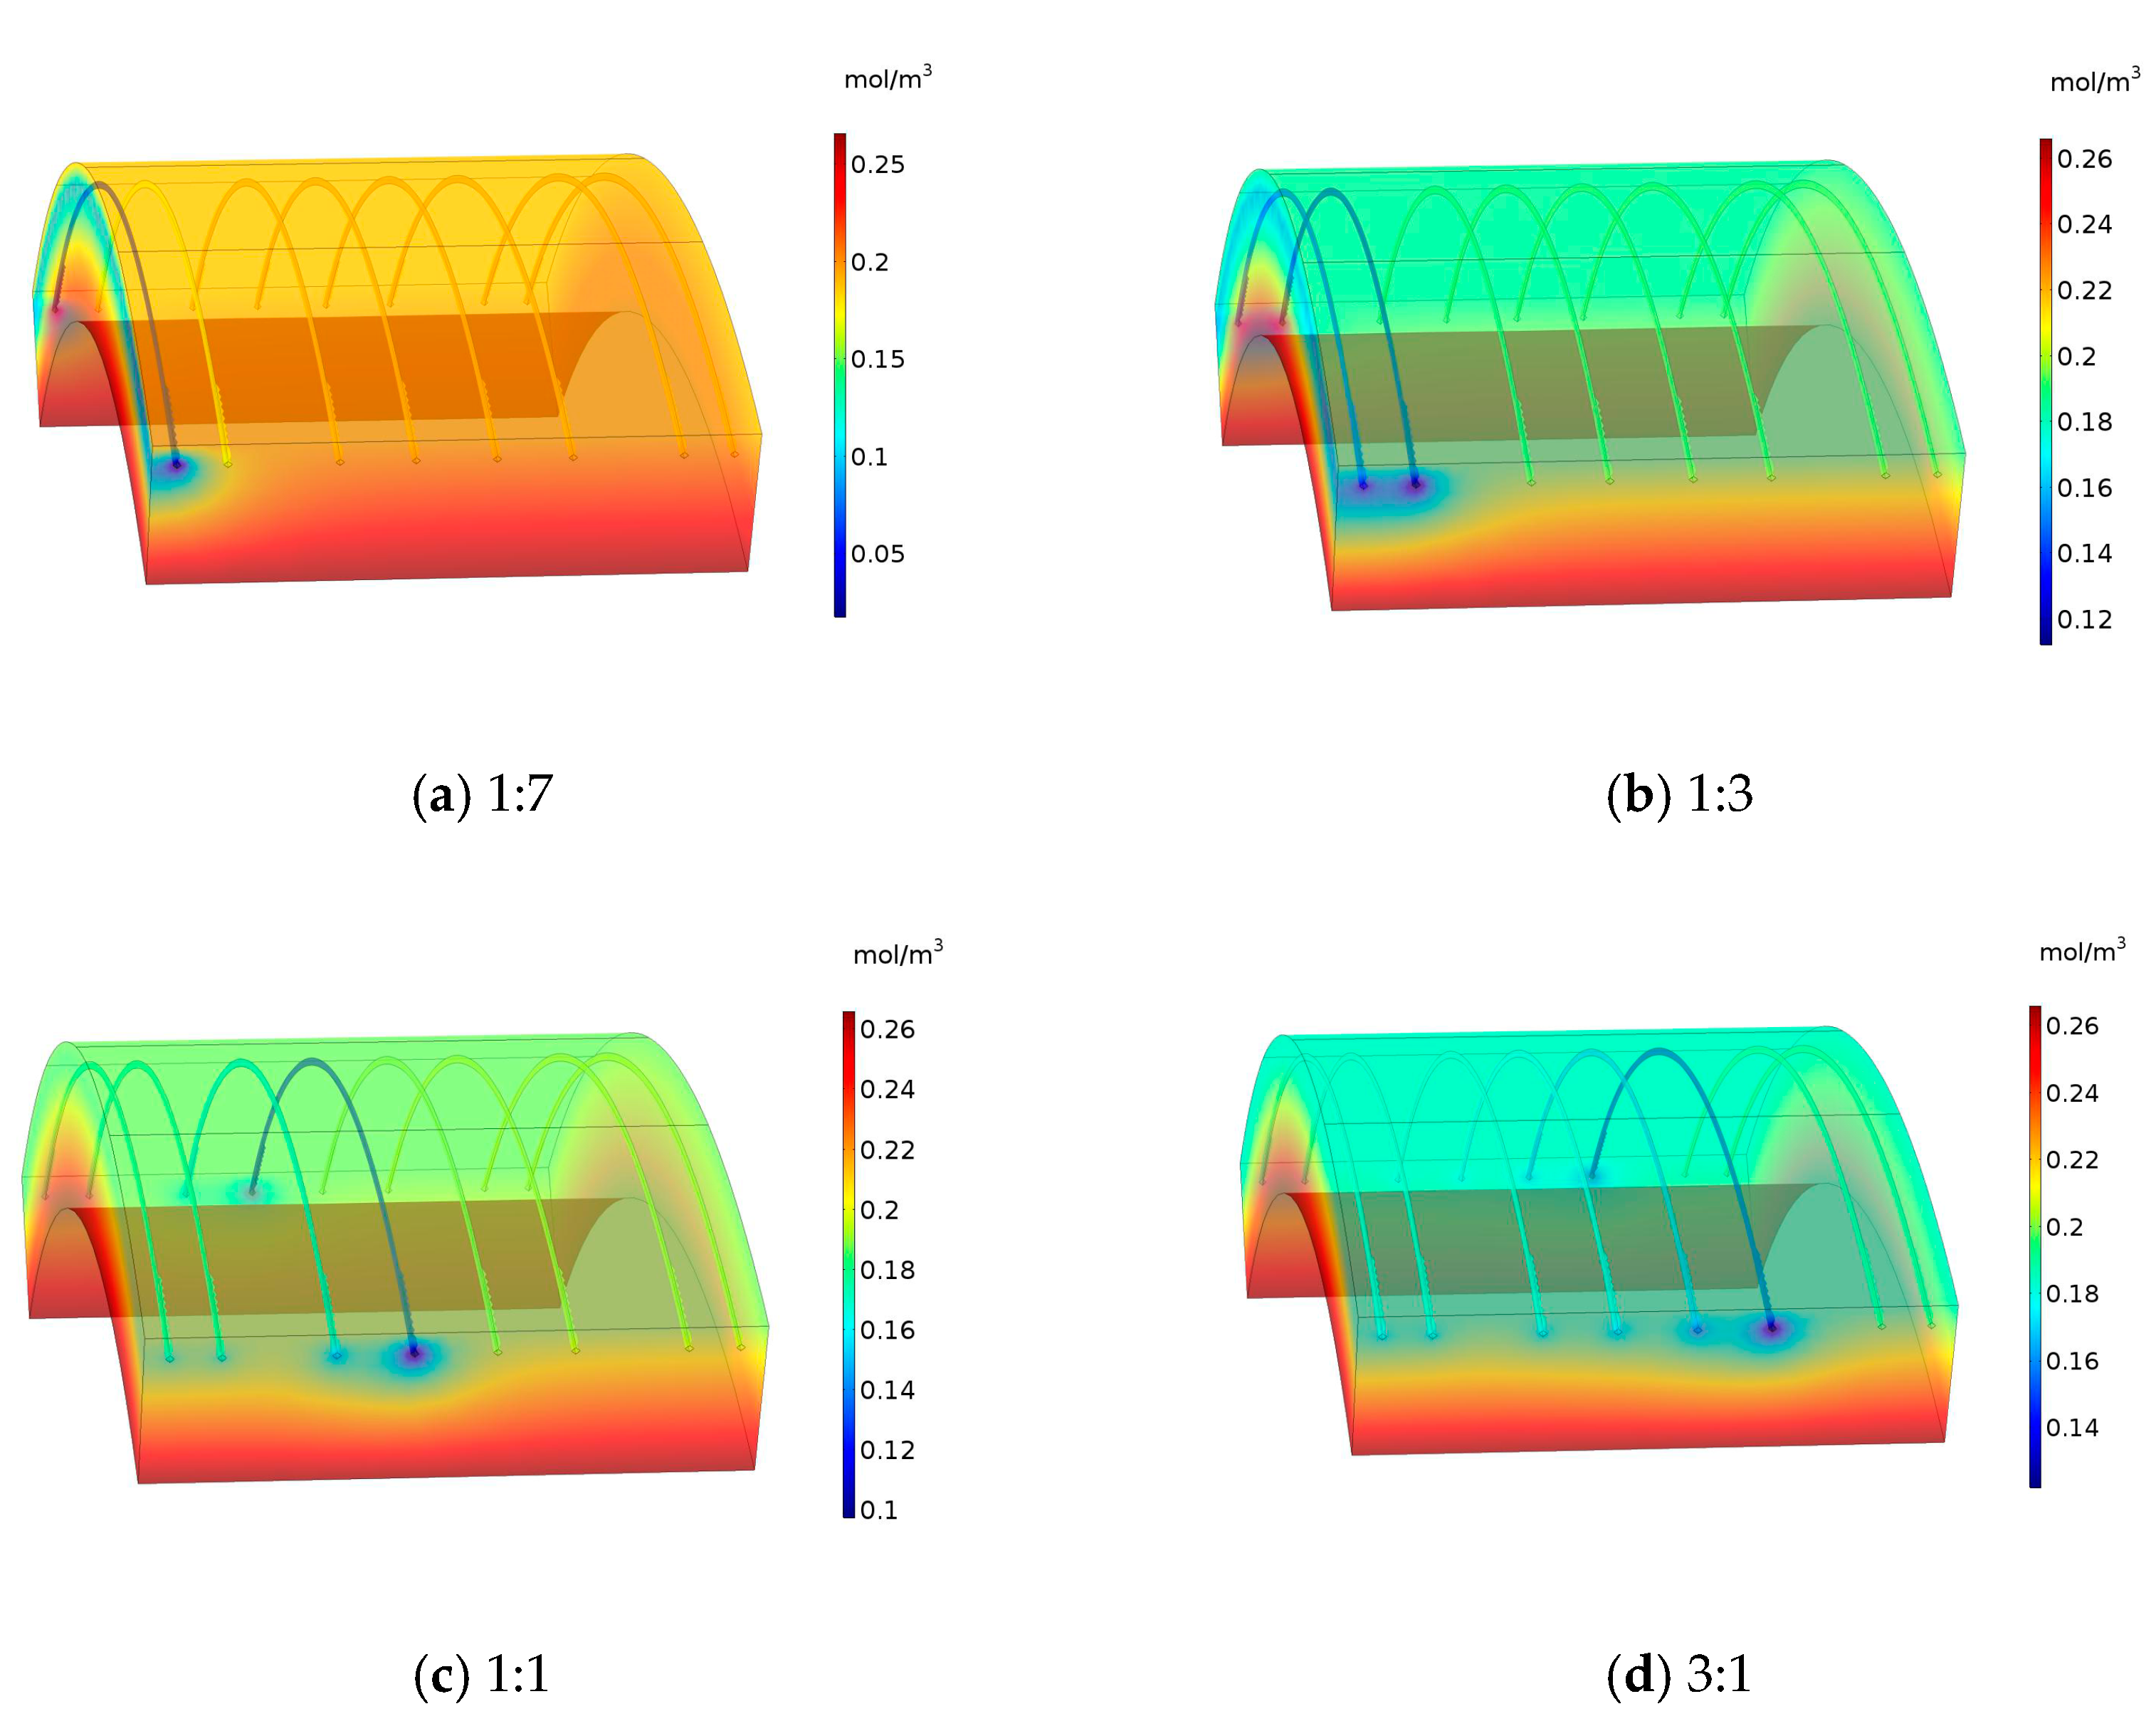
Figure 9 is the corrosion current density change curve of the anodic steel bar nearest the cathode under different area ratios of cathode to anode; the direction of the steel bar nearest the outer surface of the segment is set as 0°, and the degree is gradually increased along the clockwise direction. This shows that when the area ratio of the cathode to anode is 1:1, the corrosion current density is the largest, and the follow rate of 3:1, 1:3, 1:7 decreases in turn. It can be found that when the distance between cathode and anode bars is constant, the smaller the anode area is, and the larger the steel bar corrosion current density is. When the distance is reduced, the corrosion current density will rise. The reason for this is that once the distance between the cathode and anode becomes greater, the resistance of the oxidation-reduction reaction also increases, as shown in Figure 10. The closer the anode steel bar is, the more oxygen consumption will be seen on the surface of the cathode steel bar.
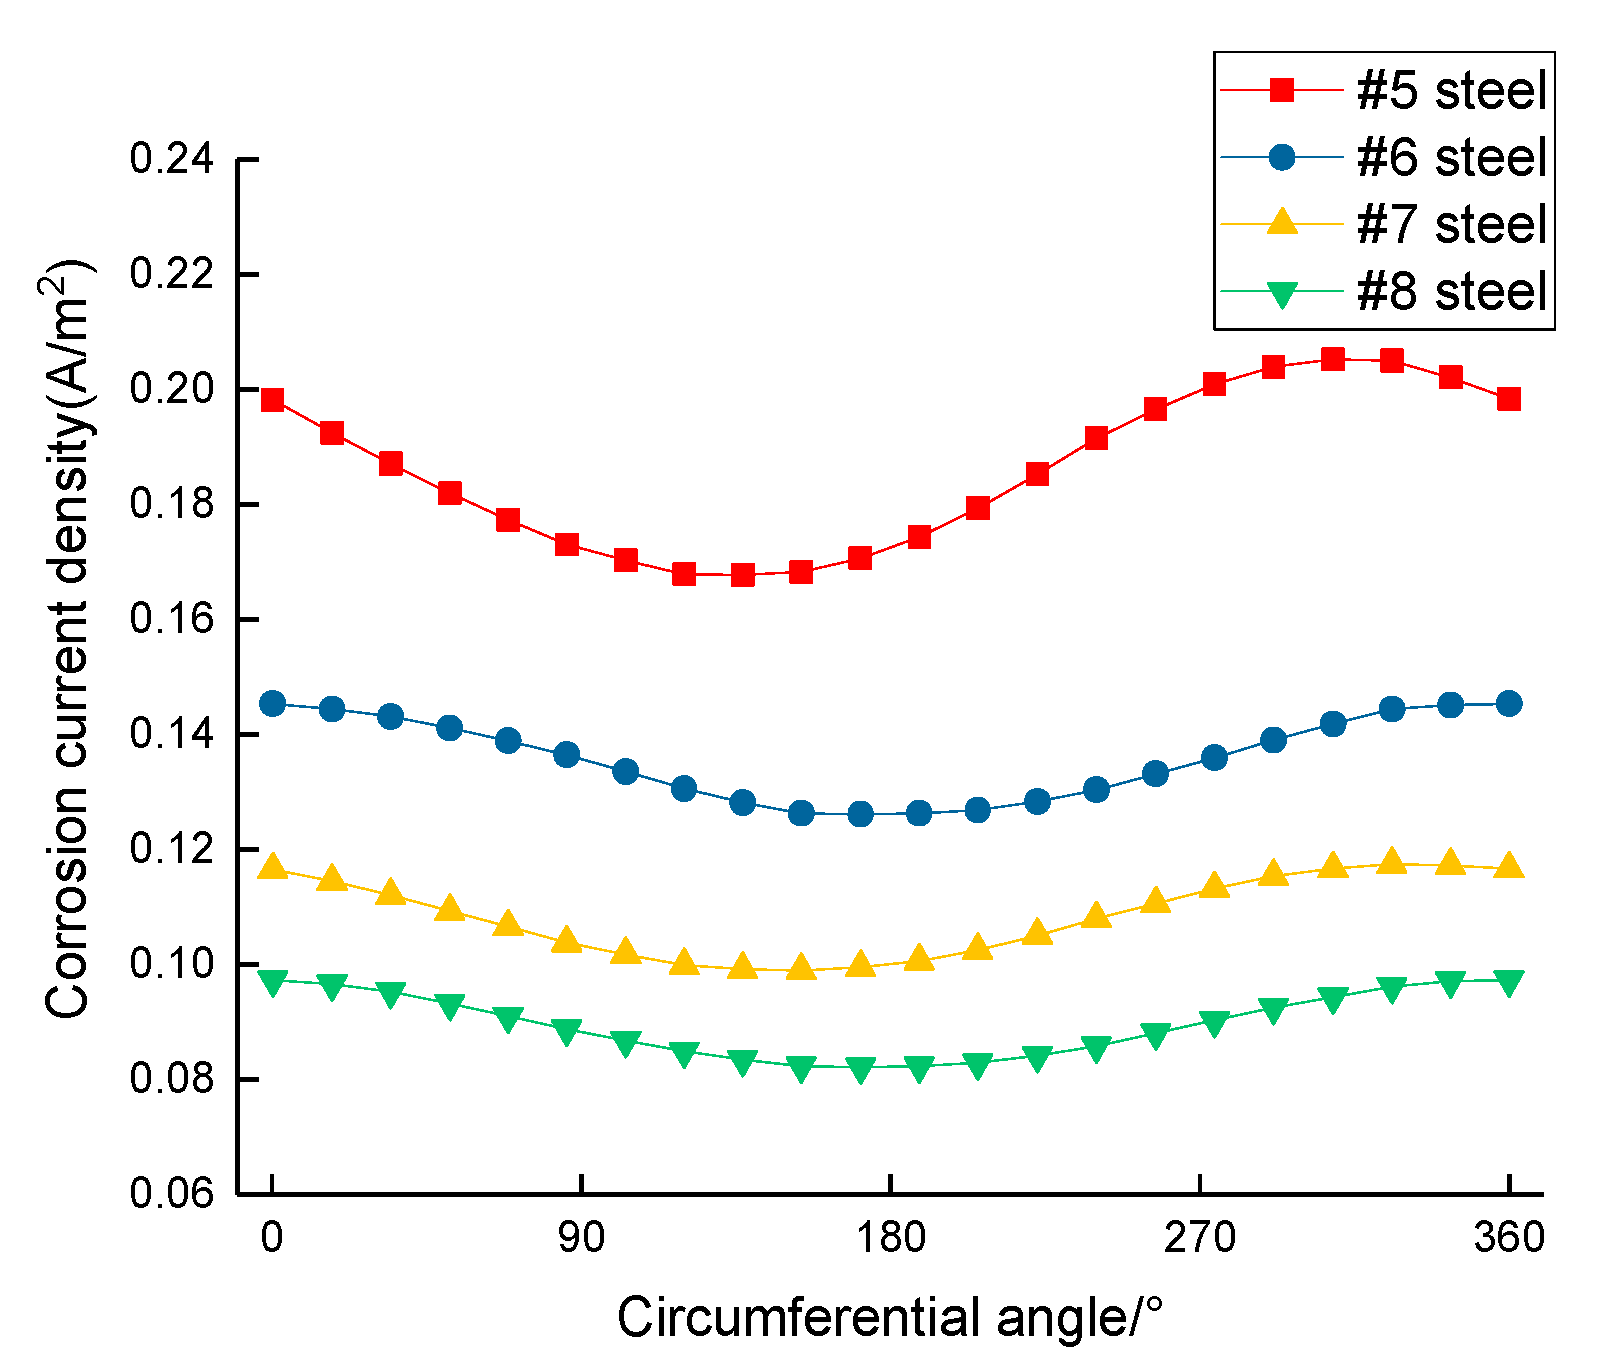
Figure 11 is the corrosion current density curve of different steel bars in the circumferential direction when the area ratio of cathode to cathode is 1:1, and the corrosion current density in the interval of 90°~270° degrees is less than 0°~90° and 270°~ 360°. It is shown that the corrosion rate near the outside of the segment is greater than the corrosion rate near the inside of the segment, and the closer the distance from the cathode steel bar, the larger the anode steel bar corrosion current density. The angle of the maximum corrosion current density is concentrated between 308° and ~360°, and the angle of the minimum corrosion current density is concentrated between 128° and ~180°.
In order to characterize the difference in different steel bar corrosion forms on the cross-section, using the non-uniform corrosion coefficient k and the corrosion deflection θ to measure steel bar shape change. The k is the ratio of the minimum corrosion current density to the maximum corrosion current density in the steel bar circumferential direction. The vertical line is defined as the shortest distance through the center of non-corroded main steel bar and segment outer surface, the slant line is defined as the connection line of the maximum corrosion current density point and the steel bar center, and the θ is the deflection between the vertical line and slant line.
Table 5, Table 6 and Table 7, respectively, show the k, θ and the maximum corrosion current density of different steel bars at different area ratios of cathode to anode; it can be seen from the table that the k nearest to the anode steel bar is the minimum, the k of different steel bar is mainly distributed between 0.81 and 0.87, and the maximum non uniform corrosion coefficient is 1.07 times the minimum non-uniform corrosion coefficient. The maximum corrosion current density of steel bar is distributed between approximately 0.1 and 0.2 A/m2, the minimum corrosion current density is 0.5 times the maximum corrosion current density, and the maximum corrosion current density and θ are all distributed between approximately 0° and 52°.
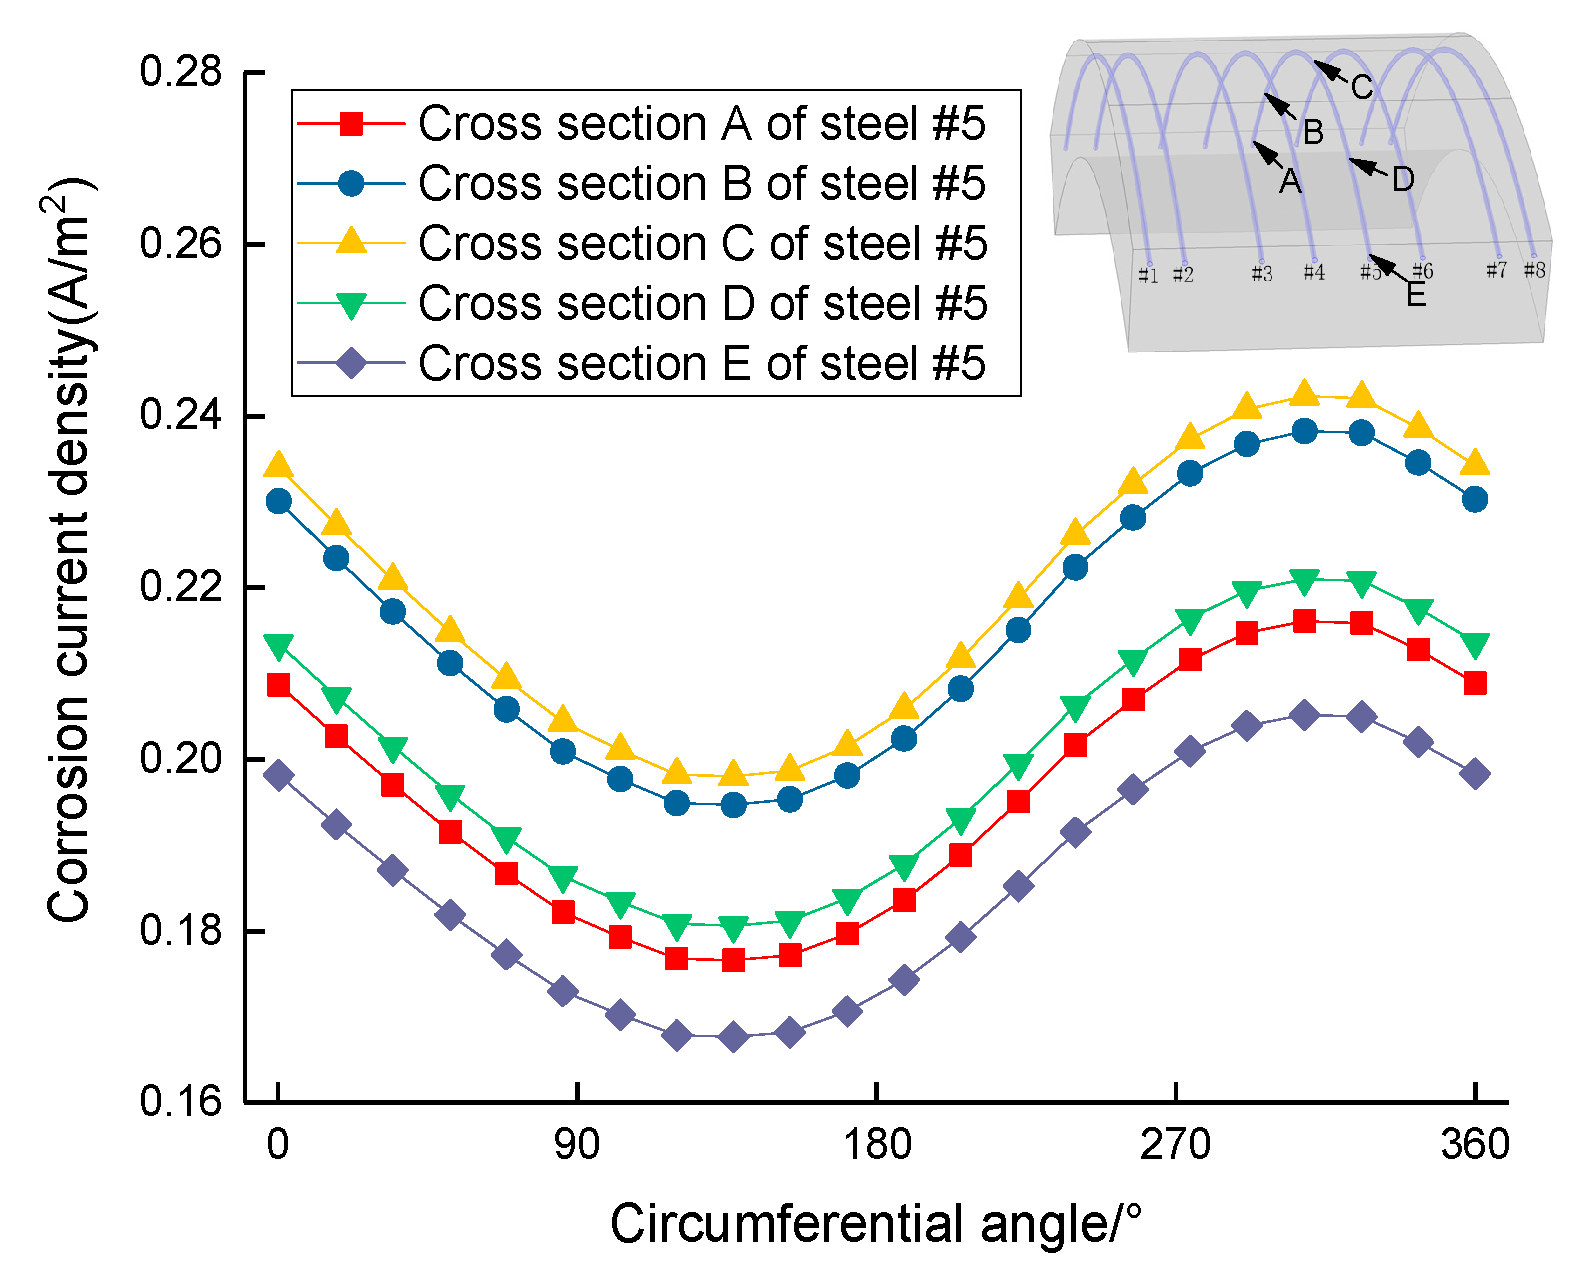
As the rate of oxygen diffusion is related to concrete volumetric strain, it is can be seen from Figure 12 that the corrosion current density at the middle segment of the steel is the largest, while the corrosion current density at the end of the steel is smaller. The current density in the cross-section C is 1.22 times the cross-section A and 1.16 times the cross-section E. Due to the volume strain, the segment under external load was changed, as shown in Figure 13, and the volume strain in middle of the inner arc is slightly larger than the two ends, but the volume strain in the middle of the segment’s outer arc is less obvious than the two ends. Therefore, the oxygen diffusion rate at the end of the segment is smaller than the middle part, and the corrosion rate at the end of the segment is relatively low.

3.2. Corrosion Rate of Steel Bar under Different Content of Chloride Ion

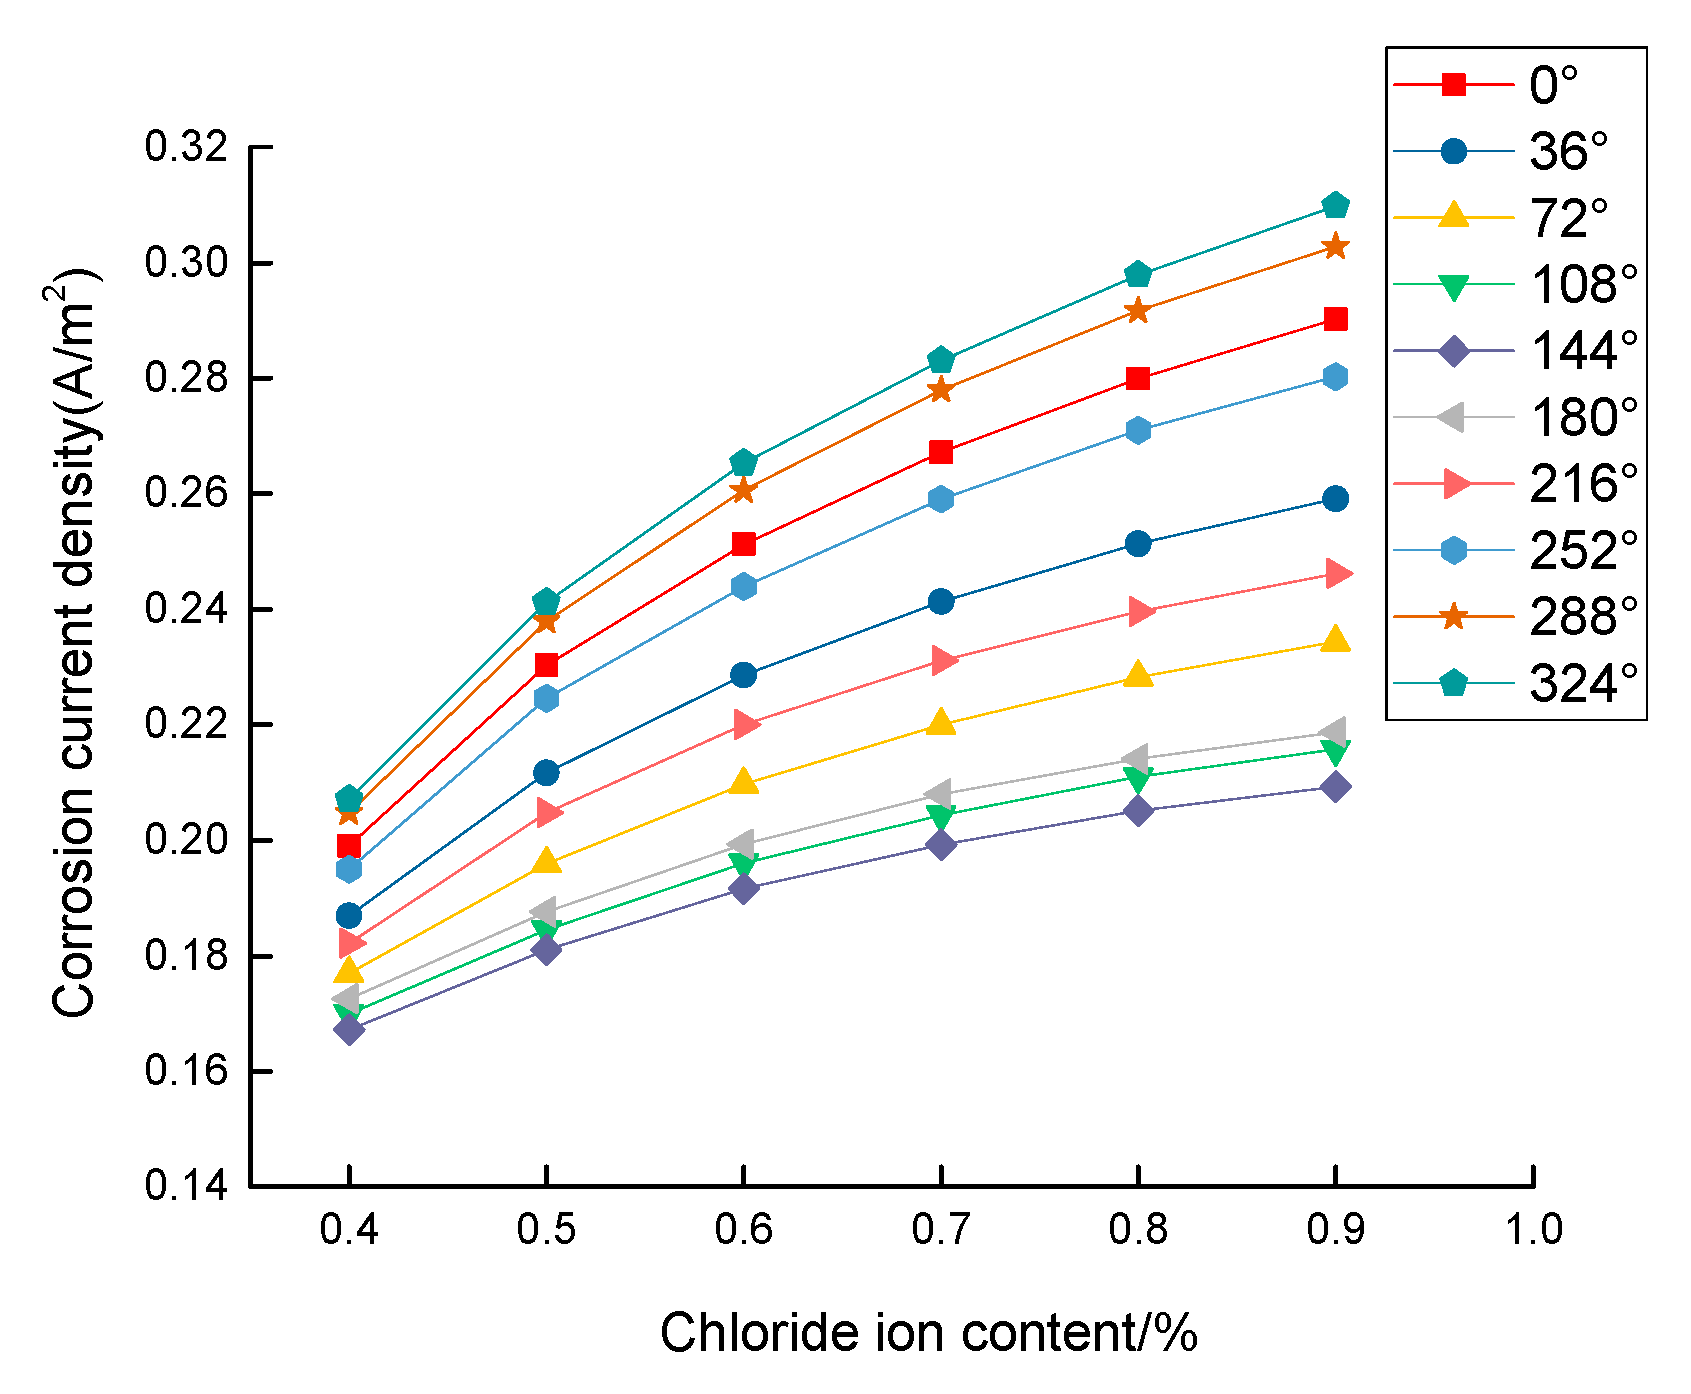
Figure 14 shows the relationship between the chloride ion content and corrosion current density of a # 5 steel bar at different angles when the area ratio of cathode to cathode is 1:1, the external potential of anode steel bar is 0.4 V, and the cathode steel bar is −0.4 V. Figure 14 shows that the steel bar corrosion current density become larger nonlinearly as the chloride ion content increases, but the angle of the maximum corrosion current density does not change, which indicates that an increasing chloride ion content will not change deflection θ. Taking # 5 steel bars as an example, through fitting, the relationship between the maximum corrosion current density and chloride ion content are as follows
y = 0.12 l n ( x ) + 0.32
where x is the content of chloride ion in the segment, ≥0.4%; y is the maximum corrosion current density of the segment steel bar. The R2 value of Equation (18) is 0.989.
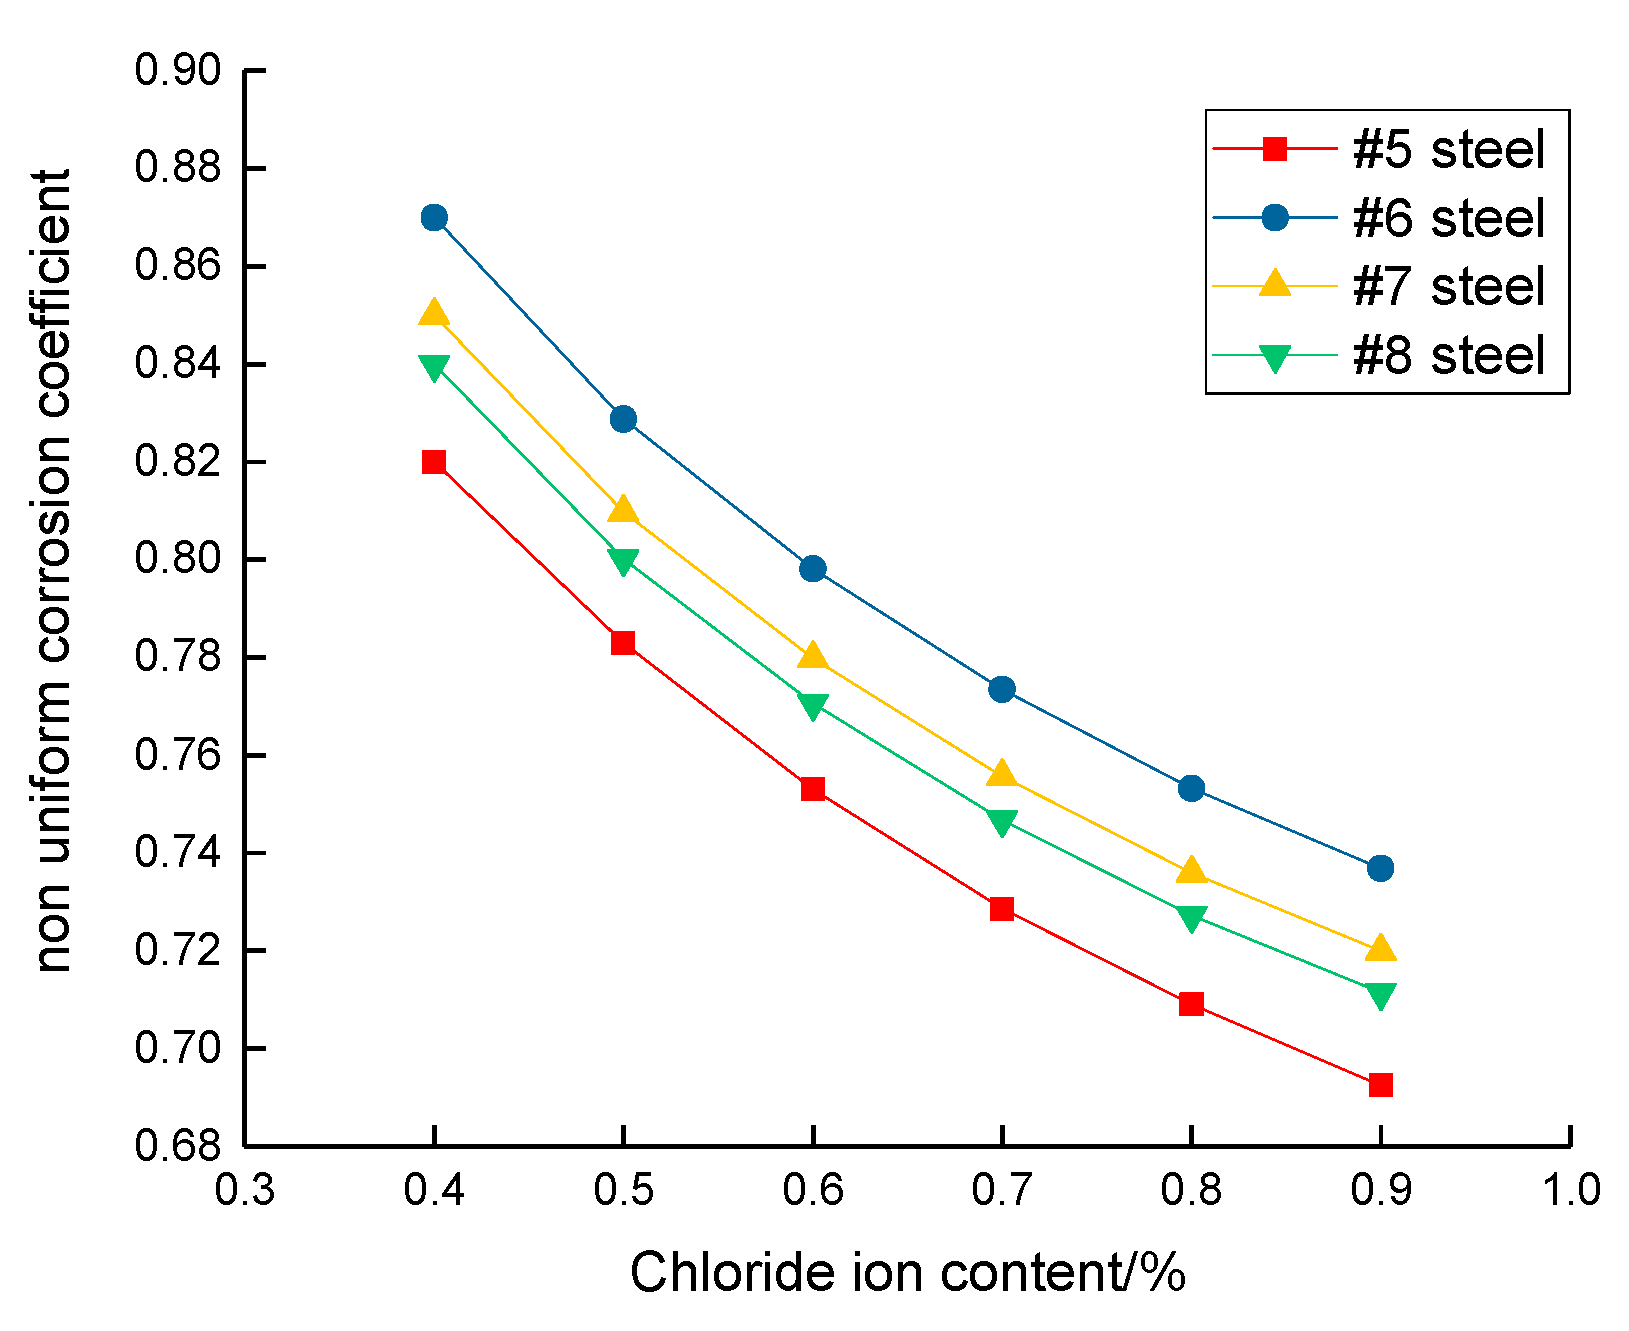
With the increase in the chloride ion content in the segment, the non-uniform corrosion coefficient of each steel bar will decrease, as shown in Figure 15, where the minimum corrosion coefficient is the #5 steel bar. Taking # 5 steel bars as an example, through fitting, the relationship between the non-uniform corrosion coefficient and thechloride ion content is as follows
y = 0.16 l n ( x ) + 0.67
where x is the content of chloride ion in the segment, x ≥ 0.4%; y is the non-uniform corrosion coefficient of segment steel bar. The R2 value of equation 19 is 0.998.

3.3. Corrosion Rate of Steel Bar under Different Potential Differences Between Cathode and Anode

Figure 16 shows the #5 steel bar corrosion current density under different potential difference when the area ratio of cathode to cathode is 1:1, and the chloride ion content is 0.8%. It can be seen from this that, with the increase in the electric potential difference, the corrosion current density at different angles of the segment steel bar increases linearly, and the slope of increase is equal. This illustrates that the change in the potential difference does not affect the non-uniform corrosion k coefficient and deflection θ.
Taking # 5 steel bars as an example, through fitting, the relationship between the maximum corrosion current density and the potential difference are as follows
y = 0.22 x + 0.12
where the x is the potential difference between the cathode and anode of the reinforcing bar, and y is the maximum corrosion current density of the segment steel bar. The R2 value of Equation (20) is 1.

4. Rust Expansion Form of Segment Steel Bar

Assuming that icorr is the total corrosion current density that flows through the corroding steel, according to Faraday’s law, the reduction radius along the circumferential direction of the steel bar can be written as [38]
r 1 ( θ , t ) = t 1 t i c o r r ( θ , t ) d t A F e z F e F ρ s
where the θ is the circumferential angle, the angle ranges from 0° to 360°, A F e is the atomic weight of the iron corroded, A F e = 55.85 g/mol, t 1 is the corrosion initiation time, z F e is the valency of anodic reaction, z F e = 2, F is the Faraday constant, ρ s is the density of reinforcement, and ρ s = 7800 kg/m3.
The volumetric expansion rates of different corrosion products are different; the corrosion products volume expansive rate δ is taken as 3.0 [39,40]. The compression deformation between the corrosion product and the steel bar is neglected. The thickness of the corrosion rust can be written as
r 2 ( θ , t ) = δ r 1 ( θ , t )
The rust expansion thickness of the corrosion products can be written as
u r ( θ , t ) = u 2 ( θ , t ) u 1 ( θ , t ) = ( δ 1 ) r 1
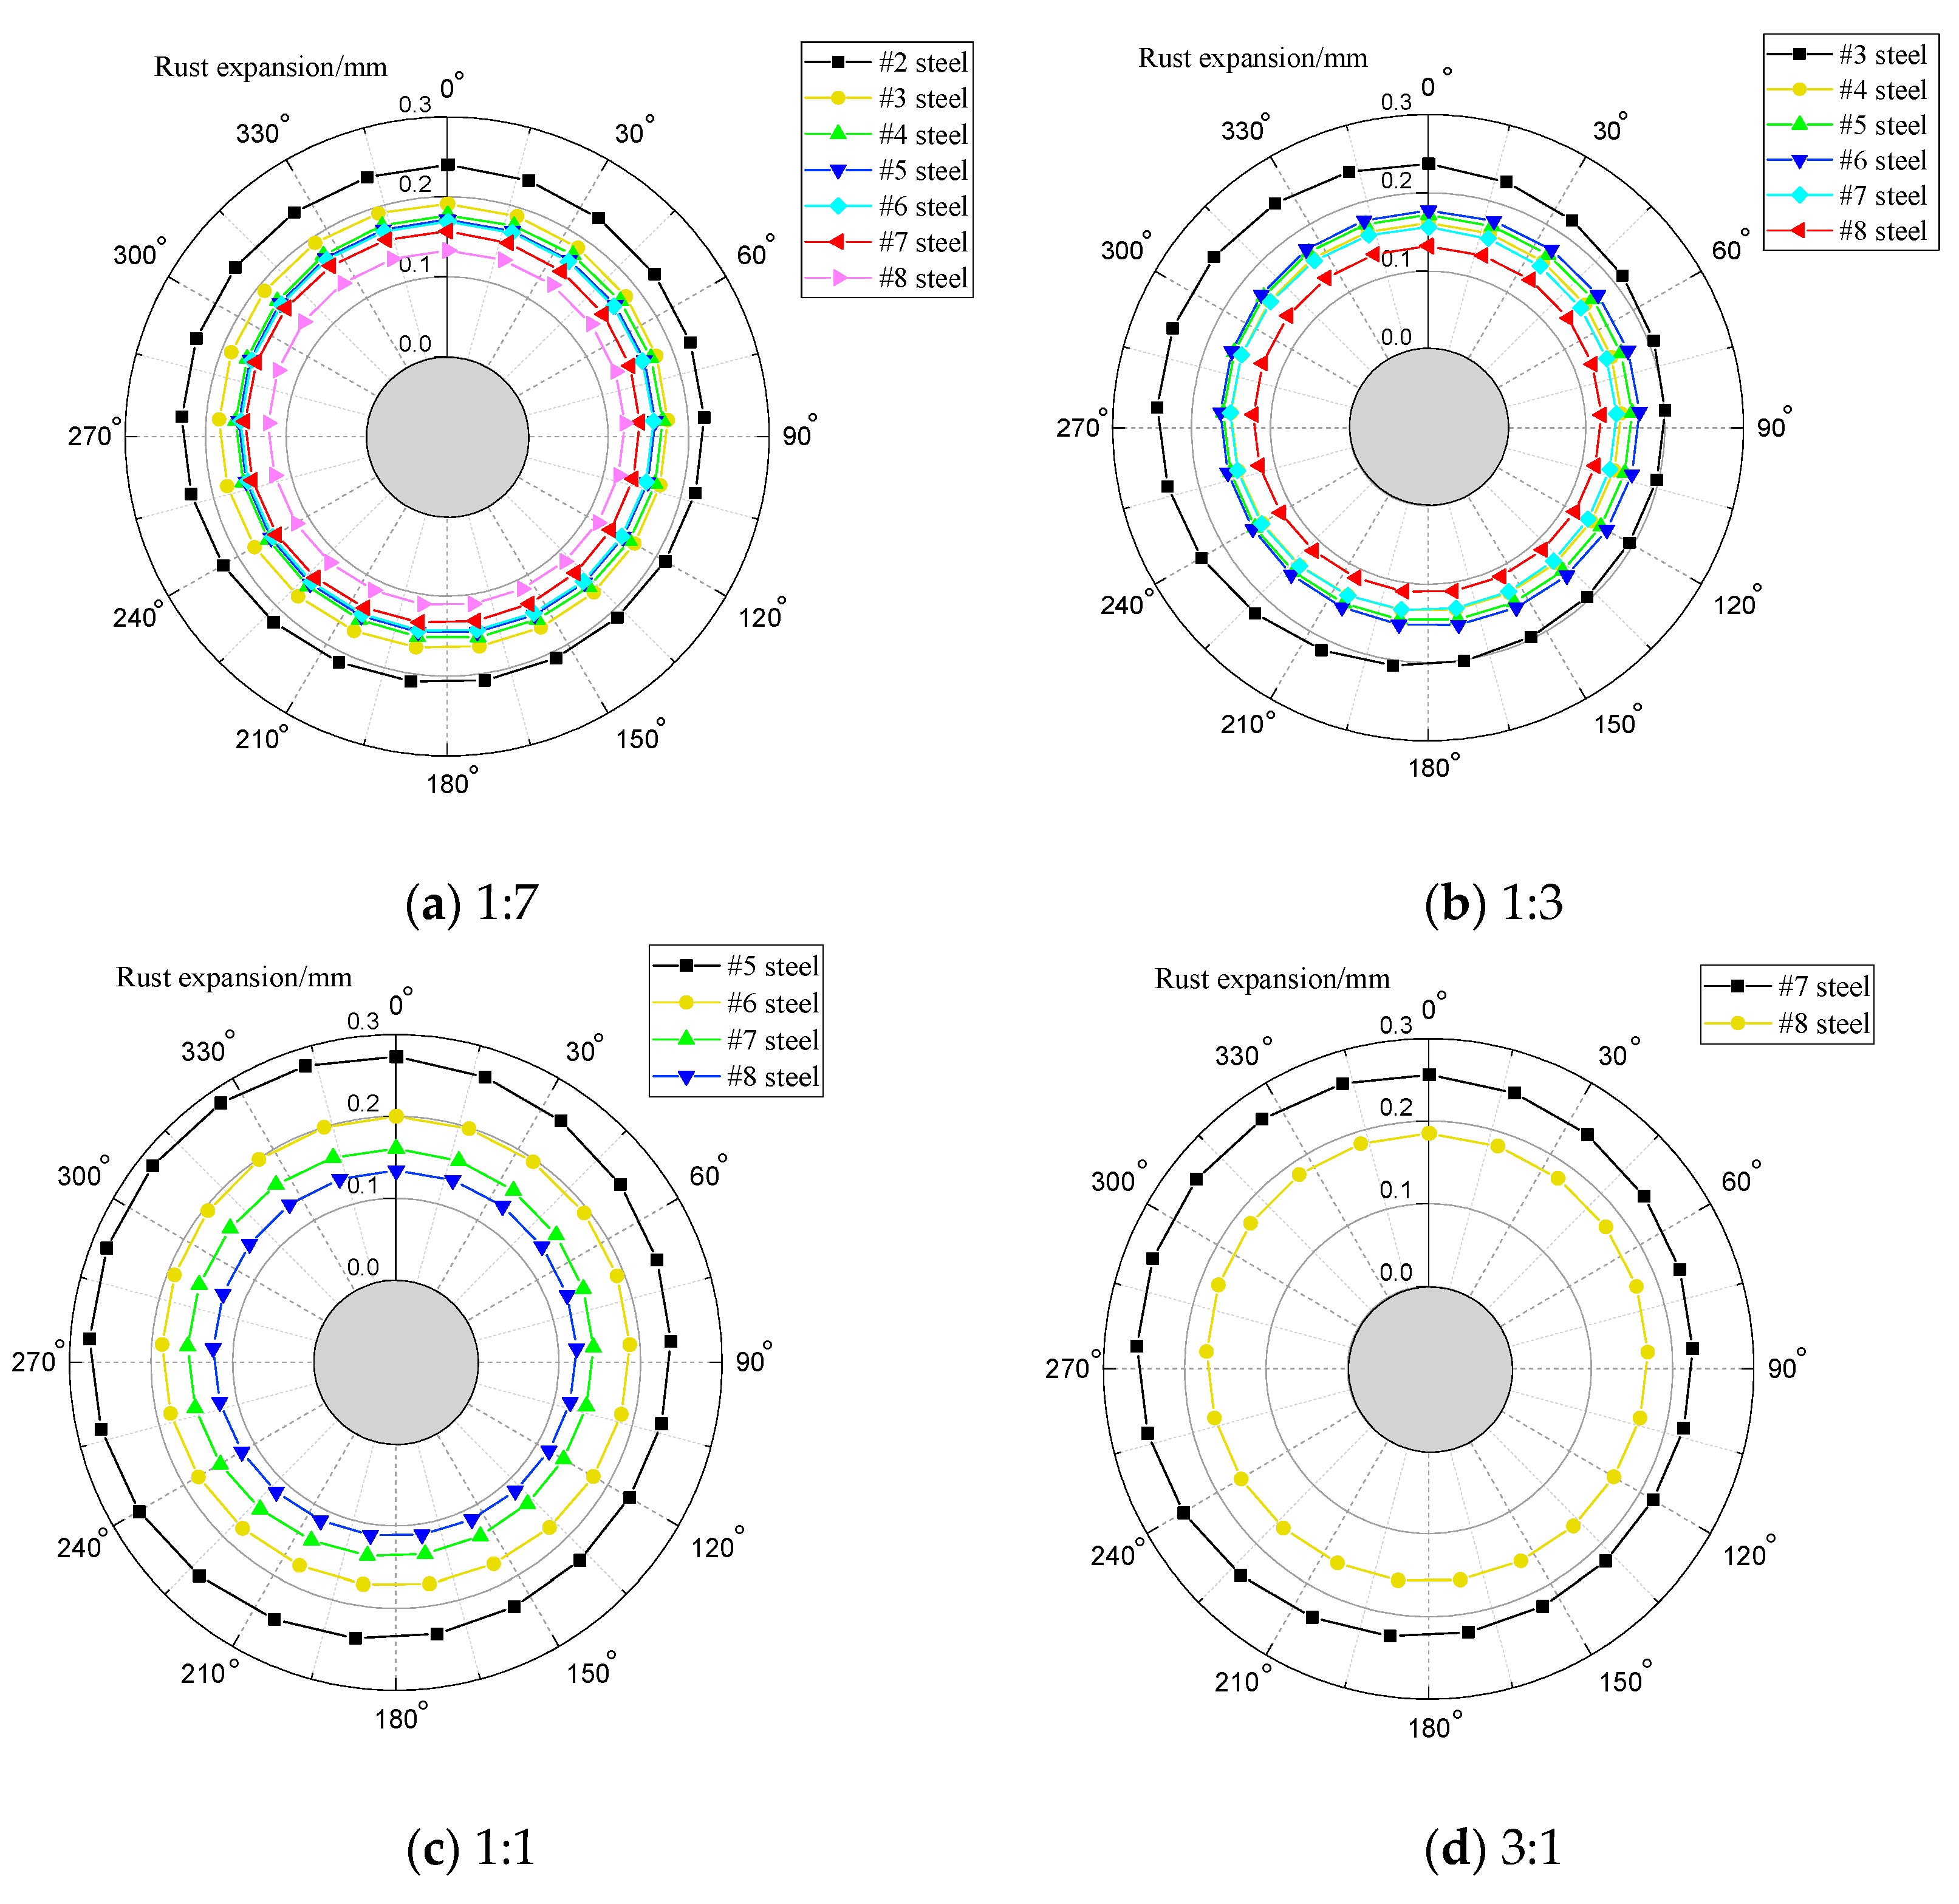
It is assumed that the corrosion time of the segment bar is 10 years, and Figure 17 is the rust expansion distribution of the steel bar under different area ratios of cathode to anode. The content of the free chloride ion is 0.4%, and the voltage in the positive and negative pole is 0.4 V and −0.4 V. It can be seen that the maximum rust expansion thickness of the steel closest to the cathode is concentrated on the upper left region of the steel, and the maximum rust expansion thickness of the steel far away from the cathode is concentrated on the top region of the steel. Among these, the largest rust expansion thickness is 0.28 mm, which is located in the #5 steel when the area ratio is 1:1, and the deflection is 52°. The smallest rust expansion thickness is 0.13 mm, which is located in the #8 steel when the area ratio is 1:3, and the deflection is 170°.
At present, most studies assume that the steel rust expansion form is a concentric circle model [40] and elliptical model [41,42]. Through analysis of the rust expansion form in Figure 18, it is found that the rust expansion form of the segment steel bar is similar to the eccentric circle. As is shown in Figure 18, point A is the circle center of the initial steel, point A’ is the circle center of the steel after rust expansion, α is the maximum expansion thickness of the segment steel, β is the minimum expansion thickness of the segment steel, and θ is the deflection.
From Figure 18, it can be seen that the central coordinate of the eccentric circular rust expansion form is ( α β 2 sin θ , α β 2 cos θ ), the radius is r   + α + β 2 , and the eccentric circular rust expansion form equation could be expressed as follows
( x α β 2 sin θ ) 2 + ( y + α β 2 cos θ ) 2 = ( r + α + β 2 ) 2
Analysis of Table 7 shows the range of deflection θ is from 0° to 52°, α and β are closely related to the external loading, chloride ion content and stray current intensity. Assuming that the area ratio of cathode to anode is the four cases in Table 3, the rust expansion model of the segment steel bar under the influence of multiple factors would be established as
{ α = ( δ - 1 ) t 1 t i max d t A F e z F e F ρ s β = k α = W k f k ( C l ) α i max = W M W F f ( D ) f i ( C l ) f k ( C l ) = 0.16 l n ( C C l ) + 0.67 f i ( C l ) = 0.12 l n ( C C l ) + 0.32 f ( D ) = 0.22 D S + 0.12
where W F is the load influence coefficient for α . When the steel bar is at the end part of segment, the value is 1; when the steel bar in the middle part, the value is 1.16~1.22. W k is the area ratio of cathode to the anode influence coefficient for k , the anode steel nearest to cathode steel is 1, and the other is 1~1.07. W M is the area ratio of cathode to the anode influence coefficient for α ; the anode steel nearest to cathode steel is 1 and the other is 0.5~1. f k ( C l ) and f i ( C l ) are, respectively, the chloride ion content influence functions for k and α . f ( D ) is the stray current intensity influence function for α . C C l is the chloride content in segment, C C l ≥ 0.4%. D S is the potential difference between cathode and anode.

5. Conclusions

This paper analyzes the corrosion rate and rust expansion forms of segment reinforcement. The results show that:
  • The steel corrosion rate near the outside of the segment is larger than that inside; the deflection between the vertical line and slant line is approximately 0°~52°;
  • The segment steel corrosion rate is related to volumetric strain under loading, and the segment steel corrosion rate in the middle is larger than that at the two ends;
  • When the steel experiences depassivation, it increases logarithmically with the free chloride ion content, and the steel corrosion rate increases linearly with the potential difference between the cathode and anode;
  • Under the joint action of three factors, the segment steel rust layer form appears as an eccentric circle.

Author Contributions

Writing—original draft preparation, Z.L.; writing—original draft preparation, H.J.; writing—original draft preparation, S.Y. All authors have read and agreed to the published version of the manuscript.

Funding

The present study is sponsored by the National Nature Science Foundation of China (Grant No. 51908428) and the Natural Science Foundation of Shanghai (Grant No. 19ZR1460400).

Institutional Review Board Statement

Not applicable.

Informed Consent Statement

Not applicable.

Data Availability Statement

Data will be made available on request.

Acknowledgments

The present study is sponsored by the National Nature Science Foundation of China (Grant No. 51908428) and the Natural Science Foundation of Shanghai (Grant No. 19ZR1460400). This work was supported by the National Demonstration Center for Experimental Road and Traffic Engineering Education (Southeast University), Nanjing, 211189, China.

Conflicts of Interest

The authors declare no conflict of interest.

References

  1. Ng, C.W.W.; Liu, G.B.; Li, Q. Investigation of the long-term tunnel settlement mechanisms of the first metro line in Shanghai. Can. Geotech. J. 2013, 50, 674–684. [Google Scholar] [CrossRef]
  2. Maeda, M.; Kushiyama, K. Use of compact shield tunneling method in urban underground construction. Tunn. Undergr. Space Technol. 2005, 20, 159–166. [Google Scholar] [CrossRef]
  3. Cooper, M.L.; Chapman, D.N.; Rogers, C.D.; Chan, A.H. Movements in the Piccadilly Line tunnels due to the Heathrow Express construction. Geotechnique 2002, 52, 243–257. [Google Scholar] [CrossRef]
  4. Jin, H.; Zhou, X.; Sun, X.; Li, Z. Decay rate of rail with egg fastening system using tuned rail damper. Appl. Acoust. 2021, 172, 107622. [Google Scholar] [CrossRef]
  5. Chen, J.S.; Mo, H.H. Numerical study on crack problems in segments of shield tunnel using finite element method. Tunn. Undergr. Space Technol. 2009, 24, 91–102. [Google Scholar] [CrossRef]
  6. Huang, Z.; Fu, H.; Chen, W.; Zhang, J.; Huang, H. Damage detection and quantitative analysis of shield tunnel structure. Autom. Constr. 2018, 94, 303–316. [Google Scholar] [CrossRef]
  7. Yan, Q.; Xu, Y.; Zhang, W.; Geng, P.; Yang, W. Numerical analysis of the cracking and failure behaviors of segmental lining structure of an underwater shield tunnel subjected to a derailed high-speed train impact. Tunn. Undergr. Space Technol. 2018, 72, 41–54. [Google Scholar] [CrossRef]
  8. Feng, K.; He, C.; Zhou, J.; Zhang, Z. Model test on impact of surrounding rock deterioration on segmental lining structure for underwater shield tunnel with large cross-section. Procedia Environ. Sci. 2012, 12, 891–898. [Google Scholar] [CrossRef] [Green Version]
  9. Jaffer, S.J.; Hansson, C.M. The influence of cracks on chloride-induced corrosion of steel in ordinary Portland cement and high performance concretes subjected to different loading conditions. Corros. Sci. 2008, 50, 3343–3355. [Google Scholar] [CrossRef]
  10. Arya, C.; Ofori-Darko, F.K. Influence of crack frequency on reinforcement corrosion in concrete. Cem. Concr. Res. 1996, 26, 345–353. [Google Scholar] [CrossRef]
  11. Otieno, M.; Beushausen, H.; Alexander, M. Chloride-induced corrosion of steel in cracked concrete—Part I: Experimental studies under accelerated and natural marine environments. Cem. Concr. Res. 2016, 79, 373–385. [Google Scholar] [CrossRef]
  12. Tang, K. Stray current induced corrosion of steel fibre reinforced concrete. Cem. Concr. Res. 2017, 100, 445–456. [Google Scholar] [CrossRef] [Green Version]
  13. Bertolini, L.; Carsana, M.; Pedeferri, P. Corrosion behaviour of steel in concrete in the presence of stray current. Corros. Sci. 2007, 49, 1056–1068. [Google Scholar] [CrossRef]
  14. Ožbolt, J.; Balabanić, G.; Kuster, M.W. 3D Numerical modelling of steel corrosion in concrete structures. Corros. Sci. 2011, 53, 4166–4177. [Google Scholar] [CrossRef]
  15. Yuan, Y.; Bai, Y.; Liu, J. Assessment service state of tunnel structure. Tunn. Undergr. Space Technol. 2012, 27, 72–85. [Google Scholar] [CrossRef]
  16. Zhang, D.M.; Huang, Z.K.; Wang, R.L.; Yan, J.Y.; Zhang, J. Grouting-based treatment of tunnel settlement: Practice in Shanghai. Tunn. Undergr. Space Technol. 2018, 80, 181–196. [Google Scholar] [CrossRef]
  17. Yang, L.F.; Bin, H.; Bo, Y. Durability design of tunnel concrete lining under chloride attack. Adv. Mater. Res. 2012, 594, 1014–1017. [Google Scholar] [CrossRef]
  18. Lei, M.; Peng, L.; Shi, C. An experimental study on durability of shield segments under load and chloride environment coupling effect. Tunn. Undergr. Space Technol. 2014, 42, 15–24. [Google Scholar] [CrossRef]
  19. Li, Q.; Yu, H.; Ma, H.; Chen, S.; Liu, S. Test on durability of shield tunnel concrete segment under coupling multi-factors. Open Civ. Eng. J. 2014, 8, 451–457. [Google Scholar] [CrossRef] [Green Version]
  20. Jin, H.; Yu, S. Effect of DC stray current on rebar corrosion in cracked segment of shield tunnel. Constr. Build. Mater. 2021, 272, 121646. [Google Scholar] [CrossRef]
  21. Yoon, S.; Wang, K.; Weiss, W.J. Interaction between loading, corrosion, and serviceability of reinforced concrete. Mater. J. 2000, 97, 637–644. [Google Scholar]
  22. Ballim, Y.; Reid, J.C. Reinforcement corrosion and the deflection of RC beams—An experimental critique of current test methods. Cem. Concr. Compos. 2003, 25, 625–632. [Google Scholar] [CrossRef]
  23. Malumbela, G.; Moyo, P.; Alexander, M. Behaviour of RC beams corroded under sustained service loads. Constr. Build. Mater. 2009, 23, 3346–3351. [Google Scholar] [CrossRef]
  24. Malumbela, G.; Alexander, M.; Moyo, P. Variation of steel loss and its effect on the ultimate flexural capacity of RC beams corroded and repaired under load. Constr. Build. Mater. 2010, 24, 1051–1059. [Google Scholar] [CrossRef]
  25. Hariche, L.; Ballim, Y.; Bouhicha, M.; Kenai, S. Effects of reinforcement configuration and sustained load on the behaviour of reinforced concrete beams affected by reinforcing steel corrosion. Cem. Concr. Compos. 2012, 34, 1202–1209. [Google Scholar] [CrossRef]
  26. Ye, H.; Fu, C.; Jin, N.; Jin, X. Performance of reinforced concrete beams corroded under sustained service loads: A comparative study of two accelerated corrosion techniques. Constr. Build. Mater. 2018, 162, 286–297. [Google Scholar] [CrossRef]
  27. Dong, J.; Zhao, Y.; Wang, K.; Jin, W. Crack propagation and flexural behaviour of RC beams under simultaneous sustained loading and steel corrosion. Constr. Build. Mater. 2017, 151, 208–219. [Google Scholar] [CrossRef]
  28. Jin, H.; Yu, K.; Gong, Q.; Zhou, S. Load-carrying capability of shield tunnel damaged by shield shell squeezing action during construction. Thin Walled Struct. 2018, 132, 69–78. [Google Scholar] [CrossRef]
  29. Cao, C.; Cheung, M.M. Non-uniform rust expansion for chloride-induced pitting corrosion in RC structures. Constr. Build. Mater. 2014, 51, 75–81. [Google Scholar] [CrossRef]
  30. Ogunsola, A.; Mariscotti, A.; Sandrolini, L. Estimation of stray current from a DC-electrified railway and impressed potential on a buried pipe. IEEE Trans. Power Deliv. 2012, 27, 2238–2246. [Google Scholar] [CrossRef]
  31. Rodriguez, J.V.; Feito, J.S. Calculation of remote effects of stray currents on rail voltages in DC railways systems. IET Electr. Syst. Transp. 2013, 3, 31–40. [Google Scholar] [CrossRef]
  32. Papadakis, V.G.; Vayenas, C.G.; Fardis, M.N. Fundamental modeling and experimental investigation of concrete carbonation. Mater. J. 1991, 88, 363–373. [Google Scholar]
  33. Du, X.L.; Jin, L.; Zhang, R.B. Chloride diffusivity in saturated cement paste subjected to external mechanical loadings. Ocean Eng. 2015, 95, 1–10. [Google Scholar] [CrossRef]
  34. Hussain, R.R. Enhanced classical tafel diagram model for corrosion of steel in chloride contaminated concrete and the experimental non-linear effect of temperature. Int. J. Concr. Struct. Mater. 2010, 4, 71–75. [Google Scholar]
  35. Isgor, O.B.; Razaqpur, A.G. Modelling steel corrosion in concrete structures. Mater. Struct. 2006, 39, 291–302. [Google Scholar] [CrossRef]
  36. Muehlenkamp, E.B.; Koretsky, M.D.; Westall, J.C. Effect of moisture on the spatial uniformity of cathodic protection of steel in reinforced concrete. Corros. Sci. 2012, 61, 519–533. [Google Scholar] [CrossRef]
  37. Ahmad, S. Reinforcement corrosion in concrete structures, its monitoring and service life prediction—A review. Cem. Concr. Compos. 2003, 25, 459–471. [Google Scholar] [CrossRef]
  38. Cao, C.; Cheung, M.M.S.; Chan, B.Y.B. Modelling of interaction between corrosion-induced concrete cover crack and steel corrosion rate. Corros. Sci. 2013, 69, 97–109. [Google Scholar] [CrossRef]
  39. Suda, K.; Misra, S.; Motohashi, K. Corrosion products of reinforcing bars embedded in concrete. Corros. Sci. 1993, 35, 1543–1549. [Google Scholar] [CrossRef]
  40. Bhargava, K.; Ghosh, A.; Mori, Y.; Ramanujam, S. Model for cover cracking due to rebar corrosion in RC structures. Eng. Struct. 2006, 28, 1093–1109. [Google Scholar] [CrossRef]
  41. Zhao, Y.; Hu, B.; Yu, J.; Jin, W. Non-uniform distribution of rust layer around steel bar in concrete. Corros. Sci. 2011, 53, 4300–4308. [Google Scholar] [CrossRef]
  42. Thybo, A.E.A.; Michel, A.; Stang, H. Smeared crack modelling approach for corrosion-induced concrete damage. Mater. Struct. 2018, 50, 1–4. [Google Scholar] [CrossRef] [Green Version]
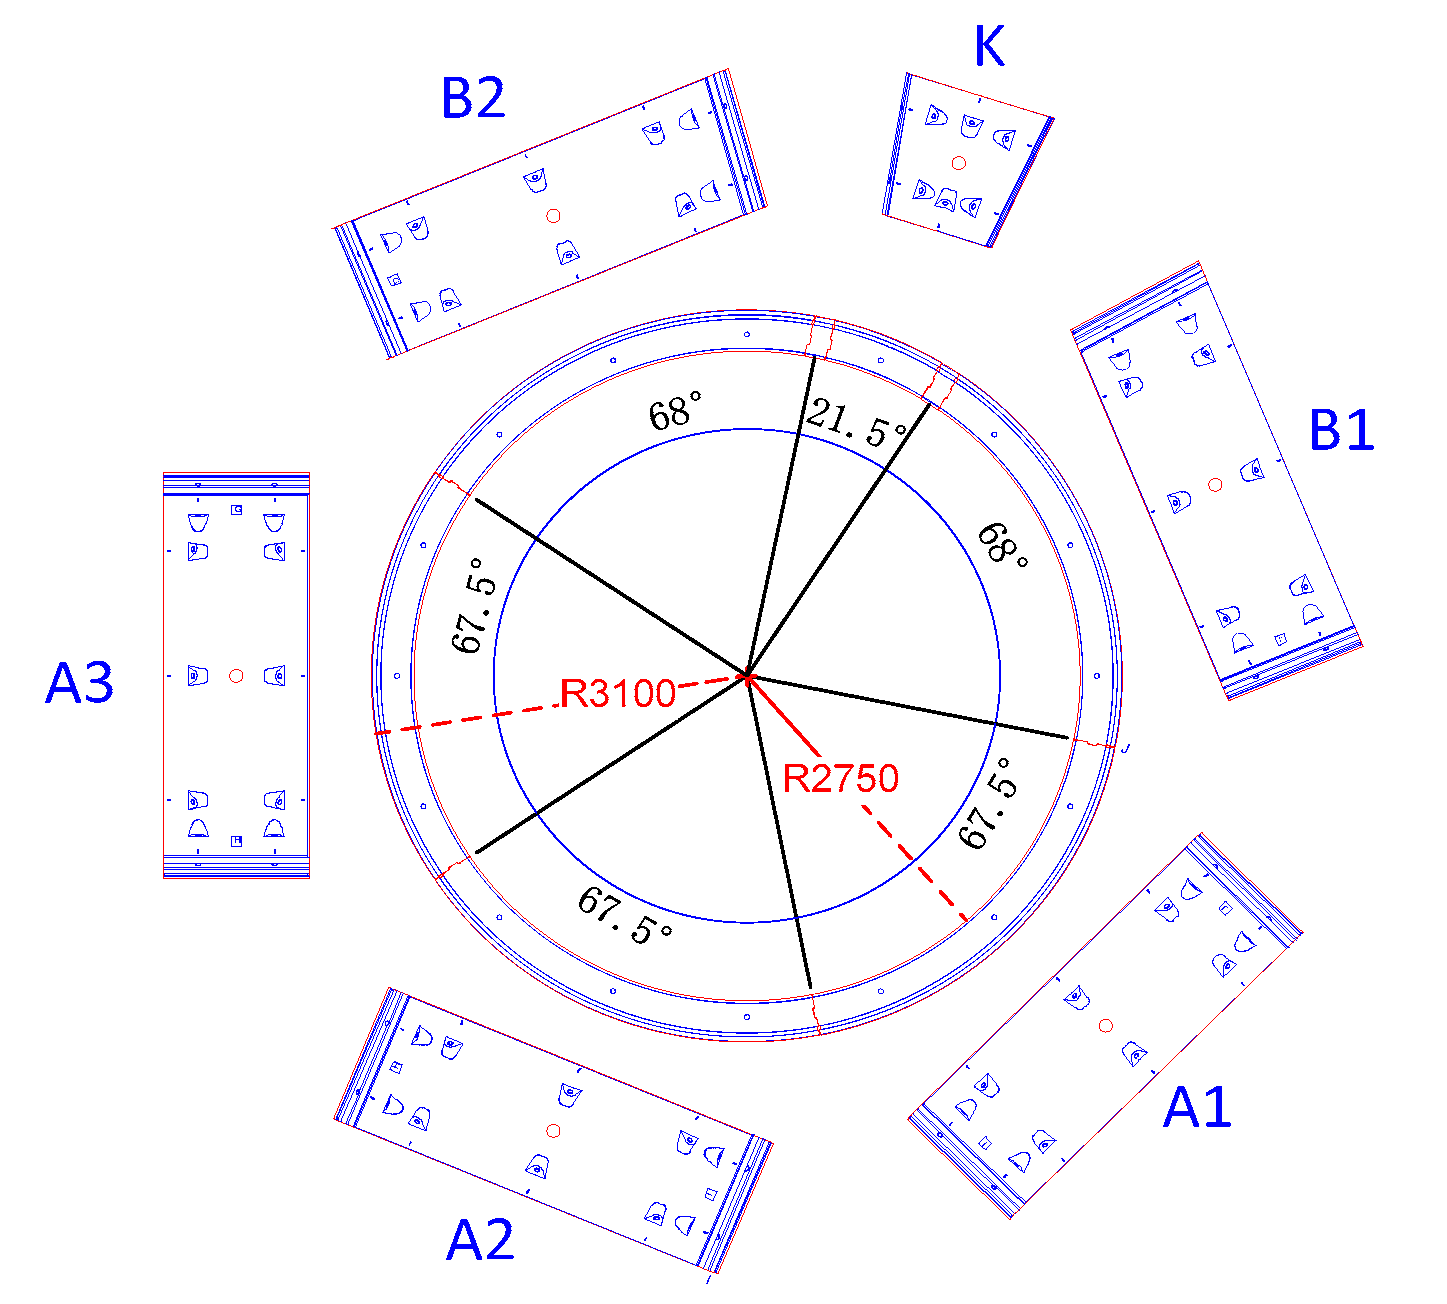
Figure 1. The whole ring of shield tunnel.
Sustainability 13 03444 g001
Figure 2. Steel composition of segment A1.
Sustainability 13 03444 g002
Figure 3. Calculation model of shield segment.
Sustainability 13 03444 g003
Figure 4. Soil and water load model.
Sustainability 13 03444 g004
Figure 5. MTR single power supply circuit model.
Sustainability 13 03444 g005
Figure 6. MTR multi-power-supply circuit model.
Sustainability 13 03444 g006
Figure 7. Potential distribution of segment steel.
Sustainability 13 03444 g007
Figure 8. Corrosion current density distribution of anodic steel under different area ratios of cathode to anode.
Sustainability 13 03444 g008
Figure 9. Variation curve of corrosion current density along the circumferential direction of anodic steel that nearest to the cathode under different area ratios of cathode to anode.
Sustainability 13 03444 g009
Figure 10. Distribution of oxygen concentration around steel under different area ratios of cathode to anode.
Sustainability 13 03444 g010
Figure 11. Corrosion current density variation curve along the circumferential direction of different steel.
Sustainability 13 03444 g011
Figure 12. Corrosion current density variation curves of different sections of #5 steel along arc length direction.
Sustainability 13 03444 g012
Figure 13. Corrosion current density variation curve of inner and outer edges of segment along the arc length direction.
Sustainability 13 03444 g013
Figure 14. Relationship between corrosion current density of #5 steel at different circumferential angles and chloride contents.
Sustainability 13 03444 g014
Figure 15. Relationship between non-uniform corrosion coefficient of different steel and chloride contents.
Sustainability 13 03444 g015
Figure 16. Variation curves of corrosion current density of #5 steel under different potential differences between anode and cathode.
Sustainability 13 03444 g016
Figure 17. Rust expansion distribution of segment steel under different area ratios of cathode to anode.
Sustainability 13 03444 g017
Figure 18. Non-uniform rust layer shape curve of eccentric circle.
Sustainability 13 03444 g018
Table 1. Soil parameter.
Layer NumberSoil NameDensity (kg/m3)Layer Thickness /mLateral Pressure Coefficient
1Miscellaneous fill18.15.540.59
2mucky silty clay17.56.460.65
3silty clay with fine sand interbed18.28.560.71
Table 2. Segment external load value.
Load TypeLoad Value/kN
q1148.15
q2223.23
G8.75
q324.81
p0
W1211.64
Table 3. Selection of cathode and anode of the segment steel.
ConditionCathode SteelAnode SteelArea Ratio
1#1#2, #3, #4, #5, #6, #7, #81:7
2#1, #2#3, #4, #5, #6, #7, #81:3
3#1, #2, #3, #4#5, #6, #7, #81:1
4#1, #2, #3, #4, #5, #6#7, #83:1
Table 4. Related parameters used in the analysis.
Parameters SymbolUnitsValue
Φ F e 0 VCSE−0.76
Φ O 2 0 VCSE0.189
i F e 0 A/m27.1 × 10−5
i O 2 0 A/m27.7 × 10−7
β F e V/decade0.41
β O 2 V/decade−0.18
Table 5. Non-uniform corrosion coefficient of steel under different area ratios of cathode to cathode.
Area RatiosSteel Bar Number
#2#3#4#5#6#7#8
1:70.810.860.870.860.860.850.84
1:3/0.820.830.860.870.840.84
1:1///0.820.870.850.84
3:1/////0.820.86
Table 6. Maximum corrosion current density of different steels under different area ratios of cathode to cathode (A/m2).
Area RatiosSteel Bar Number
#2#3#4#5#6#7#8
1:70.170.140.130.120.120.110.10
1:3/0.180.120.120.130.110.10
1:1///0.210.150.120.10
3:1/////0.190.13
Table 7. Deflection of different steels under different area ratios of cathode to cathode (°).
Area RatiosSteel Bar Number
#2#3#4#5#6#7#8
1:7030000300
1:3//5200300
1:1///520300
3:1/////520
Publisher’s Note: MDPI stays neutral with regard to jurisdictional claims in published maps and institutional affiliations.