1. Introduction
In this age of rapid technological advancement, conventional energy sources are being replaced by renewable energy resources for various economic and environmental reasons. Solar energy is among the most widespread sources of renewable energy. This energy is harnessed using solar photovoltaic (PV) cells. Solar power is also one of the cleanest renewable energy sources. However, it is highly dependent on local climate conditions, which can vastly change a solar panel’s efficiency due to various processes, such as soiling losses [
1]. Large amounts of soil accumulate on the surface of a solar PV panel in this process. Dust accumulation is standard in areas with large amounts of soil, dust, or sandstorms, such as the Middle East [
1]. In such locations, this site-specific phenomenon can cause a power generation loss exceeding one percent per day [
1]. Dust from agricultural emissions and industry emissions as well as engine exhaust, pollen, plant debris, fungi, mosses, algae, bacteria biofilms, bird droppings, and dust deposits of minerals are some of the many location-dependent contamination types that can reduce and scatter sunlight, thus affecting the overall performance of solar photovoltaic cells [
1].
Dust accumulation on the surfaces of PV panels leads to a reduction in the power produced by solar power systems [
1,
2]. Without a suitable mitigation technique to address these soiling losses, especially in desert countries, the economic losses accumulated over several weeks can be a considerable hurdle to the viability of using solar power as a cost-efficient and sustainable energy resource that can be meshed reliably in any hybrid energy matrix. Moreover, the cleaning costs required to reduce dust deposition on solar panels can be economically challenging [
1,
2,
3]. As a result, the mitigation technique adopted must be not only be efficient but also financially feasible. Quantifying soiling losses in Qatar’s environment is essential in justifying the need for an economical and effective mitigation technique to overcome these losses. In addition, this quantification can later be used to evaluate the actual power and cost improvements resulting from the application of the proposed mitigation technique. Moreover, having an expectation about the amount of power decrease due to soiling is vital in planning and managing solar power plants and reliably incorporating solar power into conventional (or other renewable) power plants to meet the electricity consumption demands of the country. Taking all these factors into consideration, solar energy could be used more efficiently as a clean, sustainable, and reliable energy resource.
An extensive literature review was carried out to study the effects of dust accumulation on solar PV panels and the economic impact of soiling losses. The review was organized to summarize the dependence of PV power production on solar irradiance and then illustrate the negative impact of dust accumulation on reducing the transmittance of transparent surfaces such as solar panel coatings, thus accounting for the reduction in output power of PV panels. This review is detailed in
Section 2 and is followed by a detailed examination of the economic impact of soiling losses, both on a global scale and on a regional scale in the Gulf area.
In the methods and results sections, the soiling losses of PV panels in Qatar will be quantified in terms of energy and money, based on the analysis of the experimental data collected. Moreover, it is well established that the specific power and economic losses resulting from dust accumulation are region-specific. This paper will first prove that, indeed, in Qatar’s environment dust accumulation does result in significant losses in terms of power production and costs of solar power systems. Second, the authors will quantify these energy and financial losses, which justify the need for an effective mitigation technique. This quantification will be employed in a future study to design a PV mitigation technique based on nanomaterial hydrophobic coating. It will then be possible to identify the exact improvements resulting from the application of the proposed hydrophobic mitigation technique.
3. Materials and Methods
The data used for this analysis were obtained over a six month period during 2017, under the PV testing and prediction research activity. The description of the experimental setup, including the sensors, signal processing, and data acquisition techniques, is given in detail in references [
13,
14]. The data were collected from PV panels at Qatar University on the rooftop of the solar lab building. The solar panel used for this experiment consisted of poly-crystalline silicon PV modules. The PV module was not altered in any way and had no coating of any type applied to it. The characteristics of the PV panel are summarized in
Table 1. The aim of this paper is to utilize this data to study the relation between dust density and output power of the panel and thus to quantify the losses resulting from soiling in terms of power and money. In the previous studies [
13,
14], these data were used to study the effect of various environmental parameters on the output power of the panel and not specifically to quantify soiling losses. The parameters being monitored were ambient temperature (°C), relative humidity (%), PV surface temperature (°C), solar irradiance (
), dust density (mg/
), and wind speed (km/h). The maximum power point was measured in (W), as usual. The data consist of 495 measurement instances, collected over different times for the duration of the experiment. Each instance has a different value for each of these parameters and a corresponding maximum power point. These data, as initially given, cannot be used to accurately quantify the soiling losses because all the parameters changed together, and so the effect of dust density on output power was mixed with the effects of temperature, irradiance, humidity, wind speed, etc. For example, solar irradiance in this data varied from as low as 10
to as high as 700
. This variation alone was more than enough to overshadow the decrease in power resulting from dust accumulation. The data collected for all other parameters also showed huge variations across the 495 measurement instances. In other words, the results of these data reflect the combined effects of all these environmental parameters on the output power of the PV panel. As a result, a pre-processing phase was necessary in order to isolate the effect of dust accumulation alone on the PV panel output power in order to accurately quantify the soiling losses.
The idea of the pre-processing phase was to look for points where all the environmental parameters were almost constant or varied little while only the dust deposition values were varying. For these points, the variation of the level of output power would not be affected by the other parameters, as they would not be changing, and thus would directly reflect the effect of dust deposition alone. To achieve this goal a pre-processing algorithm was developed and applied using Microsoft Excel for the data.
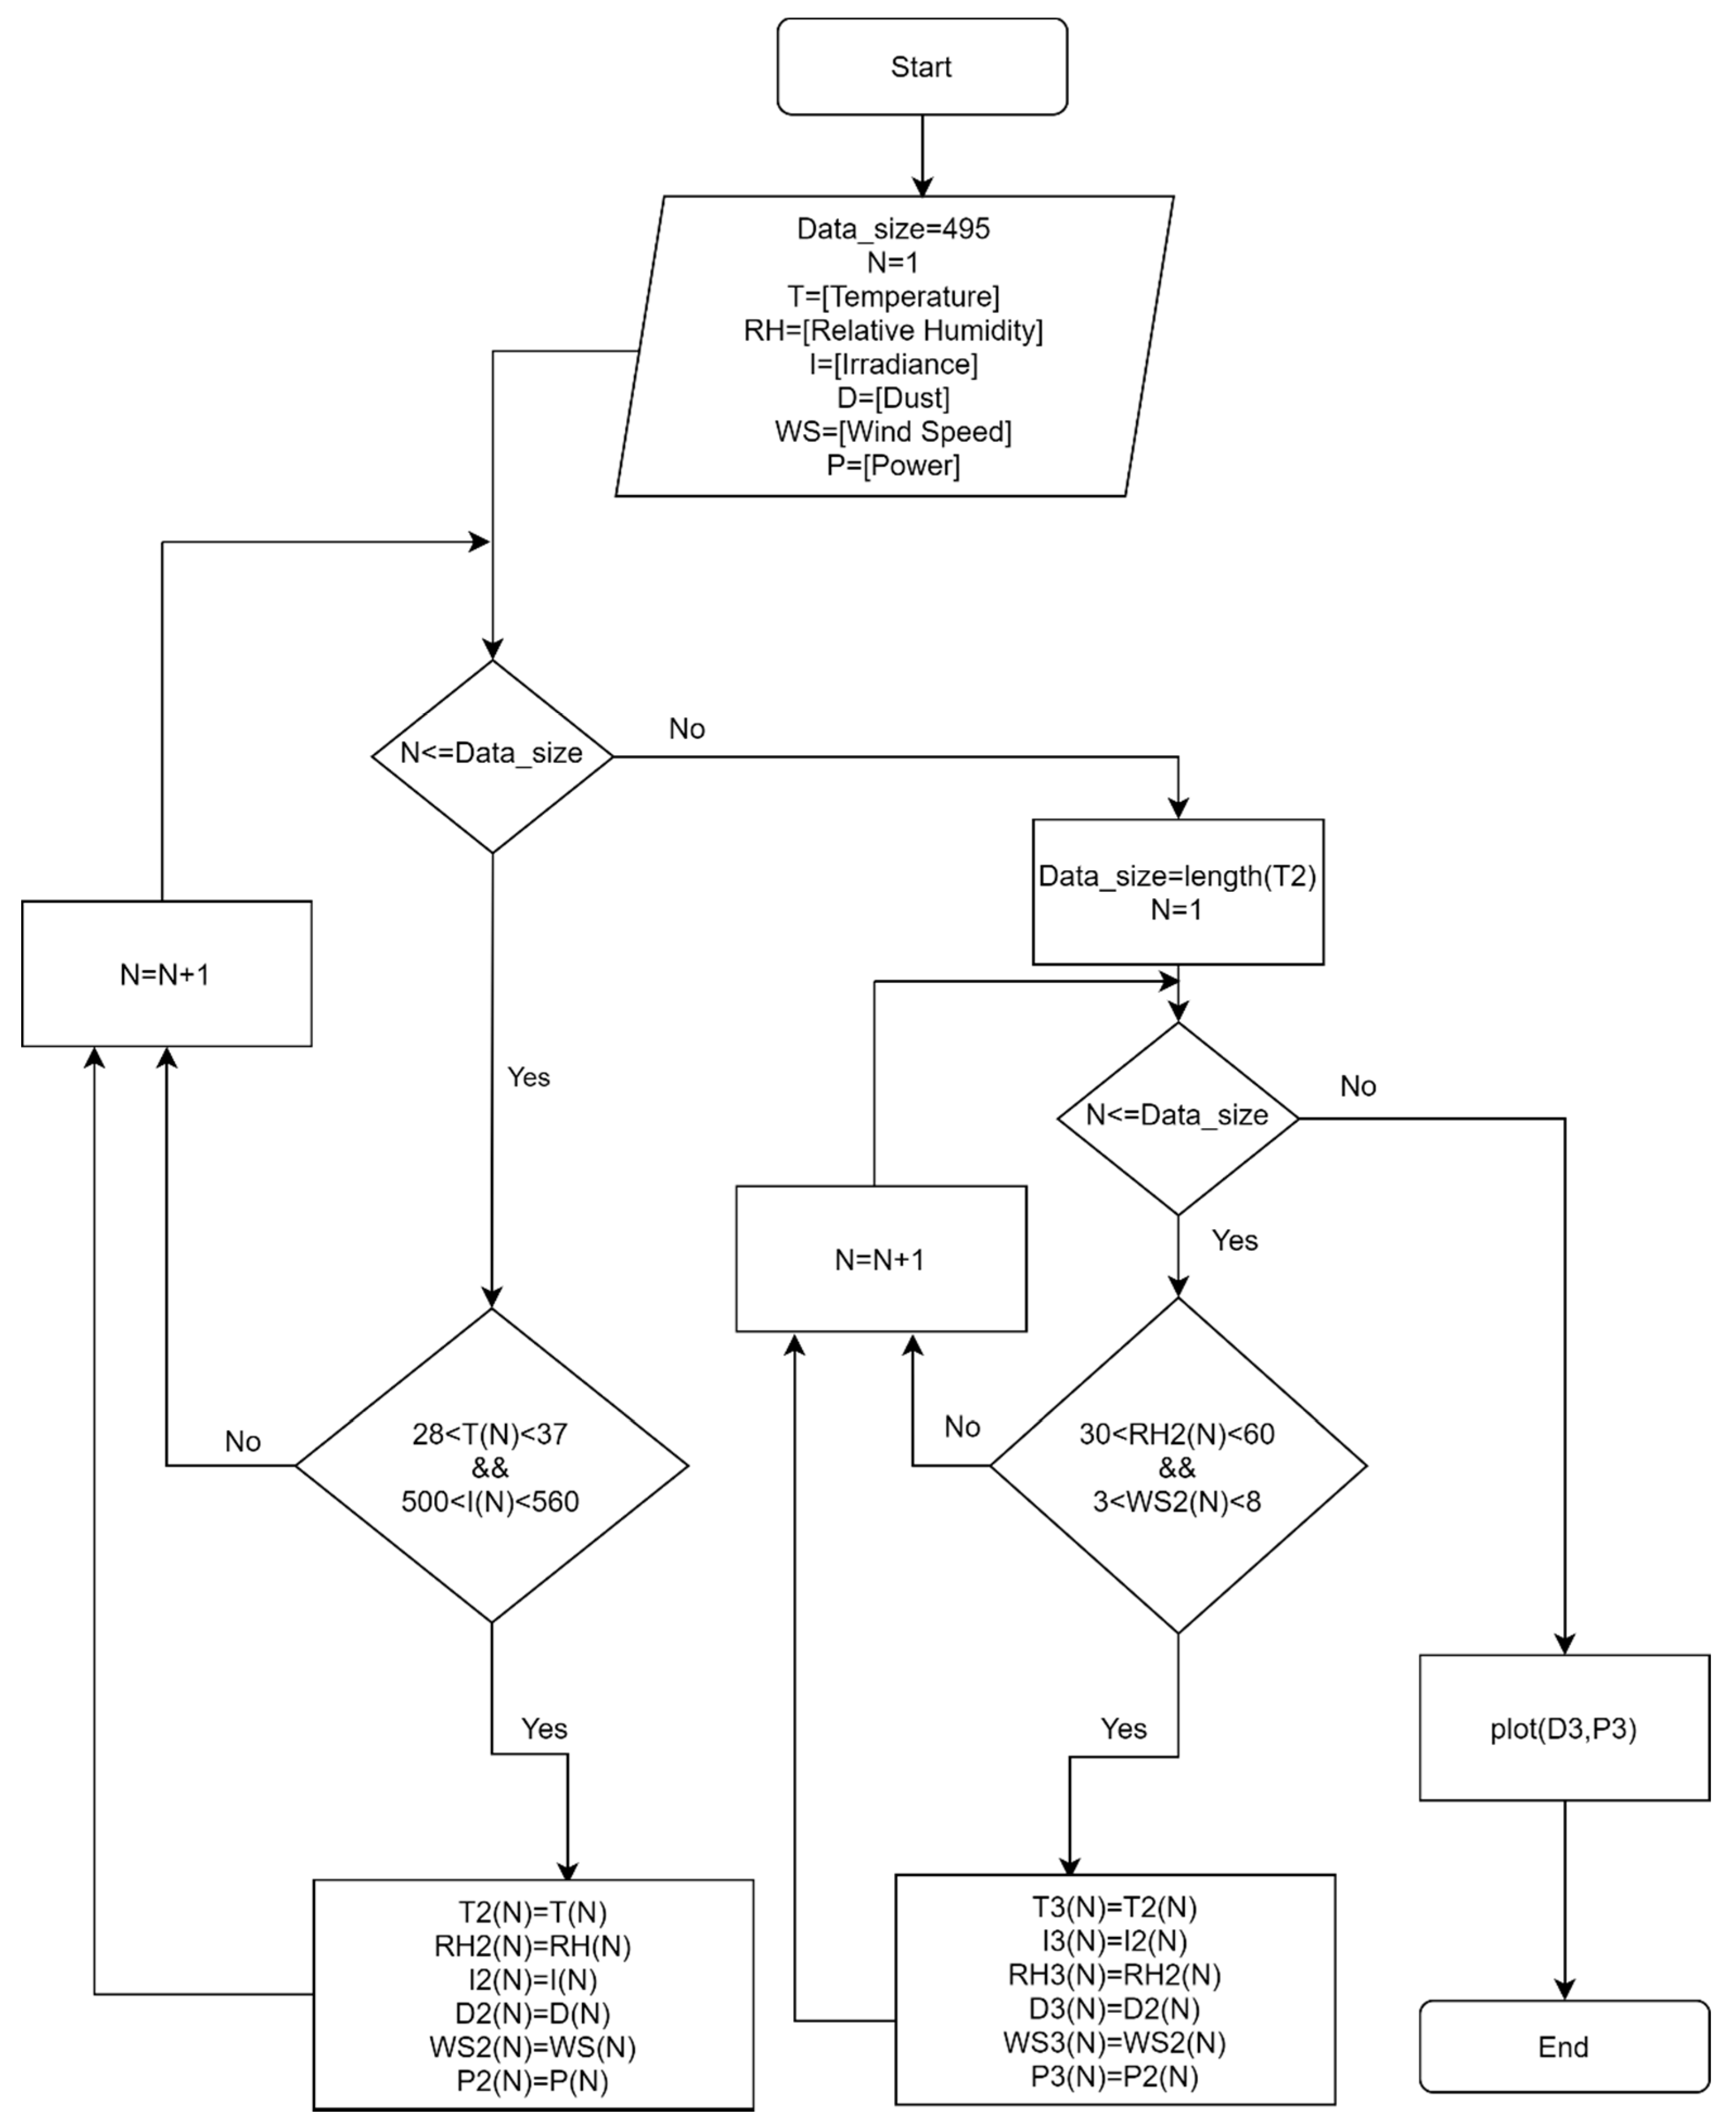
Figure 4 illustrates the main steps of the pre-processing algorithm that was developed.
The algorithm that was developed is as follows. First, identify all points that have irradiance between 500 and 560
and at the same time have an ambient temperature between 28 °C and 37 °C. These particular upper and lower limits were chosen after close study of the data and identification of the data mode, range, and average as well as several trial and error applications for the whole algorithm to find out the most suitable range (upper limit, lower limit, and the range between the two limits) for each parameter. Second, get and store all the values of the parameters for those filtered points and identify the new data length. Third, apply the holistic method described above again to determine the upper and lower limits for relative humidity and wind speed. Surface temperature was not used because it directly followed ambient temperature in pattern and is itself determined by the other environmental parameters already considered. Fourth, identify all the points of the new data set that have relative humidity between 30 and 60 percent and have wind speed between 3 and 8 km/h. Fifth, get and store all the values of the parameters for those filtered points. Sixth, plot the dust deposition amount versus the maximum power point from these final data points and apply the best linear fit. This data pre-processing algorithm is clarified in detail by the flowchart using loops and “if” statements in
Figure 5.
Table 2 shows the main statistical parameters of the environmental data parameters used in the pre-processing phase.
It can be seen that the upper and lower limits used in pre-processing were chosen such that they encompassed the mode, median, and average of each of the parameters. This was to ensure the utilization of the maximum number of data points possible for data analysis. Also, this ensured that the results would be applicable for the most common set of environmental conditions that occur within the geographical area of study. It can be seen that the average, mode, and median for wind speed and relative humidity are all within the upper and lower limits used in pre-processing for each of these parameters. The mode and median for solar irradiance were within its upper and lower limits as well but the average was slightly smaller than the lower limit used. For ambient temperature, both the average and median were within the limits, but the mode was not. This is because trial and error showed that the chosen limits for temperature resulted in the greatest number of data points that could be used due to the distribution of the other parameters’ modes with respect to temperature. Thus, the upper and lower limits that were chosen result in the greatest possible number of data points to be utilized for analysis and ensure an acceptable domain of validity for the obtained results.
4. Results
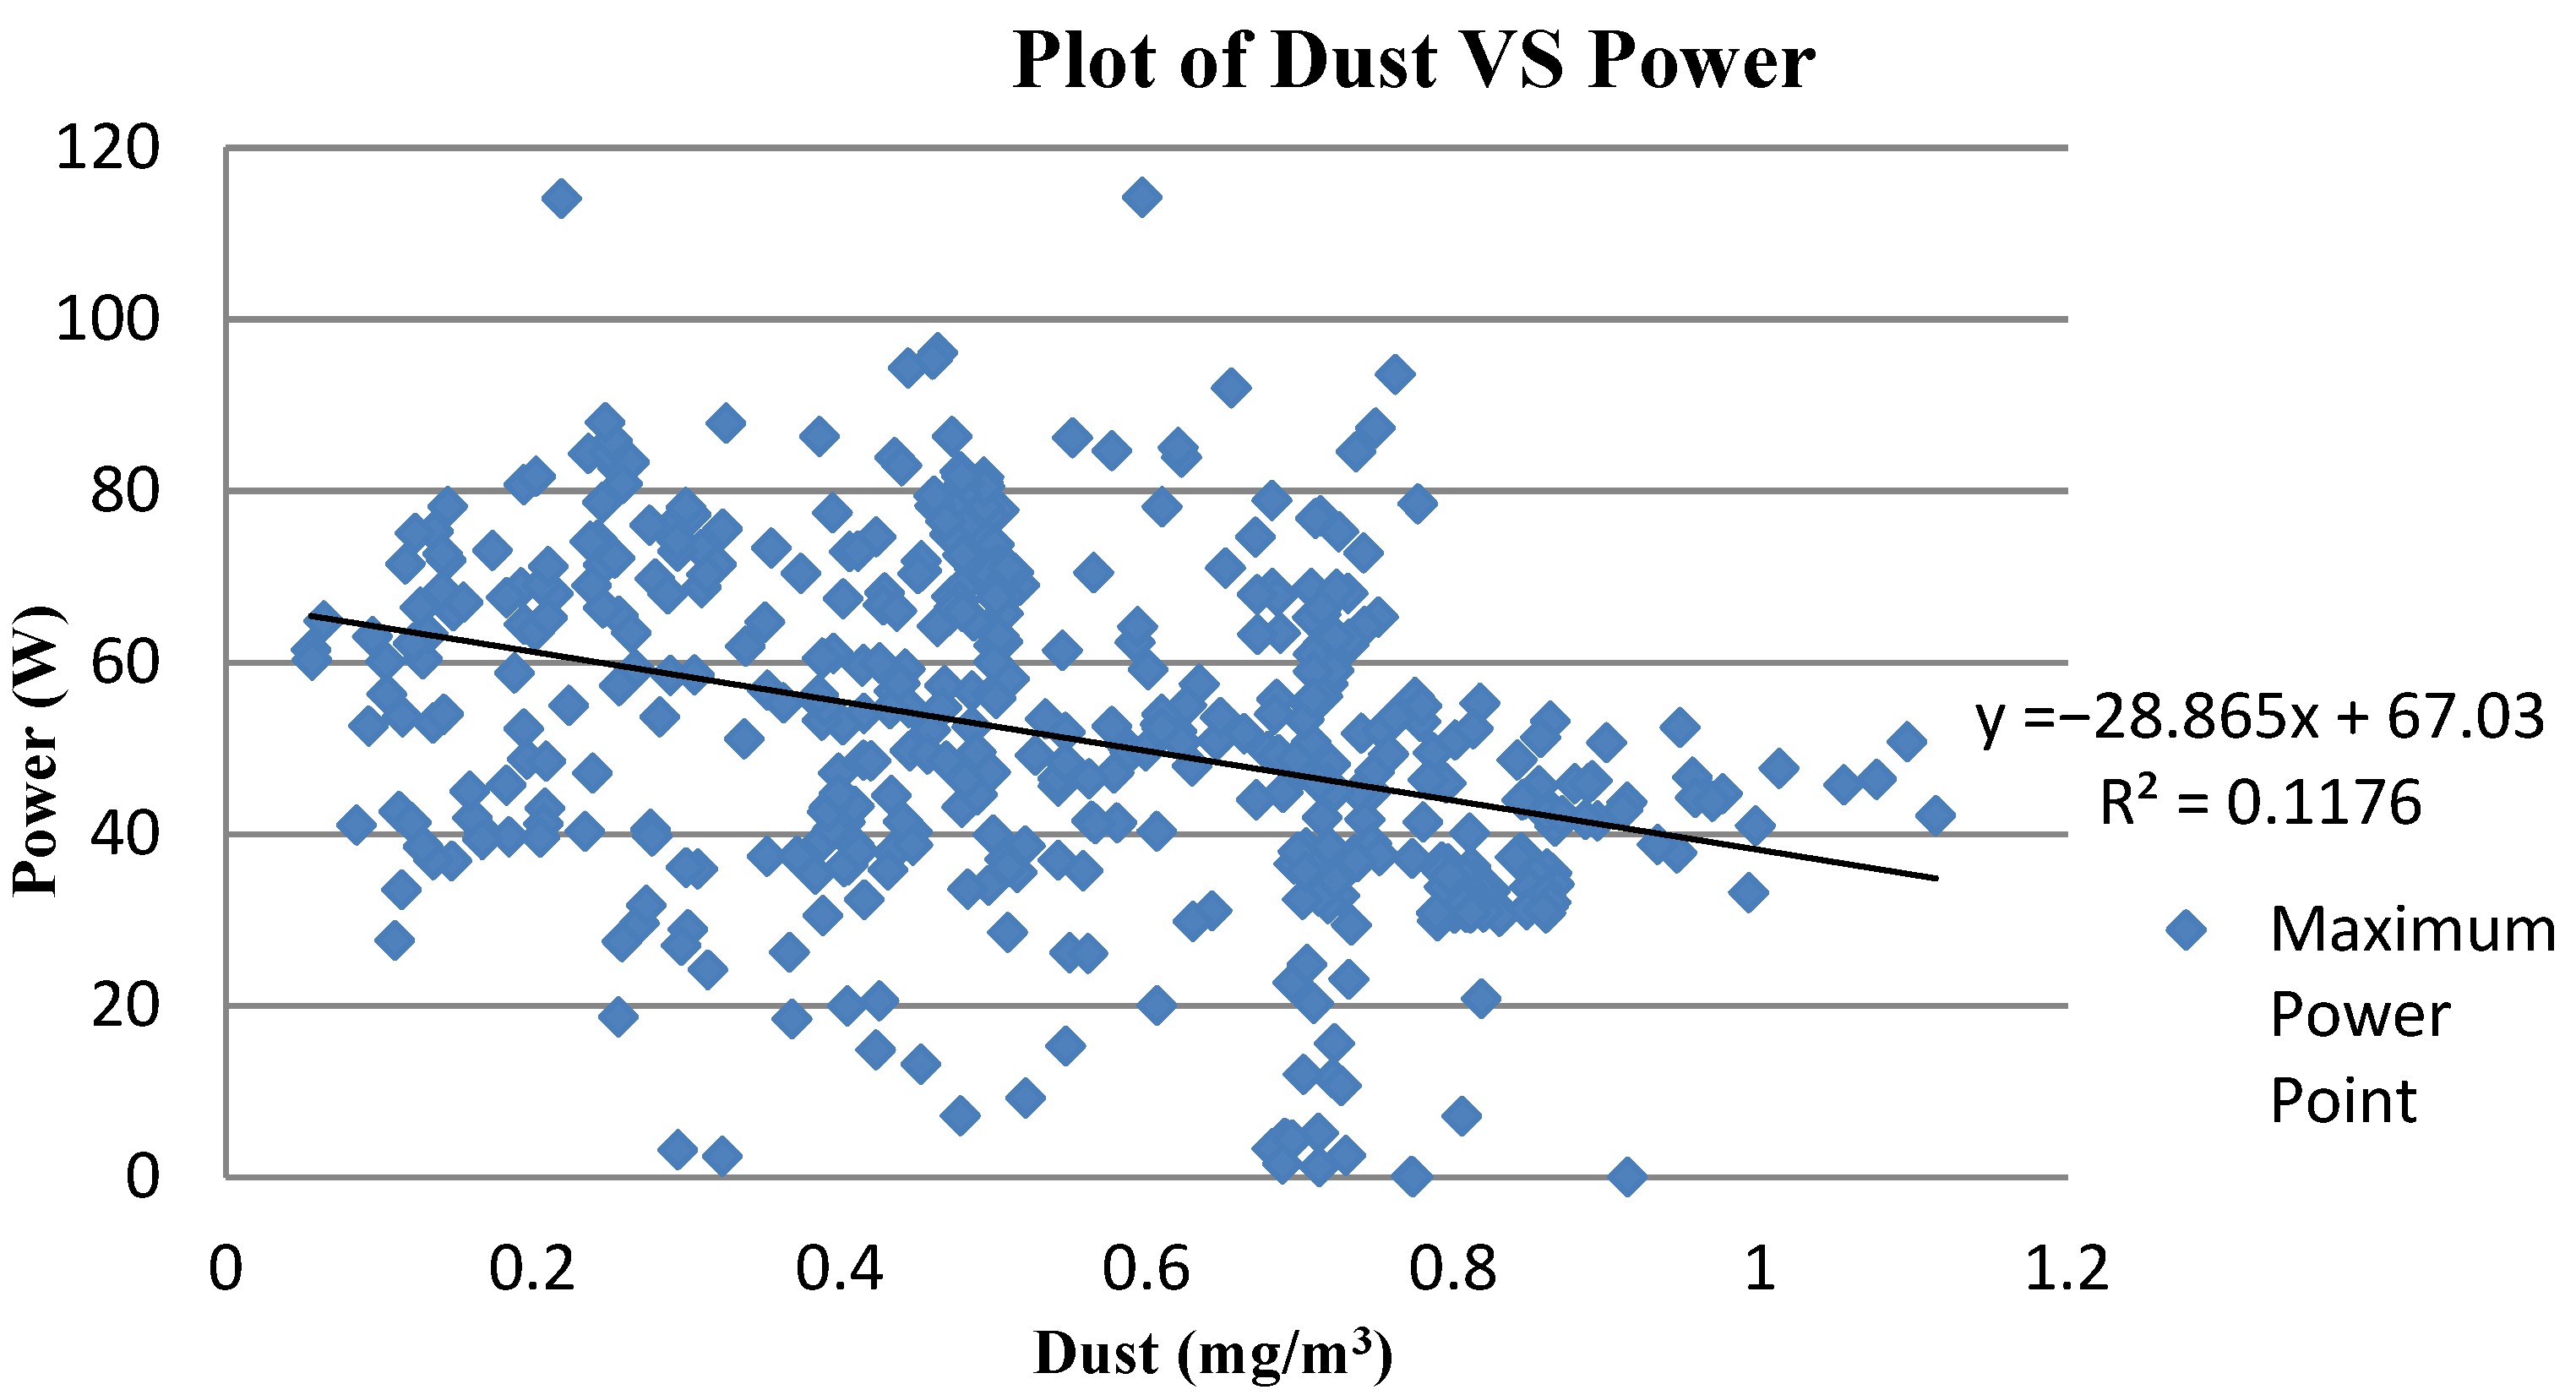
Figure 6 displays the dust deposition versus the maximum power point for the whole given data set, which contains 495 instances. It can be concluded from the plot that the best linear fit does indeed show an inverse relation between dust amount and output power, as expected. This is evident from the large negative slope of −28.86
. However, this linear fit is far from being an accurate representation of the data, because the
value is 0.117, while ideally it should be 1. This large error is because this data not only reflects the effect of dust on output power but also the effect of all other environmental parameters and thus cannot be modeled by this single variable function. This justifies the need for the pre-processing phase.
After applying the first pre-processing loop of the flowchart, steps 1 and 2 of the algorithm, 114 data points were obtained, as shown in
Figure 7, with an improved linear fit having an
value of 0.420 and a slope of −30.98
. The negative slope increased, indicating that the refined model shows a stronger negative effect of dust amount on output power.
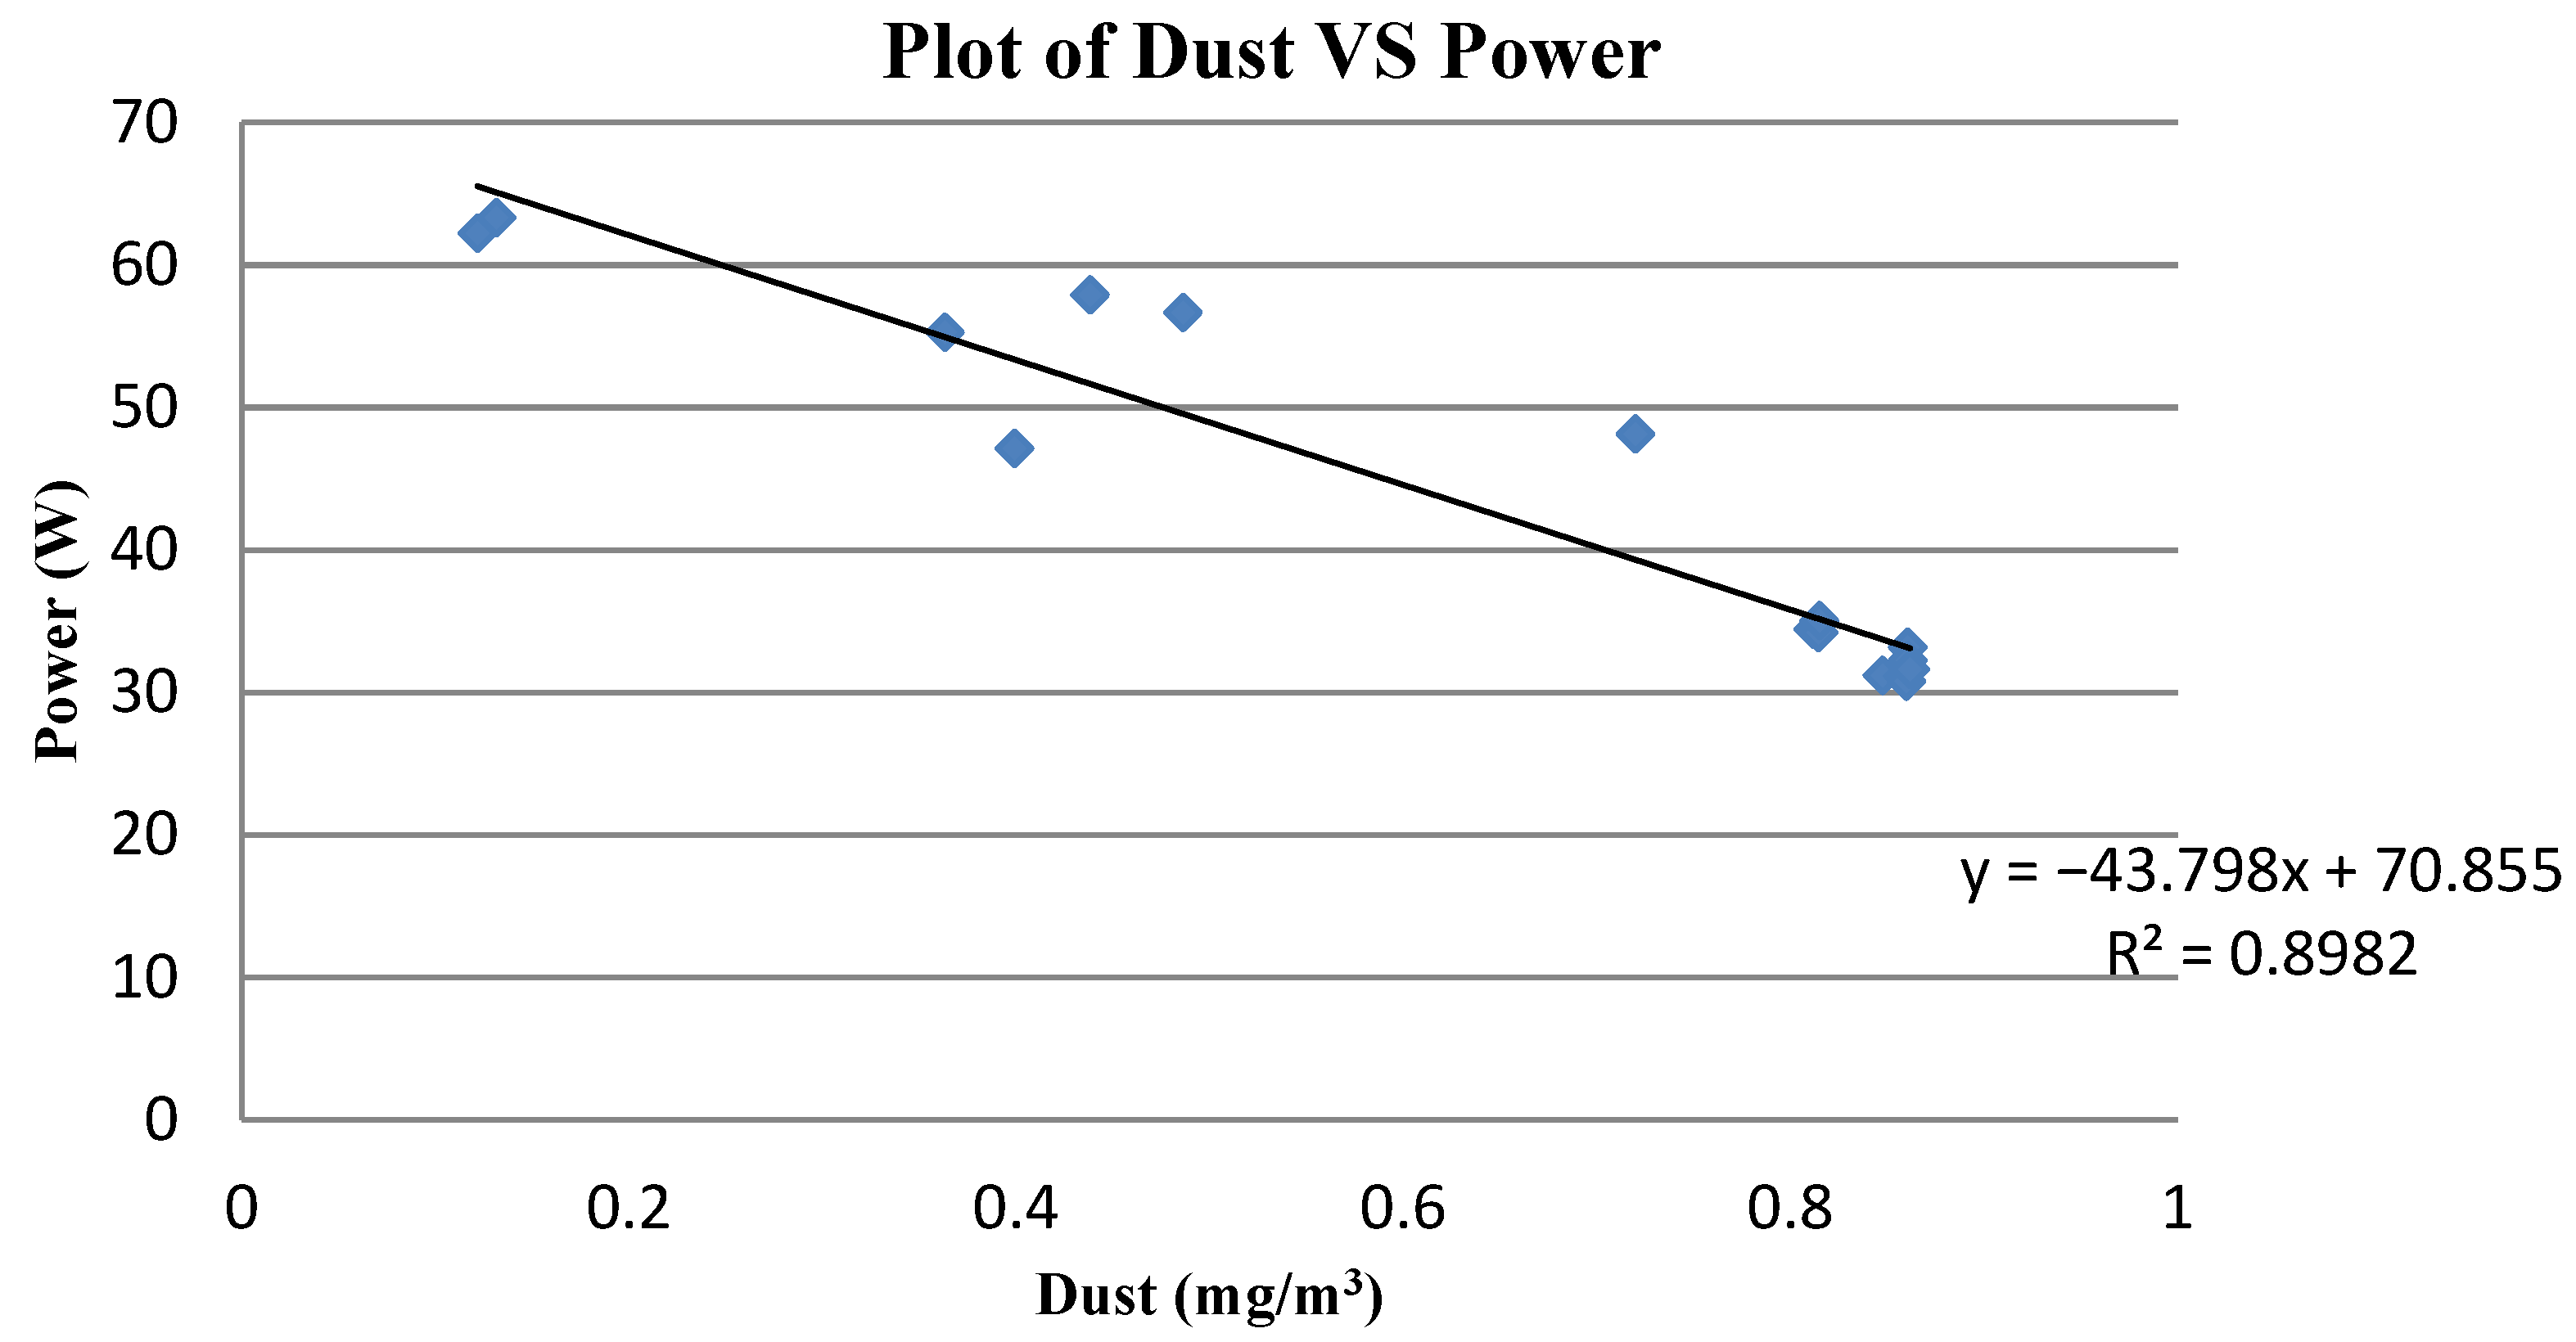
Finally, after applying the complete pre-processing phase, the final data set had only 16 data points.
Figure 8 displays the final plot of dust density versus maximum power point of the PV panel. The linear fit is now sufficiently accurate, with
equal to 0.898, implying that the linear model can be trusted as an accurate representation of the data. The y-intercept is 70.85 W, which means that for zero dust density the output power of the PV panel would be 70.85 W. This is indeed near the optimal value of 80 W at standard test conditions (STC) given in
Table 1, with the difference between them being mostly attributed to the fact that the panel was not operating at STC. The slope of the line is −43.79
, which demonstrates a more prominent negative relation between dust and output power. This slope indicates that the output power of the PV panel decreases by 43.79 W for 1
of the dust present in Qatar’s environment, after a six month period. It must be noted again that the dust measured is not directly the amount of dust on the surface of the panel but the dust density in the air surrounding the panel. In other words, 1
of dust density in the air surrounding the PV panel reduces the output power of the panel by 43.79 W, or around 62% of its output power, in the absence of dust, assuming this dust density remains constant for a sufficiently long time to lead to a correspondingly high level of dust accumulation on the surface of the panel.
It is worth mentioning that Equation (1) is valid only for the previously specified range of parameters, namely, irradiance between 500 and 560 , ambient temperature in the range 28–37 °C, a relative humidity of 30–60%, and wind speed 3–8 km/h. This is mainly because the constant term (70.85 W) will change for different values of solar irradiance. Therefore, Equation (1) and the subsequent equations derived from it are valid only under these conditions. However, it is worth mentioning that, except solar irradiance, which can reach up to 1000 , the values of the other environmental parameters in Qatar are usually within these ranges. It follows that a different irradiance would only change the constant term—the output power at zero dust density (x-axis intercept)—and not the coefficient relating dust density to the power decrease.
For the economic quantification, the economic losses of PV panels due to dust density based on the above data was explored. First, the price of electricity in Qatar was investigated. It was found that the Kahramaa electrical power consumption price was 0.13 Qatari Riyals (QAR) per kWh for the industrial and business fields, and that the price differed from one field to another [
15]. Furthermore, this price also applied to the commercial field, where the cost was 0.13 QAR per kWh [
15]. Thus, this price was selected to investigate the economic losses of PV panels in QAR, as per the context of this paper. The price was converted to QAR per Wh as follows:
Second, the equation linking output power of the panel to dust density can be converted to link the money income or revenue of the solar panel to the dust density present in the surrounding environment. The equation was obtained by multiplying the price of electricity in Qatar by the dust–power equation, as follows:
Which simplifies to Equation (4):
This equation implies that a dust density of 1 , under the above conditions, results in 0.006 QAR money loss per hour for only one solar panel, which has a maximum revenue of 0.0092 QAR per hour when the dust density is zero.
To get a perspective of the economic impact these losses could have in practical applications, the group applied the results to a future 800 MW power plant project for Al-Kharsaah in Qatar, covering 10
of land [
16]. The project is expected to be launched in the first quarter of 2021 for 350 MW and be fully lunched for 800 MW in April 2022 [
16]. This project will cost around 462.3 million US dollars, which is approximately 1.7 billion QAR [
16]. Furthermore, there will be 2 million PV panels in this solar plant [
16]. The economic losses will be calculated for this project if no mitigation approach is applied and assuming the same approximate conditions as those applicable to the data collected. The 800 MW output power corresponds to 104,000 QAR/h. It will be assumed that the power losses on each individual panel of these 2 million panels will be comparable to the power loss of the tested panel. A lower estimate for the power losses due to dust would reduce the output power by almost 10%, thus resulting in a 11,385 QAR/h loss from the expected 104,000 QAR/h income for 800 MW production. This is summarized in Equation (6) below and demonstrated in
Figure 9, which shows the money lost due to the effect of dust for different levels of dust density. As expected, the plot shows that the money loss increases for higher values of dust density; zero money is lost for zero dust density and 11,385 QAR is lost per hour for a dust density of 1
, which is not uncommon in this region. The equation is obtained by calculating the price of the produced electricity per hour minus the price lost due to dust affecting the 2 million panels.
Which leads to Equation (6):
Therefore, the final plot showing the lost money for a given density of dust is as depicted in
Figure 9.
Thus, by looking to these economic losses due to soiling, it can be concluded that huge power and economic losses will occur if no mitigation technique is applied. This justifies the need for a cost-effective mitigation technique for solar power plants to achieve an efficient power production and avoid large economic losses. Again, it must be noted that the above graph reflects the losses given that the specified value of dust density is persistent over the time scale of months.
5. Discussion
It is important to list all assumptions that are implicitly or explicitly used in the analysis, calculations, and interpretations of the results, so that the obtained results can be interpreted accurately in their context. The assumptions are as follows:
The ambient dust density is directly proportional to the mass of dust accumulated on the panel. This is largely justified because the wind speed in Qatar is relatively low to eliminate dust that gets stuck on the surface. In addition, the dust is sticky due to the high relative humidity most of the time.
The coefficient linking dust density to output power does not vary hugely with variation of the environmental parameters within the normal range of Qatar’s climate.
The relation between output power and dust density can be accurately modeled by a linear fit. This is partially justified by the literature review (see
Section 2.2) and Excel testing of different polynomial fits, noting the accuracy of each model.
As a result, it must be kept in mind that the relation established links output power to ambient dust density. Also, the relation gives the decrease in output power for a specific value of dust density, assuming that this particular dust density value is persistent over a large time scale. Equivalently, the relation considers dust density as the only variable while the time period is fixed and very long, on the scale of six months. Moreover, the equations obtained are only valid within the specified range of environmental parameters used in the pre-processing phase and are not valid for any range of solar irradiance and ambient temperature.
The reason for using this method, despite the potential limitations it has, is that the aim is to link dust density itself, not the time without cleaning, to power loss. Linking power loss to time without cleaning has been done before in Qatar; however, linking power loss to dust density, and ultimately to dust accumulated on the surface of the panel, has not been widely investigated previously, especially using the data analysis algorithm developed herein. To summarize, the equation that was obtained gives the power lost due to dust accumulation after a fixed period of around six months, coming from the corresponding dust density present during that six month period.
This result is consistent with previous estimates done in Qatar. For example, it was reported that, in Qatar, soiling losses can decrease a PV panel’s output power by 68% after 234 days without cleaning and by 15% after only one month [
17]. In addition, another study done in Qatar showed that dust accumulation over a one month period resulted in a 10% decrease in the output power of a PV panel that has 80 W maximum power output [
18]. Linking the results obtained in this work for the relation between environmental dust density and output power with the results obtained previously for the relation between time period and output power, it can be concluded that the results the authors obtained are consistent but reflect power losses over long time periods from one month up to eight months. In other words, the obtained equations are applicable when the value for the dust density is persistent on a time scale of one month. In that case, the given dust density will be such as to result in an amount of dust accumulation that decreases the output power as predicted by the equation. It should be kept in mind that, most of the time, the dust density is considerably lower than 1
, mostly in the range of 0.4 to 0.7
. This range corresponds to a power loss between 24% and 43% in only four to six months, assuming that the dust density remains in this range over this period.
It should be noted that the results cannot be generalized over a wide geographical scope. The data, as well as the studies mentioned in the previous paragraph, were collected in Doha, the capital city of Qatar, and therefore the results may not be generally applicable over all of Qatar’s regions. However, they are likely to give an acceptable estimate for various cities in Qatar and the Gulf region with climate conditions similar to those of Doha. A future study can be carried out to generalize the results over a wider metropolitan geographical area that has environmental conditions within the acceptable margins of the parameters used in this study.
6. Conclusions
Quantification of power and economic losses due to PV panel soiling has been deliberately established using a customized data processing algorithm. The data used is a set of measurements for the maximum power point of installed PV panels and the natural environmental parameters that the panel is exposed to on the rooftop of the solar lab facility in Doha, collected over a period of six months. During that period, the panel was not cleaned to study the effect of natural environmental conditions on its performance. The algorithm developed narrowed all environmental parameters’ ranges except the ambient dust density, so that a relation between dust accumulation and power produced by the panel could be obtained. The relation was successfully obtained after running iterations of the algorithm, getting the final data points, and then fitting them into a linear equation. The obtained model is only valid for the specific ranges that were set for each of the environmental parameters, namely irradiance between 500 and 560 , ambient temperature in the range of 28–37 °C, a relative humidity of 30–60%, and a wind speed of 3–8 km/h. Other assumptions to increase the model precision and accuracy were also specified in the discussion. However, it was also shown that these assumptions are plausible and do not change the main conclusions drawn. Also, the results were compared to previous studies in the region and were found to be consistent with them when considering the time duration of each study.
Moreover, for estimating the economic loss, the obtained linear model was applied to the Al-Kharasaah project, a future 800 MW solar power plant with 2 million panels that is located in Qatar. The results showed that dust accumulation would reduce the output power by 10%, resulting in a financial loss that exceeds 11,000 QAR/h, which is substantial. We believe that without cost-effective mitigation techniques, huge energy and economic losses would occur that would in turn affect dramatically the viability of solar PV as a main ingredient in today’s smart grid energy matrix.
