Abstract
Karst aquifers in the Dinaric karst are very rich with groundwater and are a very important resource for public water supply. The characteristics of the Dinaric karst are the lack, or very thin layer, of covering deposits, large amounts of precipitations, high groundwater velocities, very deep groundwater flow with a lot of faults and fault zones, pits to groundwater, concentrated sinking and large karst springs, making them extremely vulnerable to all anthropogenic influences, which are very quickly transmitted to the aquifer. Numerous multiparameter methods have been developed in the last 20 years to determine the level of vulnerability of aquifers. Each of them has its own specifics and is well adapted to the climate and region for which it was developed. The Karst Aquifer Vulnerability Assessment (KAVA) method was developed in accordance with all the characteristics of the deep karst aquifers of the Dinaric karst and tested on several basins in the area. It was developed as a part of the Global Environment Facility United Nations Environmental Programme – the Mediterranean Action Plan Strategic Partnership for the Mediterranean Sea Large Marine Ecosystem (GEF UNEP/MAP MedPartnership Project). This paper presents the KAVA method and its application to two characteristic karst basins of the Dinaric karst: the Novljanska Žrnovnica spring catchment area and the Bakar Bay catchment area.
1. Introduction
Groundwater from karst aquifers is considered an important resource and is extensively used for public water supply. In Europe, carbonate terrains occupy about 35% of the land surface, and in some countries karst groundwater contributes up to 50% to the total drinking water supply. In many regions it is the only available freshwater resource [1]. In Croatia almost 50% of all public water supplies are from karst aquifers (Figure 1; [2]).
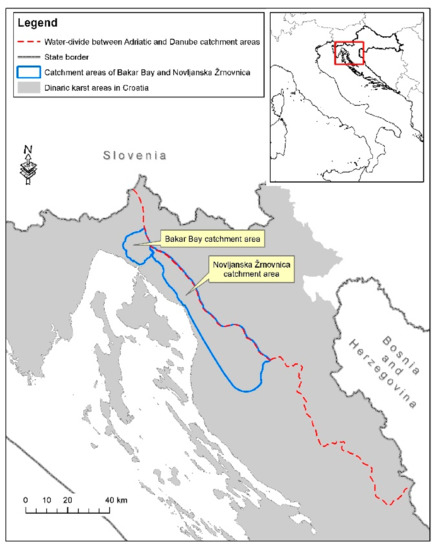
Figure 1.
Position of Novljanska Žrnovnica and Bakar Bay catchment areas in Croatia.
Karst aquifers are particularly vulnerable to contamination because of their thin soils or absence of covering deposits, flow concentration within the epikarst zone and concentrated recharge via swallow holes. As a result, contaminants may easily reach the groundwater and be rapidly transported in karst conduits over large distances [3]. For these reasons, it is very important to determine the level of vulnerability of karst aquifers for their protection and remediation, but also for spatial planning.
There are two main river basins in Croatia: the Danube River Basin and the Adriatic Sea River Basin. Each of them is further divided into several dozen grouped groundwater bodies, and river basin management plans are developed at that level in accordance with the Water Framework Directive [4]. Precisely because of this, these basins are a very important for observation of and research on water resources, from the regional to local scales. The catchments shown in this paper are parts of grouped bodies of groundwater, i.e., they must be subjected to a very detailed analysis on a local scale. Therefore, groundwater resources need to be contextualized in multiscalar dimensions. This is an important characteristic of groundwater resources, as well as the fact that they are invisible, and therefore pose an additional challenge to their management and governance [5].
The first estimates of the intrinsic vulnerability of water resources in Europe, based on the differences in the lithological composition of rocks, were made in 1968 by Margat and in 1970 by Albinet and Margat for France [6,7]. Ten years later, Vierhuff and his associates made a similar estimate for West Germany [8]. During the 1990s, Europe’s first project related exclusively to the protection of karst aquifers was launched [1]. The project emphasized the importance of a multidisciplinary approach to research into karst areas, using geological, geomorphological, geophysical, hydrological, geochemical and other means of investigation in order to obtain information about the karst environment and dynamics of the groundwater flow. From about 1985 to recent times, researchers worldwide have developed numerous methods and, in the early 2000s, GIS technology started to be used in such analyses. Some of the methods were developed primarily to assess the intrinsic vulnerability of karst aquifers. They were used for the protection of karst aquifers or as one of the fundamental bases for the development of regional spatial plans. Some of these methods include DRASTIC [9], AVI [10], GOD [11,12], EPIK [13,14,15], the Irish Method [16], REKS [17], the Austrian Method [18], VULK [19], LEA [20], PI [21,22], COP [23], SINTACS [24], The Slovene Method [25] and CC-PESTO [26], as well as many other methods. The framework for vulnerability mapping was set up through the project COST 620 [27].
That methods were applied in several catchments worldwide and, because of the specific characteristics of some karst areas, some of the methods could be applied without modification of the parameters [28,29]; whilst others had to have some parameters modified [30,31,32,33,34]. For some areas, a comparative analysis of the use of several of the most common methods of intrinsic vulnerability mapping has been conducted [35,36].
The problem is that only a few of the developed methods can be used for vulnerability analysis of deep karst aquifers, like Dinaric karst aquifers, or in the wider Mediterranean region, but mostly with some limitations. Some of the methods can be used in karst aquifers but some of the parameters used in that multiparameter methods are not fully suitable for specific characteristics of karst aquifers like Dinaric karst aquifers (e.g., large amount of precipitation, depth to groundwater, groundwater dynamics, lack of covering deposits, direct input of surface waters into groundwater through swallow- holes, very large karst springs, etc.).
There are several methods for determining the intrinsic vulnerability of karst aquifers that are frequently used in hydrogeological practice. The Karst Aquifer Vulnerability Assessment (KAVA) method was developed on the same pilot areas for which intrinsic vulnerability maps were made using the COP [23], SINTACS [24] and PI [21,22] methods. Those methods were tested with the conditions of Dinaric karst deep aquifers and some of them had some limitations, but there were also some very good parameters which were used and modified in the KAVA method.
The PI method [21,22] seems at first sight to be simple, but its basic (P and I) parameters require extensive calculation of subparameters, and this creates considerable complexity. This complex method for assessment of the impact of covering soils is unsuited to this region, which mostly lacks covering deposits. Also, the range of values for factor P (recharge) is also unsuitable, because the cutoff point for the maximum precipitation class is only 400 mm/year. All of the Dinaric karst area in Croatia falls into this category, and in some areas the average yearly precipitation is more than 4000 mm. The same problem can also be expected in the other countries in the Dinaric karst region (Slovenia, Bosnia and Herzegovina, Montenegro, Albania), but also in the other karst aquifers in the European part of the Mediterranean area. The surface catchment area maps produced by the PI method are, however, very good and we used this idea in the KAVA method.
The COP method [23] uses excessive zoning around the main sinkholes in its assessment of concentrated infiltration. The 11 categories, all utilizing a score range from 0 to 1, contrast awkwardly with the three categories used to define the influence of sinking watercourses, and this creates problems in the presentation of aquifer vulnerability.
Although the SINTACS method [24] seems at first sight very complex, it mostly works well, because each parameter is strictly defined and described in detail, and there is no need to define subparameters. The main objection to the method after implementation in the pilot areas in the Dinaric karst in Croatia was that it used too many geological parameters and with them explained all the other parameters, except the depth to the groundwater (S1) and the topographic slope (S2). This could cause the final map to be very subjective, although the vulnerability map produced for the study area was good.
The Karst Aquifer Vulnerability Assessment method is derived from a combination of parameters adjusted to the specific characteristics of the Dinaric karst aquifers and is designed primarily for assessment of the intrinsic vulnerability of karst aquifers and sources, where the final spatial analysis and vulnerability maps are made with multiparameter GIS technology. The method was developed within the GEF UNEP/MAP MedPartnership Project, UNESCO-IHP sub-component 1.1 “Management of coastal aquifers and groundwater”. The idea of the project was that karstic aquifers make up a large proportion of the aquifers in the Mediterranean region, so developing a new method for their analysis would contribute greatly to hydrogeological practice in that area. This research endeavor was prompted by the high importance of karst aquifers in providing a water supply to a large concentration of the regional population, and by the hope of increasing tourism in the Mediterranean region. In these conditions, it is necessary to harmonize and improve efficiency in the protection of these valuable natural resources in various countries to safeguard the current and future development of the region.
The novel KAVA method was tested on several different catchments in the Dinaric karst region in Croatia, and in this paper we present its application in two neighboring catchment areas in the northern part of the Dinaric karst area in Croatia: the Novljanska Žrnovnica and Bakar Bay catchment areas (Figure 1).
Although Novljanska Žrnovnica is a typical catchment area of the Dinaric karst in which is represented almost all the karst phenomena and forms involved in the development of the method, it was also necessary to apply the method to another catchment with slightly different characteristics. For this purpose, the Bakar Bay catchment was selected, a smaller karst catchment area situated adjacent to the Novljanska Žrnovnica catchment area.
2. Materials and Methods
2.1. Description of the KAVA Method
The KAVA method is based on an origin–pathway–target conceptual model, which was proposed within the project COST 620 [27]. It is primarily designed for assessment of intrinsic vulnerability, with the final spatial analysis and vulnerability maps being made with multiparameter GIS methodology. Four of the basic factors of the KAVA method for assessing intrinsic vulnerability are: overlay protection (O factor), precipitation influence (P factor), infiltration conditions (I factor) and aquifer conditions (A factor) (Figure 2 and Figure 3).
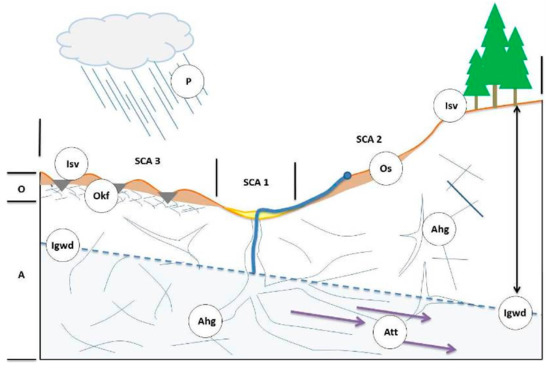
Figure 2.
Conceptual model of the Karst Aquifer Vulnerability Assessment (KAVA) method. P—precipitation influence; Isv—infiltration condition subfactor slope and vegetation, Igwd—infiltration condition subfactor groundwater depth; SCA 1–3—surface catchment areas; Os—overlay protection subfactor soils; Okf—overlay protection subfactor karst features; Ahg—aquifer conditions subfactor hydrogeological description; Att—aquifer conditions subfactor tracing tests.
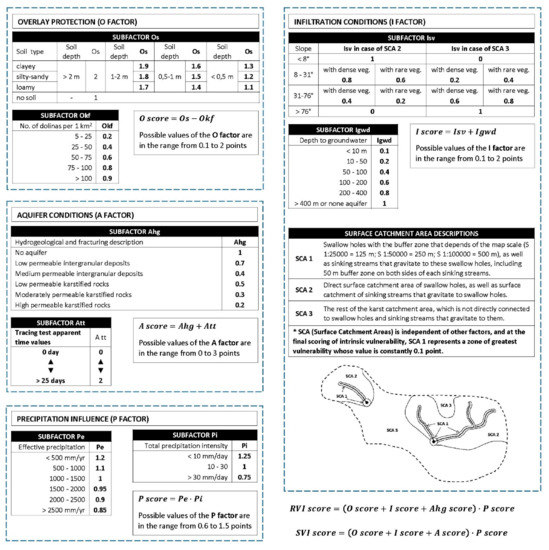
Figure 3.
The KAVA methodology.
Unlike the European approach [27] and other existing methods for intrinsic vulnerability assessment, in the KAVA method the unsaturated and saturated parts of karst aquifers are treated together. There are several reasons for this, but the primary one is due to the simplification of the overall model (the principle of Occam’s razor). Given that the carbonate karst aquifer is a highly heterogeneous and anisotropic medium, without a sufficient number of quite expensive and detailed exploration wells, which would provide sufficient certainty for the determination of groundwater levels, the separation of the unsaturated and saturated parts of karst aquifers is hardly feasible. For these reasons, the boundary between unsaturated and saturated zones in karst aquifers is often determined empirically or approximately, and the use of unsaturated zone thickness is generally an unreliable parameter, which is the lack of all models that use it.
2.2. Overlay Protection (O Factor)
The O factor defines the protective role of covering layers of karst catchments, the hydrogeological protective role of which can vary from place to place due to the different characteristics of subsurface zones in the condition of open karst. Therefore, when determining the value of the O factor, two basic data sets are used: the subfactor Os (soils) and subfactor Okf (karst features).
The Subfactor Os (soils) is evaluated to present the protective role of the covering soil. It is a biologically active zone of the aquifer in relation to the ground surface, which may result in detention and/or partial degradation of potential contaminants on the surface or at the surface. For this reason, when designing a karst intrinsic vulnerability project, it is always necessary to evaluate the protective role of soil cover according to the available soil data. Some of the key parameters required to estimate the protective role of covering soils are soil texture, particle size distribution and thickness of the covering soil.
The Subfactor Os was originally proposed as part of the COP method [23], in which overlying soil is divided into four basic groups according to its texture and grain size distribution. In the KAVA method, these soil categories are further simplified because the Dinaric karst catchments are mostly without cover deposits. The final assessment and scoring of the O factor was adapted to additionally estimated characteristics of epikarst zones.
The subfactor Okf (karst features) defines the impact of karstified and highly permeable surface and subsurface zones of karst aquifers on the overall intrinsic vulnerability of karst catchments, i.e., the impacts of epikarst zones. The epikarst zone can vary in thickness from a few meters to tens of meters, and is individually assessed as, due to its creation and the processes that happen in it, it is structurally different from the rest of the karst aquifer.
The problem with the analysis of epikarst zones is that they generally are not visible on the surface and their thickness and distribution can be determined only by detailed geophysical surveys and exploratory drilling. However, their existence is more often determined by the indirect method—by using spatial analysis of karst geomorphological features on the surface, which indicate its origin and development. The most commonly used analysis is the density of sinkholes on the surface. The basic assumption is that an epikarst zone exists even when it is not visible on the surface, as long as there are conditions that enable its development—pure limestone with visible severe open fracture systems, karst geomorphological indicators such as sinkholes, etc. [37].
The values of the O factor are obtained by subtracting the subfactor Okf from the subfactor Os as shown in Equation (1):
Possible O factor values ranges from 0.1 to 2 points. Very small values (0.1 to 0.5) correspond to the areas where the soil is very poorly developed or absent and where many dolines are present. Small to moderate values (0.5 to 1) correspond to the areas where the soil is developed to a depth of 1 m and many dolines are present, as well as areas where the soil is slightly shallower and fewer dolines are present per km2. Moderate to high values (1 to 1.5) correspond to areas where the soil is mainly developed to a depth of 2 m and fewer dolines are present. Very high values (over 1.5) generally correspond to areas where the soil is developed to a depth of 1 to 2 m and few dolines are present, as well as areas with very deep soils (>2 m) and no occurrence of dolines.
In the preparation of the final intrinsic vulnerability map with the KAVA method, unclassified O factor values must be used.
2.3. Precipitation Influence (P Factor)
The influence of precipitation (P factor) is an external stress applied to the whole vulnerability assessment used in the KAVA method. In assessing the P factor, an effective amount of rainfall must be taken into account. It is the part of the total rainfall that has a real chance of infiltrating from the surface and with percolation sinking into the deeper parts of the karst aquifer.
The effective precipitation impact on the vulnerability is expressed in the form of the Pe subfactor (effective precipitation). In assessing the vulnerability of karst aquifers the most critical factors are considered in the Pe subfactor scoring, namely the high intensity and amount of rainfall that causes rapid infiltration and transport of water with potential contaminants into the deeper parts of the aquifer.
Taking into account the fact that the distribution of total annual rainfall may also further affect the vulnerability of karst catchments, an additional Pi subfactor (precipitation intensity) is also used to determine the total P factor. This allows further modification, as needed, of the effective rainfall influence.
The values of the subfactor Pe (effective precipitation) are determined from the values of the mean effective rainfall in the catchment area. Values ranging from 1000 to 1500 mm/yr are taken as neutral, while all other values can modify the total intrinsic vulnerability of karst catchment (Figure 3). Data on effective rainfall can be obtained from previous research, meteorological and precipitation maps, etc., as well as through the calculation of many empirical formulas [38,39,40] that take into account the overall mean amount of precipitation, air temperature and other parameters relevant to effective precipitation evaluation.
Subfactor Pi (precipitation intensity) is determined from the values of the mean annual rainfall and the total number of rainy days in the catchment area, using Equation (2):
Fewer rainy days for the same total amount of rainfall causes higher precipitation intensities, which results in the increased intrinsic vulnerability of karst aquifers. In addition, more intense precipitation favors the concentrated infiltration of water into the karst underground, i.e., flushing of the aquifer unsaturated zone. On the other hand, more rainy days causes lower precipitation intensity and more uniform distribution of total rainfall during the year. This reduces the aquifer intrinsic vulnerability due to increased (slower) diffusion infiltration of water into the karst underground. To assess the overall impact of the Pi subfactor, three categories of rainfall intensity are used (Figure 3), the principle selection of which is shown in Figure 4 for three values of the total mean annual rainfall.
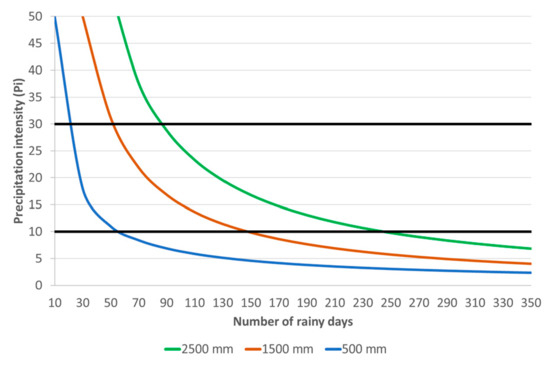
Figure 4.
Selection of basic Pi (precipitation intensity) categories.
The P factor was developed based on the guidelines proposed by the project COST 620 [27] with a certain simplification of the whole procedure and keeping in mind that precipitations represent external stress, which further modifies the total vulnerability assessment; in the case of intense rainfall this can be a positive effect of dilution of pollution.
P factor values are obtained by multiplying Pe and Pi subfactors (Equation (3)):
Possible P factor values range from 0.6 to 1.5.
In the preparation of the final intrinsic vulnerability map with the KAVA method, unclassified P factor values should be used.
2.4. Surface Catchments Areas
The surface catchment area (SCA) parameter is obtained by spatial analysis of hydrological phenomena on the surface of certain karst catchment area. The basis of the analysis is the separation of the main surface catchment areas for swallow-hole zones and the sinking streams that gravitate to them.
After an analysis, karst catchments can be divided at surface into three main areas, according to Figure 3. In further spatial analyses dependent on these areas, the conditions of diffuse or concentrated infiltration of surface water into the karst underground are estimated (SCA 2 and SCA 3), and the final intrinsic vulnerability map emphasizes the areas of greatest vulnerability (SCA 1), which include sinkholes, sinkhole zones and surface water bodies that affect them.
Depending on the scale of the final intrinsic vulnerability map, the buffer zones around SCA 1s should be defined according to Figure 3.
2.5. Infiltration Conditions (I Factor)
Assessment of the degree of surface water infiltration into the deeper parts of the karst aquifer depends on many parameters that control the processes of surface and subsurface water flow. The most important are: terrain slopes, properties of overlay deposits, the presence of vegetation and the presence of morphological forms that cause local infiltration anomalies (sinkholes, caves, dolines, etc.).
Taking into account the fact that some of these parameters have been already used in the assessment of the O factor (properties of cover sediments and karst geomorphological forms), the I factor is developed in such a way that its impact on karst catchment vulnerability depends on two distinct yet mutually connected layers: the Isv subfactor (slope and vegetation) and the Igwd subfactor (depth to groundwater).
The Isv subfactor (slope and vegetation) defines conditions at the ground surface that can affect the infiltration of surface water, and consequently conditions that affect the intrinsic vulnerability of the karst catchment, i.e., through this subfactor the influences of the terrain slope and vegetation cover on the infiltration are combined. The Vegetation parameter (v) is used for determination of the areas that are covered with dense or sparse vegetation (Figure 3). Areas covered by dense vegetation include parts of the catchment area that are covered by forests, bushy forests and bushes, while the rest of the catchment area includes the areas covered by sparse vegetation, as well as those areas where there is no vegetation cover. This information can usually be obtained through spatial analysis of land-use maps or Corine Land Cover (CLC) maps. The slope parameter (s) can be obtained relatively easily from digital elevation models by using spatial analysis methods. After analysis has been conducted, obtained values can be further classified into one of four proposed categories of slopes (Figure 3).
Slope categories and vegetation classification were developed using only two categories taken from the COP method [23] because this was the most appropriate method for the catchment areas in the Dinaric karst, with regard to estimation of surface water infiltration.
Given the fact that the Isv subfactor is directly controlled by hydrological conditions on the catchment surface, prior to its overall impact assessment on catchment vulnerability it is necessary to align it with the SCA parameter.
- When assessing the Isv in the SCA 2 area, the conditions of concentrated infiltration of water into the karst underground are assumed, because dominant surface runoffs related to concentration and flow of surface water to watercourses and their swallow holes are in this area. In such conditions, the combination of slopes and vegetation provides the Isv subfactor value, which suggests greater vulnerability in cases of major slopes and scarce vegetation (Figure 3). In real conditions, this means shorter transport time and rapid water infiltration into the karst underground.
- When assessing the Isv in the SCA3 area, conditions of diffuse infiltration of water into the karst underground are assumed, because longer retention of water on the catchment surface is dominant in this area. Therefore, the impact assessment of slopes and vegetation is determined in a reverse manner to the previous case. The Isv subfactor values are such that they indicate greater vulnerability in cases of small slopes and scarce vegetation (Figure 3).
The Igwd subfactor (groundwater depth), through the assessment of the depth to groundwater values, defines the impact (the importance) of the infiltrated surface water on the overall intrinsic vulnerability of a specific karst catchment area, where the values of the subfactor Igwd are not only related to the unsaturated zone, but to the whole aquifer. Although this subfactor is difficult to determine, it is not negligible. A deeper water table means that the impact of infiltrated surface water will be smaller, due to a longer and/or prolonged transport time of potentially contamination water toward the saturated part of the karst aquifer.
For the best assessment of Igwd subfactor values, it is necessary to have a good piesometric boreholes network of the whole catchment area. With such data and with good spatial analysis, it is possible to determine the position of the water table in the karst aquifer and prepare a groundwater depth map (GWDM).
Due to a lack of such data in karst areas, it is very difficult to make accurate groundwater depth maps. In this case, it is possible to estimate the Igwd subfactor based on good knowledge about hydrogeological relations in the karst catchment, particularly using knowledge of the absolute groundwater level in the aquifer. To obtain a final GWDM a map of the absolute level of groundwater is subtracted from the digital terrain model (elevation map). The final groundwater depth map obtained by spatial analyses of boreholes data or by estimation is the base for the scoring of the Igwd subfactor.
Some of the vulnerability assessment methods for intrinsic vulnerability often divide the saturated and unsaturated zones of the aquifer, which is generally reasonable in the case of intergranular aquifers, but not in the case of karst aquifers. In the KAVA method, the exact depth to groundwater is not specified, but the range of values is, which means easier empirical evaluation of this parameter for researchers. This is actually a modified and further simplified version of the approach used in the SINTACS method [24], which also does not take into account exact values, but the ranges of depth to groundwater.
The I factor values are obtained by summing the subfactors Igwd and Isv (which specifically define the SCA 2 and SCA 3 parts of the catchment area), because ultimately the influence of each of these two subfactors complements the other, as shown in Equation (4):
Possible values are in the range of 1.5 to 2, implying that this factor impacts the overall intrinsic vulnerability of karst aquifers in a way that is always decreasing it—the only question is to what extent.
In preparing the final intrinsic vulnerability map with the KAVA method, unclassified I factor values must be used.
2.6. Aquifer Conditions (A Factor)
Conditions in the karst aquifer itself, important for the assessment of intrinsic vulnerability, are defined as the A factor, the overall impact of which is estimated through two layers of data: static conditions in karst aquifers are estimated with the Ahg subfactor (hydrogeological description) and dynamic conditions in karst aquifers are estimated with the Att subfactor (tracing tests).
In determining the Ahg subfactor values (hydrogeological description), static conditions in the karst aquifer are estimated based on available geological, lithological and hydrogeological data, while the basic criteria are the lithological composition of the rocks and the level of karstification. Other information that may also help in the assessment of this subfactor come from geomorphologic analysis, the results of speleological exploration, the results of well testing, spring hydrograph analysis, hydrochemical analysis and geophysical surveys.
Scoring of the Ahg subfactor is adapted to the overall methodology and represents a relative and immeasurable value. These values only indicate the fact that one hydrogeological formation, relatively speaking, is more or less vulnerable than another (Figure 3).
In determining the Att subfactor values (tracing tests), dynamic conditions in the karst aquifer are estimated based on the results of tracing tests in the observed karst catchment area. Observed tracing tests have to be performed during the rain seasons when the groundwater flow velocities are the highest. Data can be obtained by analyzing the discrete apparent time values.
It is possible to obtain these values for each tracing test by processing and analyzing all relevant tracing tests—apparent groundwater velocities and distance of tracer injection and tracer appearance sites. Using GIS spatial analysis with suitable interpolation methods, it is possible to obtain from discrete apparent time values a continuous spatial distribution of tracing values relevant for an investigated karst catchment area.
It should be noted that the quality of spatial interpolation of tracing results will be more reliable the better the spatial distribution of the conducted tracing tests, which also results in more uniform values for tracing tests carried out in the same part of the catchment area.
Smaller values of the Att subfactor suggest better “connectivity” of a certain part of the catchment with the karst source or source zone, which actually increases the overall vulnerability of that part of catchment area compared to the rest of the area (Figure 3).
When assessing the values of the Ahg and Att subfactors, it should be taken into account that, in relative time, these values are fixed, i.e., their potential variability cannot significantly effect the overall intrinsic vulnerability assessment of the karst system. This is important to note because karst aquifers can be very dynamic hydrogeological systems, as is the case of the karst area of the Dinarides in Croatia. In such conditions, some parts of the karst aquifers can change their hydrogeological function over time (e.g., permanent and temporary karst springs) and in space (e.g., fluctuations in the water table). However, due to the simplification of the model, these changes should be taken into account only when there are justifiable reasons or new knowledge (e.g., new hydrogeological studies, new tracing test results, etc.). In such cases, both subfactors should be re-evaluated and scored again and their impact on the overall intrinsic vulnerability of the karst system reassessed.
The A factor values (A scores) are obtained by summing the Ahg and Att subfactors, as the effects of these two subfactors complement each other (Equation (5)):
Possible values are in the range of 0.2 to 3. Smaller values indicate the greater vulnerability of a karst system conditioned by greater karstification, potentially better permeability of layers and tracing test results that show better and faster connections with the karst spring. High values of the A factor indicate parts of the catchment area that are not directly related to karst springs, or parts of catchment areas for which the permeability is limited. These are very often areas made of non-carbonate rocks, in which shallow subsurface aquifers with limited spreading could be developed.
In preparing the final intrinsic vulnerability map with the KAVA method, unclassified A factor values should be used.
2.7. Vulnerability Indices
The overall results of the karst catchment analysis are two indices of vulnerability. The source vulnerability index (SV index) refers to the assessment of the intrinsic vulnerability of karst springs (Equation (6)), and the resource vulnerability index (RV index) refers to the assessment of the intrinsic vulnerability of karst aquifers (Equation (7)).
In calculations of both indices, a critical parameter is the A factor. Specifically, when assessing the intrinsic vulnerability of karst springs (source vulnerability), values of the total A factor related to the observed spring are used, since in this case the A factor takes into account the static and dynamic conditions in the karst system.
By separating the A factor into the two main subfactors (Ahg and Att) and taking into account only subfactor Ahg, an estimation of the intrinsic vulnerability of the karst aquifer (resource vulnerability) can be obtained, because in this case the A factor considers only the static conditions in the karst aquifer.
Calculation of both indices is made in such a way that the scores obtained by calculation of each factor (O score, I score, A score) are summed altogether and multiplied by the score of the P factor (P score), which represents the external stress in the KAVA method. After that, the additional extraction of the most vulnerable parts in the catchment area (swallow holes, swallow hole zones and zones of sinking streams that gravitate to these swallow holes) should be undertaken in such a way that the SCA 1 parts of the catchment area automatically have a unique value of 0.1 points.
Finally, the SV index values range between 0.25 and 10.5, and the RV index values range between 0.25 and 7.5.
For the final intrinsic vulnerability map, the obtained values of these two indices are classified into six categories of vulnerability (Table 1). The spatial distribution of the SV index is displayed in the form of a source vulnerability map and the spatial distribution of the RV index in the form of a resource vulnerability map.

Table 1.
Resource and source vulnerability assessment scheme.
3. Application of the KAVA Method
3.1. Description of the Novljanska Žrnovnica and the Bakar Bay Catchment Areas
The Novljanska Žrnovnica catchment area occupies about 1000 km2, which makes it one of the largest karst catchments in the Adriatic basin in Croatia. The entire catchment is in Croatian territory; there are no cross-border characteristics. The catchment is oriented north-east–south-west, echoing the geological structures of the Dinarides. On the north side of the catchment boundary is the watershed between the Adriatic Sea and Danube River basins. Numerous complex hydrogeological studies have been carried out on this catchment area and these have shown the positions of the watersheds. The spring itself is in the central part of the catchment area. It is fed in part from the northwestern part of the catchment (Lič polje), in part from the mountain areas in the hinterland, which stretch to the Gorski kotar area, and in part from the Lika area (the sinkhole zones around the rivers Gacka and Lika) (Figure 5). This pattern has been confirmed by numerous tracing tests and hydrogeochemical research.
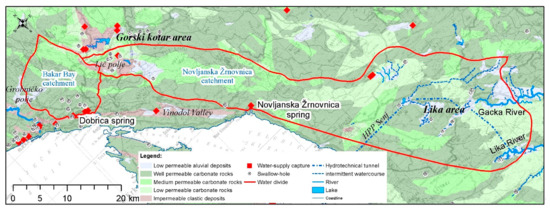
Figure 5.
Catchment areas of Novljanska Žrnovnica and Bakar Bay.
The biggest spring in the catchment area is Novljanska Žrnovnica spring. The capacity of the spring varies during the year, from 0.5 m3/s during the summer drought period to almost 15 m3/s during the autumn rainy period. In addition to the Novljanska Žrnovnica spring, there are several other permanent and temporary springs in the more than 100 km long discharge zone along the coast that forms a border of the catchment area. Some of them produce a significant amount of water, but only the water from Novljanska Žrnovnica is captured directly to contribute to the public water supply. The reasons are that the other springs dry up substantially or completely during the summer or have big problems with salinization [41].
In the geological composition of this catchment area most of the elements characteristic of the geological structure of the Dinarides can be found, from predominantly clastic rocks of the Palaeozoic Era in anticline forms to a complete sequence of Mesozoic Era rock formations, which means that the carbonate rocks are several thousand meters thick. The boundary conditions of the Novljanska Žrnovnica spring catchment area, the direction of groundwater flow and the occurrence of springs and sinks all directly reflect the geological and structural conditions.
The most important water resources system in the Lika region, as well as in the Novljanska Žrnovnica catchment area, comprises the Lika and Gacka rivers, in which most of the surface water of the area is concentrated. Under natural conditions, the waters of these rivers sank entirely into swallow holes (ponor) in the Gacka and Lika poljes, and the groundwater in the area from Novi Vinodolski to the south drained into coastal springs. However, with the construction of HPP Senj (a hydroelectric power plant), the natural conditions have changed substantially, especially during dry periods, as during rainy periods the overflow of water still drains into the natural sinks.
The Bakar Bay catchment area (Figure 5) spreads from the discharge zone on the north side of the Bakar Bay towards the mountain region of Gorski kotar. Also, groundwater that is temporarily discharged on the northeastern side of the Grobničko polje and sinks in the southern edge belongs to the same catchment area, as was confirmed by the tracing tests. The catchment covers the slopes of the mountain region of Gorski kotar from the southern part of Grobničko polje on the northwest to the Lič polje on the southeast side of the catchment area. The southwest boundaries of the catchment are impermeable flysch deposits of the Vinodol valley, which has been flooded by sea in the Bakar Bay area. The northeastern border is formed of impermeable clastic rocks with an anticline core in the Gorski kotar region.
Occurrences of springs are related to the fault contact between the well-permeable carbonate rocks of the Gorski kotar anticline structure and the impermeable Eocene clastic rocks on the northeast side of the submerged part of Vinodol valley in the Bakar Bay (Figure 4). The mentioned faulted zone is very complex because of the appearance of laminate structures, with impaired identification of the hydrogeologically active parts of the aquifer. Part of the faulting zone is submerged, which creates problems in terms of the relations between fresh and salt water during summer dry periods.
Several springs in the Bakar Bay catchment area are captured for the water supply but the biggest is Dobrica spring, with a minimum capacity of approximately 90 l/s. The problem with captured Dobrica spring water is the requirement for salinization during summer dry periods, sometimes for more than a month. The spring has problems with saltwater intrusion because of the submerged contact between carbonate rocks and flysch deposits, which has resulted in the openness of the structures to the intrusion of sea water and the direct influence on the coastal aquifer. On the other hand, deep karstification of carbonate rocks allows flows of specific weighted sea water in the deep parts of the aquifer and its conical raising towards the pumps at water captures when the pressure of fresh water from the basin gets low.
3.2. Vulnerability Maps of the Novljanska Žrnovnica and Bakar Bay Catchment Areas
The data needed to create the intrinsic vulnerability map were collected from numerous studies made in the last fifty years. These studies were undertaken in the context of groundwater protection, water research, determination of basins, groundwater tracing tests and detailed research in individual springs, sinkholes and sinking zones. In addition to the mentioned studies, data from thematic maps were used, such as data on covering deposits from the Hydropedological Map of the Republic of Croatia (S 1:300,000) [42], geological data from the Basic Geological Map of the Republic of Croatia (S 1:100,000), data on aquifers and hydrogeological parameters from the Basic Hydrogeological Map of the Republic of Croatia (S 1:100,000), hydrometeorological data from the Climate Atlas of Croatia [43], digital terrain model from topographic maps of the Republic of Croatia (S 1:25,000), soil use from CORINE Land Cover maps, etc.
Factor O values were determined on the basis of subfactors Os (soils) and Okf (karst features). Subfactor Os is defined by two criteria: the soil texture (which differs in terms of clay, silty sand and loamy soil) and the thickness of the soil cover (for which there are four classes: shallower than 0.5 m, 0.5–1 m, 1–2 m and over 2 m). Descriptions of the texture and thickness of soils in the study area were taken from the hydropedological map (S 1:300,000) [31]. This classification produced the required polygon values. Subfactor Okf concerns the impact of epikarst zones. It was estimated on the basis of a spatial analysis of the density of dolines, which was digitized from topographic maps (S 1:25,000). Using the ArcGIS/ArcInfo Spatial Analyst tool (ESRI) and the density analysis method, the discrete point data were converted to rasters.
The final values of the factor O were derived by subtracting the Okf score from the Os raster (Figure 6). These show the protective role of covering sediments in the Novljanska Žrnovnica spring and the Bakar Bay catchment areas.
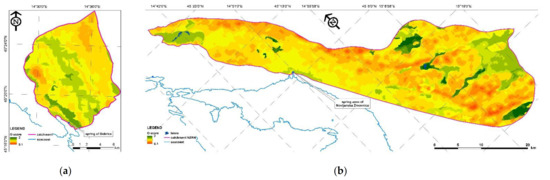
Figure 6.
Overlay protection (O) map—(a) Bakar Bay catchment; (b) Novljanska Žrnovnica catchment.
P factor values were determined on the basis of the Pe (effective precipitation) and Pi (precipitation intensity) subfactors. Subfactor Pi was determined from mean annual precipitation and the total number of rainy days. A map of mean annual precipitation for the area of Croatia is available as a result of earlier monitoring and research [44]. In this study, only the data related to the Novljanska Žrnovnica spring and the Bakar Bay catchment areas were used. The total number of rainy days was obtained from the map of the mean annual number of days with the amount of precipitation ≥ 1 mm [45]. Digitization of the precipitation data provided the required polygon values, which were reclassified to the default values to produce the Pi raster. Subfactor Pe is determined from the values of mean effective precipitation in the catchment area, using the empirical formula developed by Žugaj [40]; Equation (8)), which is often used to estimate the effective amount of precipitation in the Dinaric karst in Croatia:
The P scores were obtained by multiplying the Pe and Pi rasters to produce a grid with unclassified values for the spatial distribution of the P factor. These scores were then classified to produce the P map (Figure 7), which represents a spatial distribution of the precipitation impacts on natural vulnerability in the Novljanska Žrnovnica spring and Bakar Bay catchment areas.
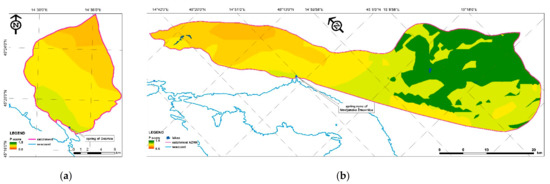
Figure 7.
Precipitation influence (P) map—(a) Bakar Bay catchment; (b) Novljanska Žrnovnica catchment.
From a spatial analysis of hydrological and hydrogeological relations, the catchment areas of the Novljanska Žrnovnica spring and Bakar Bay were divided into three main types of catchment area, using the definitions for the SCA parameter. To do this, we used hydrogeological maps (S 1:100,000 and S 1:300,000), previous hydrogeological studies and topographic maps (S 1:25,000). The point and line data were converted into zonal polygon values using the ArcGIS/ArcInfo Spatial Analyst tool and the ring buffering method, and these were digitized to produce the SCA grid (Figure 8).
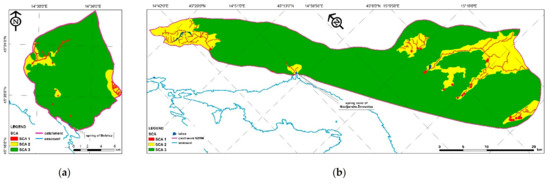
Figure 8.
Surface catchment area (SCA) map—(a) Bakar Bay catchment; (b) Novljanska Žrnovnica catchment.
Values of the I factor were determined on the basis of subfactors Isv (slope and vegetation) and Igwd (infiltration groundwater depth). The map of terrain slopes was derived from the digital elevation model (DEM), created using terrain contours digitized from topographic maps (S 1:25,000). Figure 3 provides the classification used to produce the Isv raster.
To assess the impact of vegetation we used the CLC map and again classified the results using Figure 3 and the definitions of vegetation cover outlined earlier. The values of s and v were harmonized with the SCA parameter to produce a raster with unclassified values for the spatial distribution of the Isv subfactor.
Subfactor Igwd was determined based on the map of the depth to groundwater (groundwater map). Since, as was explained earlier, no accurate data were available, estimates were used.
Final values of the I factor (I scores) were obtained by summing the Isv and Igwd rasters, which gave the raster with unclassified values for the spatial distribution of factor I. After reclassification of the raster, the I map was created (Figure 9), showing the impact of infiltration on the intrinsic vulnerability of the Novljanska Žrnovnica and Bakar Bay catchment areas.
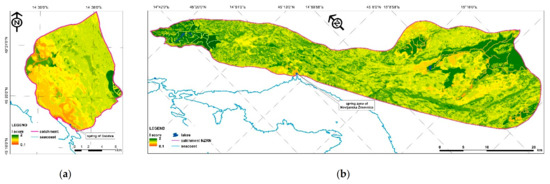
Figure 9.
Infiltration conditions (I) map—(a) Bakar Bay catchment; (b) Novljanska Žrnovnica catchment.
The values of the A factor were determined on the basis of subfactor Ahg (hydrogeological description), which defines the static conditions in a karst aquifer (Figure 10), and subfactor Att (tracing tests), which defines the dynamic conditions in a karst aquifer (Figure 11). For Ahg data on lithological units from the Basic Geological Map of Croatia were used, along with hydrogeological maps of the wider catchment area and earlier studies of hydrogeological properties of carbonate rocks in the catchment.
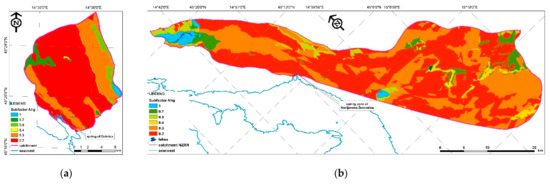
Figure 10.
Aquifer conditions hydrogeological description (Ahg) raster—(a) Bakar Bay catchment; (b) Novljanska Žrnovnica catchment.
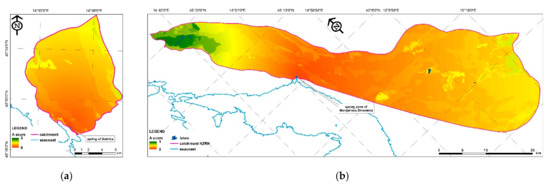
Figure 11.
A map with the aquifer conditions tracing tests (Att) factor included—(a) Bakar Bay catchment; (b) Novljanska Žrnovnica catchment.
The values of subfactor Att (tracing tests) were obtained on the basis of the results of tracing tests performed in the study area (Figure 3).
These procedures enabled us to produce the index value of the source (spring) intrinsic vulnerability (SV index) and the resource intrinsic vulnerability of the aquifer as a whole (RV index). The values of the SV and RV indexes were derived from spatial analysis of all input maps defined by factors O, P, I and A using Equations (6) and (7).
Figure 12 shows the SV map. In the Bakar Bay catchment area, the Dobrica spring was used as a reference spring in the analysis, it being the largest and most significant spring in the catchment area for the public water supply of the city of Rijeka. In the Novljanska Žrnovnica catchment area, the Novljanska Žrnovnica spring was used as a reference spring in the analysis, this also being the largest and most significant spring in the catchment area for the public water supply of the entire surrounding touristic riviera. Different parts of the catchment areas are marked to indicate their vulnerability, from very low vulnerability to extremely high vulnerability, highlighting where further detailed research would be needed to support any spatial interventions; the map can also be used as one of the bases for determining sanitary protection zones. The classified RV map (Figure 13) shows the intrinsic vulnerability of the karst aquifer in the catchment area. It is a good basis for spatial planning, as well as for planning for the remediation of potential and actual pollutants in the basin.
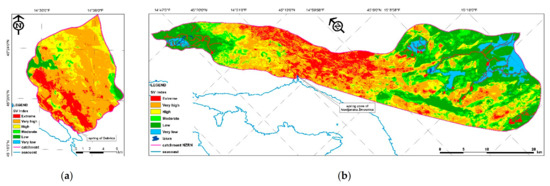
Figure 12.
Classified source vulnerability map—(a) Bakar Bay catchment; (b) Novljanska Žrnovnica catchment.
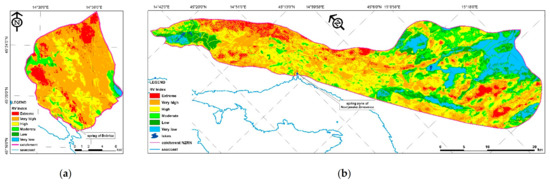
Figure 13.
Classified resource vulnerability map—(a) Bakar Bay catchment; (b) Novljanska Žrnovnica catchment.
4. Conclusions
The multiparameter KAVA methodology was developed as part of projects for the UNESCO-IHP in 2014 [41,44] and 2015 [45] examining the intrinsic vulnerability of the Novljanska Žrnovnica karstic spring catchment area and the Bakar Bay catchment area, located at the northern part of the Croatian seacoast. Although Novljanska Žrnovnica is a typical catchment area of the Dinaric karst in which almost all the karst phenomena and forms could be found with the development of the KAVA method, it was necessary to test the method in another catchment with slightly different characteristics. For this purpose, the Bakar Bay catchment was selected, a smaller karst catchment area situated adjacent to the Novljanska Žrnovnica catchment area.
The verification of the KAVA methodology was carried out according to the existing KAVA methodology in the same way as the majority of the previous analyses on the Bakar Bay catchment area. In this way, initial vulnerability maps were obtained. By comparing the vulnerability maps and all subfactors and factors for both catchment areas, detailed multiparameter analysis of the obtained data was performed.
Recommendations for the management of groundwater can be divided into four categories: restrictions, active protection measures, remediation actions and dissemination.
Restrictions can be developed according to the corresponding vulnerability classes, primarily for the locating of new (potentially polluting) human activities. In the case of karst aquifers, the protection criteria can be specified in accordance with the vulnerability class determined by the RV index. In the case of karst springs or groundwater intakes, the protection criteria can be specified in accordance with the vulnerability class determined by the SV index.
Active protection measures may include frequent water quality monitoring in the very high and extreme vulnerability karst areas, if it is possible with the morphology of the terrain. They may also include actions to improve the situation of water, such as construction of public water supply and wastewater disposal systems, introduction of clean production, ecological farming and installation of tanks for hazardous and polluting substances with additional multiple protection.
Remediation actions primarily refer to existing human activities that may threaten the good condition of groundwater in a certain karst area. A necessary remediation action program may include a list of all pollutants in the karst area, a list of priority remediation procedures, etc.
Dissemination activities refer to public participation, at a certain scale; this is always welcome and there are very good reasons why such activities should be organized, especially at a local scale. Local public participation meetings could be held, organized either by the competent authority or by local water managers.
The KAVA method was developed because only a very small number of the methods previously developed can be used without significant limitations in determining the intrinsic vulnerability of karst aquifers, such as aquifers in the Dinaric karst. Due to the very similar characteristics of karst aquifers, this method can be used in the wider Mediterranean area as well as in Croatia, which was the intention of the UNESCO projects within which this method was developed.
The results of the vulnerability mapping can be used as a tool—as additional information—in complex hydrogeological research work in a particular catchment area and in groundwater protection projects.
Author Contributions
Conceptualization, R.B., H.M. and B.B.; methodology, R.B. and H.M.; formal analysis, R.B., H.M. and J.L.; investigation, R.B., H.M., B.B. and J.L.; data curation, R.B.; writing—original draft preparation, R.B. and H.M.; writing—review and editing, R.B., H.M., B.B. and J.L.; visualization, R.B. and H.M. All authors have read and agreed to the published version of the manuscript.
Funding
The work was funded by the UNESCO-IHP through the Global Environment Facility (GEF)—UN Environment Programme (UNEP)—Mediterranean Action Plan (MAP) Strategic Partnership for the Mediterranean Sea Large Marine Ecosystem (MedPartnership Project)—UNESCO-International Hydrological Programme (IHP) sub-component 1.1 on “Management of coastal aquifers and groundwater”, and by the Primorsko-goranska County of the Republic of Croatia (co-financing of the research).
Institutional Review Board Statement
Not applicable.
Informed Consent Statement
Not applicable.
Data Availability Statement
Not applicable.
Conflicts of Interest
The authors declare no conflict of interest.
References
- COST 65. Hydrogeological Aspects of Groundwater Protection in Karstic Areas; Final Report. Report EUR 16547 EN; Directorat-General XII Science, Research and Development, European Commission: Brussels, Belgium, 1995; 446p. [Google Scholar]
- Biondić, B.; Biondić, R. Hydrogeology of the Dinaric karst in Croatia (hrv.—Hidrogeologija Dinarskog krša u Hrvatskoj); University Textbook; Faculty of Geotechnical Engineering, University of Zagreb: Varaždin, Croatia, 2014; 341p. [Google Scholar]
- Goldscheider, N. Karst groundwater vulnerability mapping: Application of a new method in the Swabian Alb, Germany. Hydrogeol. J. 2005, 13, 55–64. [Google Scholar] [CrossRef]
- European Commission. Directive 2000/60/EC of the European Parliament and of the Council Establishing a Framework for Community Action in the Field of Water Policy; European Commission: Brussels, Belgium, 2000; 72p. [Google Scholar]
- Da Silva, L.P.B.; Hussein, H. Production of scale in regional hydropolitics: An analysis of La Plata River Basin and the Guarani Aquifer System in South America. Geoforum 2019, 99, 42–53. [Google Scholar] [CrossRef]
- Margat, J. Vulnérabilité Des Nappes D’eau Souterraine À La Pollution; BRGM Publication: Orléans, France, 1968. [Google Scholar]
- Albinet, M.; Margat, J. Cartographie De La Vulnerabilité À La Pollution Des Nappes D’eau Souterraine; BRGM Publication: Orléans, France, 1970; pp. 13–22. [Google Scholar]
- Vierhuff, H.; Wagner, W.; Aust, H. Die Grundwasservorkommen in der Bundesrepublik Deutschland. Geol. Jahrbuch 1981, 30, 110. [Google Scholar]
- Aller, J.R.; Bennet, T.; Feheer, J.H.; Petty, R.J.; Hackett, G. DRASTIC, a Standardised System for Evaluating Groundwater Pollution Potential Using Hydrogeological Settings; Report no. 600/2-87-035; US Environmental Protection Agency (EPA): Washington, DC, USA, 1987; 641p. [Google Scholar]
- Van Stempvoort, D.; Ewert, L.; Wassenaar, L. Aquifer vulnerability index (AVI): A GIS compatible method for groundwater vulnerability mapping. Can. Water Res. J. 1993, 18, 25–37. [Google Scholar] [CrossRef]
- Foster, S.S.D. Fundamental Concepts in Aquifer Vulnerability, Pollution Risk and Protection Strategy. In Vulnerability of Soil and Groundwater to Pollution, Proceedings and Information No. 38 of the International Conference; Van Duijvanbooden, W., van Waegeningh, H.G., Eds.; TNO Committee on Hydrological Research: The Hague, The Netherlands, 1987; pp. 69–86. [Google Scholar]
- Vrba, J.; Zaporozec, A. Guidebook on Mapping Groundwater Vulnerability. Int. Contrib. Hydrol. 1994, 16, 156. [Google Scholar]
- Doerfliger, N.; Zwahlen, F. EPIK, a New Method for Outlining of Protection Areas: A Water Vulnerability Assessment in Karst Environment. In Proceedings of the 5th International Symposium on Karst Waters and Environmental Impacts, Antalya, Turkey, 10–20 September 1995; pp. 117–123. [Google Scholar]
- Doerfliger, N.; Zwahlen, F. Practical Guide, Groundwater Vulnerability Mapping in Karstic Regions (EPIK); Swiss Agency for the Environment, Forests and Landscape (SAEFL): Bern, Switzerland, 1998; 56p. [Google Scholar]
- Doerfliger, N.; Jeannin, P.Y.; Zwahlen, F. Water vulnerability assessment in karst environments: A new method of defining protection areas using a multi-attribute approach and GIS tools (EPIK method). Environ. Geol. 1999, 39, 165–176. [Google Scholar] [CrossRef]
- Daly, D.; Drew, D.P. Irish Methodologies for Karst Aquifer Protection. In Multidisciplinary Conference on Sinkholes and the Engineering and Environmental Impacts of Karst; Beck, B.F., Pettit, A.J., Herring, J.G., Eds.; Johns Hopkins University: Baltimore, MD, USA, 1999; pp. 267–272. [Google Scholar]
- Malik, P.; Svasta, J. REKS—An Alternative Method of Karst Groundwater Vulnerability Estimation. In Hydrogeology and Land Use Management: Proceedings of the XXIX Congress of the International Association of Hydrogeologists; Geological Survey of Slovak Republic: Bratislava, Slovak, 1999; pp. 79–85. [Google Scholar]
- Cichocki, G.; Zojer, H.; Zojer, H. Karstwasserschutz und Vulnerabilität. Entwicklung eines Modells in den Karnischen Alpen—Mitteilungen IAG BOKU; Institut für Angewandte Geologie, Universität für Bodenkultur Wien: Vienna, Austria, 2001. [Google Scholar]
- Jeannin, P.-Y.; Cornaton, F.; Zwahlen, F.; Perrochet, P. VULK: A Tool for Intrinsic Vulnerability Assessment and Validation. In Proceedings of the 7th Conference on Limestone Hydrology and Fissured Media, Besançon, France, 20–22 September 2001; pp. 185–190. [Google Scholar]
- Dunne, S. Vulnerability Mapping for the Protection of UK Karst Aquifers. Ph.D. Thesis, Trinity College Dublin, Dublin, Ireland, 2003. [Google Scholar]
- Goldscheider, N.; Klute, M.; Sturm, S.; Hötzl, H. The PI method—A GIS-based approach to mapping groundwater vulnerability with special consideration of karst aquifers. Z. Angew. Geol. 2000, 46, 157–166. [Google Scholar]
- Goldscheider, N. Hydrogeology and Vulnerability of Karst Systems—Examples from the Northern Alps and Swabian Alps. Master’s Thesis, Department of Applied Geology, University of Karlsruhe, Karlsruhe, Germany, 2002. [Google Scholar]
- Vias, J.M.; Andreo, B.; Perles, M.J.; Carrasco, F.; Vadillo, I.; Jimenez, P. Proposed method for groundwater vulnerability mapping in carbonate (karstic) aquifers: The COP method. Hydrogeol. J. 2006, 14, 912–925. [Google Scholar] [CrossRef]
- Civita, M.; de Maio, M. Valutazione E Cartografia Automatica Della Vulnerabilità Degli Acquiferi All’inquinamento Con Il Systema Parametrico SINTACS R5; Pitagora Editrice: Bologna, Italy, 2000; 191p. [Google Scholar]
- Ravbar, N.; Goldscheider, N. Proposed methodology of vulnerability and contamination risk mapping for the protection of karst aquifers in Slovenia. Acta Carsol. 2007, 36, 461–475. [Google Scholar] [CrossRef]
- Stevanović, Z.; Marinović, V.; Krstajić, J. CC-PESTO: A novel GIS-based method for assessing the vulnerability of karst groundwater resources to the effects of climate change. Hydrogeol. J. 2021, 1, 1–20. [Google Scholar] [CrossRef]
- Zwahlen, F. (Ed.) Vulnerability and Risk Mapping for the Protection of Carbonate (Karst) Aquifers; Final report COST 620; Directorate-General Science, Research and Development, European Commission: Brussels, Belgium, 2004; 297p. [Google Scholar]
- Tayer, T.D.; Velásques, L.N.M. Assessment of intrinsic vulnerability to the contamination of karst aquifer using the COP method in the Carste Lagoa Santa Environmental Protection Unit, Brazil. Environ. Earth Sci. 2017, 76, 445. [Google Scholar] [CrossRef]
- Bagherzadeh, S.; Kalantari, N.; Nobandegani, A.F.; Derakhshan, Z.; Conti, G.O.; Ferrante, M.; Malekahmadi, R. Groundwater vulnerability assessment in karstic aquifers using COP method. Environ. Sci. Pollut. Res. 2018, 25, 18960–18979. [Google Scholar] [CrossRef] [PubMed]
- Noori, R.; Ghahremanzadeh, H.; Kløve, B.; Adamowski, J.F.; Baghvand, A. Modified-DRASTIC, modified-SINTACS and SI methods for groundwater vulnerability assessment in the southern Tehran aquifer. J. Environ. Sci. Heal. Part A 2019, 54, 89–100. [Google Scholar] [CrossRef] [PubMed]
- Awawdeh, M.; Al-Kharbsheh, N.; Obeidat, M.; Awawdeh, M. Groundwater vulnerability assessment using modified SINTACS model in Wadi Shueib, Jordan. Ann. GIS 2020, 26, 377–394. [Google Scholar] [CrossRef]
- Kapelj, S.; Loborec, J.; Kapelj, J. Assessment of aquifer intrinsic vulnerability by the SINTACS method. Geol. Croat. 2013, 66, 119–128. [Google Scholar] [CrossRef]
- Jones, N.A.; Hansen, J.; Springer, A.E.; Valle, C.; Tobin, B.W. Modeling intrinsic vulnerability of complex karst aquifers: Modifying the COP method to account for sinkhole density and fault location. Hydrogeol. J. 2019, 27, 2857–2868. [Google Scholar] [CrossRef]
- Moreno-Gómez, M.; Martínez-Salvador, C.; Moulahoum, A.-W.; Liedl, R.; Stefan, C.; Pacheco, J. First Steps into an Integrated Karst Aquifer Vulnerability Approach (IKAV). Intrinsic Groundwater Vulnerability Analysis of the Yucatan Karst, Mexico. Water 2019, 11, 1610. [Google Scholar] [CrossRef]
- Polemio, M.; Casarano, D.; Limoni, P.P. Karstic aquifer vulnerability assessment methods and results at a test site (Apulia, southern Italy). Nat. Hazards Earth Syst. Sci. 2009, 9, 1461–1470. [Google Scholar] [CrossRef]
- Moreno-Gómez, M.; Pacheco, J.; Liedl, R.; Stefan, C. Evaluating the applicability of European karst vulnerability assessment methods to the Yucatan karst, Mexico. Environ. Earth Sci. 2018, 77, 682. [Google Scholar] [CrossRef]
- Ford, D.C.; Williams, P.W. Karst Hydrogeology and Geomorphology; John Wiley & Sons: Hoboken, NJ, USA, 2007; 562p. [Google Scholar]
- Keller, H. Niederschlah, Abfuss und Verdunstung in MittelEuropa; Jb. Gewässerkde. Norddeutschlands, Bes. Mitt. 1, Nr. 4. Berlin, 1906. Available online: https://link.springer.com/chapter/10.1007%2F978-3-642-53182-8_3 (accessed on 10 February 2021).
- Srebrenović, D. Primijenjena Hidrologija (Applied Hydrology); Tehnička Knjiga: Zagreb, Croatia, 1986; 509p. [Google Scholar]
- Žugaj, R. Regionalna Hidrološka Analiza u Kršu Hrvatske (Regional Hydrological Analyses in the Croatian Karst); Monograph no. 1; Croatian Hydrologic Society: Zagreb, Croatia, 1995; 139p. [Google Scholar]
- Biondić, R.; Meaški, H.; Biondić, B.; Loborec, J. Vulnerability Mapping of Novljanska Žrnovnica Karstic Spring Catchment Area in Croatia; Final Report. Technical Report; Faculty of Geotechnical Engineering, University of Zagreb: Varaždin, Croatia, 2014. [Google Scholar]
- Vidaček, Ž.; Bogunović, M.; Husnjak, S.; Sraka, M.; Bensa, A.; Petošić, D. Hidropedološka Karta Republike Hrvatske, M 1:300.000. Karta I Tumač. (Hydropedological Map of the Republic of Croatia S 1:300.000. Map and Guidebook); Faculty of Agriculture, University of Zagreb: Zagreb, Croatia, 2004. [Google Scholar]
- Zaninović, K.; Gajić-Čapka, M.; Perčec Tadić, M. Klimatski atlas Hrvatske (Climate atlas of Croatia) 1961–1990, 1971–2000; Državni Hidrometeorološki Zavod (DHMZ): Zagreb, Croatia, 2008. [Google Scholar]
- Biondić, R.; Meaški, H.; Biondić, B. Vulnerability Mapping of the Novljanska Žrnovnica Karstic Spring Catchment Area in Croatia. In Proceedings of the International Conference and Field Seminar “Karst without Boundaries”, 11–15 June 2014; pp. 357–363. Available online: https://www.bib.irb.hr/705512?rad=705512 (accessed on 10 February 2021).
- Biondić, R.; Meaški, H.; Biondić, B.; Loborec, J. Karst Aquifers Vulnerability Assessment (KAVA) Method Applied to the Bakar Bay Catchment Area in Croatia; Final Report. Technical Report; Faculty of Geotechnical Engineering, University of Zagreb: Varaždin, Croatia, 2015. [Google Scholar]


Publisher’s Note: MDPI stays neutral with regard to jurisdictional claims in published maps and institutional affiliations. |
© 2021 by the authors. Licensee MDPI, Basel, Switzerland. This article is an open access article distributed under the terms and conditions of the Creative Commons Attribution (CC BY) license (http://creativecommons.org/licenses/by/4.0/).