Author Contributions
Conceptualization, T.D.d.T., K.W., T.M.; methodology, T.M., T.v.B., B.W., S.M.F., B.H., M.B.; software, T.v.B., B.W., S.M.F., B.H., M.B., T.M.; validation, T.M., T.v.B., B.W., S.M.F., B.H., M.B.; S.F., K.W., T.D.d.T.; formal analysis, T.M., T.v.B., B.W., S.M.F., B.H., M.B.; investigation, T.v.B., B.W., S.M.F., B.H., M.B., T.M.; resources, T.v.B., B.W., S.M.F., B.H., M.B., T.M.; data curation, T.v.B., B.W., S.M.F., B.H., M.B., T.M.; writing—original draft preparation, T.M.; writing—review and editing, T.M., T.v.B., B.W., S.M.F., B.H., M.B., S.F., K.W., T.D.d.T.; visualization, T.M.; supervision, S.F., K.W., T.D.d.T.; project administration, K.W., T.D.d.T.; funding acquisition, K.W., T.D.d.T. All authors have read and agreed to the published version of the manuscript.
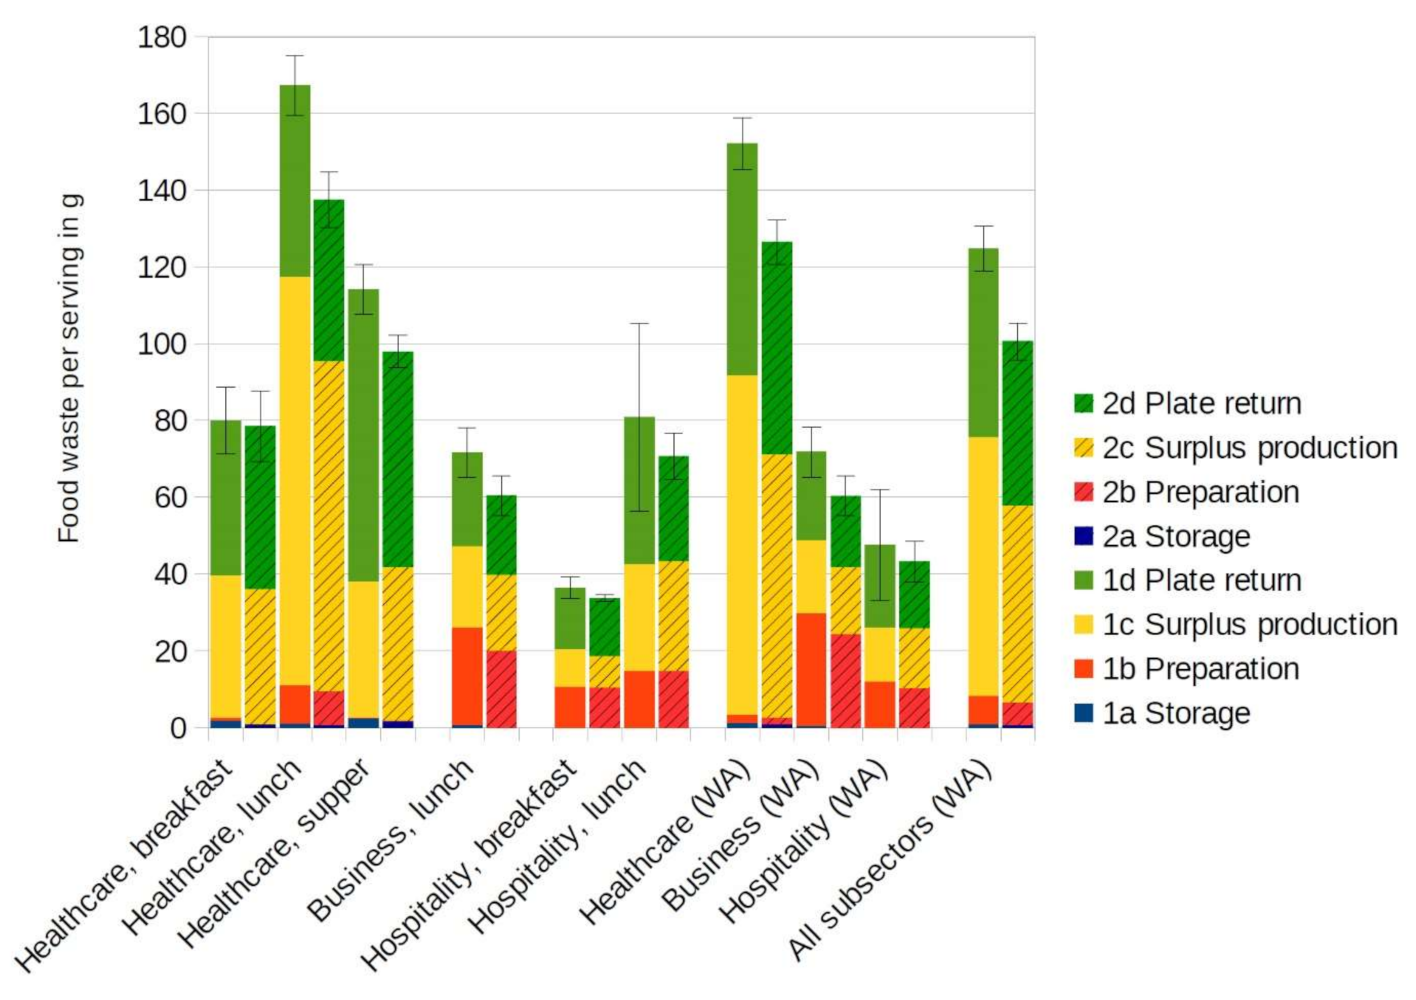
Figure 1.
Food-waste quantities per serving recorded by the catering companies during the first (1) and second (2) monitoring periods. The whiskers reflect the 95% confidence interval (95% CI). WA = weighted average.
Figure 1.
Food-waste quantities per serving recorded by the catering companies during the first (1) and second (2) monitoring periods. The whiskers reflect the 95% confidence interval (95% CI). WA = weighted average.
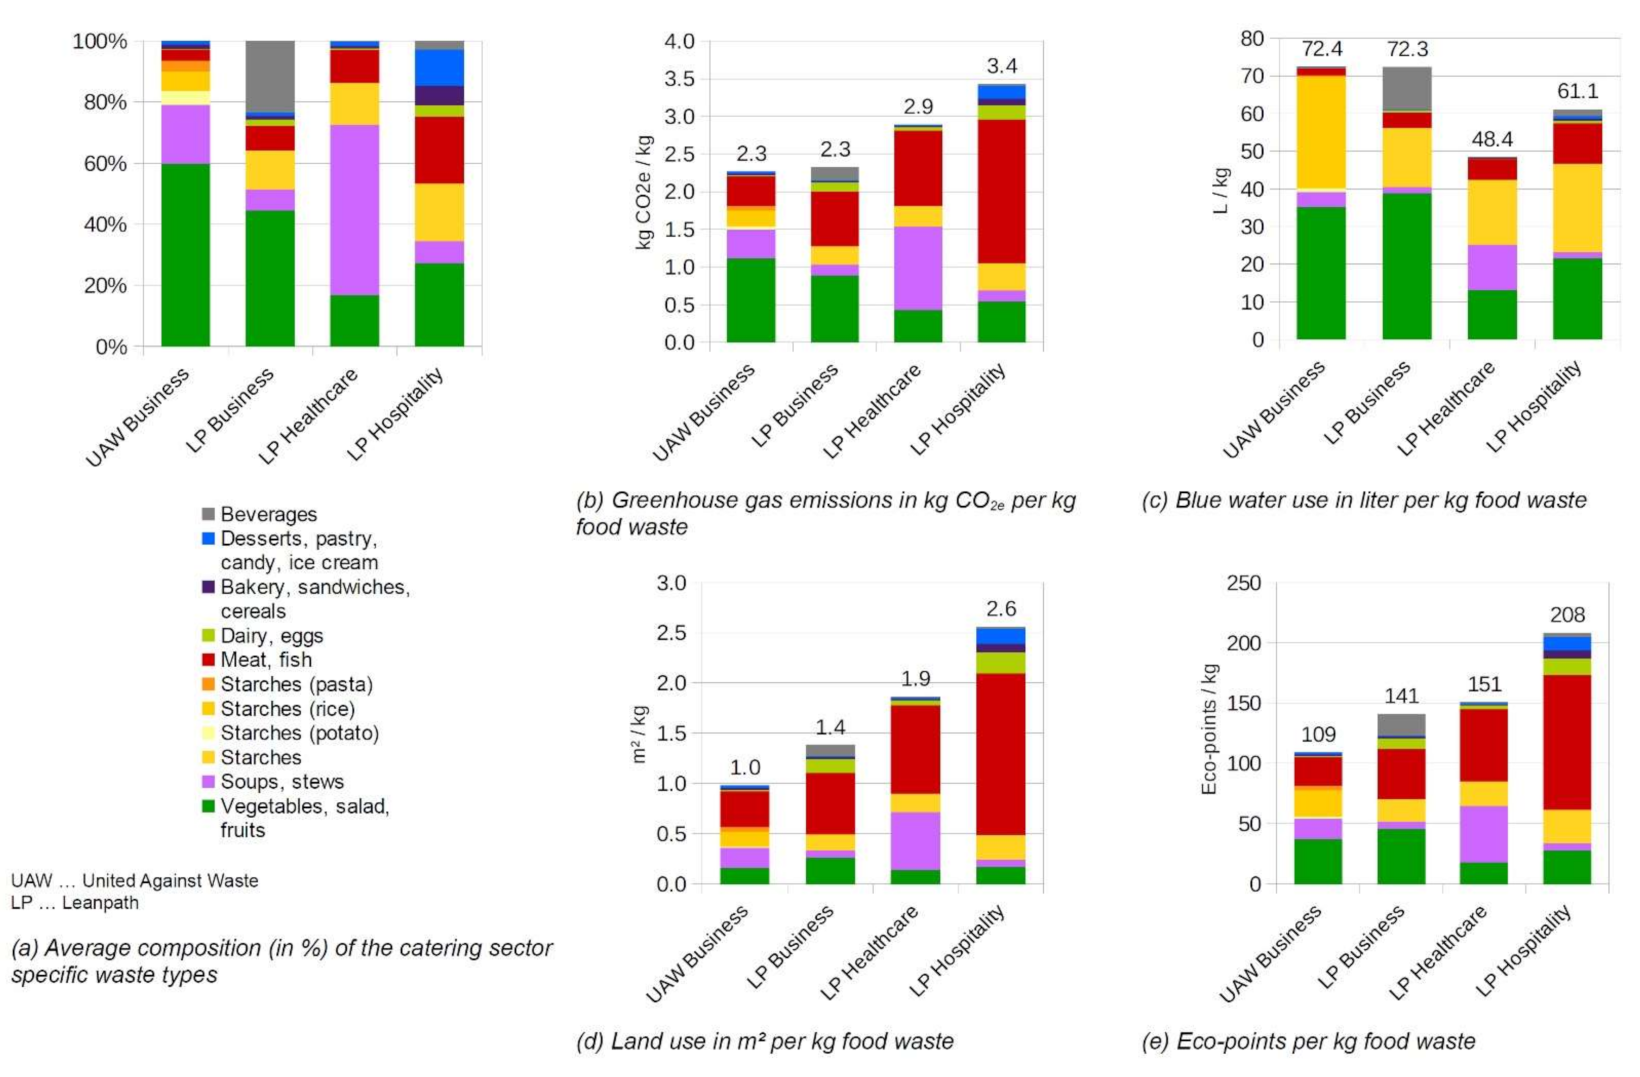
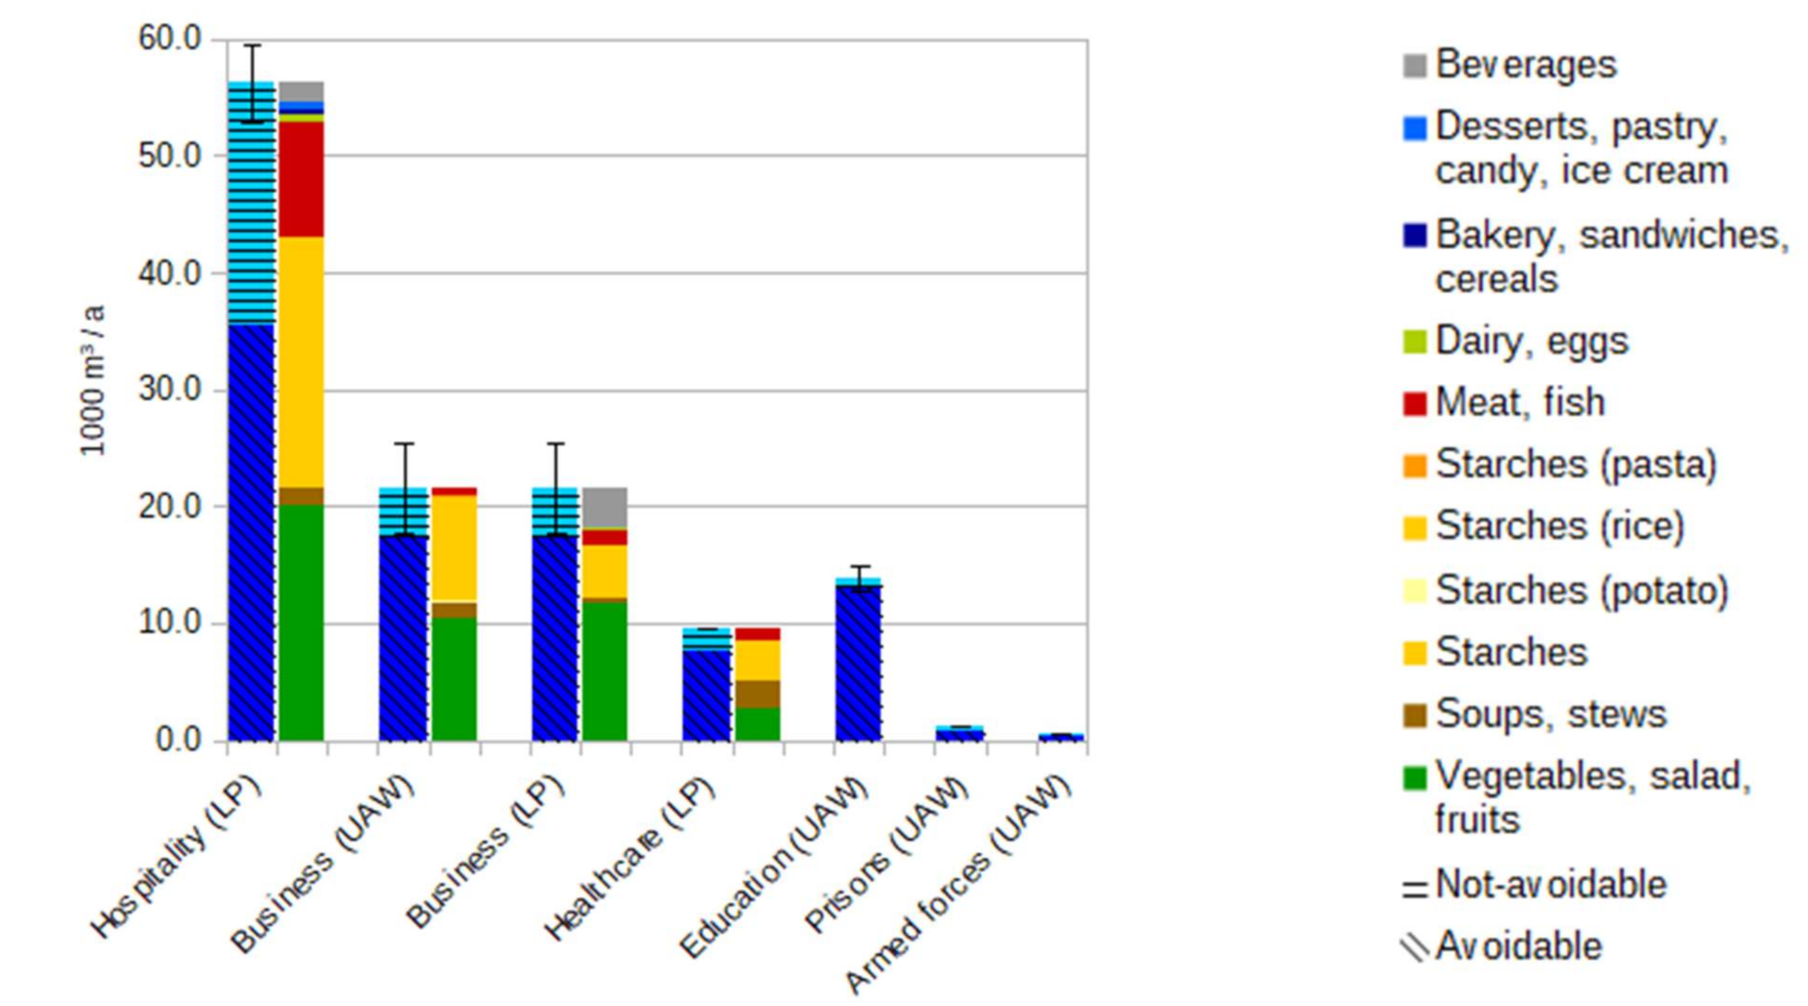
Figure 2.
Average composition (a) and environmental burdens of catering-sector-specific food waste—greenhouse gas emissions (b), blue water use (c), land use (d), and eco-points (overall environmental indicator) (e).
Figure 2.
Average composition (a) and environmental burdens of catering-sector-specific food waste—greenhouse gas emissions (b), blue water use (c), land use (d), and eco-points (overall environmental indicator) (e).
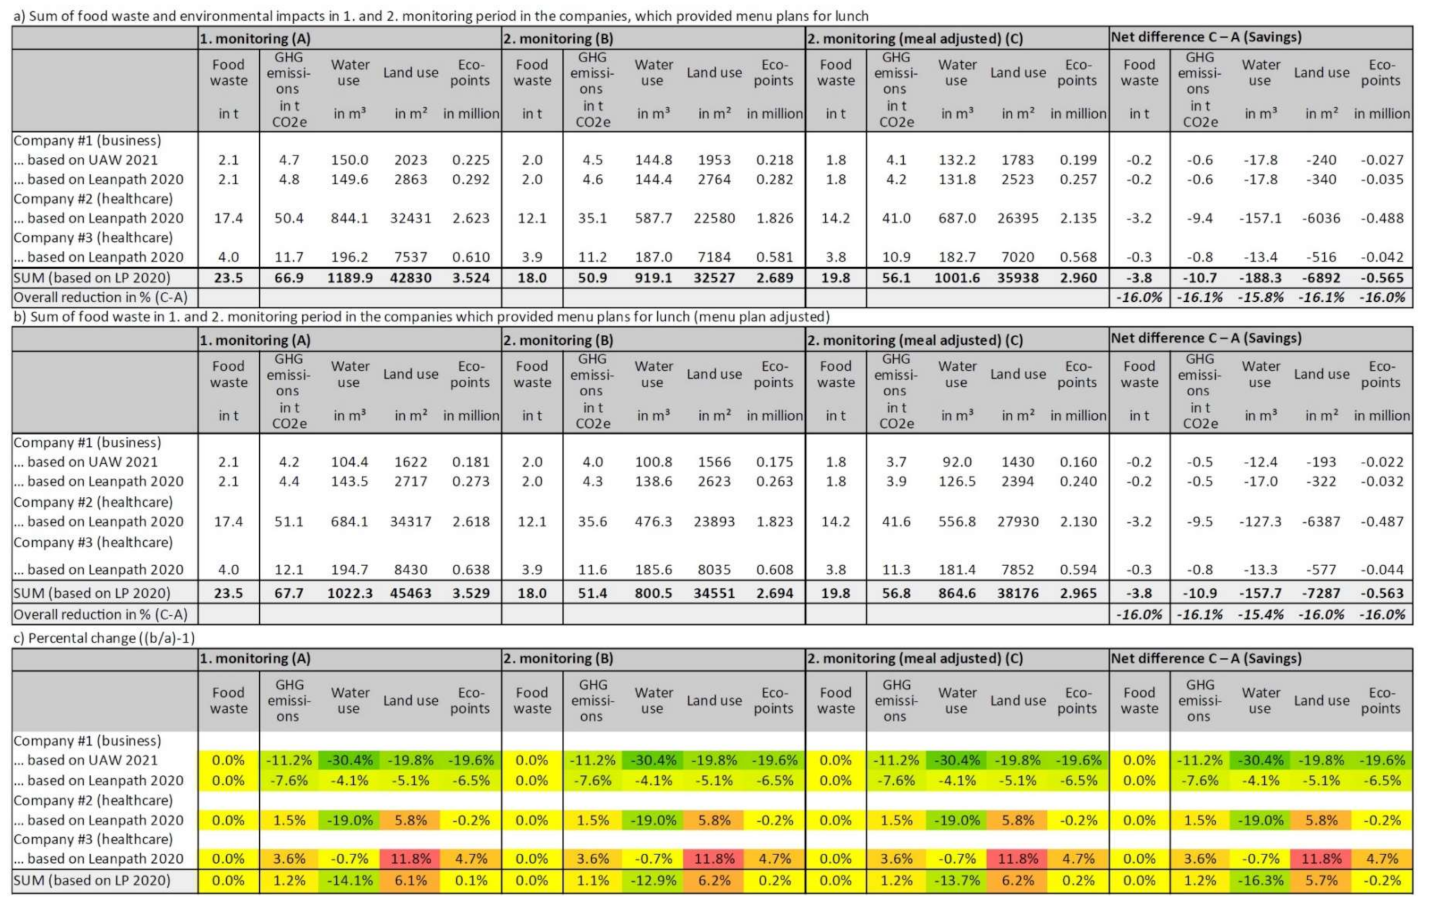
Figure 3.
Sum of food waste and non-menu-plan-adjusted (a) vs. menu-plan-adjusted (b) environmental impacts, while (c) reflects the % changes between both scenario
Figure 3.
Sum of food waste and non-menu-plan-adjusted (a) vs. menu-plan-adjusted (b) environmental impacts, while (c) reflects the % changes between both scenario
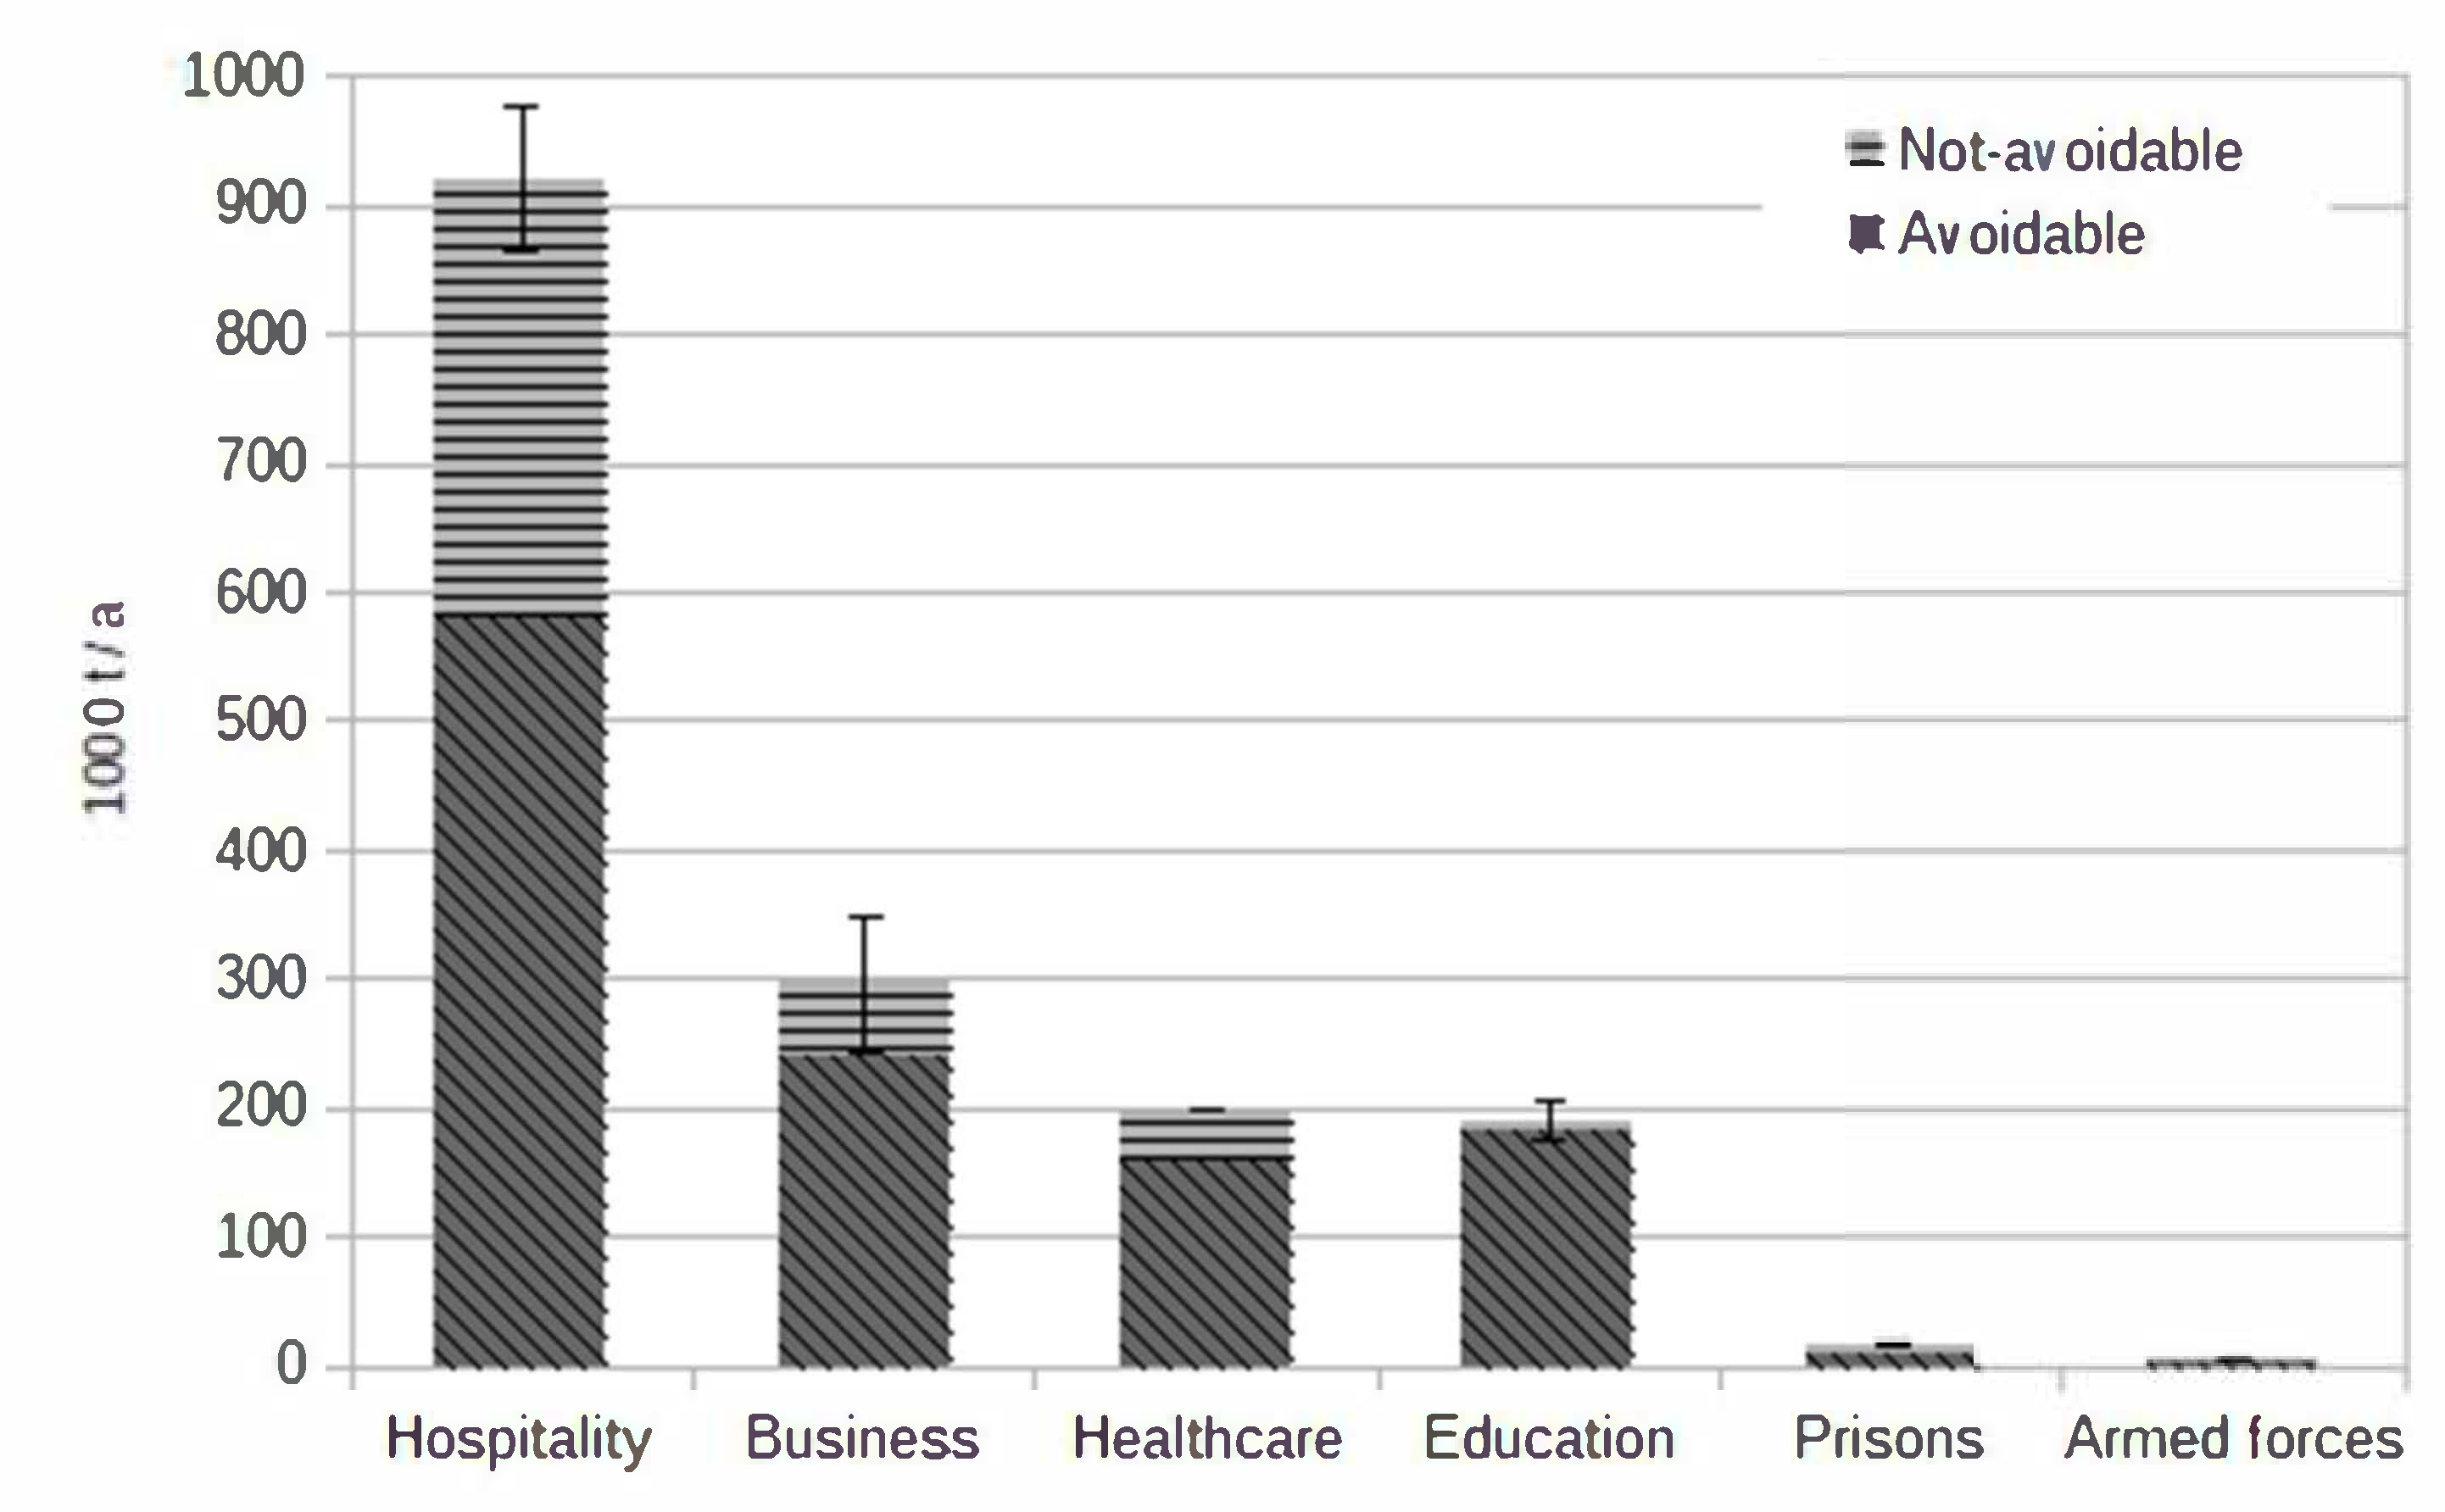
Figure 4.
Food-waste quantities in the food-service sector in Germany in 2015 (based on [
23,
24]). The uncertainty interval is based on waste coefficients from literature (see [
24] for further details).
Figure 4.
Food-waste quantities in the food-service sector in Germany in 2015 (based on [
23,
24]). The uncertainty interval is based on waste coefficients from literature (see [
24] for further details).
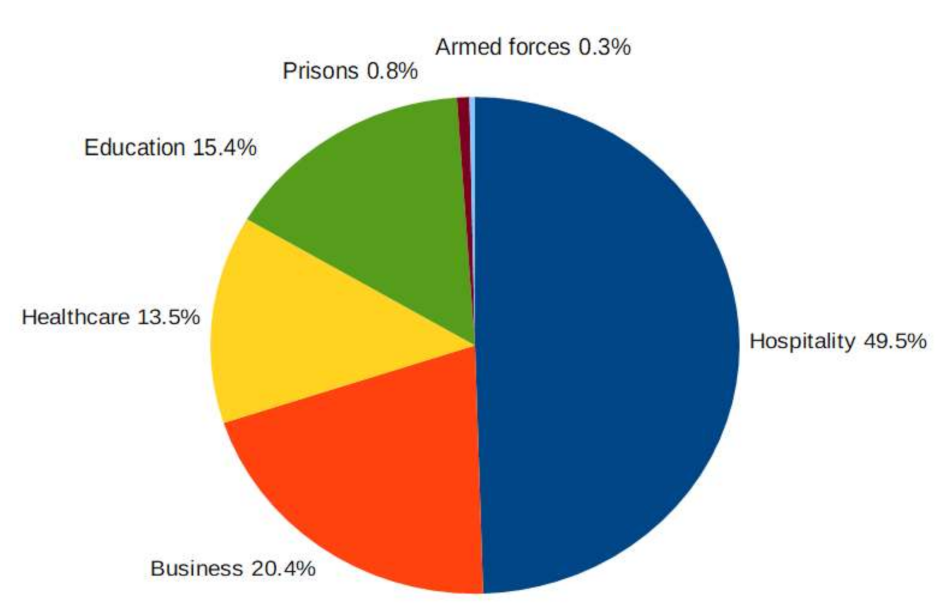
Figure 5.
Shares of the food waste in subsectors in % of the food-service sector in Germany in 2015 (based on [
23,
24]).
Figure 5.
Shares of the food waste in subsectors in % of the food-service sector in Germany in 2015 (based on [
23,
24]).
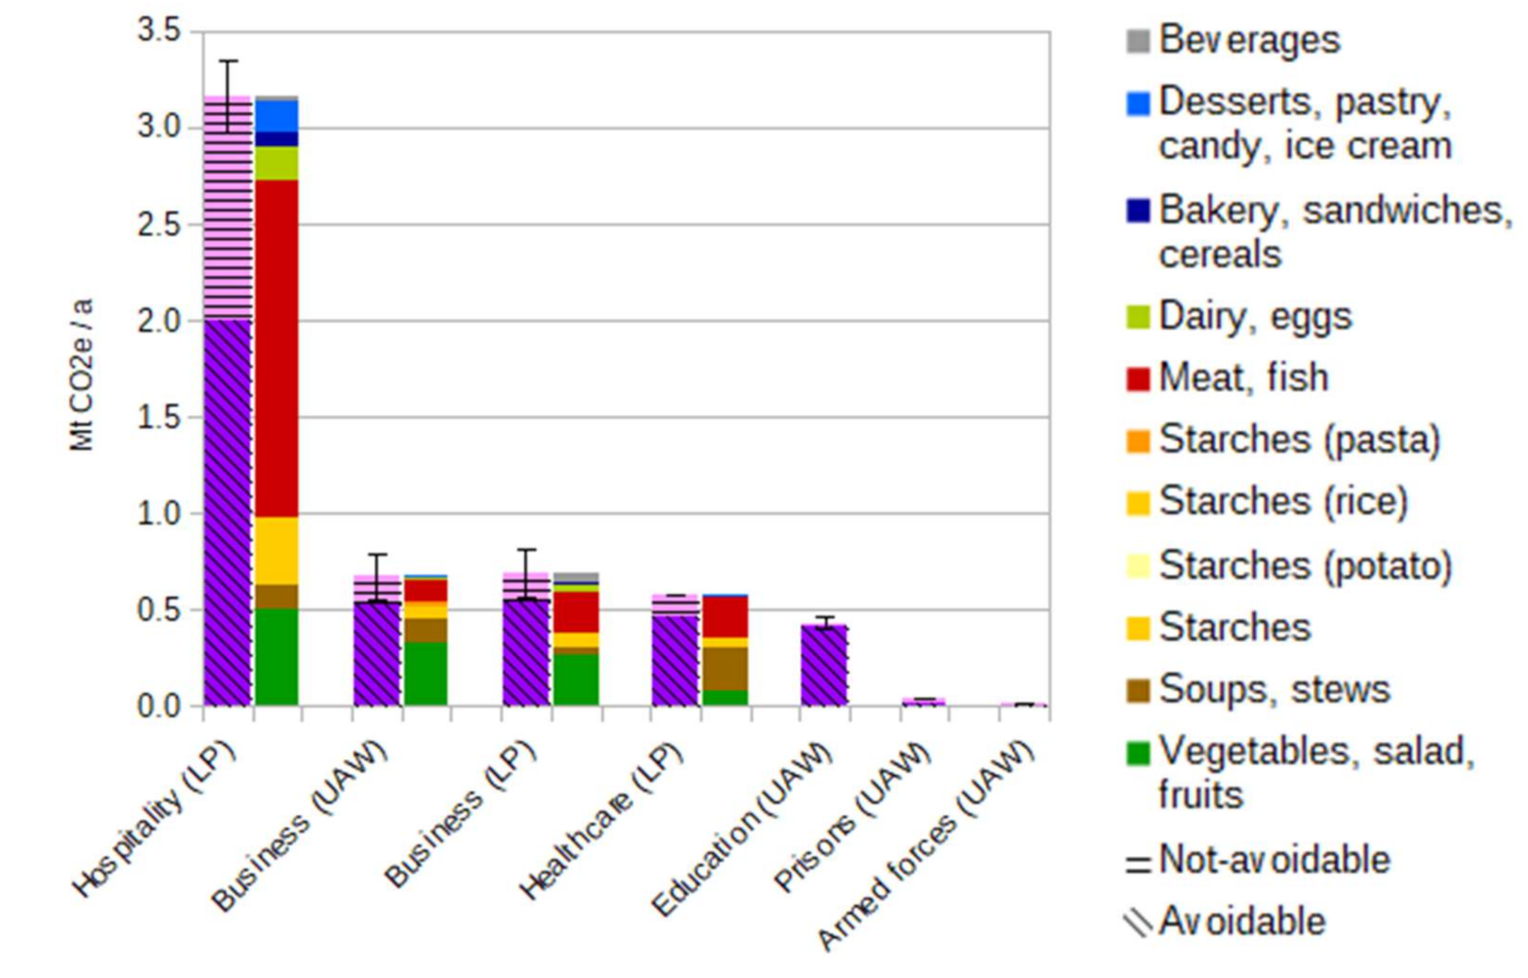
Figure 6.
Greenhouse gas emissions in million t CO2e in 2015 stemming from food waste in the food-service sector in Germany. The subsectors of education, prisons and armed forces were calculated based on UAW 2021 for the business subsector.
Figure 6.
Greenhouse gas emissions in million t CO2e in 2015 stemming from food waste in the food-service sector in Germany. The subsectors of education, prisons and armed forces were calculated based on UAW 2021 for the business subsector.
Figure 7.
Water (blue) use in 1000 m3 in 2015 stemming from food waste in the food-service sector in Germany. The subsectors of education, prisons and armed forces were calculated based on UAW 2021 for the business subsector.
Figure 7.
Water (blue) use in 1000 m3 in 2015 stemming from food waste in the food-service sector in Germany. The subsectors of education, prisons and armed forces were calculated based on UAW 2021 for the business subsector.
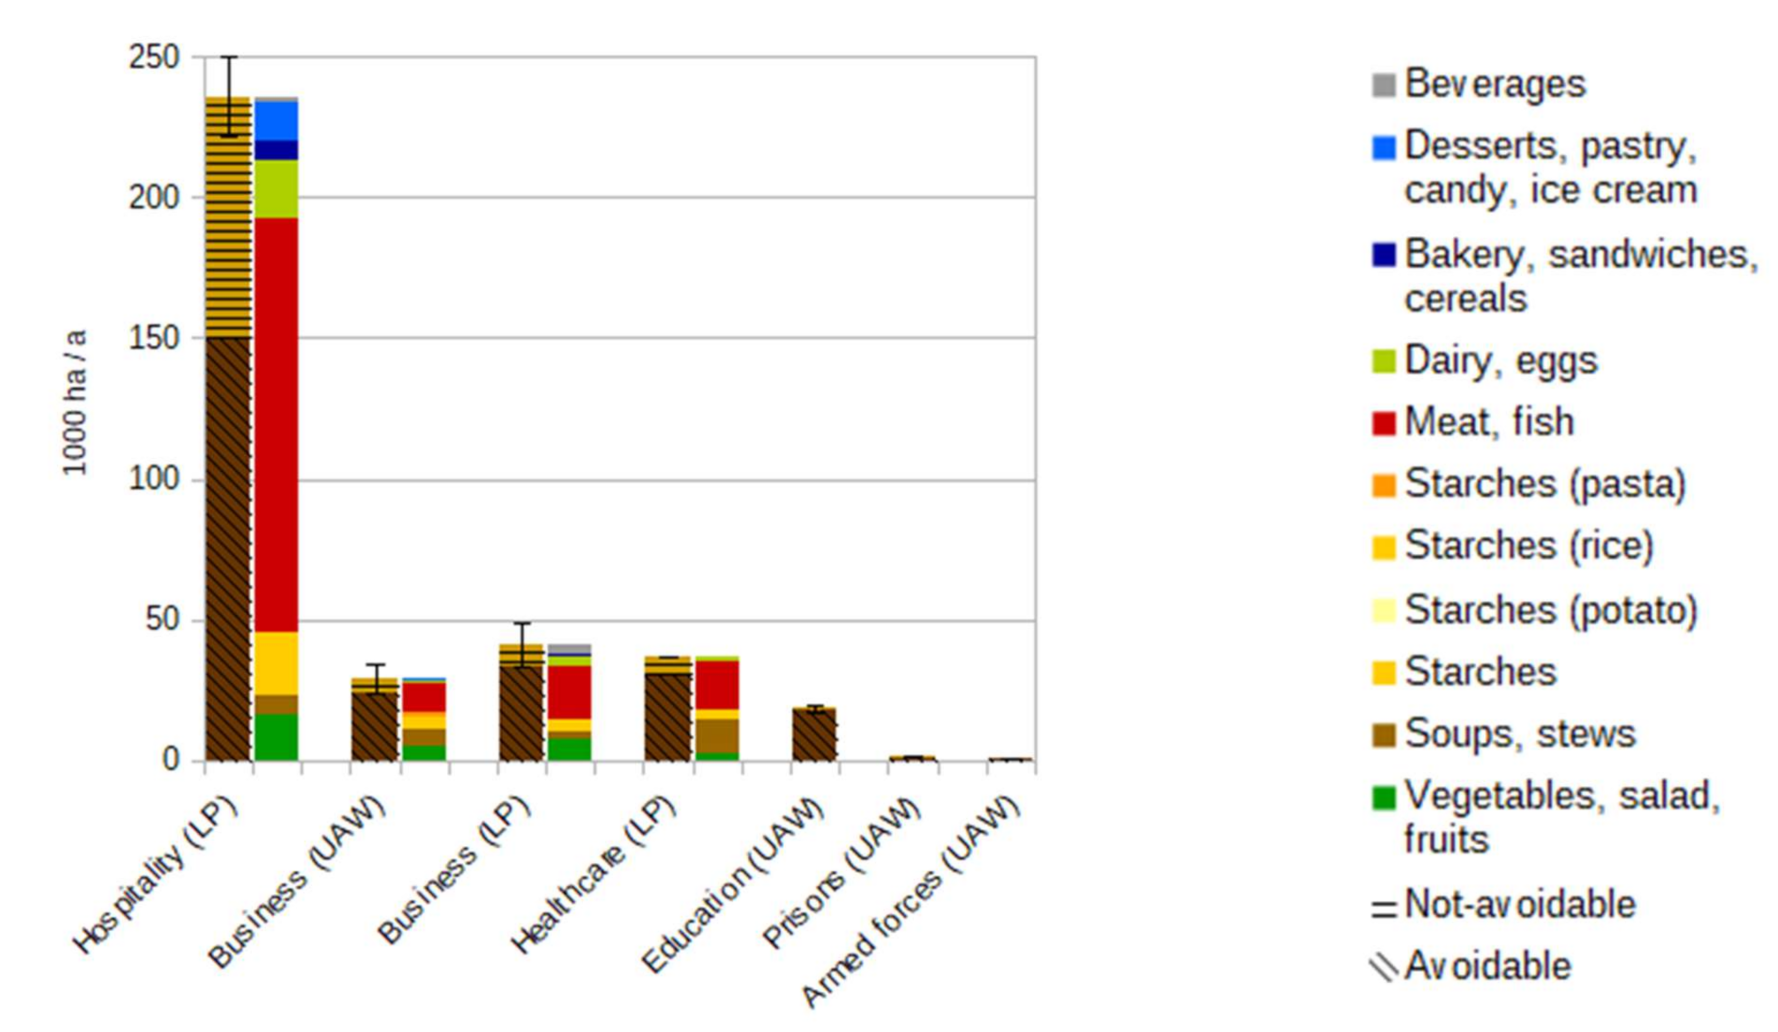
Figure 8.
Land use in 1000 ha in 2015 stemming from food waste in the food-service sector in Germany. The subsectors of education, prisons and armed forces were calculated based on UAW 2021 for the business subsector.
Figure 8.
Land use in 1000 ha in 2015 stemming from food waste in the food-service sector in Germany. The subsectors of education, prisons and armed forces were calculated based on UAW 2021 for the business subsector.
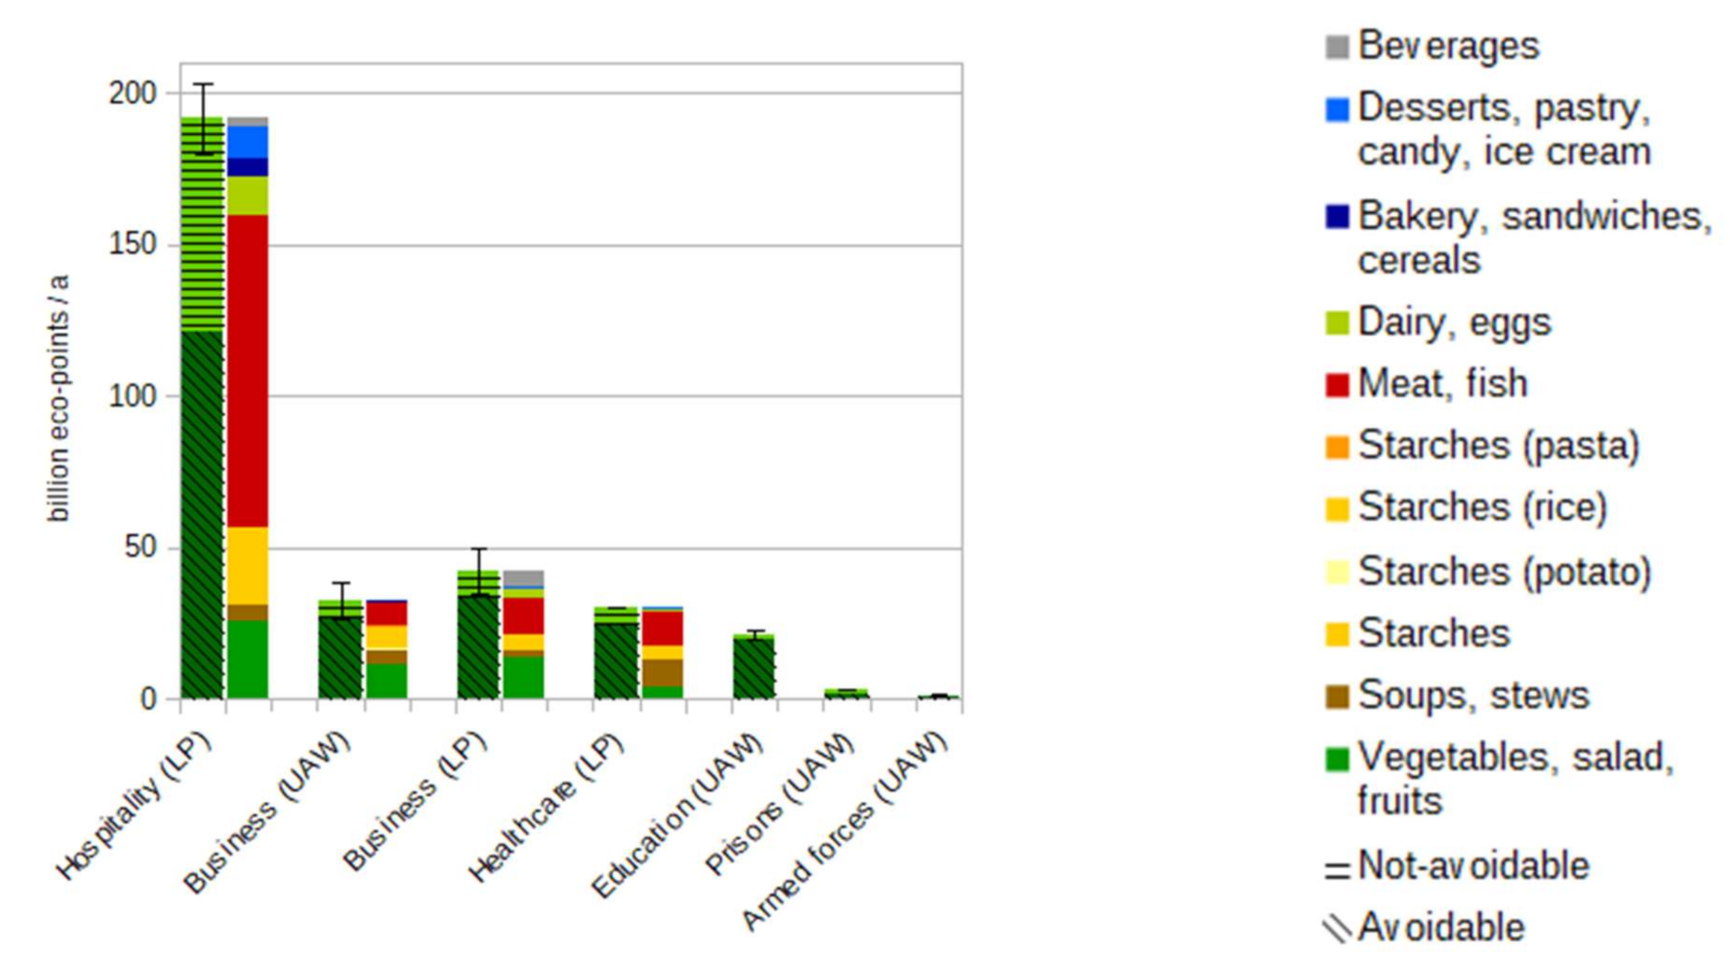
Figure 9.
Environmental impacts in billion eco-points in 2015 stemming from food waste in the food-service sector in Germany. The subsectors of education, prisons and armed forces were calculated based on UAW 2021 for the business subsector.
Figure 9.
Environmental impacts in billion eco-points in 2015 stemming from food waste in the food-service sector in Germany. The subsectors of education, prisons and armed forces were calculated based on UAW 2021 for the business subsector.
Table 1.
Environmental indicators considered for the calculation of the environmental impact points (eco-points) and the subindicators of carbon footprint, water footprint and land footprint.
Table 1.
Environmental indicators considered for the calculation of the environmental impact points (eco-points) and the subindicators of carbon footprint, water footprint and land footprint.
| | Environmental Indicator | Effect | Footprint |
|---|
| 1 | CO2 (Carbon dioxide) emissions | Greenhouse effect | Carbon footprint according to [14–17] |
| 2 | CH4 (Methane) emissions | Greenhouse effect |
| 3 | N2O (Nitrous oxide) emissions | Greenhouse effect |
| 4 | NH3 (Ammonia) emissions | Acidification, air pollution, greenhouse effect, eutrophication (as NH4+) | |
| 5 | NO (Nitrogen monoxide) emissions | Air pollution, acidification | |
| 6 | NMVOC (Non-methane volatile organic compounds) emissions | Air pollution, Ozone formation | |
| 7 | SO2 (Sulfur dioxide) emissions | Acidification | |
| 8 | H2S (Hydrogen sulfide) emissions | Acidification | |
| 9 | HCl (Hydrochloric acid) emissions | Acidification | |
| 10 | N-surplus from mineral and agricultural fertilisers | Eutrophication, Human toxicity | |
| 11 | P-surplus from mineral and agricultural fertilisers | Eutrophication | |
| 12 | Blue water demand | Water scarcity, Water stress | Water footprint according to ISO 14046 (2014) [18] |
| 13 | Pesticides (a.i.) | Human and ecotoxicity | |
| 14 | Primary energy consumption | Resource consumption/scarcity | |
| 15 | Area required (conventional, organic agriculture)- -
Arable land - -
Grassland - -
Permanent crop - -
Forest area - -
Industrial land
| Resource consumption/scarcity, Biodiversity loss (loss of species) | Land footprint according to [19,20] |
Table 2.
Amounts of food waste per serving in g in the partner companies during the first and second monitoring periods and achieved reduction in % (incl. 95% CI).
Table 2.
Amounts of food waste per serving in g in the partner companies during the first and second monitoring periods and achieved reduction in % (incl. 95% CI).
| | 1. Monitoring Period | 2. Monitoring Period | |
|---|
| Measurement Days (n) | Meals Served | Food Waste Per Serving in g (Weighted Average) (95% CI) | Measurement Days (n) | Meals Served | Food Waste Per Serving in g (Weighted Average) (95% CI) | Reduction in % |
|---|
| Healthcare | 635 | 165,898 | 152.1 | 645 | 150,708 | 126.5 | −16.9% * |
| | | | 145.4 | 158.9 | | | 120.7 | 132.3 | |
| Breakfast | 108 | 17,649 | 79.9 | 104 | 17,261 | 78.5 | −1.8% |
| | | | 71.2 | 88.6 | | | 69.4 | 87.7 | |
| Lunch | 445 | 129,522 | 167.5 | 457 | 117,180 | 137.5 | −17.9%* |
| | | | 159.6 | 175.3 | | | 130.3 | 144.7 | |
| Supper | 82 | 18,727 | 114.2 | 84 | 16,267 | 98.0 | −14.1%* |
| | | | 107.6 | 120.7 | | | 93.8 | 102.3 | |
| Business | 66 | 72,375 | 71.8 | 67 | 76,447 | 60.4 | −15.9% |
| | | | 65.3 | 78.3 | | | 55.1 | 65.6 | |
| Lunch | 66 | 72,375 | 71.8 | 67 | 76,447 | 60.4 | −15.9% |
| | | | 65.3 | 78.3 | | | 55.1 | 65.6 | |
| Hospitality | 58 | 9266 | 47.5 | 74 | 14,491 | 43.2 | −9.1% |
| | | | 33 | 62.1 | | | 37.9 | 48.6 | |
| Breakfast | 29 | 6948 | 36.4 | 42 | 12,865 | 33.6 | −7.6% |
| | | | 33.6 | 39.3 | | | 32.8 | 34.5 | |
| Lunch | 29 | 2318 | 80.9 | 32 | 3743 | 70.7 | −12.5% |
| | | | 55.7 | 106.1 | | | 57.9 | 83.5 | |
| Sum | 759 | 247,539 | | | 786 | 241,646 | | | |
| Weighted average | | | 124.7 | | | 100.6 | −19.4% * |
| | | | 118.9 | 130.6 | | | 95.7 | 105.5 | |
Table 3.
Setting-specific environmental impacts in different gastronomy sectors per kg food waste
Table 3.
Setting-specific environmental impacts in different gastronomy sectors per kg food waste
| | GHG Emissions | Water (Blue) Use | Land Use | Eco-Points |
|---|
| in kg CO2e Per kg | in L Per kg | in m2 Per kg | Per kg |
|---|
| Business (UAW 2017) [22] | 2.1 | 109.7 | 1.2 | 93.4 |
| Business (UAW 2021) | 2.3 | 72.4 | 1.0 | 108.9 |
| Business (Leanpath 2020) [12] | 2.3 | 72.3 | 1.4 | 140.9 |
| Healthcare (Leanpath 2020) [12] | 2.9 | 48.4 | 1.9 | 150.5 |
| Hospitality (Leanpath 2020) [12] | 3.4 | 61.1 | 2.6 | 208.0 |
Table 4.
Sum of food waste and environmental impacts in the first and second monitoring periods (meal-number adjusted).
Table 4.
Sum of food waste and environmental impacts in the first and second monitoring periods (meal-number adjusted).
| | 1. Monitoring (A) | 2. Monitoring (B) | 2. Monitoring (Meal Adjusted) (C) | Net Difference C–A (Savings) |
|---|
| | Food Waste | GHG Emissions | Water Use | Land Use | Eco-Points | Food Waste | GHG Emissions | Water Use | Land Use | Eco-Points | Food Waste | GHG Emissions | Water Use | Land Use | Eco-Points | Food Waste | GHG Emissions | Water Use | Land Use | Eco-Points |
|---|
| | in t | in t CO2e | in m3 | in m2 | in million | in t | in t CO2e | in m3 | in m2 | in million | in t | in t CO2e | in m3 | in m2 | in million | in t | in t CO2e | in m3 | in m2 | in million |
|---|
| UAW 2017 | | | | | | | | | | | | | | | | | | | | |
| … Business | 5.2 | 11.2 | 570.1 | 6194 | 0.485 | 4.6 | 9.9 | 506.3 | 5501 | 0.431 | 4.4 | 9.4 | 479.3 | 5208 | 0.408 | −0.8 | −1.8 | −90.8 | −987 | −0.077 |
| UAW 2021 | | | | | | | | | | | | | | | | | | | | |
| … Business | 5.2 | 11.8 | 376.5 | 5077 | 0.566 | 4.6 | 10.5 | 334.3 | 4509 | 0.503 | 4.4 | 9.9 | 316.5 | 4269 | 0.476 | −0.8 | −1.9 | −60.0 | −809 | −0.090 |
| Leanpath 2020 | | | | | | | | | | | | | | | | | | | | |
| … Business | 5.2 | 12.1 | 375.5 | 7186 | 0.732 | 4.6 | 10.7 | 333.4 | 6381 | 0.65 | 4.4 | 10.1 | 315.7 | 6041 | 0.616 | −0.8 | −1.9 | −59.8 | −1145 | −0.117 |
| … Healthcare | 25.2 | 73 | 1222.9 | 46983 | 3.8 | 19.1 | 55.1 | 923.6 | 35486 | 2.87 | 21 | 60.7 | 1016.7 | 39063 | 3.159 | −4.2 | −12.3 | −206.2 | −7920 | −0.641 |
| … Hospitality | 0.4 | 1.5 | 26.9 | 1127 | 0.092 | 0.6 | 2.1 | 38.3 | 1603 | 0.13 | 0.4 | 1.4 | 24.5 | 1025 | 0.083 | −0.04 | −0.1 | −2.4 | −102 | −0.008 |
| SUM (based on LP 2020) | 30.9 | 86.6 | 1625.3 | 55296 | 4.624 | 24.3 | 68 | 1295.3 | 43470 | 3.65 | 25.8 | 72.2 | 1356.9 | 46129 | 3.858 | −5.1 | −14.4 | −268.4 | −9167 | −0.766 |
| Overall reduction in % (C-A) | | | | | | | | | | | | | | | | −16.4% | −16.6% | −16.5% | −16.6% | −16.6% |
Table 5.
Environmental impacts of the 21 dish-specific waste types (conventional agriculture).
Table 5.
Environmental impacts of the 21 dish-specific waste types (conventional agriculture).
| | | PPo | PPa | PR | BPo | BPa | BR | CPo | CPa | CR | FPo | FPa | FR | vPo | vPa | vR | vsPo | vsPa | vsR | v+Po | v+Pa | v+R |
| GHG emissions kg CO2e/kg | UAW business 2021 | 2.0 | 2.1 | 2.3 | 3.1 | 3.3 | 3.5 | 1.8 | 1.9 | 2.2 | 1.7 | 1.8 | 2.1 | 1.8 | 1.9 | 2.1 | 2.0 | 2.1 | 2.3 | 1.5 | 1.7 | 2.0 |
| LP business 2020 | 2.1 | 2.3 | 2.4 | 3.8 | 3.9 | 4.1 | 1.8 | 2.0 | 2.1 | 1.7 | 1.8 | 2.0 | 2.0 | 2.1 | 2.3 | 1.7 | 1.8 | 2.0 | 1.6 | 1.7 | 1.9 |
| LP healthcare 2020 | 2.6 | 2.7 | 2.9 | 5.8 | 5.9 | 6.1 | 2.1 | 2.2 | 2.4 | 1.8 | 1.9 | 2.1 | 2.1 | 2.2 | 2.4 | 2.3 | 2.4 | 2.6 | 1.5 | 1.7 | 1.9 |
| LP hospitality 2020 | 3.2 | 3.3 | 3.6 | 7.5 | 7.7 | 8.0 | 2.4 | 2.6 | 2.9 | 2.1 | 2.2 | 2.5 | 2.9 | 3.0 | 3.3 | 1.9 | 2.1 | 2.3 | 1.7 | 1.8 | 2.1 |
| Water (blue) use in l/kg | UAW business 2021 | 43.9 | 43.0 | 108.2 | 48.3 | 47.4 | 112.6 | 42.9 | 42.0 | 107.2 | 43.8 | 42.9 | 108.1 | 42.5 | 41.5 | 106.7 | 41.3 | 40.3 | 105.5 | 42.2 | 44.1 | 109.3 |
| LP business 2020 | 58.3 | 57.5 | 113.8 | 65.0 | 64.2 | 120.5 | 57.3 | 56.5 | 112.8 | 58.4 | 57.6 | 113.9 | 57.0 | 56.2 | 112.5 | 55.2 | 54.4 | 110.7 | 120.1 | 119.3 | 175.6 |
| LP healthcare 2020 | 32.9 | 32.1 | 93.4 | 45.3 | 44.4 | 105.7 | 30.1 | 29.2 | 90.5 | 32.5 | 31.7 | 93.0 | 29.1 | 28.3 | 89.6 | 24.0 | 23.2 | 84.5 | 58.0 | 57.2 | 118.5 |
| LP hospitality 2020 | 39.8 | 38.6 | 121.9 | 57.4 | 56.3 | 139.6 | 36.8 | 35.6 | 118.9 | 40.2 | 39.0 | 122.3 | 37.1 | 35.9 | 119.2 | 32.7 | 31.6 | 107.8 | 143.9 | 142.8 | 226.1 |
| Land use m2/kg | UAW business 2021 | 0.7 | 0.9 | 1.0 | 1.9 | 2.0 | 2.2 | 0.6 | 0.7 | 0.9 | 0.3 | 0.5 | 0.6 | 0.6 | 0.8 | 0.9 | 0.9 | 1.0 | 1.2 | 0.3 | 0.4 | 0.6 |
| LP business 2020 | 1.3 | 1.4 | 1.5 | 2.9 | 3.0 | 3.1 | 1.0 | 1.1 | 1.3 | 0.6 | 0.8 | 0.9 | 1.2 | 1.3 | 1.5 | 0.9 | 1.0 | 1.1 | 0.8 | 1.0 | 1.1 |
| LP healthcare 2020 | 1.6 | 1.8 | 1.9 | 4.8 | 4.9 | 5.1 | 1.2 | 1.3 | 1.5 | 0.4 | 0.6 | 0.7 | 1.3 | 1.5 | 1.6 | 1.5 | 1.7 | 1.8 | 0.6 | 0.7 | 0.8 |
| LP hospitality 2020 | 2.4 | 2.6 | 2.8 | 6.7 | 6.9 | 7.1 | 1.8 | 2.0 | 2.2 | 0.8 | 1.0 | 1.2 | 2.5 | 2.7 | 2.9 | 1.3 | 1.5 | 1.6 | 1.3 | 1.4 | 1.6 |
| Eco-points per kg | UAW business 2021 | 85.6 | 94.7 | 128.7 | 140.3 | 149.3 | 183.3 | 76.1 | 85.1 | 119.1 | 58.8 | 67.8 | 101.8 | 74.7 | 83.7 | 117.7 | 87.1 | 96.1 | 130.1 | 50.2 | 65.4 | 99.4 |
| LP business 2020 | 132.4 | 140.2 | 169.6 | 209.5 | 217.3 | 246.7 | 114.6 | 122.4 | 151.8 | 90.5 | 98.3 | 127.7 | 120.1 | 127.9 | 157.3 | 98.9 | 106.7 | 136.1 | 109.2 | 117.0 | 146.4 |
| LP healthcare 2020 | 136.5 | 145.0 | 177.0 | 290.5 | 299.0 | 330.9 | 109.9 | 118.4 | 150.4 | 61.1 | 69.6 | 101.6 | 109.6 | 118.1 | 150.1 | 112.4 | 120.9 | 152.9 | 66.6 | 75.1 | 107.0 |
| LP hospitality 2020 | 204.2 | 215.7 | 259.2 | 403.7 | 415.3 | 458.7 | 159.4 | 171.0 | 214.5 | 93.5 | 105.1 | 148.5 | 179.3 | 190.8 | 234.3 | 108.8 | 120.3 | 160.1 | 125.3 | 136.8 | 180.3 |
| Legend |
| | - BPa
Waste composition based on a dish with beef and pasta - BPo
Waste composition based on a dish with beef and potatoes - BR
Waste composition based on a dish with beef and rice - CPa
Waste composition based on a dish with chicken and pasta - CPo
Waste composition based on a dish with chicken and potatoes - CR
Waste composition based on a dish with chicken and rice - FPa
Waste composition based on a dish with fish and pasta - FPo
Waste composition based on a dish with fish and potatoes - FR
Waste composition based on a dish with fish and rice - PPa
Waste composition based on a dish with pork and pasta - PPo
Waste composition based on a dish with pork and potatoes - PR
Waste composition based on a dish with pork and rice - v+Pa
Waste composition based on a vegan dish with pasta - v+Po
Waste composition based on a vegan dish with potatoes - v+R
Waste composition based on a vegan dish with rice - vPa
Waste composition based on an ovo-lacto-vegetarian dish with pasta - vPo
Waste composition based on an ovo-lacto-vegetarian dish with potatoes - vR
Waste composition based on an ovo-lacto-vegetarian dish with rice - vsPa
Waste composition based on a sweet ovo-lacto-vegetarian dish with pasta - vsPo
Waste composition based on a sweet ovo-lacto-vegetarian dish with potatoes - vsR
Waste composition based on a sweet ovo-lacto-vegetarian dish with rice
| |
Table 6.
Menu-plan-specific environmental impacts of partner companies per kg food waste (4 weeks).
Table 6.
Menu-plan-specific environmental impacts of partner companies per kg food waste (4 weeks).
| | GHG Emissions | Water Use | Land Use | Eco-Points |
|---|
| in kg CO2e Per kg | in L Per kg | in m2 Per kg | Per kg |
|---|
| Company #1 (business) | | | | |
| Based on UAW 2021 | 2.0 | 50.4 | 0.8 | 87.5 |
| Based on Leanpath [12] | 2.1 | 69.3 | 1.3 | 131.8 |
| Company #2 (healthcare) | | | | |
| Based on Leanpath [12] | 2.9 | 39.3 | 2.0 | 150.2 |
| Company #3 (healthcare) | | | | |
| Based on Leanpath [12] | 3.0 | 48.1 | 2.1 | 157.6 |
Table 7.
Food-waste quantities in the food-service sector in Germany in 2015 (based on [
23,
24]). The uncertainty interval is based on waste coefficients from literature (see [
24] for further details).
Table 7.
Food-waste quantities in the food-service sector in Germany in 2015 (based on [
23,
24]). The uncertainty interval is based on waste coefficients from literature (see [
24] for further details).
| | Food Waste (t/a) | Avoidable Food Waste (t/a) |
|---|
| Mean | Lower | Upper | Mean | Lower | Upper |
|---|
| Business | 297,255 | 244,133 | 350,376 | 240,742 | 176,318 | 305,166 |
| Healthcare | 198,995 | 198,995 | 198,995 | 159,365 | 159,365 | 159,365 |
| Hospitality | 920,916 | 865,390 | 976,442 | 582,974 | 550,121 | 615,827 |
| Education | 190,873 | 176,926 | 204,820 | 181,736 | 176,926 | 186,544 |
| Armed forces | 7562 | 6522 | 8601 | 3857 | 3326 | 4387 |
| Prisons | 17,505 | 17,505 | 17,505 | 8971 | 8971 | 8971 |
| Sum | 1,633,106 | 1,509,471 | 1,756,739 | 1,177,645 | 1,075,027 | 1,280,260 |
| Avoidable share in % | | | | 72.10% | 71.20% | 72.90% |
Table 8.
Total and avoidable greenhouse gas emissions in t CO2e in 2015 stemming from food waste in the food-service sector in Germany. The subsectors of education, prisons and armed forces were calculated based on UAW 2021 for the business subsector.
Table 8.
Total and avoidable greenhouse gas emissions in t CO2e in 2015 stemming from food waste in the food-service sector in Germany. The subsectors of education, prisons and armed forces were calculated based on UAW 2021 for the business subsector.
| | GHG Emissions of Food Waste (t CO2e/a) | Avoidable GHG Emissions of Food Waste (t CO2e/a) |
|---|
| Mean | Lower | Upper | Mean | Lower | Upper |
|---|
| Business (based on UAW 2021) | 673,321 | 552,993 | 793,647 | 545,312 | 399,383 | 691,240 |
| Business (based on LP 2020) | 690,411 | 567,029 | 813,791 | 559,153 | 409,520 | 708,786 |
| Healthcare (based on LP 2020) | 575,352 | 575,352 | 575,352 | 460,770 | 460,770 | 460,770 |
| Hospitality (based on LP 2020) | 3,158,742 | 2,968,288 | 3,349,196 | 1,999,601 | 1,886,915 | 2,112,287 |
| Sum (based on UAW 2021, LP 2020) | 4,407,416 | 4,096,633 | 4,718,196 | 3,005,683 | 2,747,069 | 3,264,298 |
| Sum (based on LP 2020) | 4,424,506 | 4,110,669 | 4,738,340 | 3,019,525 | 2,757,206 | 3,281,843 |
| Education (based on UAW 2021) | 432,352 | 400,760 | 463,944 | 411,656 | 400,760 | 422,546 |
| Prisons (based on UAW 2021) | 39,651 | 39,651 | 39,651 | 20,320 | 20,320 | 20,320 |
| Armed forces (based on UAW 2021) | 17,129 | 14,773 | 19,482 | 8737 | 7534 | 9937 |
| Total sum (based on UAW 2021, LP 2020) | 4,896,548 | 4,551,818 | 5,241,273 | 3,446,396 | 3,175,683 | 3,717,102 |
Table 9.
Water (blue) use in m3 in the year 2015 stemming from food waste in the food-service sector in Germany. The subsectors of education, prisons and armed forces were calculated based on UAW 2021 for the business subsector.
Table 9.
Water (blue) use in m3 in the year 2015 stemming from food waste in the food-service sector in Germany. The subsectors of education, prisons and armed forces were calculated based on UAW 2021 for the business subsector.
| | Water (Blue) Use of Food Waste (m3/a) | Avoidable Water (Blue) Use of Food Waste (m3/a) |
|---|
| Mean | Lower | Upper | Mean | Lower | Upper |
|---|
| Business (based on UAW 2021) | 21,534 | 17,686 | 25,382 | 17,440 | 12,773 | 22,107 |
| Business (based on LP 2020) | 21,479 | 17,641 | 25,318 | 17,396 | 12,740 | 22,051 |
| Healthcare (based on LP 2020) | 9641 | 9641 | 9641 | 7721 | 7721 | 7721 |
| Hospitality (based on LP 2020) | 56,238 | 52,847 | 59,629 | 35,601 | 33,595 | 37,607 |
| Sum (based on UAW 2021 + LP 2020) | 87,413 | 80,174 | 94,652 | 60,762 | 54,089 | 67,435 |
| Sum (based on LP 2020) | 87,358 | 80,129 | 94,588 | 60,717 | 54,056 | 67,379 |
| Education (based on UAW 2021) | 13,827 | 12,817 | 14,838 | 13,166 | 12,817 | 13,514 |
| Prisons (based on UAW 2021) | 1268 | 1268 | 1268 | 650 | 650 | 650 |
| Armed forces (based on UAW 2021) | 548 | 472 | 623 | 279 | 241 | 318 |
| Total sum (based on UAW 2021, LP 2020) | 103,057 | 94,732 | 111,381 | 74,857 | 67,796 | 81,917 |
Table 10.
Land use in ha in 2015 stemming from food waste in the food-service sector in Germany. The subsectors of education, prisons and armed forces were calculated based on UAW 2021 for the business subsector.
Table 10.
Land use in ha in 2015 stemming from food waste in the food-service sector in Germany. The subsectors of education, prisons and armed forces were calculated based on UAW 2021 for the business subsector.
| | Land Use of Food Waste (ha/a) | Avoidable Land Use of Food Waste (ha/a) |
|---|
| Mean | Lower | Upper | Mean | Lower | Upper |
|---|
| Business (based on UAW 2021) | 29,044 | 23,854 | 34,235 | 23,523 | 17,228 | 29,817 |
| Business (based on LP 2020) | 41,104 | 33,759 | 48,450 | 33,290 | 24,381 | 42,198 |
| Healthcare (based on LP 2020) | 37,040 | 37,040 | 37,040 | 29,664 | 29,664 | 29,664 |
| Hospitality (based on LP 2020) | 235,654 | 221,445 | 249,862 | 149,177 | 140,771 | 157,584 |
| Sum (based on UAW 2021 + LP 2020) | 301,738 | 282,339 | 321,137 | 202,364 | 187,662 | 217,065 |
| Sum (based on LP 2020) | 313,798 | 292,244 | 335,352 | 212,131 | 194,815 | 229,446 |
| Education (based on UAW 2021) | 18,650 | 17,287 | 20,013 | 17,757 | 17,287 | 18,227 |
| Prisons (based on UAW 2021) | 1710 | 1710 | 1710 | 877 | 877 | 877 |
| Armed forces (based on UAW 2021) | 739 | 637 | 840 | 377 | 325 | 429 |
| Total sum (based on UAW 2021, LP 2020) | 322,838 | 301,974 | 343,701 | 221,374 | 206,151 | 236,598 |
Table 11.
Environmental impacts stemming from food waste in the food-service sector in Germany in billion eco-points in 2015. The subsectors of education, prisons and armed forces were calculated based on UAW 2021 for the business subsector.
Table 11.
Environmental impacts stemming from food waste in the food-service sector in Germany in billion eco-points in 2015. The subsectors of education, prisons and armed forces were calculated based on UAW 2021 for the business subsector.
| | Eco-Points of Food Waste (billion/a) | Avoidable Eco-Points of Food Waste (billion/a) |
|---|
| Mean | Lower | Upper | Mean | Lower | Upper |
|---|
| Business (based on UAW 2021) | 32.4 | 26.6 | 38.2 | 26.2 | 19.2 | 33.2 |
| Business (based on LP 2020) | 41.9 | 34.4 | 49.4 | 33.9 | 24.8 | 43 |
| Healthcare (based on LP 2020) | 30 | 30 | 30 | 24 | 24 | 24 |
| Hospitality (based on LP 2020) | 191.5 | 180 | 203.1 | 121.2 | 114.4 | 128.1 |
| Sum (based on UAW 2021 + LP 2020) | 253.8 | 236.5 | 271.2 | 171.4 | 157.6 | 185.3 |
| Sum (based on LP 2020) | 263.4 | 244.3 | 282.4 | 179.1 | 163.2 | 195.1 |
| Education (based on UAW 2021) | 20.8 | 19.3 | 22.3 | 19.8 | 19.3 | 20.3 |
| Prisons (based on UAW 2021) | 2.6 | 2.6 | 2.6 | 1.4 | 1.4 | 1.4 |
| Armed forces (based on UAW 2021) | 1.1 | 0.9 | 1.2 | 0.5 | 0.5 | 0.6 |
| Total sum (based on UAW 2021, LP 2020) | 278.3 | 259.3 | 297.3 | 193.1 | 178.7 | 207.6 |
Table 12.
GHG emissions in kg CO2e per kg of food waste (literature comparison).
Table 12.
GHG emissions in kg CO2e per kg of food waste (literature comparison).
| Sector | GHG Emissions | Range | Study | Comments |
|---|
| In kg CO2e Per kg | Lower | Upper |
|---|
| Food-service: business (based on UAW) | 2.3 | 1.5– | 3.5 | this study | Range based on 21 different meal types (conventional agriculture) |
| Food-service: business (based on LP) | 2.3 | 1.6– | 4.1 | this study | Range based on 21 different meal types (conventional agriculture) |
| Food-service: healthcare (based on LP) | 2.9 | 1.5– | 6.1 | this study | Range based on 21 different meal types (conventional agriculture) |
| Food-service: hospitality (based on LP) | 3.4 | 1.7– | 8.0 | this study | Range based on 21 different meal types (conventional agriculture) |
| Food-service: business (based on UAW) | 2.1 | | | Knöbel et al. 2020 [22] | System boundaries: cradle-to-fork (regional focus: Germany) |
| Food + Food-service | 2.1 | | | FAO 2013 [26] | System boundaries: cradle-to-grave. No distinction is made between retail and wholesale trade, without emissions from LULUC (regional focus: Europe) |
| Food | 1.9 | | | Monier et al. 2010 [27] | System boundaries: cradle-to-grave. Only including the following sectors: manufacturing, households, others (food-service sector was not included) (regional focus: EU) |
| Food + Food-service | 2.1 | | | Scherhaufer et al. 2018 [28] | Bottom-up approach (regional focus: EU) |
| Food + Food-service | 2.9 | | | Scherhaufer et al. 2015 [29] | Top-down approach (regional focus: EU) |
| Food + Food-service | 2.1 | | | Venkat et al. 2011 [30] | System boundaries: cradle-to-grave. No distinction is made between retail and wholesale trade (regional focus: USA) |
Table 13.
Blue water use in L per kg of food waste (literature comparison).
Table 13.
Blue water use in L per kg of food waste (literature comparison).
| Sector | Water Use | Range | Study | Comments |
|---|
| In L Per kg | Lower | Upper |
|---|
| Food-service: business (based on UAW) | 72.4 | 40.3– | 112.6 | this study | Range based on 21 different meal-types (conventional agriculture) |
| Food-service: business (based on LP) | 72.3 | 54.4– | 175.6 | this study | Range based on 21 different meal types (conventional agriculture) |
| Food-service: healthcare (based on LP) | 48.4 | 23.2– | 118.5 | this study | Range based on 21 different meal types (conventional agriculture) |
| Food-service: hospitality (based on LP) | 61.1 | 31.6– | 226.1 | this study | Range based on 21 different meal types (conventional agriculture) |
| Food-service: business (based on UAW) | 109.7 | | | Knöbel et al. 2020 [22] | System boundaries: cradle-to-fork |
| Food + Food-service | 78.2 | | | FAO 2013 [26] | System boundaries: cradle-to-grave. No distinction is made between retail and wholesale trade (regional focus: Europe) |
Table 14.
Land use in m2 per kg of food waste (literature comparison).
Table 14.
Land use in m2 per kg of food waste (literature comparison).
| Sector | Land Use | Range | Study | Comments |
|---|
| In m2 Per kg | Lower | Upper |
|---|
| Food-service: business (based on UAW) | 1.0 | 0.3– | 2.2 | this study | Range based on 21 different meal types (conventional agriculture) |
| Food-service: business (based on LP) | 1.4 | 0.6– | 3.1 | this study | Range based on 21 different meal types (conventional agriculture) |
| Food-service: healthcare (based on LP) | 1.9 | 0.4– | 5.1 | this study | Range based on 21 different meal types (conventional agriculture) |
| Food-service: hospitality (based on LP) | 2.6 | 0.8– | 7.1 | this study | Range based on 21 different meal types (conventional agriculture) |
| Food-service: business (based on UAW) | 1.2 | | | Knöbel et al. 2020 [22] | System boundaries: cradle-to-fork |
| Food + Food-service | 4.5 | | | FAO 2013 [26] | System boundaries: cradle-to-grave. No distinction is made between retail and wholesale trade (regional focus: Europe) |

 ,
, 


