Abstract
Over the last twenty years, the Common Agricultural Policy of the European Union has evolved into a multifunctional policy instrument. As part of this transformation, most farmer receipts are paid independently of production, granting this class of payment production-neutral or ‘fully decoupled’ status. In prospective agricultural market studies, simulation models routinely represent these payments as decoupled, despite academic evidence to the contrary that posits a number of ‘coupling-channels’. To explore the ramifications of differing degrees of coupling on the three pillars of sustainability, a natural-resources focused simulation model is employed. Comparing with a ‘standard’ decoupled baseline to 2030, higher coupling increases global agricultural employment and reduces production intensity on European Union agricultural land and agricultural emissions. Higher coupling also diminishes the Common Agricultural Policy’s capacity as a safety-net for European Union food-security and agricultural employment, whilst there is tentative evidence of increasing emissions ‘leakage’. At the very least, if the non-distorting status of decoupled payments is mis-specified, this has direct implications for the design of greener policy initiatives under the auspices of the Green Deal that promote sustainable fairer trade. As a result, further empirical research on the production distorting effects of the European Union’s decoupled payments is needed.
1. Introduction
At the global level, the United Nations sustainable development goals (SDG) for the period 2015–2030 provide a support structure to foster international monitoring and cooperation. The aim is to achieve a target of desirable goals for human development including improved food security and nutrition, sustainable resource conservation, better education and health [1]. In meeting the food security and nutrition needs of a rapidly growing population whilst respecting planetary boundaries, the need for a sustainably responsible system of food production is paramount [2,3]. To this end, much of the spotlight focuses on defining the correct role and purpose for the agriculture sector. For its part, the European Commission set out a vision for green growth under the auspices of the Green Deal [4]. Within this overarching policy initiative, the ‘Farm to Fork Strategy’ [5], seeks to promote an agricultural-system that not only steers production decisions in favour of sound practises, environmental accountability and the minimisation of leakage effects, but also seeks to reform consumer perceptions of diet and healthy eating.
The European Union (EU) has a long history of reforming its Common Agricultural Policy (CAP). In the past, CAP support instruments encouraged higher agricultural production, initially with guaranteed prices, then with subsidies paid in proportion (i.e., ‘coupled’) to farm output levels. This provoked criticism of wasteful agricultural production policies and trade-distortion effects on world markets [6,7]. To comply with World Trade Organisation rules, a key structural change to the CAP’s market measures and direct payments, catalysed by the 2003 reform, was the replacement of coupled payments with a Single Payment Scheme based on registered land entitlements. Since this transfer payment was received independently of the farmer’s decision to produce, the link between payment and production was deemed to be severed, or ‘decoupled’. As a result, changes in CAP payments would not be trade-distorting, whilst continuing to support EU farming incomes. The Single Payment Scheme, superseded in the 2013 CAP reform by the Basic Payment Scheme, remains linked to land entitlements. Importantly, the conditional receipt of said payment upon the provision of (environmental) public goods under the principle of ‘cross compliance’, has strengthened, whilst Basic Payment Scheme payment rates have also converged considerably across EU member states (MS) (For an overview of recent CAP reforms the reader may consult Swinnen [8,9]).
A cursory review of the scientific literature [10,11,12,13], however, identifies several possible ‘coupling-channels’ between decoupled payments and production. As the security of the payment is now entirely dependent upon policy makers rather than market conditions, it is posited that this policy landscape change has affected farmers’ perceptions of risk, expectations about future payments, improved access to bank credit and the hiring of on-farm/off-farm labour (For a full discussion of these well-established coupling channels, the reader may consult Boulanger et al. [12]). Increased income influences on-farm and off-farm labour supply decisions so that decoupled payments decrease the likelihood of off-farm work [14] and increase leisure time at the expense of off-farm work as well as on-farm work cutting agricultural production [15]. For example, Garrone et al. [16] find a clear negative impact of decoupled payments on off-farm labour migration at the EU level. This suggests a link between the decoupled payment and the labour factor. As decoupled payments improve farm income, they increase farm savings and investment. Decoupled payments may therefore also affect investment decisions by improving the credit worthiness of credit constraint farmers and their access to capital. Thus, with the financial cushion of the ‘decoupled’ payment, improved credit worthiness impacts upon farm investment and production, suggesting a link with the capital factor [11,17]. Moreover, studies assessing the impact of farmers’ expectations about future payments reveal an influence of the implementation of decoupled payments on current production and investment decisions [18,19,20]. Elsewhere, Koundouri et al. [21] explore the link on coupling via input usage, whilst Gohin and Zheng [22] examine the premise of how projected financial certainty from decoupled payments affects perceptions of risk, which in turn influences the optimal input mix. In this context, Hennessy [23] identifies three risk related effects. Decoupled payments are an additional source of income and therefore affect farmers’ wealth and thus reduce risk aversion-wealth effect [24,25]. They stabilise farm income by reducing income variability-insurance effect [26,27] and a re-link to productions decisions-coupling effect [28,29]. Meanwhile, also considering risk behaviour and expectations, Sckokai and Moro [26] present some acreage effects due to decoupled payments, concluding that an additional share of decoupled payments needs to be allocated to the land factor, though not fully capitalised into the land rent. Summarising, this literature reveals the indirect channels between a decoupled land-based payment and the agricultural labour and capital factors of production. Furthermore, these studies highlight the need for additional empirical research to determine more precisely how decoupled payments influence farm production decisions.
Prospective simulation modelling of agricultural sector policies plays a key role in policy circles. Economic simulation models typically examine how medium- to long-term deviations from an assumed ‘business as usual’ baseline impact on market prices and quantities. These deviations may take the form of changes in policy or technology, or they may even relate to the structural behavioural assumptions of the model. Different agriculture-focused partial equilibrium and macroeconomic computable general equilibrium (CGE) simulation models, with their associated strengths and weaknesses, are able to capture the complexities of agricultural factor and product markets to varying degrees. Given the level of parametric uncertainty generated by the differing coupling-channels and their respective magnitudes discussed above, there remains potential modelling bias within the common simulation modelling assumption of assuming a theoretically ‘decoupled’ payment. To illustrate this point for Ireland, the modelling study of Boysen et al. [30] calibrates the degree of decoupling using available data on agricultural output trends after the implementation of decoupled support. Likewise, other studies support the notion that the chosen parametrisation of decoupled payments is a decisive factor for models’ results [31,32,33].
The aforementioned EU related literature offers valuable insights, although in those examples where empirical measurement is given, it is restricted to highly specific activities or geographical groupings. This presents a challenge when employing models with full EU MS coverage and multiple sectors. On the other hand, in determining the degree of the decoupled payment tied to the land factor, a handful of related studies [34,35,36] offer empirical estimates on the proportion of decoupled payments capitalised into land values following their introduction within the 2003 CAP reform. Indeed, Ciaian et al. [37] is the only study that provides empirically estimated capitalisation rates for the pre- and post-2013 CAP reform period, together with a confidence interval of lower and upper boundary estimates.
Thus, employing a recognised and respected simulation model, the aim of the current paper is to implement a sensitivity analysis of this parametric uncertainty using the latest available plausible estimates from the literature above and reasoned assumptions. The objective is to examine the extent to which different CAP payment coupling settings affect the three pillars of sustainability, namely economy, society and environment [38]. To this end, selection of appropriate market and non-market indicators is employed.
The rest of the paper is structured as follows. Section 2 describes the model data and framework, the modelling assumptions for different coupling levels and the experimental design. Section 3 presents the results of a selection of indicators for the three pillars of economy, society and environment. Section 4 discusses the results and Section 5 concludes.
2. Materials and Methods
2.1. Data and Model Framework
The principal research question we seek to answer is how differing degrees of production ‘coupling’ and trade distortion impact upon economic, social and environmental indicators, across EU and non-EU large player regions. An ideal starting point for this task is the publically available (at cost) Global Trade Analysis Project (GTAP) database [39], which consists of a detailed and consistent set of tables of transaction values to capture the economic structure of the world economy. In its ninth incarnation (benchmark year 2011), this dataset contains 57 activities/commodities to characterise each of the 141 regional/national economies. These economies are interlinked by commodity specific gross bilateral trade flows including market distortions (subsidies/taxes) and transport costs. At cost-price, producer- and consumer prices, the database therefore records the flows of goods and services as inputs between industrial uses and finished products both within and across geographical boundaries. Upon this database, is calibrated a CGE model that consists of a system of simultaneous mathematical equations. This study employs an advanced CGE simulation model called the Modular Applied GeNeral Equilibrium Tool (MAGNET) [40] (For a full presentation of the MAGNET model, the reader may consult [41]).
At its core, the MAGNET model is based on the standard GTAP CGE model framework [42] (see Figure 1). Employing ‘convenient’ mathematical functional forms, the GTAP model applies principles of economic optimisation (i.e., welfare maximisation, cost minimisation) to characterise consumer and producer behaviour to endogenous price changes, whilst all production technologies exhibit constant returns to scale. A further series of factor and commodity market clearing equations enforce the condition that supply must equal demand, from which equilibrium prices emerge. Finally, to ‘close’ the macro circular flow, accounting equations ensure that all producers make zero ‘economic’ long run profits, the value of income from production factors, expenditures and output are assumed equal, whilst the net balance between the current account (exports minus imports) and the capital account (savings minus investments) amounts to zero.
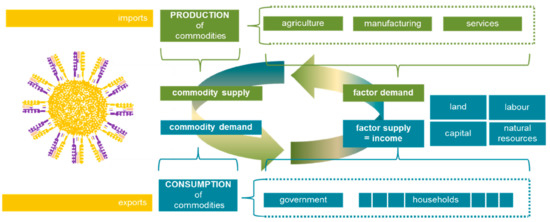
Figure 1.
A graphical representation of the computable general equilibrium CGE model framework (Philippidis et al. [43]).
In addition to standard treatments like GTAP, the MAGNET model includes a list of non-standard modelling extensions activated by binary modular switches. Indeed, given the focus of the current paper, MAGNET is a favoured choice of multi-region CGE model because it offers a superior treatment of agricultural markets. Firstly, the standard activity classifications in the GTAP database have been enhanced with additional sector splits for animal feeds, fertilisers, first generation biofuels and their co-products. In this way, one improves the representation of agricultural production technologies and more comprehensively characterises the main competing uses of crop biomass (i.e., food vs. feed vs. energy).
Secondly, the model has a state-of-the-art treatment of agricultural factor and product markets (i.e., endogenous land supply, differentiated rates of agricultural land transfer between competing agricultural sectors, differentiated production technologies for crop and livestock activities, labour and capital agricultural factor market rigidities, production quotas on raw milk and sugar, conventional biofuels mandates).
Finally, unlike standard single period (i.e., ‘comparative static’) simulation experiments, MAGNET permits multiple time-period simulation experiments (‘recursive dynamic’). In this way, the end of period equilibrium solution becomes the starting point for the next period, which better accommodates gradual structural changes in the world economy owing to differing rates of projected economic growth, technology and capital accumulation.
2.2. Model Aggregation and Experimental Design
Running the model with the full 141 region GTAP data disaggregation would be unwieldy due to a lack of available computing power. Instead, a careful choice of regions is made to fit the focus of the paper. Thus, the EU is represented as a single trade bloc. Due to its geographical proximity, the Rest of Europe (RoE) is a key trader with the EU. ‘Mercosur’ and ‘Australia and New Zealand’ (AusNZ) are key agri-food net-exporting regions, whilst in select product categories, the EU has notable trade ties with the United States, Mexico and Canada (NAFTA) (e.g., cereals, oilseeds); the Middle East and North Africa (MENA) (e.g., cereals, horticulture, dairy); Sub Saharan Africa (SSA) (e.g., cereals); and Asian (Asia) markets (e.g., rice, pork, dairy). A ‘Rest of the World’ (ROW) region captures all residual global trade flows. The choice of commodities takes advantage of the most detailed disaggregation of crops, livestock, feed and food activities in the MAGNET database. In addition, first generation biofuel activities are included, as well as (rival) fossil fuels and energy processing industries. Remaining activities are aggregated into ‘manufacturing’ and ‘services’.
The baseline is projected from 2011 to 2030 (Given the changes in EU agricultural policy design over time, it was not judged prudent to project the current design of the CAP beyond this time frame) in three-time steps of 2011–2015, 2015–2020 and 2020–2030. The principle drivers are population growth and region wide productivity growth to target real gross domestic product (GDP) growth, which follow the Agricultural Model Intercomparison and Improvement Project (AgMIP) (For further information on the AgMIP project, see https://agmip.org (accessed 3 August 2020) reference scenario, based on a ‘status quo’ shared socioeconomic pathway 2 (SSP2) [44]. In MAGNET, regional changes in labour endowments are assumed to match regional population, the capital stock changes at the same rate as real GDP (i.e., fixed medium to long-run capital-output ratio is assumed) and natural resources are projected to grow at one quarter the rate of the change in the capital stock. Additional land biasing productivity changes are also exogenously implemented, consistent with SSP2. To improve the veracity of the production response results (i.e., through a more accurate depiction of competition for land use), in accordance with the renewable energy directive (Directive 2003/30/EC of the European Parliament and of the Council of 8 May 2003 on the promotion of the use of biofuels and other renewable fuels for transport), our experiments assume that by 2020 onwards, the ‘first generation’ biofuel blending target reaches 7%.
In our experiments, the projection of CAP payments to 2030 is highly detailed, based on the work of Boulanger and Philippidis [45]. It relies on comprehensive historical official DG AGRI payments data by MS and associated payment ceiling limits to 2020. As such, the payment structure captures heterogeneous rates of voluntary coupled support (VCS) by agricultural activity and the resulting decoupled-coupled support payment split within the CAP (the presence of VCS is particularly pertinent for beef livestock (paid per head of cattle) which benefit most from these subsidies). Moreover, rural development support is classified over five aggregate categories of payment types. For the period 2020–2030, the structure of payments remains unchanged (i.e., the split between (i) rural development and (ii) market measures and direct payments is assumed constant, whilst within the latter category, the division between decoupled and voluntary coupled support also remains unchanged). In the 2020–2030 period, all CAP payments are deflated by 2% per annum.
CAP decoupled payments are implemented as a uniform agricultural land subsidy across all primary agricultural commodities [46]. Since land in the model is specific to the agriculture sector and the uniform payment rate does not favour any agricultural activity, there are no cross-commodity effects and the payment is modelled as fully decoupled (MAGNET has an endogenous land supply function such that changes in decoupled payments on land under this configuration will still generate ‘some’ degree of coupling effect on output).
As noted, all experiments employ the same CAP baseline shocks. The differences, however, lie with the degree to which the decoupled payments of the CAP are assigned across non-land factors [47,48]. More specifically, implementing the same CAP shocks, the decoupled payment attached to the land factor corresponds to the upper-, medium- and lower-land capitalisation shares in Ciaian et al. [37], which reflects the ‘low-’, ‘medium-’ and ‘high-coupling’ experiments, respectively. The low coupling experiment assumes that a majority share of the CAP decoupled payment indicated in Ciaian et al. [37] is capitalised into the agricultural land factor, thereby minimising the link with agricultural production decisions, whereas the remaining amount is distributed homogenously across all factors (unskilled and skilled labour, capital and land). At the upper limit, the ‘high-coupling’ experiment assumes that a larger proportion of the CAP decoupled payment is allocated to agricultural labour and agricultural capital factors. Since non-agricultural land factors can leave agriculture more easily, changes in support in the high-coupling experiment are expected to trigger more visible production effects. The assumptions behind these three configurations are described in Table 1.

Table 1.
Representation of decoupled payments in the model experiments (2011–2030).
Finally, as noted in the introduction, to examine how different CAP coupling settings affect economic-, social- and environmental dimensions, and the resulting trade-offs, a series of representative indicators are chosen as described in Figure 2.
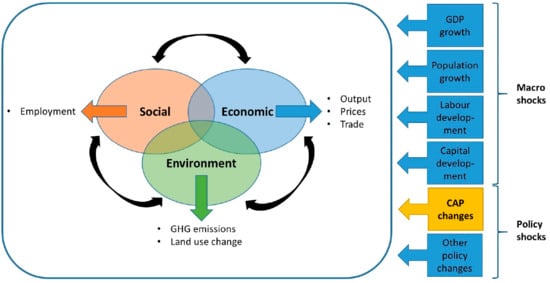
Figure 2.
Selected indicators through the prism of sustainability.
3. Results
3.1. Economic Impacts (Output, Prices and Trade)
Figure 3 and Figure 4 present the impacts on EU agri-food production and market prices from each of the model simulation experiments. With assumed projections to 2030 in real GDP growth, population and the labour force, rising real incomes and food expenditures propel demand increases for (inter alia) agricultural and food products, whilst productivity improvements on land and production technologies, motivate outward supply shifts. Structural shifts in economic comparative advantage are further compounded when considering the relative rates of change of these aforementioned drivers across world regions. In rapidly developing countries, for example, food demands rise much faster prompting increased import driven trade. At the world level, food demand is matched by agricultural productivity growth. In the baseline (i.e., full decoupling), the net result is that real world agricultural prices fall 8% by 2030 (not shown). This result is consistent with previous prospective modelling studies [49,50].
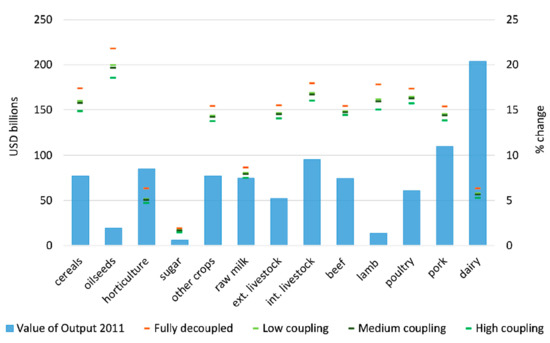
Figure 3.
Changes in EU agri-food output by experiment and sector. Note: Columns present the value of output evaluated at market prices (VOM) measured in USD billions in the base year 2011 (left axis), symbols present the percentage changes from 2011 to 2030 in output for each coupling experiment and the baseline representing full decoupling (right axis). Source: Own computations using MAGNET.
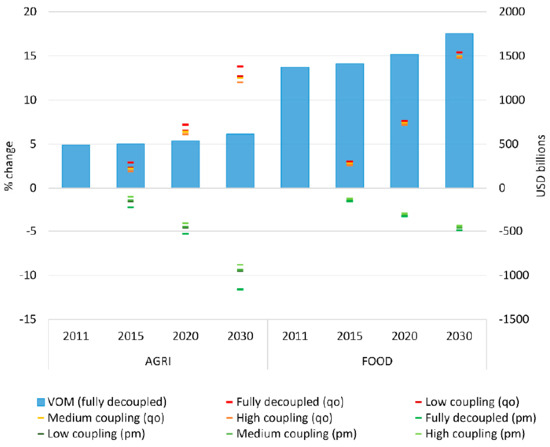
Figure 4.
Changes in EU market price and output by experiment and sector. Note Columns present the value of output evaluated at market prices (VOM) in USD billions for agricultural (AGRI) and food commodities for each period of the baseline representing full decoupling (right axis), symbols present the percentage changes in output quantity (qo) and market prices (pm) for each coupling experiment and the baseline (left axis) compared to the previous period. Source: Own computations using MAGNET.
For the baseline between 2011–2030, Figure 3 shows that EU agri-food sector production growth ranges between 2% (raw sugar) and 22% (oilseeds). By 2030, aggregate EU agricultural and food production rises 14% and 15%, respectively (Figure 4), whilst bioenergy output (from a small base) rises by 120% (not shown). To some extent, the smaller percentage increases are calculated from larger (e.g., horticulture, dairy) bases, whilst differing income elasticities of demand for different agri-food products also explain the heterogeneity of supply responses across EU agricultural activities. In the case of EU raw sugar, production remained quota constrained until 2017, whilst the abolition of quota has generated a major restructuring of the sector across the EU regions, with some EU MS stopping production altogether. In terms of EU agri-food market prices (green dashes in Figure 4), over different time periods there is a downward trend due to stronger supply shifts marked by sustained productivity increases (In the EU, population increases are only moderate, whilst per capita food demands have already plateaued in wealthier world regions (Engel’s Law)).
Comparing the baseline with the remaining experiments, a clear output reducing trend emerges. As stated in Section 2.2, CAP support in the decade from 2020 declines in real terms (deflated by 2% per annum). The higher is the level of assumed ‘coupling’ (i.e., tied to non-land factors), the more agricultural production contracts with real value reductions in CAP support as agricultural labour and capital leave the industry.
In the EU, it is estimated that agricultural production falls between 1% (low-coupling) and 2% (high-coupling) relative to the baseline (Figure 4), which is broadly reflected across all the agricultural sectors (Figure 3). Whilst not shown, concomitant conventional biofuel falls are between 10% and 15% below the baseline, due to falls in available biomass feedstock from the crops sectors (principally oilseeds). By 2030, this translates into a loss of EU primary agricultural production of between 9.0 (low-coupling) and 15.2 (high-coupling) million metric tonnes of agricultural production. With the scale of the agricultural supply reductions, market price rises compared with the baseline become stronger. Figure 4 shows that under high-coupling, by contrast to the baseline, EU agricultural and food prices rise by as much as 1.7% and 0.5% by 2030.
The trade distorting implications arising from the progressively greater falls in internal EU agricultural production are in Table 2. It shows a reduction in agricultural and food intra-EU trade compared to the baseline experiment of up to −2.3% and −0.7% respectively, indicating a decrease in self-sufficiency. This general relative trade trend is observed across all agricultural and food activities, for which the magnitude of the effects become stronger the higher degree of coupling of CAP support is assumed. Simultaneously, under higher levels of coupling, a trade shift is observed as a greater proportion of EU imports come from third-country sources. For example, relative extra-EU imports rise by 1.7%, 1.9% and 2.6% under low-, medium- and high-coupling, respectively. Finally, with reduced levels of EU food self-sufficiency (food security), extra-EU agri-food exports from all activities drop compared with the baseline. In EU primary agriculture, the range of these extra-EU exports falls is between −3.8% (low-coupling) to −6.4% (high-coupling), whilst for processed food the corresponding figures are −1.3% and −2.3%.
Table 2.
Changes (%) in EU trade, by experiment and sector.
In the non-EU regions, the pattern of the trends is the mirror image of the EU, with relative increases in agricultural and food production, typically of between 0.1% (low-coupling) to 0.4% (high coupling) (not shown). As a result, non-EU region exports rise to fill the gap left by the EU’s decreasing self-sufficiency. Thus, Table 3 shows how the magnitude of non-EU agriculture and food exports rises with the assumption of higher levels of coupling. Noteworthy is the estimated agricultural export gain to Sub-Saharan African agriculture of up to 2%, which suggests that CAP reform could potentially have a more significant impact on agriculture in this region than previously thought. The overall impact of the redistribution of world agricultural and food trade leaves only a moderate impact on world prices. More specifically, from the low-coupled to the high-coupled experiment, the world price index of agricultural (processed food) prices rises over the range 0.20–0.34% (0.1–0.16%) compared with the baseline (not shown).
Table 3.
Changes (%) in agri-food trade, by experiment, sector and region.
3.2. Social Impacts (Employment)
While Janker and Mann [51] stress that the social dimension of sustainability still lacks a clear definition and relies on normative approaches, they conclude that human rights, employment, and life quality are among the topics that occur most prominent in the literature. To illustrate the social dimension arising from our varying parameterisation of CAP support payments, we therefore choose the employment indicator.
Over the period 2011–2030, there are differing productivity rates of improvement that result in structural changes in the EU economy in favour of manufacturing and services activities (and away from primary agriculture). Indeed, this structural change motivates an aggregate EU employment demand increase of 2.9% in the baseline, leading to a total employment figure of 225 million workers. Moreover, the competitive edge in EU agriculture is eroded due to more rapid productivity improvements in agricultural sectors in other regions of the world, and the reduction in EU voluntary coupled support payments. Due to these factors, in the baseline there is a steady decline in EU agricultural and food sector employment.
From the model simulation and accompanying satellite data from Eurostat, it is estimated that EU agricultural employment falls by approximately 6% to 10.4 million full time equivalents (FTEs) (Table 4). Decomposing this result into crops and livestock, the corresponding falls are 6.3% (to 6.4 million) and 4.8% (to 4 million), respectively. The fall in crops is largely motivated by the 11% employment fall in the labour abundant horticulture sector. In EU food processing activities, a slightly larger fall of 9% is recorded, with a final estimated employment figure of 5.7 million people (Table 4).
Table 4.
Changes in EU employment by experiment and sector.
Comparing the experiments with the baseline clearly shows the employment impacts arising from different degrees of CAP payment coupling. As more decoupled CAP support is assigned to labour and capital factors (e.g., progressively higher coupling), the fall in real CAP support over time encourages an increasingly stronger exodus of these primary factors from the primary agricultural sector. As a result, the safety-net on agricultural employment is also eroded. Examining Table 4, in the low-coupling experiment there is a further relative fall in EU agricultural and food employment of 119 thousand and 17 thousand, respectively. In the high-coupling experiment, this headline employment figure deteriorates further by 199 thousand and 29 thousand, respectively.
3.3. Environment (Emissions and Land)
With the rise in EU agricultural output reported above, the baseline reveals that EU agricultural greenhouse gases (GHG) (consistent with SDG target 13.2.) rise by 8% over the period to 479 million tonnes of CO2 equivalent (MtCO2e). It should be noted that this estimate does not consider environmental abatement strategies (i.e., changing emissions factors) or other ‘green’ initiatives (a full internalisation of EU environmental policy is beyond the scope if this study). From this total, 345 MtCO2e come from highly emissions intensive livestock activities (this is due to the high concentrations of methane (CH4) emissions in livestock activities). In the rest of the world, the more rapid proportional rise in per capita incomes and population propel a rise in non-EU agricultural emissions of 44%.
Examining the marginal impacts of the other experiments by 2030 (Figure 5), the falls in EU agricultural (and food) output reported in Section 3.1, are translated into concomitant GHG reductions. Thus, in the low-coupling experiment, EU agricultural and fertiliser emissions fall 5.3 MtCO2e (of which 3.6 MtCO2e is from livestock) and 0.7 MtCO2e, respectively. On the other hand, there is a leakage effect in the rest of the world as emissions from non-EU regions rise 10 MtCO2e, of which approximately 40% comes jointly from NAFTA and Mercosur. In the high-coupling experiment, EU agricultural and fertiliser emissions fall by up to 9.2 MtCO2e (of which 6.3 MtCO2e is from livestock) and 1.1 MtCO2e, respectively. For EU agricultural GHG emissions, this fall is 2% below the baseline level in 2030. Examining the rest of the world, non-EU agricultural emissions rise by 17 MtCO2e, of which 13 MTCO2e are concentrated in the livestock sectors.
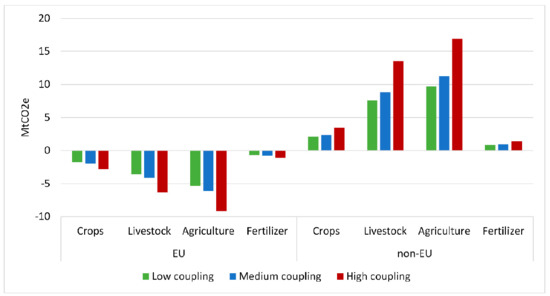
Figure 5.
Changes in GHG emissions by experiment, sector and region. Note: Absolute changes (MtCO2e) in the experiments vs. baseline representing full decoupling in 2030. Source: Own computations using MAGNET.
Employing a satellite dataset based on FAO [52], the environmental sustainability impacts of our model assumptions is also measured in terms of agricultural land usage (consistent with SDGs targets 15.2 and 15.3). In the baseline to 2030, despite rising EU agricultural output, EU agricultural land usage falls 1.2%, to 1.8 million square kilometres (mkm2). Within this EU figure, 1 mkm2 is dedicated to crops and eight hundred thousand km2 to livestock. On the one hand, this fall in EU agricultural land area is partly due to the assumed projected rises in EU land productivity (land productivity improvements are taken from a bottom-up biophysical land use model called IMAGE [53]) and feed efficiencies in our baseline. On the other hand, it is also linked to the falling rental value of land due to real reductions in CAP support. As capitalised landowner rental values fall, the opportunity cost of agricultural land usage increases. This fall in EU agricultural land in the baseline, contrasts with a concomitant rise in non-EU region agricultural land usage of 6.4%, or 34.5 mkm2. Despite assumed land productivity increases, strong rises in non-EU population growth and per capita incomes drive this increasing trend. Overall, by 2030, global agricultural land usage in the baseline experiment rises 3 mkm2, with rises in arable land of 1.6 mkm2 or 160 million hectares (this estimate is compared with a ‘business as usual’ increase of 11% in global arable land (165 million ha) recorded by FAO [2] from 2012 to 2050).
In the experiments, land retention within the EU agricultural sector remains higher than the baseline (Figure 6). This is because under higher assumed levels of coupling, smaller proportions of decoupled payments are capitalised into land rents (i.e., a larger proportion is linked to non-land agricultural factors). As a result, the steady reduction of CAP support in real terms does not deflate the rental value of land as strongly, and the opportunity cost of holding land for the owners is reduced (although not shown, our simulation results indicate that agricultural landowner rents in the EU remain between 6% (low coupling/high decoupling) and 13% (high coupling/low decoupling) higher than the baseline). Thus, the higher is the assumed level of coupling, the larger is the reduction in agricultural production and the greater is land retention, implying that agricultural yields fall by greater amounts. This points to a stronger switch toward a less intensive EU agricultural management system. Examining Figure 6, the increased retention of land in EU agriculture is between 13 thousand km2 (low-coupling) and 23 thousand km2 (high-coupling). On the other hand, in the non-EU regions, land leakage effects are strong, rising between 14 thousand km2 (low-coupling) to 24 thousand km2 (high-coupling). Much of these increases are motivated by pastureland rises in Mercosur and Sub Saharan Africa (Figure 6).
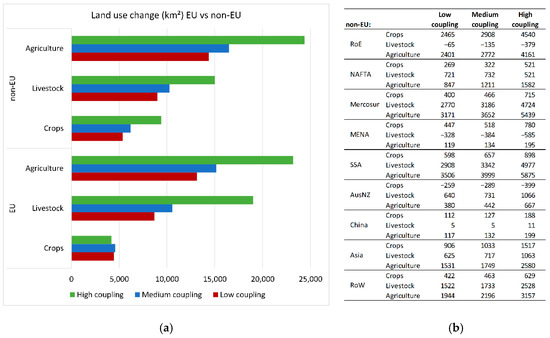
Figure 6.
Changes (km2) in land usage in agriculture by experiment, sector and region. (a) Graph shows absolute land use changes for EU and non-EU regions. (b) shows absolute land use changes for all regions included in non-EU. Note: Absolute changes in the experiments vs. baseline representing full decoupling in 2030. Source: Own computations using MAGNET.
4. Discussion
Within the EU, the Green Deal has set the tone for a green growth driven strategy of economic prosperity. As the oldest existing common policy of the EU, CAP reforms over the last two decades have reflected this growing reality as farmer compliance with green production practises has spread, whilst agri-environmental rural development policies have strengthened. In tandem, the EU wishes to be seen as a ‘fair’ trader, where policies and trade agreements should seek to reduce as feasibly as possible ‘leakage’ effects in third countries. An increasing amount of oil crops imported into the EU fosters land use changes in their countries of origin, such as deforestation, which leads to higher GHG emissions. By way of example, in parts of Asia, significant land clearance for the expansion of palm plantations has been driven not only by human consumption, but also by its use as a feedstock for biodiesel. In response, the EU will completely phase out imports of palm oil from Asia as a means to reduce indirect land use change resulting in deforestation [54]. Currently it is estimated that EU palm oil imports from Southeast Asia (mainly Indonesia and Malaysia) contribute to about 17% of deforestation associated with total EU oil crops imports [55]. From the perspective of trade, the majority of CAP direct payments are classed as non-distortionary, although this claim is refuted by academic literature given the presence of coupling-channels. As a result, these coupling-channels of EU decoupled payments could have implications for the multilateral trading system and the World Trade Organisation [56].
Varying the parametrics of coupling of EU decoupled support payments, the resulting impact shows a systematic degree of deviation on a selection of indicators representing the three pillars of sustainability. Indeed, the deviation arising from these parametric configurations gives rise to a series of trade-offs from the standard ‘fully-decoupled’ parametric treatment in the baseline. Moreover, the results suggest that said impacts are amplified the longer is the time period under consideration. This is of special concern considering the increasing long-term horizon of policy objectives (e.g., achieving climate neutrality by 2050 in the EU [4]).
Taking the first two of these pillars, in the EU it is apparent that as a ‘safety-net’ for food security and agricultural employment concerns, the capacity of the CAP is diminished under higher assumed levels of coupling. At the upper coupling limit of assumed coupling, the EU agricultural production loss and agricultural employment loss is equivalent to of the absolute values in Belgium and Hungary, respectively, at the beginning of the baseline period. Moreover, the loss of food security is also reflected in reduced levels of intra-EU trade and rising agricultural and food market prices. Although these average EU price increases are not expected to be significant, in specific localities with lower per capita incomes, this could still have more serious implications.
Staying with economic and social considerations, from a global perspective, there are clear signs that if one considers CAP measures as more coupled, trade-led growth opportunities to third countries with greater comparative advantage in agriculture, are apparent. This is found to be particularly positive in Sub Saharan Africa. Given the less mechanised nature of agricultural production systems in many less developed and developing countries, it is quite plausible that the rise in agricultural employment elsewhere outweighs the loss of agricultural employment in the EU.
Examining the environmental pillar, reducing CAP support with the assumption of strong coupling provides a positive message that EU emissions falls are more pronounced. To contextualise this result, at the upper assumed level of coupling, the fall in EU agricultural emissions is equivalent to 11% of France’s agricultural emissions at the beginning of the baseline period. When leakage effects are considered, however, the picture changes. Indeed, by filling the vacuum to supply EU food security concerns, the assumption of stronger coupling also delivers larger leakage effects as non-EU regions’ agricultural output rises more strongly through trade. As a result, under the assumption of high-coupling, net global agricultural emissions rise by 7.8 MtCO2e. The results therefore tentatively suggest that maintaining real levels of CAP support could have a beneficial impact on controlling global agricultural emissions.
In their study, Jansson et al. [57] examine the impacts of only removing CAP voluntary coupled support measures (VCS). They discover that the leakage effects upon removing all VCS payments, make up approximately 75% of the fall in EU agricultural emissions. They therefore conclude that VCS is damaging efforts to reduce global emissions. A comparison with their finding must contend with modelling differences in emissions factors and structural assumptions (i.e., elasticities, treatment of trade). Furthermore, a key difference with our study is that they focus exclusively on a narrow set of payments that are largely linked to specific emissions intensive livestock sectors (in 2018, VCS expenditure amounted to less than 4 billion euros when decoupled payments totalled 34.4 billion euros [58]). In our simulation experiment, the real reductions in CAP support and the resulting decision-making (i.e., coupling) behaviour is pertinent to all crop and livestock activities. Moreover, only focusing on voluntary coupled support might be expected to draw a stronger EU production reduction than even the highest level of coupling considered in our experiments, with the result that EU emissions falls are more pronounced. In any case, a cursory examination of additional references in the partial equilibrium and CGE agricultural modelling literature [59,60,61] reveals that the issue of leakage remains far from clear.
Finally, for the indicator of land usage, the picture in the EU is that lower levels of assumed capitalisation into the land factor (i.e., higher degrees of coupling) result in greater land retention as the opportunity cost of selling agricultural land for alternate uses is reduced. Between low- and high-coupling assumptions, relatively higher levels of EU land retention compared with the baseline are 4.5% to 8.1% of the agricultural land area of France in the beginning period. As noted, the picture in the EU is of a more extensive (i.e., lower yields per hectare) agricultural system of land management. At the very least, higher coupling suggests that potentially more environmentally damaging alternate uses of EU agricultural land might be discouraged (i.e., urbanisation). In the rest of the world, however, non-trivial land leakage effects are observed, with an increase in non-EU land area commensurate with the agricultural land retention areas in the EU.
At the current time, the assignment of decoupled payments to land follows the latest (i.e., post 2013 CAP reform), and most comprehensive EU estimates of Ciaian et al. [37]. In the absence of clear estimates, the remaining decoupled support payment is allocated as a uniform rate payment across all agricultural factors. A significant step forward, therefore, would be to more precisely understand and quantify the possible share of decoupled support payments attached to agricultural factors that reflects some or all of the indirect coupling channels relating to (inter alia) on/off farm-labour retention, access to credits, risk behaviour and farmers expectations about future payments. Moreover, it is clear that the CAP is a policy that continues to evolve and adapt to the changing priorities of EU policy. In this regard, updated estimates for such coupling channels are essential to keep pace with the changing supply response of farmers to evolving CAP measure designs.
5. Conclusions
The successive reforms over the last twenty years have seen a complete redesign of the Common Agricultural Policy (CAP). It has shifted from a production driven system of coupled support payments to a non-distorting multifunctional policy instrument. The current CAP emphasises the provision of non-market public goods through rural development policies, and a system of market measures and direct payments granted independently from production (decoupled) that are principally designed to maintain farming incomes. Evidence in the academic literature, however, indicates that decoupled payments may indirectly influence farmer’s production decisions through a series of ‘coupling-channels’.
To explore this hypothesis, this paper employs the best available estimates from the academic literature to model different degrees of coupling using an advanced ex-ante medium term simulation model called the Modular Applied GeNeral Equilibrium Tool (MAGNET), complete with numerous non-standard modelling extensions to characterise agricultural factor and product markets. A business as usual baseline to 2030 is implemented consisting of real GDP, population and labour force shocks, a detailed representation of CAP measures and, to improve the representation of feed-crop biomass usage, conventional biofuel policy mandates. This baseline assumes that all decoupled payments have no influence on agricultural production (standard assumption). Three alternate experiments with different degrees of production coupling are compared with this baseline.
Through the prism of sustainability, we show that different configurations of coupling reveal noticeable deviations for economic, social and environmental indicators compared with the standard ‘fully-decoupled’ model treatment. Moreover, the longer is the time horizon under consideration, the more these deviations are expected to widen. As a result, current prospective market and non-market impacts of the actual CAP, or of policy reforms thereof, are potentially mis-specified. At the very least, it implies that the non-distorting status of decoupled payments on world markets may be overstated, which also has a direct impact on greener policy initiatives under the auspices of the Green Deal that promote fairer trade and the minimisation of leakage in third countries. Until a fuller empirical appreciation of all possible coupling-channels is internalised within simulation studies, the full extent of this bias remains only partly visible.
Author Contributions
P.B., K.B.-U. and G.P. conceptualised the research. G.P. ran the simulations in collaboration with K.B.-U., P.B., K.B.-U. and G.P. were involved in the formal analysis, writing and reviewing of the paper. P.B., K.B.-U. and G.P. have read and agreed to the published version of the manuscript.
Funding
This research was partly funded by the Instituto Nacional de Investigación y Tecnología Agraria y Alimentaria (INIA) (RTA2017-00046-00-00), co-funded by FEDER “Operational Program Smart-Growth” 2014–2020, for the project “Bioeconomía 2030: Un análisis cuantitativo de las perspectivas a medio plazo en España”.
Institutional Review Board Statement
Not applicable.
Informed Consent Statement
Not applicable.
Acknowledgments
We would like to thank two anonymous reviewers for their comments on an earlier draft. The authors are also grateful for the useful feedback received on earlier versions of this work presented by Pierre Boulanger whilst employed by the Joint Research Centre (JRC Seville) at the 172nd European Association of Agricultural Economists (EAAE) Seminar on “Agricultural policy for the environment or environmental policy for agriculture?” (Brussels: 28–29 May 2019) and at the 12th Congress of the Spanish Association of Agricultural Economists (Lugo: 4–6 September 2019).
Conflicts of Interest
The authors declare no conflict of interest.
References
- United Nations. Resolution Adopted by the General Assembly on 25 September 2015. A/RES/70/1. Available online: https://www.un.org/en/development/desa/population/migration/generalassembly/docs/globalcompact/A_RES_70_1_E.pdf (accessed on 16 November 2020).
- Food and Agriculture Organization. The Future of Food and Agriculture—Alternative Pathways to 2050; FAO: Rome, Italy, 2018; Licence: CC BY-NC-SA 3.0 IGO 2018; Available online: http://www.fao.org/3/I8429EN/i8429en.pdf (accessed on 16 November 2020).
- Intergovernmental Panel on Climate Change. Global Warming of 1.5 °C. An IPCC Special Report on the Impacts of Global Warming of 1.5 °C Above Pre-Industrial Levels and Related Global Greenhouse Gas Emission Pathways, in the Context of Strengthening the Global Response to the Threat of Climate Change, Sustainable Development, and Efforts to Eradicate Poverty; Intergovernmental Panel on Climate Change: Geneva, Switzerland, 2018; Available online: https://www.ipcc.ch/sr15/download/#full (accessed on 16 November 2020).
- European Commission. Communication from the Commission to the European Parliament, the European Council, the Council, the European Economic and Social Committee and the Committee of the Regions. The European Green Deal; European Commission: Brussels, Belgium, 2019. [Google Scholar]
- European Commission. Communication from the Commission to the European Parliament, the European Council, the Council, the European Economic and Social Committee and the Committee of the Regions. A Farm to Fork Strategy for a Fair, Healthy and Environmentally-Friendly Food System; European Commission: Brussels, Belgium, 2020. [Google Scholar]
- Josling, T.; Anderson, K.; Schmitz, A.; Tangermann, S. Understanding International Trade in Agricultural Products: One Hundred Years of Contributions by Agricultural Economists. Am. J. Agric. Econ. 2010, 92, 424–446. [Google Scholar] [CrossRef]
- Daugbjerg, C. Responding to Non-Linear Internationalisation of Public Policy: The World Trade Organization and Reform of the CAP 1992–2013. J. Common Mark. Stud. 2017, 55, 486–501. [Google Scholar] [CrossRef]
- Swinnen, J. The Perfect Storm: The Political Economy of the Fischler Reforms of the Common Agricultural Policy; Centre for European Policy Studies: Brussels, Belgium, 2008; ISBN 9789290797661. [Google Scholar]
- Swinnen, J. The Political Economy of the 2014-2020 Common Agricultural Policy. An Imperfect Storm; Centre for European Policy Studies: Brussels, Belgium, 2015; ISBN 9781783484843. [Google Scholar]
- Bhaskar, A.; Beghin, J.C. How Coupled Are Decoupled Farm Payments? A Review of the Evidence. J. Agric. Resour. Econ. 2009, 34, 130–153. Available online: https://www.jstor.org/stable/41548405 (accessed on 20 November 2020).
- Moro, D.; Sckokai, P. The impact of decoupled payments on farm choices: Conceptual and methodological challenges. Food Policy 2013, 41, 28–38. [Google Scholar] [CrossRef]
- Boulanger, P.; Philippidis, G.; Urban, K. Assessing Potential Coupling Factors of European Decoupled Payments with the Modular Agricultural GeNeral Equilibrium Tool (MAGNET); JRC Technical Report, EUR 28253 EN; Publications Office of the European Union: Luxembourg, 2017. [Google Scholar]
- Olagunju, K.O.; Patton, M.; Feng, S. Estimating the Impact of Decoupled Payments on Farm Production in Northern Ireland: An Instrumental Variable Fixed Effect Approach. Sustainability 2020, 12, 3222. [Google Scholar] [CrossRef]
- Serra, T.; Goodwin, B.K.; Featherstone, A.M. Agricultural Policy Reform and Off-farm Labour Decisions. J. Agric. Econ. 2005, 56, 271–285. [Google Scholar] [CrossRef]
- Dewbre, J.; Mishra, A.K. Impact of Program Payments on Time Allocation and Farm Household Income. J. Agric. Appl. Econ. 2007, 39, 489–505. [Google Scholar] [CrossRef]
- Garrone, M.; Emmers, D.; Olper, A.; Swinnen, J. Jobs and agricultural policy: Impact of the common agricultural policy on EU agricultural employment. Food Policy 2019, 87, 1017–1044. [Google Scholar] [CrossRef]
- Vercammen, J. Farm bankruptcy risk as a link between direct payments and agricultural investment. Eur. Rev. Agric. Econ. 2007, 34, 479–500. [Google Scholar] [CrossRef]
- Tranter, R.B.; Swinbank, A.; Wooldridge, M.J.; Costa, L.; Knapp, T.; Little, G.P.J.; Sottomayor, M.L. Implications for food production, land use and rural development of the European Union’s Single Farm Payment: Indications from a survey of farmers’ intentions in Germany, Portugal and the UK. Food Policy 2007, 32, 656–671. [Google Scholar] [CrossRef][Green Version]
- Lagerkvist, C.J. Agricultural policy uncertainty and farm level adjustments—The case of direct payments and incentives for farmland investment. Eur. Rev. Agric. Econ. 2005, 32, 1–23. [Google Scholar] [CrossRef]
- Breen, J.P.; Hennessy, T.C.; Thorne, F.S. The effect of decoupling on the decision to produce: An Irish case study. Food Policy 2005, 30, 129–144. [Google Scholar] [CrossRef]
- Koundouri, P.; Laukkanen, M.; Myyrä, S.; Nauges, C. The effects of EU agricultural policy changes on farmers’ risk attitudes. Eur. Rev. Agric. Econ. 2009, 36, 53–77. [Google Scholar] [CrossRef]
- Gohin, A.; Zheng, Y. Assessing The Market Impacts of The Common Agricultural Policy: Does Farmers’ Risk Attitude Matter? In Proceedings of the International Agricultural Trade Research Consortium’s (IATRC) Annual Meeting, Clearwater Beach, FL, USA, 13–15 December 2015; Available online: https://econpapers.repec.org/paper/agsiats15/229235.htm (accessed on 16 November 2020).
- Hennessy, D.A. The Production Effects of Agricultural Income Support Policies under Uncertainty. Am. J. Agric. Econ. 1998, 80, 46–57. [Google Scholar] [CrossRef]
- Féménia, F.; Gohin, A.; Carpentier, A. The decoupling of farm programs: Revisiting the wealth effect. Am. J. Agric. Econ. 2010, 92, 836–848. [Google Scholar] [CrossRef]
- Just, D.R. Calibrating the wealth effects of decoupled payments: Does decreasing absolute risk aversion matter? J. Econom. 2011, 162, 25–34. [Google Scholar] [CrossRef]
- Sckokai, P.; Moro, D. Modeling the Reforms of the Common Agricultural Policy for Arable Crops under Uncertainty. Am. J. Agric. Econ. 2006, 88, 43–56. [Google Scholar] [CrossRef]
- Sckokai, P.; Moro, D. Modelling the impact of the CAP Single Farm Payment on farm investment and output. Eur. Rev. Agric. Econ. 2009, 36, 395–423. [Google Scholar] [CrossRef]
- Moro, D.; Sckokai, P. Modelling the CAP arable crop regime in Italy: Degree of decoupling and impact of Agenda 2000. Cahiers d’économie Sociologie Rurales 1999, 53, 49–73. Available online: https://ageconsearch.umn.edu/record/206189 (accessed on 16 November 2020).
- Sckokai, P.; Antón, J. The degree of decoupling of area payments for arable crops in the European Union. Am. J. Agric. Econ. 2005, 87, 1220–1228. [Google Scholar] [CrossRef]
- Boysen, O.; Miller, A.C.; Matthews, A. Economic and Household Impacts of Projected Policy Changes for the Irish Agri-food Sector. J. Agric. Econ. 2016, 67, 105–129. [Google Scholar] [CrossRef]
- Gohin, A. Assessing CAP reform: Sensitivity of modelling decoupled policies. J. Agric. Econ. 2006, 57, 415–440. [Google Scholar] [CrossRef]
- Balkhausen, O.; Banse, M.; Grethe, H. Modelling CAP decoupling in the EU: A comparison of selected simulation models and results. J. Agric. Econ. 2008, 59, 57–71. [Google Scholar] [CrossRef]
- Boysen-Urban, K.; Brockmeier, M.; Jensen, H.G.; Boysen, O. Measuring the Trade Restrictiveness of Domestic Support using the EU Common Agricultural Policy as an Example. J. Agric. Econ. 2020, 71, 27–49. [Google Scholar] [CrossRef]
- Ciaian, P.; Kancs, A. The Capitalization of Area Payments into Farmland Rents: Micro Evidence from the New EU Member States. Can. J. Agric. Econ. 2012, 60, 517–540. [Google Scholar] [CrossRef]
- Michalek, J.; Ciaian, P.; Kancs, A. Capitalization of the Single Payment Scheme into Land Value: Generalized Propensity Score Evidence from the European Union. Land Econ. 2014, 90, 260–289. [Google Scholar] [CrossRef]
- Ciaian, P.; Kancs, D.; Swinnen, J. The Impact of the 2013 Reform of the Common Agricultural Policy on Land Capitalization in the European Union. Appl. Econ. Perspect. Policy 2014, 36, 643–673. [Google Scholar] [CrossRef]
- Ciaian, P.; Kancs, A.; Espinosa, M. The Impact of the 2013 CAP Reform on the Decoupled Payments’ Capitalisation into Land Values. J. Agric. Econ. 2018, 69, 306–337. [Google Scholar] [CrossRef]
- Purvis, B.; Mao, Y.; Robinson, D. Three pillars of sustainability: In search of conceptual origins. Sustain. Sci. 2019, 14, 681–695. [Google Scholar] [CrossRef]
- Aguiar, A.; Narayanan, B.; McDougall, R. An Overview of the GTAP 9 Data Base. J. Glob. Econ. Anal. 2016, 1, 181–208. [Google Scholar] [CrossRef]
- Woltjer, G.; Kuiper, M. The MAGNET Model—Module Description; LEI Report 14-057; Wageningen UR (University & Research): The Hague, The Netherlands, 2014; Available online: https://edepot.wur.nl/310764 (accessed on 16 November 2020).
- The Modular Applied GeNeral Equilibrium Tool (MAGNET). Available online: https://www.magnet-model.org (accessed on 16 November 2020).
- Corong, E.L.; Hertel, T.W.; McDougall, R.; Tsigas, M.E.; van der Mensbrugghe, D. The standard GTAP model, version 7. J. Glob. Econ. Anal. 2017, 2, 1–119. [Google Scholar] [CrossRef]
- Philippidis, G.; Shutes, L.; M’Barek, R.; Ronzon, T.; Tabeau, A.; van Meijl, H. Snakes and ladders: World development pathways’ synergies and trade-offs through the lens of the Sustainable Development Goals. J. Clean Prod. 2020, 267, 122–147. [Google Scholar] [CrossRef] [PubMed]
- O’Neill, B.; Kriegler, E.; Ebi, K.; Kemp-Benedict, E.; Riahi, K.; Rothman, D.S.; van Ruijven, B.J.; van Vuuren, D.P.; Birkmann, J.; Kok, K.; et al. The roads ahead: Narratives for shared socioeconomic pathways describing world futures in the 21st century. Glob. Environ. Chang. 2017, 42, 169–180. [Google Scholar] [CrossRef]
- Boulanger, P.; Philippidis, G. The EU budget battle: Assessing the trade and welfare impacts of CAP budgetary reform. Food Policy 2015, 51, 119–130. [Google Scholar] [CrossRef]
- Frandsen, S.E.; Gersfelt, B.; Jensen, H.G. The impacts of redesigning European agricultural support. Rev. Urban. Reg. Dev. Stud. 2003, 15, 106–131. [Google Scholar] [CrossRef]
- Urban, K.; Jensen, H.G.; Brockmeier, M. Extending the GTAP Database and Model to Cover Domestic Support Issues Using the EU as Example; GTAP Technical Paper Series 35; Center for Global Trade Analysis, Purdue University: West Lafayette, IN, USA, 2014; Available online: https://www.gtap.agecon.purdue.edu/resources/download/8176.pdf (accessed on 16 November 2020).
- Urban, K.; Jensen, H.G.; Brockmeier, M. How decoupled is the Single Farm Payment and does it matter for international trade? Food Policy 2016, 59, 126–138. [Google Scholar] [CrossRef]
- Baldos, U.L.; Hertel, T.W. Bursting the Bubble: A Long Run Perspective on Crop Commodity Prices; GTAP Working Paper 80; Center for Global Trade Analysis, Purdue University: West Lafayette, IN, USA, 2014; Available online: https://www.gtap.agecon.purdue.edu/resources/res_display.asp?RecordID=4574 (accessed on 16 November 2020).
- Organisation for Economic Co-operation Development. Food and Agriculture Organization. OECD-FAO Agricultural Outlook 2020–2029; OECD Publishing: Paris, France; FAO: Rome, Italy, 2020. [Google Scholar] [CrossRef]
- Janker, J.; Mann, S. Understanding the social dimension of sustainability in agriculture: A critical review of sustainability assessment tools. Environ. Dev. Sustain. 2020, 22, 1671–1691. [Google Scholar] [CrossRef]
- Food and Agriculture Organization. Food and Agricultural Organisation of The United Nations Statistics Division, FAOSTAT. Available online: http://www.fao.org/faostat/en/#data (accessed on 16 November 2020).
- Daioglou, V.; Stehfest, E.; Wicke, B.; Faaij, A.; van Vuuren, D.P. Projections of the Availability and Cost of Residues from Agriculture and Forestry. Glob. Chang. Biol. Bioenergy 2016, 8, 456–470. [Google Scholar] [CrossRef]
- EurActiv. EU Parliament Ends Palm Oil and Caps Crop-Based Biofuels at 2017 Levels. 2018. Available online: https://www.euractiv.com/section/agriculture-food/news/eu-parliament-ends-palm-oil-and-caps-crop-based-biofuels-at-2017-levels/ (accessed on 16 November 2020).
- Cuypers, D.; Geerken, T.; Gorissen, L.; Lust, A.; Peters, G.; Karstensen, J.; Prieler, S.; Fischer, G.; Hizsnyik, E.; Van Velthuizen, H. The impact of EU Consumption on Deforestation: Comprehensive Analysis of the Impact of EU Consumption on Deforestation; European Commission Technical Report, 2013–2063; Publications Office of the European Union: Luxembourg, 2013. [Google Scholar] [CrossRef]
- Swinbank, A.; Tranter, R. Decoupling EU Farm Support: Does the New Single Payment Scheme Fit within the Green Box? Estey Cent. J. Int. Law Trade Policy 2005, 6, 47–61. [Google Scholar] [CrossRef]
- Jansson, T.; Nordin, I.; Wilhelmsson, F.; Witzke, P.; Manevska-Tasevska, G.; Weiss, F.; Gocht, A. Coupled Agricultural Subsidies in the EU undermine climate efforts. Appl. Econ. Perspect. Policy 2020, 1–17. [Google Scholar] [CrossRef]
- European Commission. Commission Staff Working Document Accompanying the 13th Financial Report from the Commission to the European Parliament and the Council on the European Agricultural Guarantee Fund—2019 Financial Year; European Commission: Brussels, Belgium, 2020. [Google Scholar]
- van Doorslaer, B.; Witzke, H.P.; Huck, I.; Weiss, F.; Fellmann, T.; Salputra, G.; Jansson, T.; Drabik, D.; Leip, A. An Economic Assessment of GHG Mitigation Policy Options for EU Agriculture; JRC Technical Report, EUR 27097 EN; Publications Office of the European Union: Luxembourg, 2015. [Google Scholar] [CrossRef]
- Fellmann, T.; Witzke, P.H.; Weiss, F.; van Doorslaer, B.; Drabik, D.; Huck, I.; Salputra, G.; Jansson, T.; Leip, A. Major Challenges of Integrating Agriculture into Climate Change Mitigation Policy Frameworks. Mitig. Adapt. Strateg. Glob. Chang. 2018, 23, 451–468. [Google Scholar] [CrossRef] [PubMed]
- Zhang, Z.X. Competitiveness and Leakage Concerns and Border Carbon Adjustments. Int. Rev. Environ. Resour. Econ. 2012, 6, 225–287. [Google Scholar] [CrossRef]


Publisher’s Note: MDPI stays neutral with regard to jurisdictional claims in published maps and institutional affiliations. |
© 2021 by the authors. Licensee MDPI, Basel, Switzerland. This article is an open access article distributed under the terms and conditions of the Creative Commons Attribution (CC BY) license (http://creativecommons.org/licenses/by/4.0/).