1. Introduction
Clean energy sources play a key role in ensuring the sustainability of the global energy system [
1]. Its deployment is a fundamental pillar to achieve the Paris Climate Goals [
2]. Governments around the world are aware of this need, and, consequently, new directives are emerging to promote the use of alternative energy sources. Among renewable energies, wind is the second most widely used followed by hydroelectric, due to its high efficiency [
3]. Moreover, some studies suggest that wind energy will be the main source of generation by 2050 [
1]. However, to meet this forecast, a number of engineering challenges related to wind turbines must be addressed.
Wind turbines (WT) present several challenges in the field of automatic control. In fact, from a control perspective, several objectives must be met simultaneously. While the main aim is to stabilize the power output around the nominal value, attempts should be made to reduce vibrations and ensure safety under all operating conditions. For this goal, different control actions are proposed, related to the pitch angle, the angular speed of the generator, and the orientation of the nacelle or yaw motion. The pitch control rotates the orientation of the blades to adjust the angle of attack of the wind. This is useful to stabilize the power around the rated value once the wind speed exceeds a certain threshold. On the other hand, the control of the angular speed of the generator aims to follow the optimal power curve when the wind is below this threshold. Finally, the yaw control changes the orientation of the nacelle to match the main direction of the wind stream.
Proper maneuvering for fulfilling these control tasks effectively and efficiently is not easy. The problem is even more serious in case of offshore wind farms, where gusty, stronger winds, the ocean waves, low temperatures, and other factors are affecting the operation of the turbine, additionally [
4].
This article addresses the problem of pith angle control. This is not a trivial task due to the high nonlinearity of the turbine behavior, with complex dynamics and a strong coupling between its internal variables. Furthermore, especially for floating offshore wind turbines (FOWT), the uncertainty of external loads makes the control even more difficult and may affect the vibration of the structure. Another problem that is not usually mentioned, but it is also important, is security. Indeed, security and safety are closely related concepts, as incorrect or malicious manipulation of the sensors or other embedded devices can damage the wind turbine. These challenges have led to the exploration of intelligent control techniques to provide solutions to this control problem.
As can be seen in the related works section, a promising path to explore for the WT control is the combination of different techniques. Hence, in this work, a novel hybrid pitch-control strategy that combines a lookup table (LUT) and a neural network (NN) is presented. This hybrid approach makes the control of the complex and nonlinear dynamics of the wind turbines very suitable for real-time control. The lookup table implements a mapping function that relates the wind speed with a pitch reference, while the neural network also calculates a complementary pitch reference by using the power error as input. The table and the neural network work in a synergic way and complement each other. The neural network is used to reduce the errors produced by imprecisions in the mapping function. On the other hand, the lookup table facilitates the learning of the neural network. It has also been proven that the neural network is robust enough to control the pitch angle even if the table is incorrectly designed.
The performance of the hybrid neurocontroller has been simulated and compared with the neural network control without the lookup table, with a PID regulator, and with the combination of the lookup table with the PID. The proposed hybrid control approach works better than the strategies it has been compared with and for the cases in which it has been proven in terms of output power error.
The structure of the rest of the paper is as follows: The related works are presented in
Section 2. The mathematical model of the small wind turbine we are working with is described in
Section 3.
Section 4 details the architecture of the proposed pitch neurocontroller. Simulation results are shown in
Section 5, where comparisons among different pitch-control strategies are presented and discussed. The paper ends with the conclusions and future works.
2. Related Works
Among other strategies, various intelligent techniques have been used with satisfactory results in the wind-energy field, such as fuzzy logic (FL), neural networks (NN), reinforcement learning (RL), and genetic algorithms (GA) [
5,
6,
7].
It is important to mention some of them in relation to wind-turbine control. In the paper by Rubio et al. [
8], a fuzzy-logic-based pitch-control system for a wind turbine installed on a semi-submersible platform is presented. It is applied to the WT model OC4 that represents a 5 MW wind turbine. The fuzzy controller has as input the instantaneous value of the wind speed, filtered and normalized according to the nominal speed, and it gives the pitch reference. The authors of [
9] designed a hierarchical fuzzy logic pitch controller to solve the nonlinear system effects produced by atypical winds. It is compared to a PID pitch-control system. From a different approach, fuzzy logic is applied to develop a rule-based turbine selection methodology in [
10]. The proposed methodology analyzes several scenarios in conjunction with the turbine selection model. In [
11], a robust H∞ observer-based fuzzy controller is designed to control the turbine using the estimated wind speed. A Takagi–Sugeno fuzzy model with nonlinear consequent parts is introduced for the variable speed and variable pitch wind turbine. Two artificial neural networks are used to accurately model the aerodynamic curves.
Asghar and Liu [
12] designed a neurofuzzy algorithm for optimal rotor speed of a wind turbine. It uses an adaptive neurofuzzy inference system for the online estimation of effective wind speed from instantaneous values of wind-turbine tip speed ratio, rotor speed, and mechanical power. The estimated value of effective wind speed is further utilized to design the optimal rotor speed estimator for maximum power point tracking of variable-speed wind turbine. In [
13], an artificial neural network-based reinforcement learning for WT yaw control is shown. The biggest challenge of the yaw control algorithm is to decide the moment and the quantity of the wind-turbine orientation variation. To do so, a novel algorithm based on the RL Q-Learning algorithm is introduced. It learns the best control action for each different state of the wind turbine with respect to the wind direction represented by the yaw angle. Then, a multilayer perceptron with artificial neural network is applied. It has been tested on an onshore wind turbine.
Neural networks in the field of wind turbines have been applied but mainly on fault diagnosis and condition monitoring, as information to train the network is needed. For example, Li proposes the use of deep small-world neural network on the basis of unsupervised learning to detect the early failures of wind turbines [
14]. In [
15], Takagi–Sugeno models and multilayer perceptron are used to describe the relationships between measurement and the fault signals. Fu uses deep learning to monitor the condition of the gearbox bearing [
16]. Cucarella presents the development of a low-power wind-turbine prototype to simulate faults usually encountered in high-power wind turbines and then apply intelligent techniques to diagnose different faults [
17].
Nevertheless, there are some works that use neural network for the modeling and/or control of the wind turbine. Demiderlen et al. combine artificial neural networks and optimization models to predict the parameters of wind turbines [
18]. In [
19], a neural controller based on a radial basis function neural networks is used for pitch control. The RBF network uses the error of the output power and its derivative as inputs, while the integral of the error feeds an unsupervised learning algorithm. A performance analysis of this neurocontrol strategy is carried out and compared with a PID regulator for the same small real onshore wind turbine.
In [
6], a variable pitch controller combining back-propagation neural network with PID is proposed. The BP neural network with self-learning and weighting coefficient correction capability is used to adjust the PID parameters online. An active disturbance rejection pitch controller of the wind turbines is designed based on the proposed BP-PID algorithm. Du and Wang [
20] propose a wind-turbine pitch controller based on BP neural network PI. The neural network optimizes the PI parameters. The two pitch-control strategies of PI with gain scheduling and BP neural network PI are compared. The authors of [
21] analyze the input and output data of wind farm based on deep neural networks, develop an intelligent model with an extreme learning machine, and predict some parameter of the wind turbine. Regarding the pitch control, in that paper, a radial basis function neutral network is used.
Reinforcement learning has also been an inspiration for the design of control strategies [
22,
23,
24,
25,
26,
27,
28]. A recent overview of deep reinforcement learning for power system applications can be found in Zhang et al. [
29]. In Fernandez-Gauna et al. [
7], RL is used for the control of variable speed wind turbines. Particularly, it adapts conventional variable speed WT controllers to changing wind conditions. As a further step, the same authors apply conditioned RL (CRL) to this complex control scenario with large state-action spaces to be explored [
30]. In Abouheaf et al. [
31], an online controller based on a policy iteration reinforcement learning paradigm along with an adaptive actor-critic technique is applied to the doubly fed induction-generator wind turbines. Sedighizadeh proposes an adaptive PID controller tuned by RL [
32]. An artificial neural network based on RL for WT yaw control to enhance the aerodynamic adaption capability of the wind turbine is presented in Saénz-Aguirre et al. [
13]. In a more recent paper, the same authors propose a performance enhancement of this wind-turbine neuro-RL yaw control [
33]. RL is also used in [
28], where the state estimator uses different reward strategies related to the energy deviation from the rated power to make the pitch control more efficient. In the paper by Chen et al. [
34], based on reinforcement learning and system state data, a robust wind-turbine controller that adopts adaptive dynamic programming is proposed. The ADP algorithm is a combination of temporal-difference algorithm and actor-critic structure, which can guarantee the rotor speed is stable around the rated value to indirectly adjust the wind energy utilization coefficient by changing the pitch angle in the area of high wind speed and achieve online learning in real time. Interestingly, in Lin et al., 2020, deep learning is applied to investigate the major driven force on the mooring line tension of a FOWT model [
35].
3. Mathematical Model of the Wind Turbine
In this work, a mathematical model of a small 7 kW wind turbine has been used. The equations which describe the effective wind speed, the electric current, and the power in the generator are summarized in (1–8). The development of these expressions is further explained in [
19,
36,
37].
A graphical schema of the model, that may help to understand the relationships between the mechanical and electrical parts and the variables is shown in
Figure 1.
where
is the armature inductance (H),
is a dimensionless constant of the generator,
is the magnetic flow coupling constant (V∙s/rad),
is the armature resistance (Ω), 𝑤 is the angular rotor speed (rad/s), and
is the armature current (A). The values of the coefficients
to
depend on the characteristics of the wind turbine,
is the rotational inertia (Kg·
),
is the radius or blade length (m),
is the air density (Kg/
),
is the wind speed (m/s),
is the effective wind speed in the rotor (m/s),
is the friction coefficient (N.m/rad/s),
is the pitch reference (rad), and
is the pitch angle (rad).
On the other hand, the resistance of the load is assumed to be purely resistive. Thus, the output power is defined by (9), where
is the output current of the generator and
) is the load.
The wind velocity, , is filtered to take into account the shape of the blades (2–3). This fact produces what we called the effective wind . The parameters of this filter are . On the other hand, the pitch actuator has been modeled as a second order system with parameters , as it is common in this type of actuators.
From these equations it can be seen that the controlled variable is the output power, , and the manipulated variable is the pitch reference, . The velocity of the generator and the current in the armature are the state variables.
4. Description of the Neurocontroller
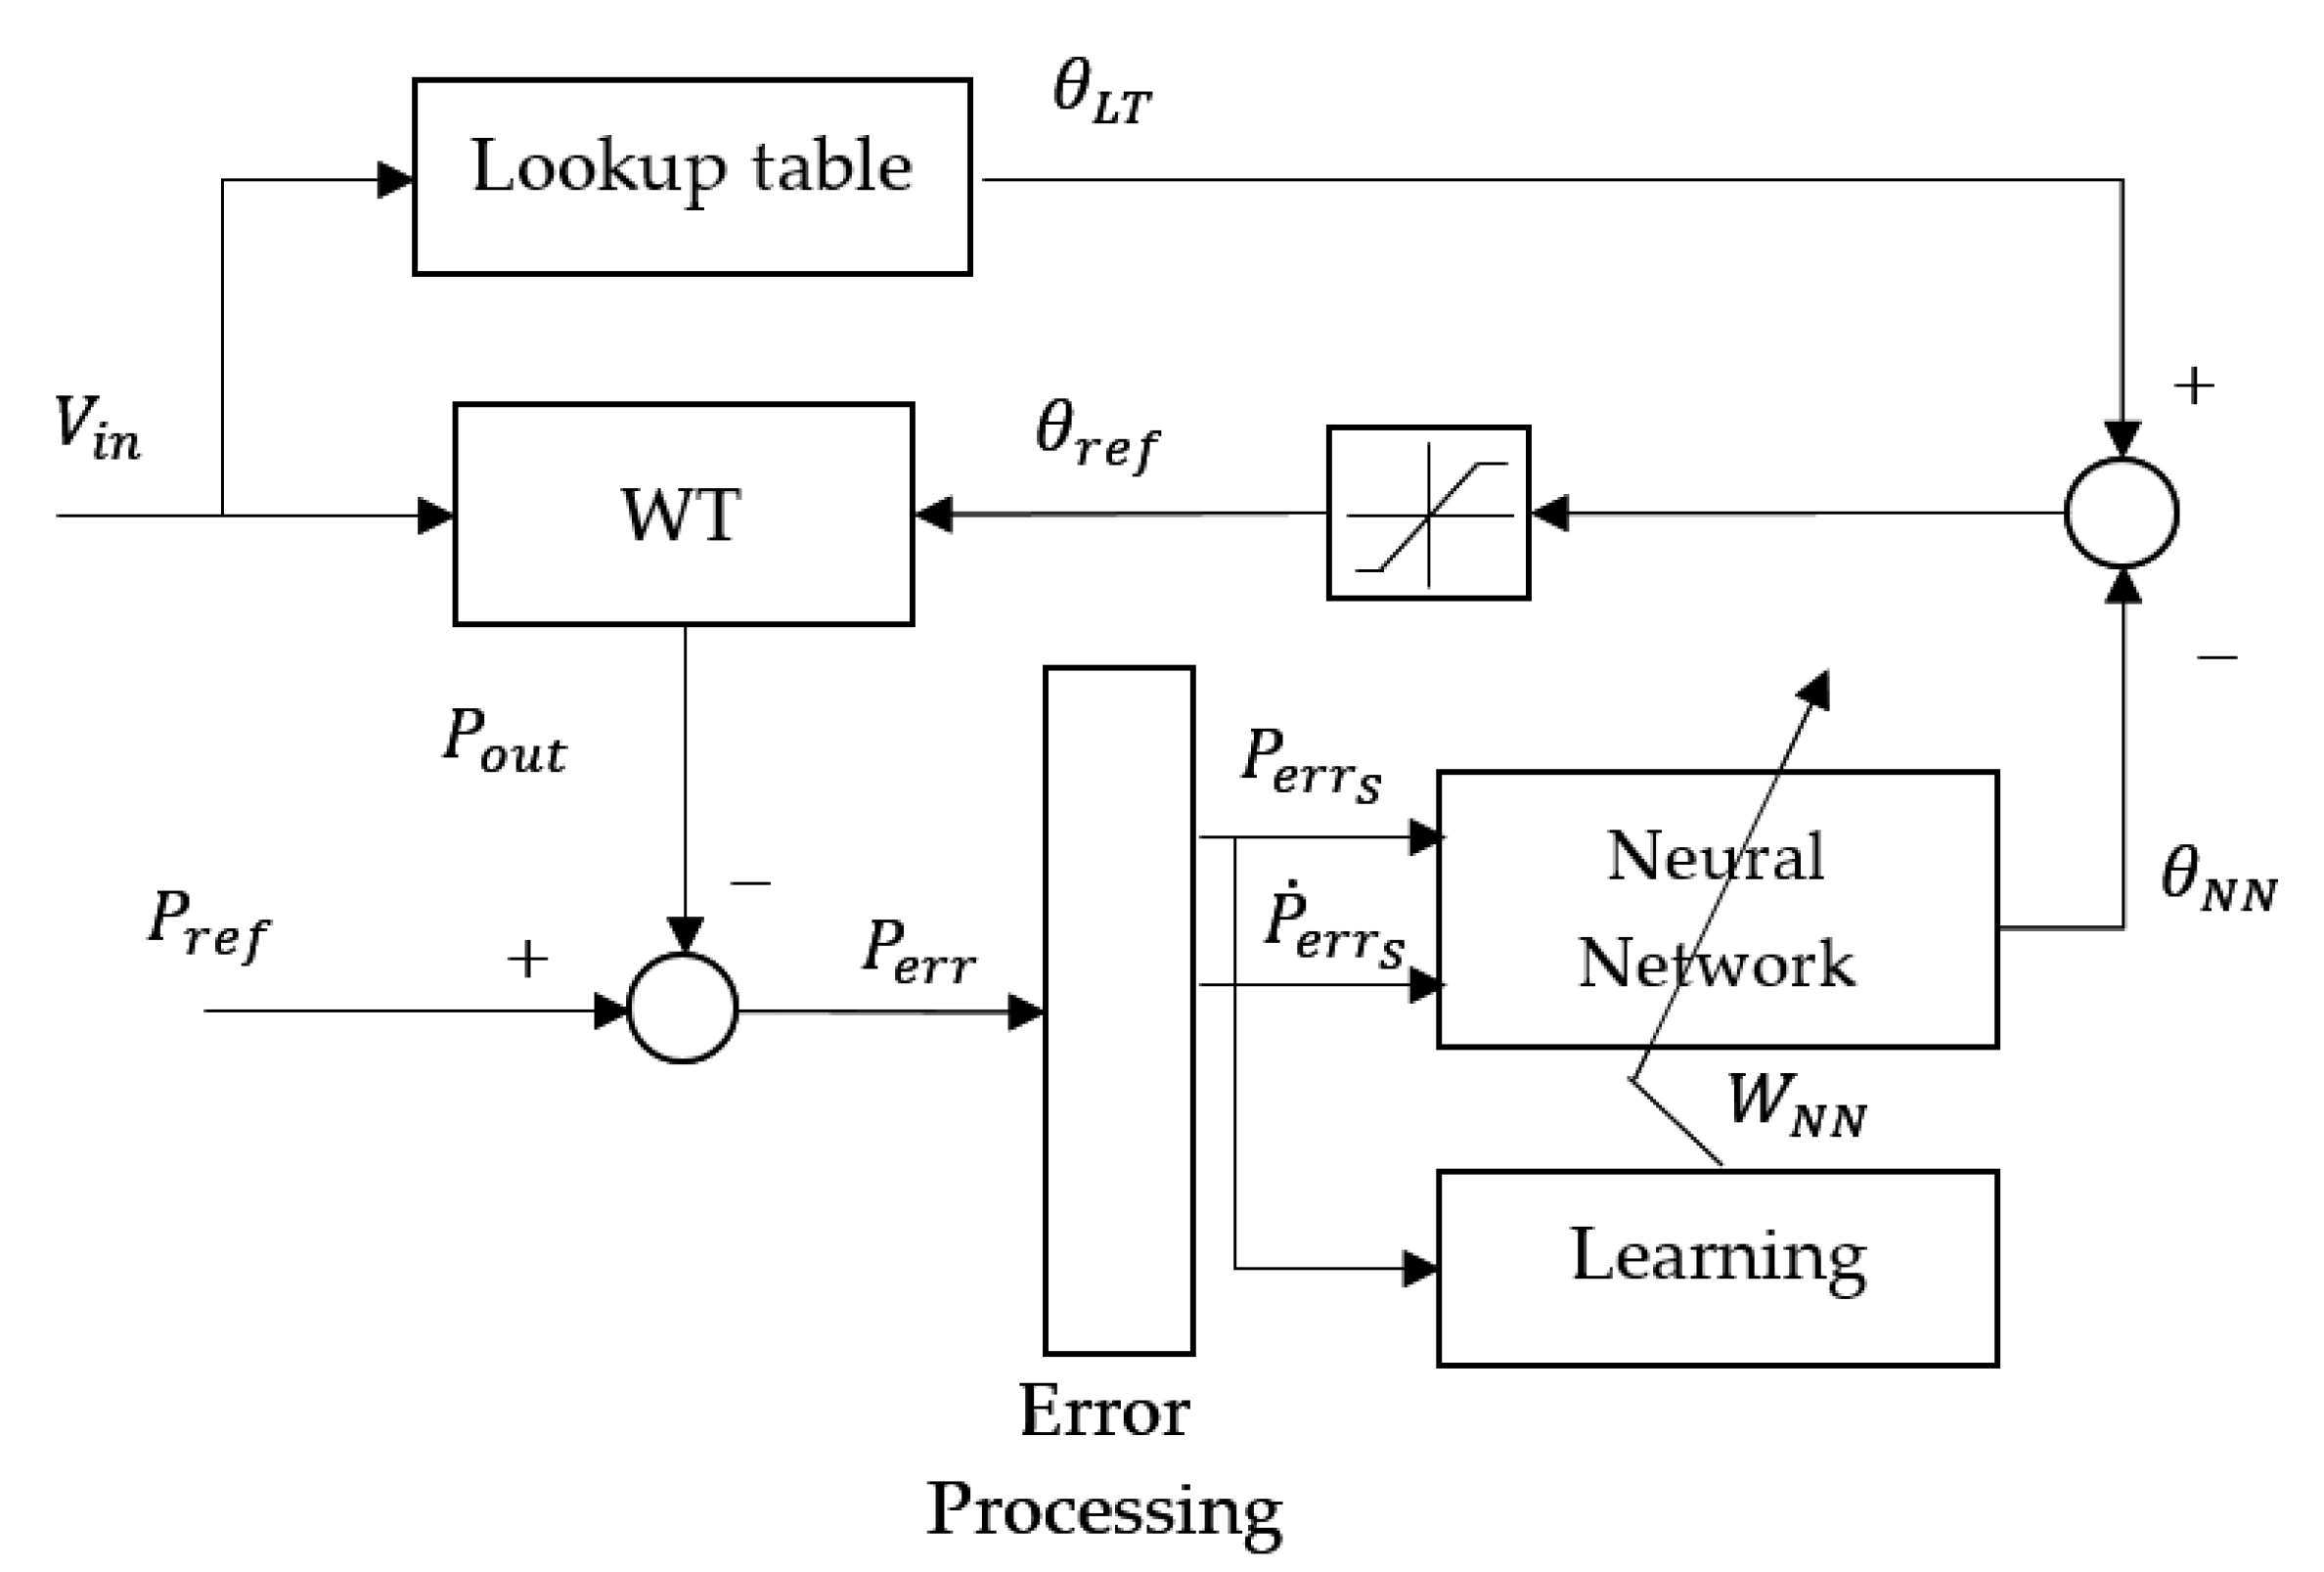
The aim of this control strategy is to stabilize the output power around its rated value using blade angle control. The architecture of the controller is shown in
Figure 2. The block WT represents the mathematical model of a real wind turbine. The control strategy consists of a lookup table (LUT), an RBF neural network (NN), a learning algorithm, and some nonlinear saturators.
As shown in
Figure 2, the lookup table (LUT) works in open loop; it receives the wind velocity and generates a reference for the pitch angle,
. As it may be expected, the larger the speed, the bigger the pitch angle, as the pitch control aims to stabilize the power. If the mapping function implemented by the LUT were perfect, the pitch reference given by the LUT would stabilize the output power around its nominal value. However, due to inaccuracies in the model, disturbances, etc., this is not the case. Thus, the role of the NN will be to adjust online the control law to reduce these imprecisions and undesirable effects.
The NN acts as a nonlinear controller, and hence, it works with the error of the controlled variable, the output power, and its derivative. It has as input the difference between the current output of the WT, and the nominal power, , that is, the power error, . The gains of this neurocontroller are adjusted by the learning algorithm when it updates the weights of the NN.
In this neurocontrol approach, the power error and its derivative t are considered. The derivative is used as input in order to capture the dynamics of the system. Therefore, the distance of the pair to the center of the neuron is the input of the exponential function of each RBF neuron. However, if this distance is large, the contribution of the neuron to the output is negligible; thus, the total output of the network is practically null, and the pitch reference would not vary with the power error. In order to limit this effect, the input space is bounded. Input values outside the limits are saturated to ensure a minimal contribution to the output value of the neural network.
The neural network obtains another pitch reference, . Both pitch references, from the lookup table and from the neural network, are combined to obtain the final pitch reference for the wind turbine. This reference is saturated to keep it within the range of the pitch signal, [0, pi/2] rad.
This controller is formally described by Equations (10)–(17).
where
is the current time,
is the mapping function of the lookup table. The neural network function is
, and
is the set of weights of the neural network;
denotes the function performed by the learning algorithm to update the NN weights; the values
, and
are parameters of the controller to adjust the range of the NN input; and MIN() and MAX() denote the minimum and maximum, respectively. Although any neural network can be used, NNs with regression capabilities such as radial basis (RBF-NN) or multilayer perceptron (MP-NN) provide better results. Depending on the type of NN used, the functions
and
are different.
Equation (12) applies the backward approximation of the derivative. In this case, it is the average variation rate of the power error within the previous control period, . That is, the difference between the error and at the start of the control period , so .
The implementation of the NN has been done with an RBF-NN. The number of hidden neurons has been set to 25. The number of neurons has been set by trial and error to obtain a good balance between performance and computational complexity. The centers of the neurons are equally distributed in the input space, as it is commonly assumed that the whole input space contributes the same to the output, if there is not any extra information to think otherwise. Therefore, the parameter is set in advance to the same value for all the neurons. The input space of the neural network is discretized applying a gridding in order to map it to the output space. The 2D Euclidean distance has been used.
The NN learns online based on the power output error, minimizing it. The weights of the NN are updated online by the learning algorithm described in [
19]. This algorithm receives the power error
and updates online the weights of the neural network using Equation (18).
where
μ is the learning rate, (
) represent the center of each neuron, and σ is the width of the neuron. An increment in the power error produces an increment in the weights, meaning that a smaller pitch reference is obtained, which leads to a larger power to compensate the power error.
In the experiments, the value of is 0.2, and is 0.001.
The lookup table and the NN are thought to complement each other (
Figure 2). This makes the learning converges even if the mapping function of the LUT is not well defined. That is, the neural networks are able to obtain the correct the value of the pitch reference with a lookup table poorly designed. Only an increasing relationship between wind speed and pitch angle is enough to define it. Indeed, different lookup tables have been tested with similar results.
On the other hand, the LUT improves the results provided by the NN in the following way: the output space of the NN is , but the input range of the WT pitch angle is [0, pi/2]. Hence, a bias is applied to match those ranges.
When the NN is applied without the lookup table LUT, its output is
, and the bias is
, i.e., exactly half the input range of the WT. This formula works well when the wind speed is around half the range of the pitch operation.
However, when the NN is combined with the LUT, the bias is obtained by the output of the LUT (20) and then adjusted using the wind speed in real time. This provides better results than applying a fixed bias in this case.
The sensitivity of the aerodynamic power to the pitch angle varies in the high-wind-speed region; therefore, gain scheduling would be required to improve the performance of a PID control system. However, in our approach the role of the gains of the PID is played by the weights of the neural network. These weights are online updated by the learning algorithms (17–18) to fit the proper control law.
5. Comparison with Other Control Strategies and Analysis of the Simulation Results
Several simulation experiments have been carried out to test the validity of this hybrid control approach, using Matlab/Simulink software. The duration of the simulations is 250 s. In order to reduce the discretization error, a variable step has been used. The maximum step size has been set to 10 ms, and the control period Tc is 100 ms.
The performance of the proposed control strategy has been compared with several alternatives: namely, a PID, the lookup table combined with the PID, and the application of the neural network without a lookup table. These control solutions can be described by Equations (21)–(23), respectively.
where
is the output of the PID controller,
is the output of the controller which combines the lookup table and the PID,
is the output of the RBF without the lookup table, and
is the output of the hybrid controller.
The PID gains, [ ] have been determined by trial and error and set to the values .
The performance of the control strategies has been evaluated by the MSE, mean and Std metrics, calculated by Equations (24)–(26), respectively.
The controller has been tested with different wind velocity profiles: a random profile, a sinusoidal one, a square profile, and a sawtooth one. The random wind speed is a white Gaussian noise signal with a minimum value of 12.25 m/s and a maximum value of 13 m/s. The sinusoidal wind has a mean value of 12.625 m/s, an amplitude of 0.375 m/s, and a time period of 50 s. The square wind profile has a minimum value of 12.25 m/s, a maximum value of 13 m/s, and a time period of 50 s. Finally, the sawtooth-shaped wind has the same minimum, maximum, and time period values.
The values of the parameters used in the WT model are shown in
Table 1. They have been extracted from [
36] for a 7 kW wind turbine.
5.1. Performance Evaluation of Different Pitch-Control Approaches
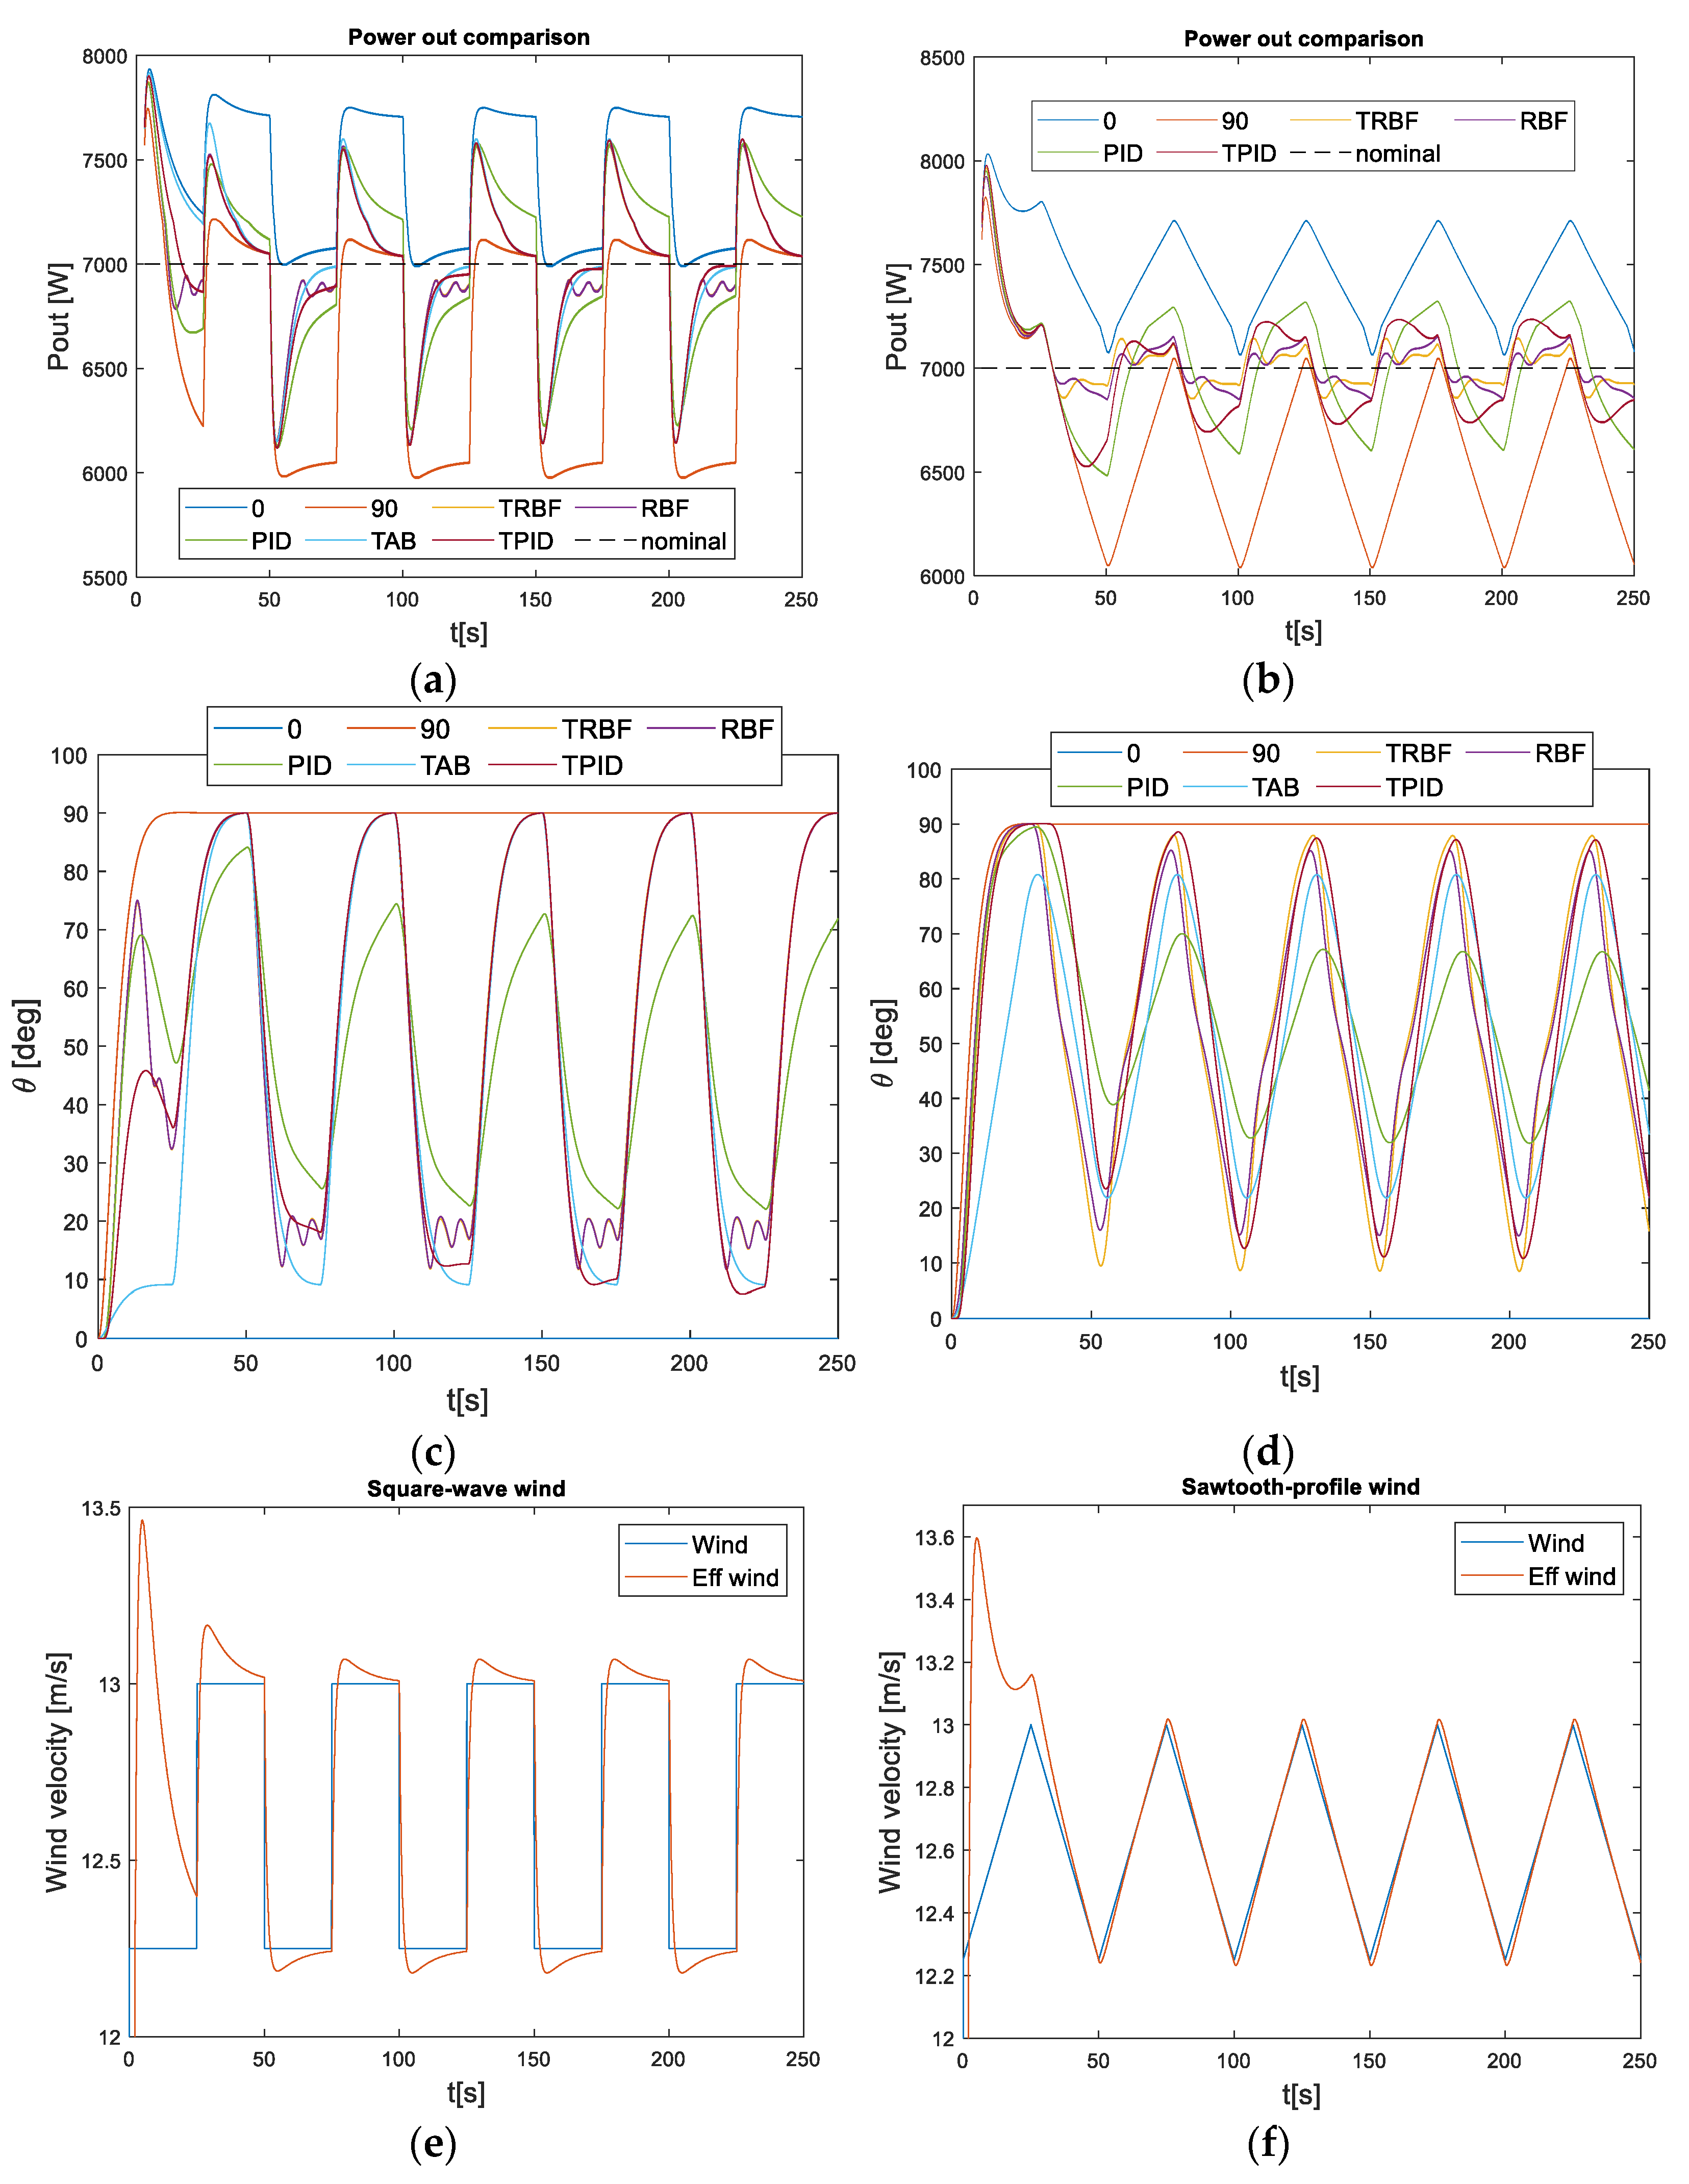
The four mentioned WT pitch-control approaches have been applied. In
Figure 3, the output power, the pitch angle, and the wind profile are shown with random wind (
Figure 3a,c,e) and sinusoidal wind (
Figure 3b,d,f), with the parameters detailed above. The blue line represents the output obtained when the pitch reference is set to 0°, meaning the transferred mechanical power is maximum; the red line represents feather position of the blades, i.e., the pitch angle is 90° and thus, minimum power transference. For this reason, these lines are the boundaries of the output power signal in all the figures. The yellow line represents the results obtained when the lookup table is combined with the RBF-NN, named TRBF; the purple one shows the output of the RBF-NN without the lookup table. When the lookup table is combined with the PID, the TPID signal is red, and the green line represents the PID output. Finally, the black dashed line is the rated output power. All the results have been captured at iteration 10. In the wind profiles (
Figure 3e,f), the blue line represents the input wind speed,
in (3); and the red line shows the effective wind speed,
in (3).
When the wind is random all the close-loop strategies stabilize the power around the nominal power. However, it is noticeable how the settling time is much smaller when the hybrid TRBF or only the RBF network are applied. In addition, the MSE (
Table 2) is also smaller for these techniques. Moreover, the TRBF produces smaller overshoot. In the case of sinusoidal wind,
Figure 3b, again TRBF gives the best results followed by RBF. The performance of the PID and TPID control strategies is much worse than the other two. The biggest difference is the amplitude of the oscillations, which is almost 300 W for the PID and only 100 W for TRBF and RBF.
As expected, when the wind profile is random, the pitch angle is slightly noisier if the lookup table is used (TAB, TPID, and TRBF control configurations). This may be due to the fact that the wind, which is the input to the table, introduces noise. The strategies that do not depend directly on the wind to obtain the pitch reference (0°, 90°, RBF, and PID) are less sensitive to noisy wind. Indeed, it is possible to see that the noisiest pitch angle occurs with the TAB control configuration, as neither the RBF network nor the PID regulator which smooths the pitch reference is applied. On the other hand, the sinusoidal shape is observable in the pitch angle when the wind has this sinusoidal profile.
Independent of the wind profile, the effective wind shows a peak around t = 10 s. This explains the initial peak in the output power which appears in
Figure 3a,b.
Figure 4 shows the output power, the pitch angle, and the wind profile when different control strategies are applied for a square-wave (
Figure 4a,c,e) and sawtooth wind profiles (
Figure 4b,d,f). The color code is the same as in
Figure 3. The square and sawtooth shapes are clearly shown in the boundaries of the red and blue lines. In both cases, the PID presents the worst results. The combination of the PID with the lookup table improves its performance. In particular, the control response is much faster than the square-wind profile changes. In this case, however, the performance of the TRBF and RBF control strategies is good but not much better than the TPID one. This may be explained by the fact that RBF usually does not give good results with input signals that present large discontinuities, as is the case of the square-wave wind profile.
Nevertheless, TRBF and RBF control configurations give a good response with a sawtooth wind profile. As in the case of sinusoidal wind, the amplitude of the oscillations is much smaller, and thus, the MSE is as well (
Table 2). The difference between the amplitude of the oscillation with the PID in relation to TRBF and RBF responses is over 200 W. Unlike with the square wind, in this case, the performance of the TPID control is clearly poorer than the TRBF and RBF control strategies.
Again, in these figures the shape of the wind can be observed in the pitch angle but smoother due to the dynamics of the pitch actuator. This fact is more significant when the lookup table is used. In general, it is possible to observe how the lookup table enlarges the effective range of the pitch angle.
In addition to the graphical results shown in
Figure 3 and
Figure 4, numerical results have been obtained to compare the performance of the controllers.
Table 2,
Table 3 and
Table 4 show the results of the different metrics evaluated, MSE, Std, and mean. The wind profiles are the same as in the previous experiments. The different control strategies are shown in the columns: TRBF is the combination of RBF-NN and the lookup table; RBF is just the NN without lookup table; TPID is the combination of the PID regulator and the lookup table; PID represents the PID control without the lookup table, and TAB denotes the lookup table without any other controller. The best results have been boldfaced. The row “Mean” shows the average value of the four above rows.
It is possible to observe that the best MSE and Std results are generally obtained with the TRBF control strategy when the wind has a sawtooth-wave profile. This may be due to the singularities of the wind profile. Curiously, the TPID control configuration gives the best results for low-velocity random winds. The worst results are given by the PID controller, followed by the lookup table control strategy. The combination of PID and lookup table generally improves the results with respect to the application of only the PID. On the other hand, the application of the RBF network gives better results than TAB, PID, and TPID controls.
As expected, Std values are similar to MSE (see Equations (22) and (24)). In fact, when the mean is equal to the output power reference, both are the same. However, the Std metric focuses on the measurement of the variation no matter the value of the output power reference.
As it may be seen in
Table 4, the best mean values are obtained with the PID and TPID control strategies. It may be explained as, in general, when PID control is applied the difference between the low values and the power reference is smaller than the difference between the high values and the reference. This negative trend tends to compensate the peak that appears the first 20 s in
Figure 3 and
Figure 4.
5.2. Evaluation of the Learning Strategy
In this section, the learning of the control strategies based on neural networks, i.e., TRBF and RBF, is evaluated. Several simulation experiments with different wind profiles have been carried out. Unlike in previous experiments, where the data are collected at iteration 10, here the evolution of the MSE with the number of iterations is also presented.
Figure 5 shows the MSE evolution with random (
Figure 5a) and sinusoidal (
Figure 5b) wind profiles. The blue lines represent the results when the RBF-NN is applied without the lookup table and the red ones when the neural network is combined with the lookup table, TRBF. The MSE with the TRBF configuration is always smaller than with only the RBF neural control.
The improvement is not constant but has a growing trend with the random wind. This indicates that the MSE continues decreasing after iteration 10, meanwhile the curve of RBF gets flat. However, in the case of sinusoidal wind, there is a clear decreasing trend in the learning rate for both curves. Even so, the error of hybrid TRBF control is always smaller than the neural network error. The difference between these curves decreases during the first iterations, but then it is stabilized and maintains a constant value.
Figure 6 shows the MSE evolution with a square-wave (
Figure 6a) and a sawtooth (
Figure 6b) wind profiles. The color code is the same as in
Figure 5. In the case of the square wave, the learning is faster with the hybrid TRBF control scheme, and the MSE is always smaller than with only the RBF network. However, for the sawtooth wind profile, the results of
Table 2 are confirmed, i.e., RBF control is better, although this difference is reduced over time.
5.3. Influence of the Values of the Lookup Table
The sensitivity to changes of the lookup table values is here analyzed. As explained before, the lookup table implements a mapping function
of the wind speed
(m/s) into the pitch reference angle
(rad).
Figure 7 shows different mapping functions that have been evaluated. The blue line is a straight line between the points (12.15, 0) and (13.1, pi/2) of both coordinates, wind speed, and pitch angle (Rect). The red one is a third-order polynomial with derivative value zero at points (12.15, 0) and (13.1, pi/2), (3Ord). The yellow line is a curve obtained by trial and error to test a different configuration (def). Finally, the purple line represents a curve that has been intentionally wrongly obtained, where, contrary to expected, larger wind velocities produce smaller pitch references (
bad).
For this wind turbine, with the parameters defined in
Table 1, the minimum wind velocity that provides an output power above 7 kW, when the pitch is permanently set to 0°, is 12.15 m/s. On the other hand, the maximum wind velocity which provides an output power below 7 kW, when the pitch is permanently set to 90°, is 13.1 m/s. For this reason, the boundaries of the mapping function are (v = 12.15, pitch = 0°) and (v = 13.1, pitch = 90°).
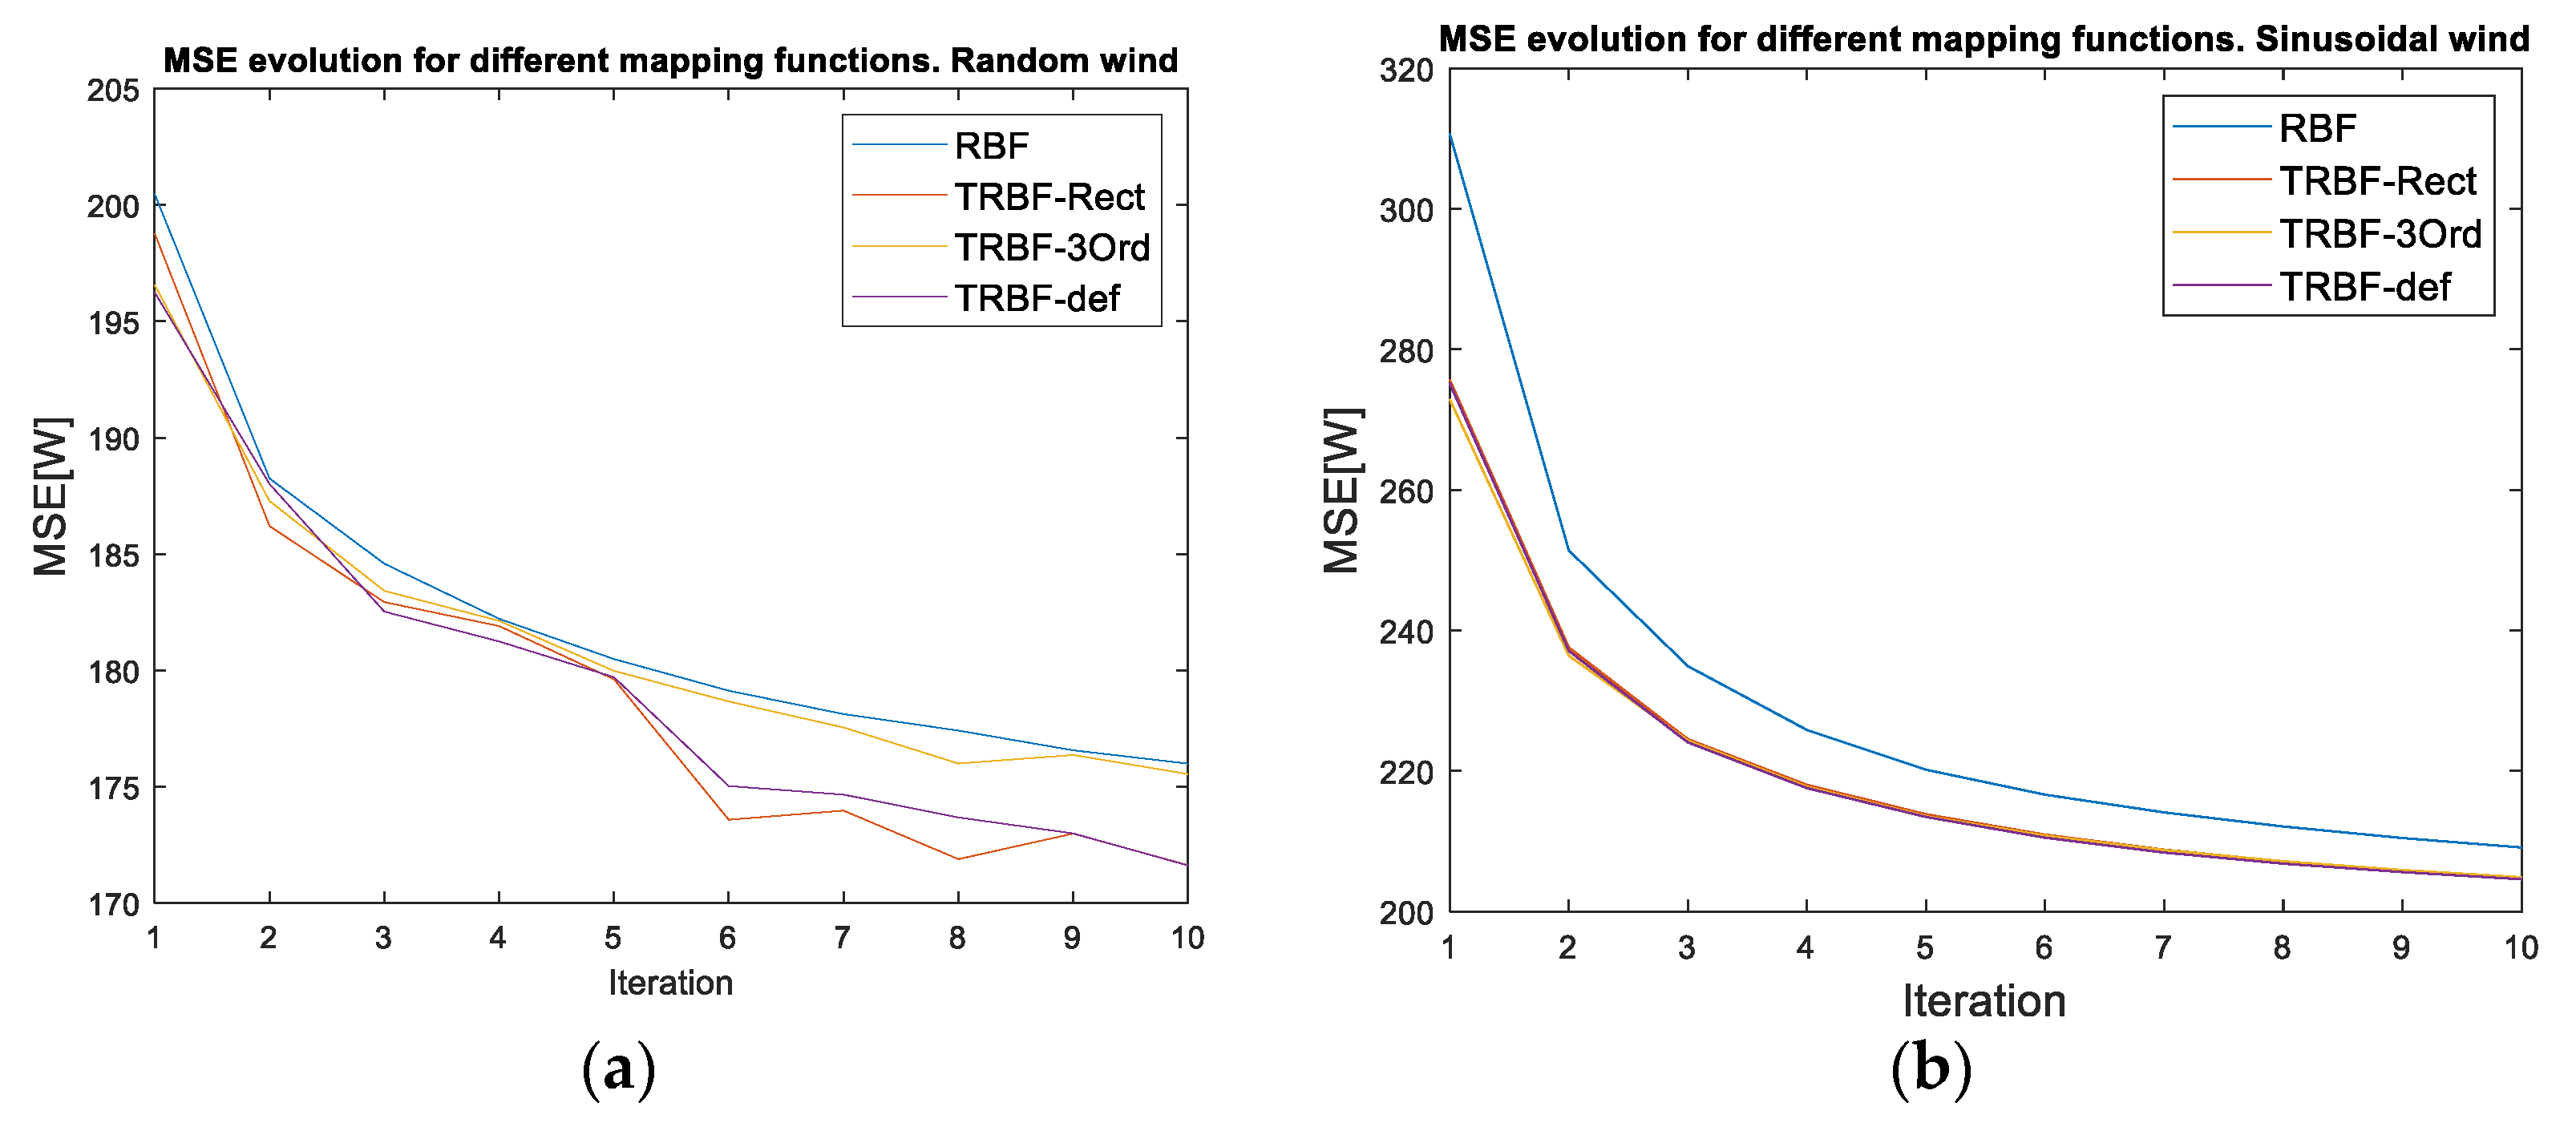
In the first experiments, the three curves “Rect”, “3Ord”, and “def”, have been considered.
Figure 8 shows the evolution of the MSE with random (a) and sinusoidal (b) wind profiles. The blue lines represent the results of the RBF neurocontrol; the results of the MSE of hybrid TRBF with “Rect” curve (red), “3Ord” (yellow), and the curve defined by trial and error “def” (purple) are also represented. As it may be observed, the results are similar no matter the curve applied. That is, the hybrid control strategy is robust to uncertainties in the table design. The only exception is the third-order curve for the random wind. In this case, the MSE of the hybrid TRBF configuration is close to the MSE of the RBF network, and the lookup table does not improve the response significantly. Although the results are similar, a careful look at the figures shows how, as expected, the “def” curve produces the best performance.
Figure 9 shows the MSE evolution with a square-wave (
Figure 9a) and a sawtooth (
Figure 9b) wind profile. The color code is the same as in
Figure 8. Again, all curves provide similar results, although the worst performance is obtained with the “3Ord” curve and the best with the “def” curve, except for iterations 3, 4, and 6 with square-wave wind, where the “Rect” performance is better.
Finally, the robustness of the hybrid control approach against errors in the lookup table is tested. A curve with a wrong relation between wind speed and pitch reference is used (
Figure 7, purple line). The results are shown in
Figure 10 for random (
Figure 10a) and sinusoidal (
Figure 10b) winds. The blue lines represent the RBF network control results and the red ones the hybrid TRBF control strategy. As expected, the performance of the TRBF approach is worse as the neural network has to counteract the incorrect pith reference,
. However, it is remarkable how, still, the NN is robust enough to handle the wrong lookup table and, moreover, the learning convergence is good even in this complex situation.
6. Conclusions and Future Works
The use of wind as a renewable energy resource grows year after year due to the development and technological maturity of wind turbines (WT). In fact, they are essential to ensure the sustainability of the worldwide energy grid. However, there are many engineering challenges related to WT that must be addressed to improve their efficiency.
A synergy of techniques has been successfully used to model and control complex systems. In this work, a new hybrid strategy is proposed to control the pitch of a small wind turbine. The approach combines a neural network and a lookup table. The lookup table and the RBF-NN complement each other. On the one hand, the NN learns to compensate for errors produced by inaccuracies or erroneous values in the lookup table. On the other hand, the lookup table facilitates the learning of the neural network. In this way, the hybrid control strategy provides better results than the techniques applied individually, as shown by simulation results.
The hybrid control proposal has been validated on a model of a 7 kW turbine. Its performance has been compared to an RBF-NN control without a lookup table, with a PID controller, and with the combination of the PID and the lookup table. In all cases, the new control solution provides better results for different wind profiles.
The learning strategy has been analyzed. Moreover, the hybrid control strategy has been shown to be robust against lookup table failures. In fact, the NN is capable of controlling the pitch even if the lookup table is intentionally incorrectly designed. A lookup table has been used where the relationship between the wind speed and the pitch reference is the opposite of expected; that is, higher wind speeds produce lower pitch references. Even in this case, the proven control strategies have been successful.
As future work lines, it is planned to apply these control strategies to a larger turbine, scaling the model, to prove that it is possible to generalize these pitch-control solutions to any turbine. Furthermore, the methodology here proposed might be applied to working wind farms, both offshore and terrestrial, and compare the results. It would also be desirable to test this approach on a real turbine or on a prototype.


