Article

Comparative Analysis of Regional Competitiveness in Poland from 2010–2019 in the Context of the Concept of Sustainable Development

by
Katarzyna Chrobocińska
Department of Economy Competitiveness, Faculty of Economics, University of Warmia and Mazury in Olsztyn, ul. M. Oczapowskiego 2, 10-719 Olsztyn, Poland
Sustainability 2021, 13(6), 3202; https://doi.org/10.3390/su13063202
Submission received: 14 January 2021 / Revised: 8 March 2021 / Accepted: 9 March 2021 / Published: 15 March 2021

Abstract

:
The stimulation of regional competitiveness is a difficult and complex process that leads to the achievement of a competitive position against other regions covered in the comparison. The study includes a comparative analysis taking into account the Regional Competitiveness Index (RCI) level of voivodeships in Poland in 2010–2019 and, as a supplement, a Multi-Dimensional Comparative Analysis and cluster analysis. This made it possible to select a group of voivodeships characterized by a stable and relatively highly competitive position compared to the rest (voivodeships: Mazowieckie, Śląskie, Wielkopolskie, and Dolnośląskie). The apparent spatial disparity in the competitiveness of Polish voivodeships may be a result of long-term socioeconomic processes (such as sparse urbanization and industrialization), the polarized growth of competition leaders and the adverse effects of such polarization, i.e., the draining of competitive potential (such as qualified staff) from neighboring voivodeships.

1. Introduction

The concept of sustainable development was formulated in 1992 at the UN conference, after which it was adapted in many countries [1,2]. In Poland, since 1995 it has been listed in the most important strategy papers of the Polish State, where it is defined as “sustainable socio-economic development, in which the process of integrating political, economic and social activities, while maintaining the natural balance and sustainability of fundamental natural processes, in order to guarantee the ability to meet the basic needs of individual communities or citizens of both the modern generation and future generations” [3]. The concept of sustainable development can be reflected in a strategy that promotes sustainable socioeconomic development in the competitiveness of the state or at regional level. The implementation of the concept of sustainable development at the local level is conditioned by positive qualitative and quantitative changes, taking into account respect for environmental values and the principles of social equality [4,5,6,7]. Therefore, sustainable development is an economic and social category, and competitiveness in this context can be seen as the ability to offer businesses and residents an attractive and sustainable environment for living and working. The term balanced is not equated with ecology or environment, but rather with pragmatic action that takes into account the well-being of future generations [8,9,10,11,12,13,14,15].
Competitiveness continues to present a topical and complex problem. As such, it has inspired much discussion regarding its essence and context [16]. The ongoing discussion in the source literature has favored the view that “we lack a consensus on the definition of this phenomenon … and no definition has gained universal approval,” Łukiewska, [17]. Consequently, there is a deficit of information and a need for benchmark solutions to present particular value for the entities that struggle in the competitive arena. In addition, the multifaceted nature of competitiveness compounded with fuzzy definitions and interpretations may impair the measurements and evaluations of the phenomenon at the regional level and beyond [18].
Competitiveness may be considered on six levels: “micro-micro” (products and goods), “micro” (enterprises), “meso” (sectors, industries, and branches of the economy, or regions), “macro” (states), “mega” (groups of states) [19,20,21,22,23]. At the macroeconomic level, it may be defined as “the overall economic performance of a nation measured in terms of its ability to provide its citizens with growing living standards on a sustainable basis and broad access to jobs for those willing to work and the ability to export goods and services in order to afford imports and, hence, it will be summarised by world market shares” [24].
The observation of various dimensions of competitiveness will reveal their relations. Łukiewska [17] was correct to observe that a “country’s competitiveness reflects the outcomes achieved at the lower levels of aggregation, although we cannot regard the upper level as a simple sum of its parts.” Regional competitiveness hinges on particular industries which, in turn, rely on the competitiveness of individual entities. Competitiveness comprises all the elements of the aggregated model, with a consideration of the interactions between various levels of competitiveness, the products of their concerted impact and the inter- and intra-sectoral relations [25,26,27,28,29,30].
The origins of investigations into competitiveness at the regional level may be traced back to regional studies in the scope of socioeconomic analyses considering the dimension of spatiality. Regional studies encompass a broad range of subjects, including factors of economic and regional growth, economic stability at the regional level, regional convergence and divergence, regional and national determinants of the industrial location, the diversity of the regional economy and the impact of the regional situation on the number of local companies [31]. Some researchers [32,33] have claimed that broadly understood competitiveness is equated to regional development and its stimulation. Consequently, competitiveness factors are tantamount to regional development factors and vice versa [34].
Competitiveness at the meso level is also defined as the ability of the local or regional level to generate high and growing incomes and growing means of support for its inhabitants [35,36]. According to Kruk [37], the competitiveness of units such as voivodeships refers to the use of existing resources (factors) that allows current and future inhabitants to reach and maintain a high standard of living and ensures sustained growth of the region. The European Commission declares that regional competitiveness is the ability to produce goods and services that prove their worth at international markets while maintaining a high and stable level of income [38]. In turn, Winiarski [39] asserted that meso-competitiveness refers to the region’s adaptability in the changing conditions of the environment, focused on the maintenance and/or enhancement of its position among the competing regions.
Source literature offers multiple concepts of competitiveness, which present the mechanism of this phenomenon and the determinants affecting success in the competitive process. Studies on regional competitiveness describe the following models: the decomposition model [40,41,42], the pyramid model [43,44,45], the European Competitiveness Index (ECI) [11], the competitiveness hat, competitiveness factors of the World Economic Forum (WEF), International Management Development Institute (IMD), the World Bank, the assessments of competitive ability of Bieńkowski and the National Competitiveness Council of Ireland [15,46,47,48,49,50]. Some models, such as the Porter’s Diamond, frame a competitiveness assessment on the microeconomic scale [51,52]. The mechanism of competitiveness is also described in terms of quality leadership or cost leadership [16,53]. Other concepts focus on the role of strategic resources (which create added value for the enterprise) and critical resources (those that are unique and add to the strategic potential), which can be helpful in gaining a long-term competitive edge [54]. Some concepts accentuate the role of tangible and intangible resources (such as human capital, market reputation, customer loyalty, innovation) for the competitiveness of a unit in a long-term perspective [55], other concepts place emphasis on key competencies [56].
The achievement of competitive advantage at the regional level is a complex, time-consuming process that escapes simple measurement. Czudec [57] aptly pointed out that “there are no stable and unequivocal measures for presenting the optimal level of competitiveness,” which may partially account for the fact that the published research on voivodeship competitiveness or the diversity of socioeconomic development has used such methods as the Technique for Order of Preference by Similarity to Ideal Solution (TOPSIS) procedure [34,58,59,60,61], linear ordering [62] and zero unitarization [63], cluster analysis [64].
The competitiveness of an enterprise reflects how well it can exploit the potential of an individual—including the resources, skills and abilities that may give an edge over the competition [65]. The competitive advantage of businesses affects regional competitiveness, which is subject to the influence of endogenic factors and the macroeconomic environment, including economic policy and the international situation [32,66].
Regional competitiveness may be perceived through the lens of the advantage of one region over the others, achieved by means of material resources and intellectual potential. Competitiveness also refers to a region’s ability to generate high and growing incomes and growing means of support for its inhabitants [36,67,68,69]. Czudec [63] was right to observe that “nowadays, regional competition is growing more and more sophisticated. The victories go to the regions which put their money on new governance methods and successfully unlock their hidden potential.” The achievement of market advantage hinges on the optimal use of resources and carries a risk related to the time difference between the design and the development phase of the competitive process. However, success compensates for all the earlier privations and sufferings. Eventually, the region becomes more appealing and competitive than others, which heightens the interest of potential stakeholders. Their attention may be the key to the socioeconomic growth of the region and an enhancement of life quality.
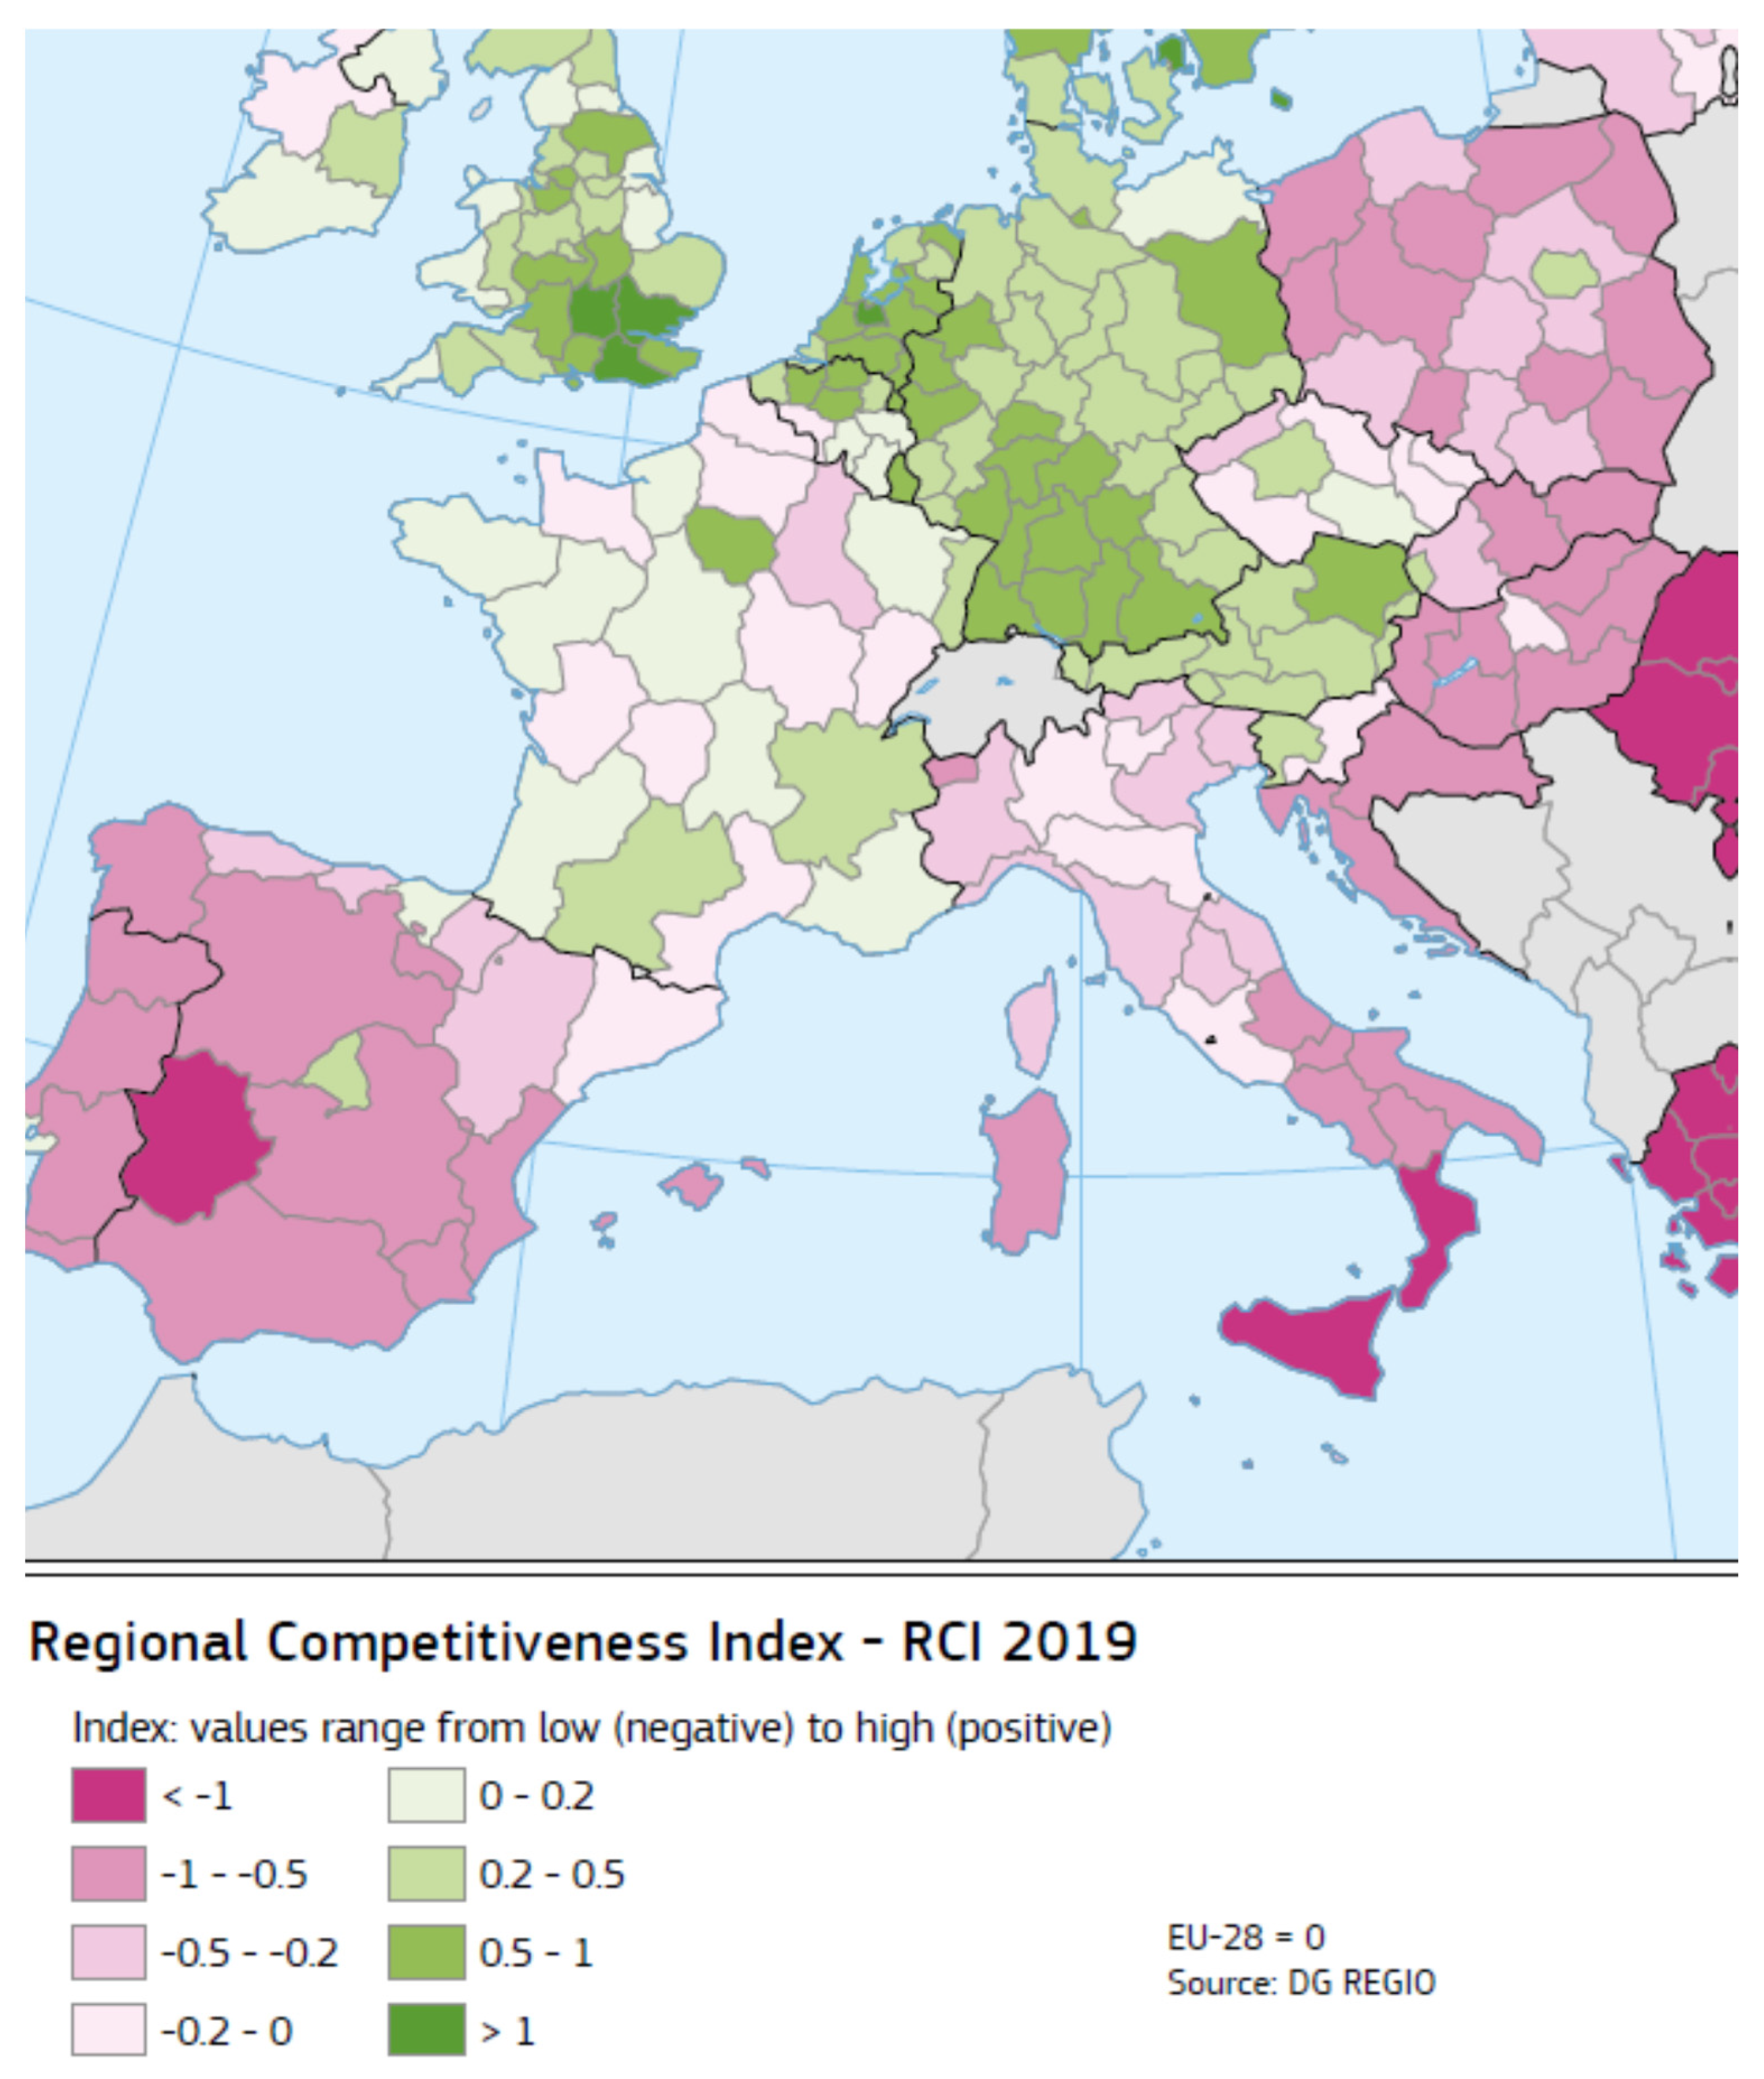
Regional competitiveness is one of the pillars of the European Union’s (EU) regional policy. It is systematically monitored, and for this purpose, surveys using the Regional Competitiveness Index (RCI) are regularly conducted. The design of the RCI was inspired by the Global Competitiveness Index of the World Economic Forum [70]. The Regional Competitiveness Index has been published since 2010 and is based on NUTS 2 statistics (The NUTS classification was formally introduced in Poland in 2005, upon the entry into force of the Regulation of the Euro-pean Parliament and of the Council amending the regulation on establishing a common classification of territorial units for statistical purposes. In accordance with the agreements adopted between Eurostat and the Central Statistical Office, this clas-sification has been used since Poland’s accession to the Euro-pean Union in 2004. The introduced classification corre-sponded to the three regional levels of the Nomenclature of Territorial Units for Statistics (NTS) in force in the country. At that time, 6 units of the non-administrative NUTS 1 level (re-gions), 16 administrative units of the NUTS 2 level (voivod-ships) and 45 units of the non-administrative NUTS 3 level (subregions) were introduced.). It measures the region’s ability to create an attractive and sustainable living and working environment with more than 70 comparable indicators. Its structure includes various aspects of competitiveness, divided into three groups: basic (including institutions, macroeconomic stability, infrastructure), efficiency (including higher education, labor market efficiency) and innovative (including technological readiness, the state of development of enterprises and innovation). RCI is an instrument that allows, among other things, decision makers to confront and compare the obtained effects of regional management with other units or to shape future policy and support structural reforms. The results of the regional competitiveness reports of 2013, 2016 and 2019 show “a polycentric pattern in which strong capital and metropolitan centres are the main drivers of regional competitiveness” [70]. Figure 1 shows the distribution of the Regional Competitiveness Index, which shows the multiplier effect visible in northwestern Europe.
When analyzing the RCI distribution, a high level of RCI differentiation can be stated, with the capital regions being more competitive. In the case of Eastern Europe, in 2010–2019, a stable low level of competitiveness was observed [70]. RCI is a tool enabling the monitoring of competitiveness at the mesoeconomic level, helping in the creation of Poland’s regional policy, e.g., at the level of voivodeships. RCI allows us to compare the competitiveness of regions in the European Union (EU), but also in any given country. According to reports presenting RCI in EU countries in 2010–2019 [11,71,72,73,74], there were large disproportions in socioeconomic development between Western European countries (e.g., Germany or Sweden) and Eastern European countries (e.g., Poland, Bulgaria). It was also visible between individual provinces in Poland and, for example, federations in Germany. The RCI analysis also allows us to notice the differences in the levels of competitiveness between voivodeships in Poland, although Regional Policy Commissioner Corina Cretu [70] in her speech in 2017 stated that “… The Regional Competitiveness Index is an excellent tool for shaping future policy. The Commission is using them to support structural reforms and increase the innovation capacity of EU regions through cohesion policy investments. Each region is different, therefore the Commission’s support is tailored to meet individual needs. We want the regions to strengthen their position and make full use of their assets, in line with the smart specialization strategy of the regions”.
Figure 1. Regional Competitiveness Index (RCI) in Europe in 2019 [74] (https://cohesiondata.ec.europa.eu/stories/s/Regional-Competitiveness-Index-2019/363v-4uq6/; accessed on 13 January 2021).
Sustainability 13 03202 g001
The EU support is important for both local communities and local government units, which are the biggest stakeholders of investment or modernization projects implemented to improve the conditions and quality of life. The assumptions of the EU regional policy are reflected in the strategies and projects already implemented by local government units, where the optimal allocation of funds may contribute to an increase in competitiveness at the commune level. The cyclical nature of RCI publications is necessary and helpful in managing local government units, however, there is a small information gap between the editions. There is also a certain lack of information at the lower organizational level of local government units, e.g., municipalities. Moreover, the RCI formula, which covers over 74 indicators, allows for an objective and comprehensive presentation of competitiveness at the regional level. Efforts to improve the formula are also visible, but in the context of sustainability, it may be worth considering including some ecological aspects in the RCI formula that will ensure the well-being of future generations. Monitoring the competitiveness at the commune level, thanks to information from the reports containing the RCI list as well as the search for universal and objective instruments supporting the decision-making process, may contribute to filling the gap in this respect and to success at the commune level. Probably the creation of benchmarks based on the cases of communes characterized by a high level of competitiveness would allow for the creation of an effective strategy for less competitive units, which would consequently support activities contributing to the increase in the competitiveness of the voivodeship.
In the analyses of regional competitiveness at the voivodeship or commune level, one can use the information contained in the reports on RCI in the EU, as well as some relatively simple and user-friendly methods of multi-criteria comparative analysis. The construction of a synthetic index based on the available statistical data is extremely important cognitively and analytically, as it allows to assess the level of competitiveness of a given unit against the others, and then select a leader. A detailed analysis of the determinants of a leader’s success and identification of the most important factors influencing the creation of his or her competitiveness may be of significance for those adapting already existing patterns.
The above considerations were inspired by research on the creation of regional competitiveness. Therefore, these questions were asked: Have there been changes in the level of competitiveness of voivodeships over a period of almost 10 years? Is it possible to select units that stand out in their position compared to others? The aim of the study is an attempt to assess the competitive position of individual voivodeships in Poland in dynamic terms. The study used a comparative analysis of the Regional Competitiveness Index (RCI) in 2010–2019 and Multi-Dimensional Comparative Analysis (WAP). For this purpose, an analysis of the literature and source materials was used—reports presenting the results of research on regional competitiveness in the form of the RCI [11,72,73,74]. WAP was carried out as a supplement. The data were obtained from the Statistical Yearbooks published by the Central Statistical Office. The assessment of the competitive position was made using the level of competitiveness determined on the basis of the synthetic Perkal index (WP), the construction of which was based on the values of 31 diagnostic variables. It allowed for a quantified presentation of the ranking of the level of competitiveness of individual voivodeships. Hierarchization of the obtained results was possible thanks to the cluster analysis using the Ward method. As a consequence, two groups of homogeneous voivodeships with different levels of competitiveness were obtained; the first one had a relatively highly competitive position. This made it possible to select leaders in this group. The second group of voivodeships was characterized by a lower competitive position, compared to the first group. The following research methods were used in the research: the literature analysis method, source analysis method, statistical methods of multidimensional comparative analysis (including the linear ordering method based on a synthetic index, and the hierarchical Ward method), and the Statistica software.

2. Materials and Methods

Meso-competitiveness may be regarded as the competitive ability of sub-regions in the direct and indirect approach. Therefore, the discussion on regional competitiveness cannot be limited only to the competitiveness of local businesses but should also include their relations and the effects of actions taken by local decision makers in the socioeconomic sphere [58,75,76]. Golejewska and Gajda [77] described the outcome-based competitiveness, which centers on the assessment of the outcomes produced by an economy and the resulting competitive position of the region. Let us note that this approach is very broad and fails to determine the underlying causes of the phenomenon. In addition, factor-based competitiveness was described, which focuses on the assessment of the competitive potential and the identification of success factors. These two approaches come together in the outcome-and-factor competitiveness concept applied in this study.
Based on the data published in 2010–2019 in the reports on the Regional Competitiveness Index (RCI) [11,72,73,74], a comparative analysis of the competitive position of voivodeships in Poland was conducted, and then rankings were prepared according to the level of the abovementioned indicator. The obtained data set was grouped using the second quartile, which made it possible to compile groups of voivodeships with a similar level of competitiveness. The analyzed time (2010–2019) made it possible to observe possible changes in the competitive positions of individual voivodeships. The study also used a Multi-Dimensional Comparative Analysis (WAP), which allows to “study the spatial differentiation of the development level of multi-feature objects” [78].
Complementing the research material, the study also used a procedure that allows for the construction of a synthetic indicator to illustrate the level of competitiveness of individual provinces in Poland. Based on the literature on the subject, 49 measures of competitiveness were identified that met the substantive and formal criteria [34,79,80,81,82,83,84], which were then verified due to their availability in statistical databases [85]. Bearing in mind the creation of competitiveness in the context of sustainable development, at the initial stage of verification an analysis of various indicators was made, including those relating to the quality of life in the region, characterizing the ecological aspects of voivodeships, among others: emission of gaseous pollutants from particularly burdensome enterprises; the amount of recycled waste; devastated areas and degraded land in need of reclamation.
Using the Statistica software, the next stage of the indicator verification was carried out, which was eliminating the quasi-constant variables and leaving in indicators poorly correlated with each other and strongly correlated with variables excluded from the analysis [86]. Thus, out of the collected 49 indicators, six indicators were excluded from the analysis due to the low value of the coefficient of variation (value < 10%). Then, by the assumptions of the parametric method [86], a correlation matrix among 43 indicators was constructed, which made it possible to eliminate 12 successive indicators, the correlation relationship of which was at a high level (r > 0.75, at α = 0.05). It was calculated using Statistica:
R =   [ 1 r 1 m r m 1 1 ]
where:
r j k —Pearson’s linear correlation coefficient of the j-th and k-th variables.
Finally, a set of 31 variables was obtained, which formed the basis of the analysis. This comparison made it possible to define their character (stimulant—S/destimulant—D) and classify them to the areas of factor, resulting in competitiveness [87]. The following diagnostic variables were used to analyze factorial competitiveness:
-
X1—population density (S),
-
X2—natural increase per 1000 people (S),
-
X3—net migration for permanent residence (internal and external) (S),
-
X4—the percentage of forest land (D),
-
X5—number of people working in the industry (S),
-
X6—entities of the national economy per 10,000 people (S),
-
X7—sold production of industry per capita (S),
-
X8—voivodeship income (S),
-
X9—registered unemployment rate (D),
-
X10—number of crimes (D),
-
X11—the percentage of net revenues from the sale of innovative products in total revenues (S),
-
X12—the percentage of innovative enterprises in the industry (S),
-
X13—outlays on innovative activities in the industry (S),
-
X14—the total value of projects co-financed by the EU (in 2014–2020 per capita) (S),
-
X15—accident victims per 100,000 population (D),
-
X16—the percentage of people using the gas installation (S),
-
X17—number of people using accommodation (S),
-
X18—the number of students and graduates of the university 2018/19 (S),
-
X19—railway lines in use (S),
-
X20—public roads with a hard surface (S),
-
X21—number of flats completed per 1000 people (S),
-
X22—emission of gas pollutants from particularly troublesome of enterprises (D),
-
X23—the percentage of waste recovered in the amount generated (S),
-
X24—the percentage of legally protected areas in full (D),
-
X25—outlays on fixed assets for environmental protection (S),
-
X26—the amount of land requiring reclamation (D),
-
X27—number of cinemas (S),
-
X28—number of theaters and musical institutions (S),
-
X29—number of doctors (S),
-
X30—average disposable income per capita in households (S).
On the other hand, the resulting competitiveness was represented by X31—GDP per capita (S).
It should be added that the abovementioned variables appeared in the research presented in the literature on the subject and met the technical–formal requirements [34,79,80,81,82,83]. A characteristic feature of the latter WAP method is the construction of a synthetic index based on selected diagnostic variables, which allows to research economic development, quality of life or the quality of the natural environment [79].
For the purposes of this study, Perkal’s indicator (WP) was used, which is a comprehensible measure that involves insignificant memory loss during data aggregation [88]. The construction of Perkal’s indicator is based on the construction of a synthetic index which is the sum of standardized partial indicators. It is a multi-stage process comprising:
  • The selection of diagnostic variables.
  • Standardization.
  • The conversion of destimulators into stimulators.
  • Value determination.
First, a voivodeship observation matrix was created, which included 31 indicators. Selected diagnostic variables were then standardized for the year 2018 according to the following formula [80]:
z i j = x i j x j ¯ S j .
Key:
z i j —value of the normalized variable j in voivodeship i,
x i j —the value of variable j for voivodeship i,
x j ¯ —arithmetic mean of variable j,
S j —standard deviation of variable j.
According to the following formulas:
x ¯ = 1 w i = 1 w x i k ,
s k =     i = 1 w ( x i k   x ¯ k ) 2   w .
Key:
k = 1, 2, 3nn,
x ¯ —arithmetic mean of the k-th variable,
sk—standard deviation of the k-th variable,
z i k —standardized value of the k-th variable in the i-th unit,
w—number of observations.
These calculations were sufficient to create a matrix of variables covering all the 16 voivodeships. In the next stage, destimulators were converted into stimulators. Finally, Perkal’s synthetic indicator was constructed as the sum of standardized partial values for 2018 according to the following formula:
W i = 1 m j = 1 m z i j .
Key:
Wi—Perkal’s indicator,
zij—standardized value of the j-th variable in the i-th object after the conversion of destimulators into stimulators,
m—number of objects.
Then, the voivodeships were classified according to the level of competitiveness using cluster analysis, which belongs to the hierarchical agglomeration methods as part of the multivariate analysis. It enables the isolation of clusters, their classification and their exploration. The essence of the agglomeration methods comes down to the isolation of homogeneous subsets of these objects from a data set of objects. The division was carried out using Ward’s method so that the objects from one group (class) were as similar to each other as possible, and the objects belonging to different classes as different as possible. The Euclidean distance was adopted as the measure of the distance between the studied objects, which determines the actual geometric distance in a multidimensional space.
The Euclidean distance was measured according to the pattern [89]:
d i j   =   [ k = 1 m ( z i k     z j k ) 2 ] 1 2
where:
dij—distance between the two objects under consideration,
zik, zjk—the normalized value of k-th variable for objects i and j,
m—number of variables.
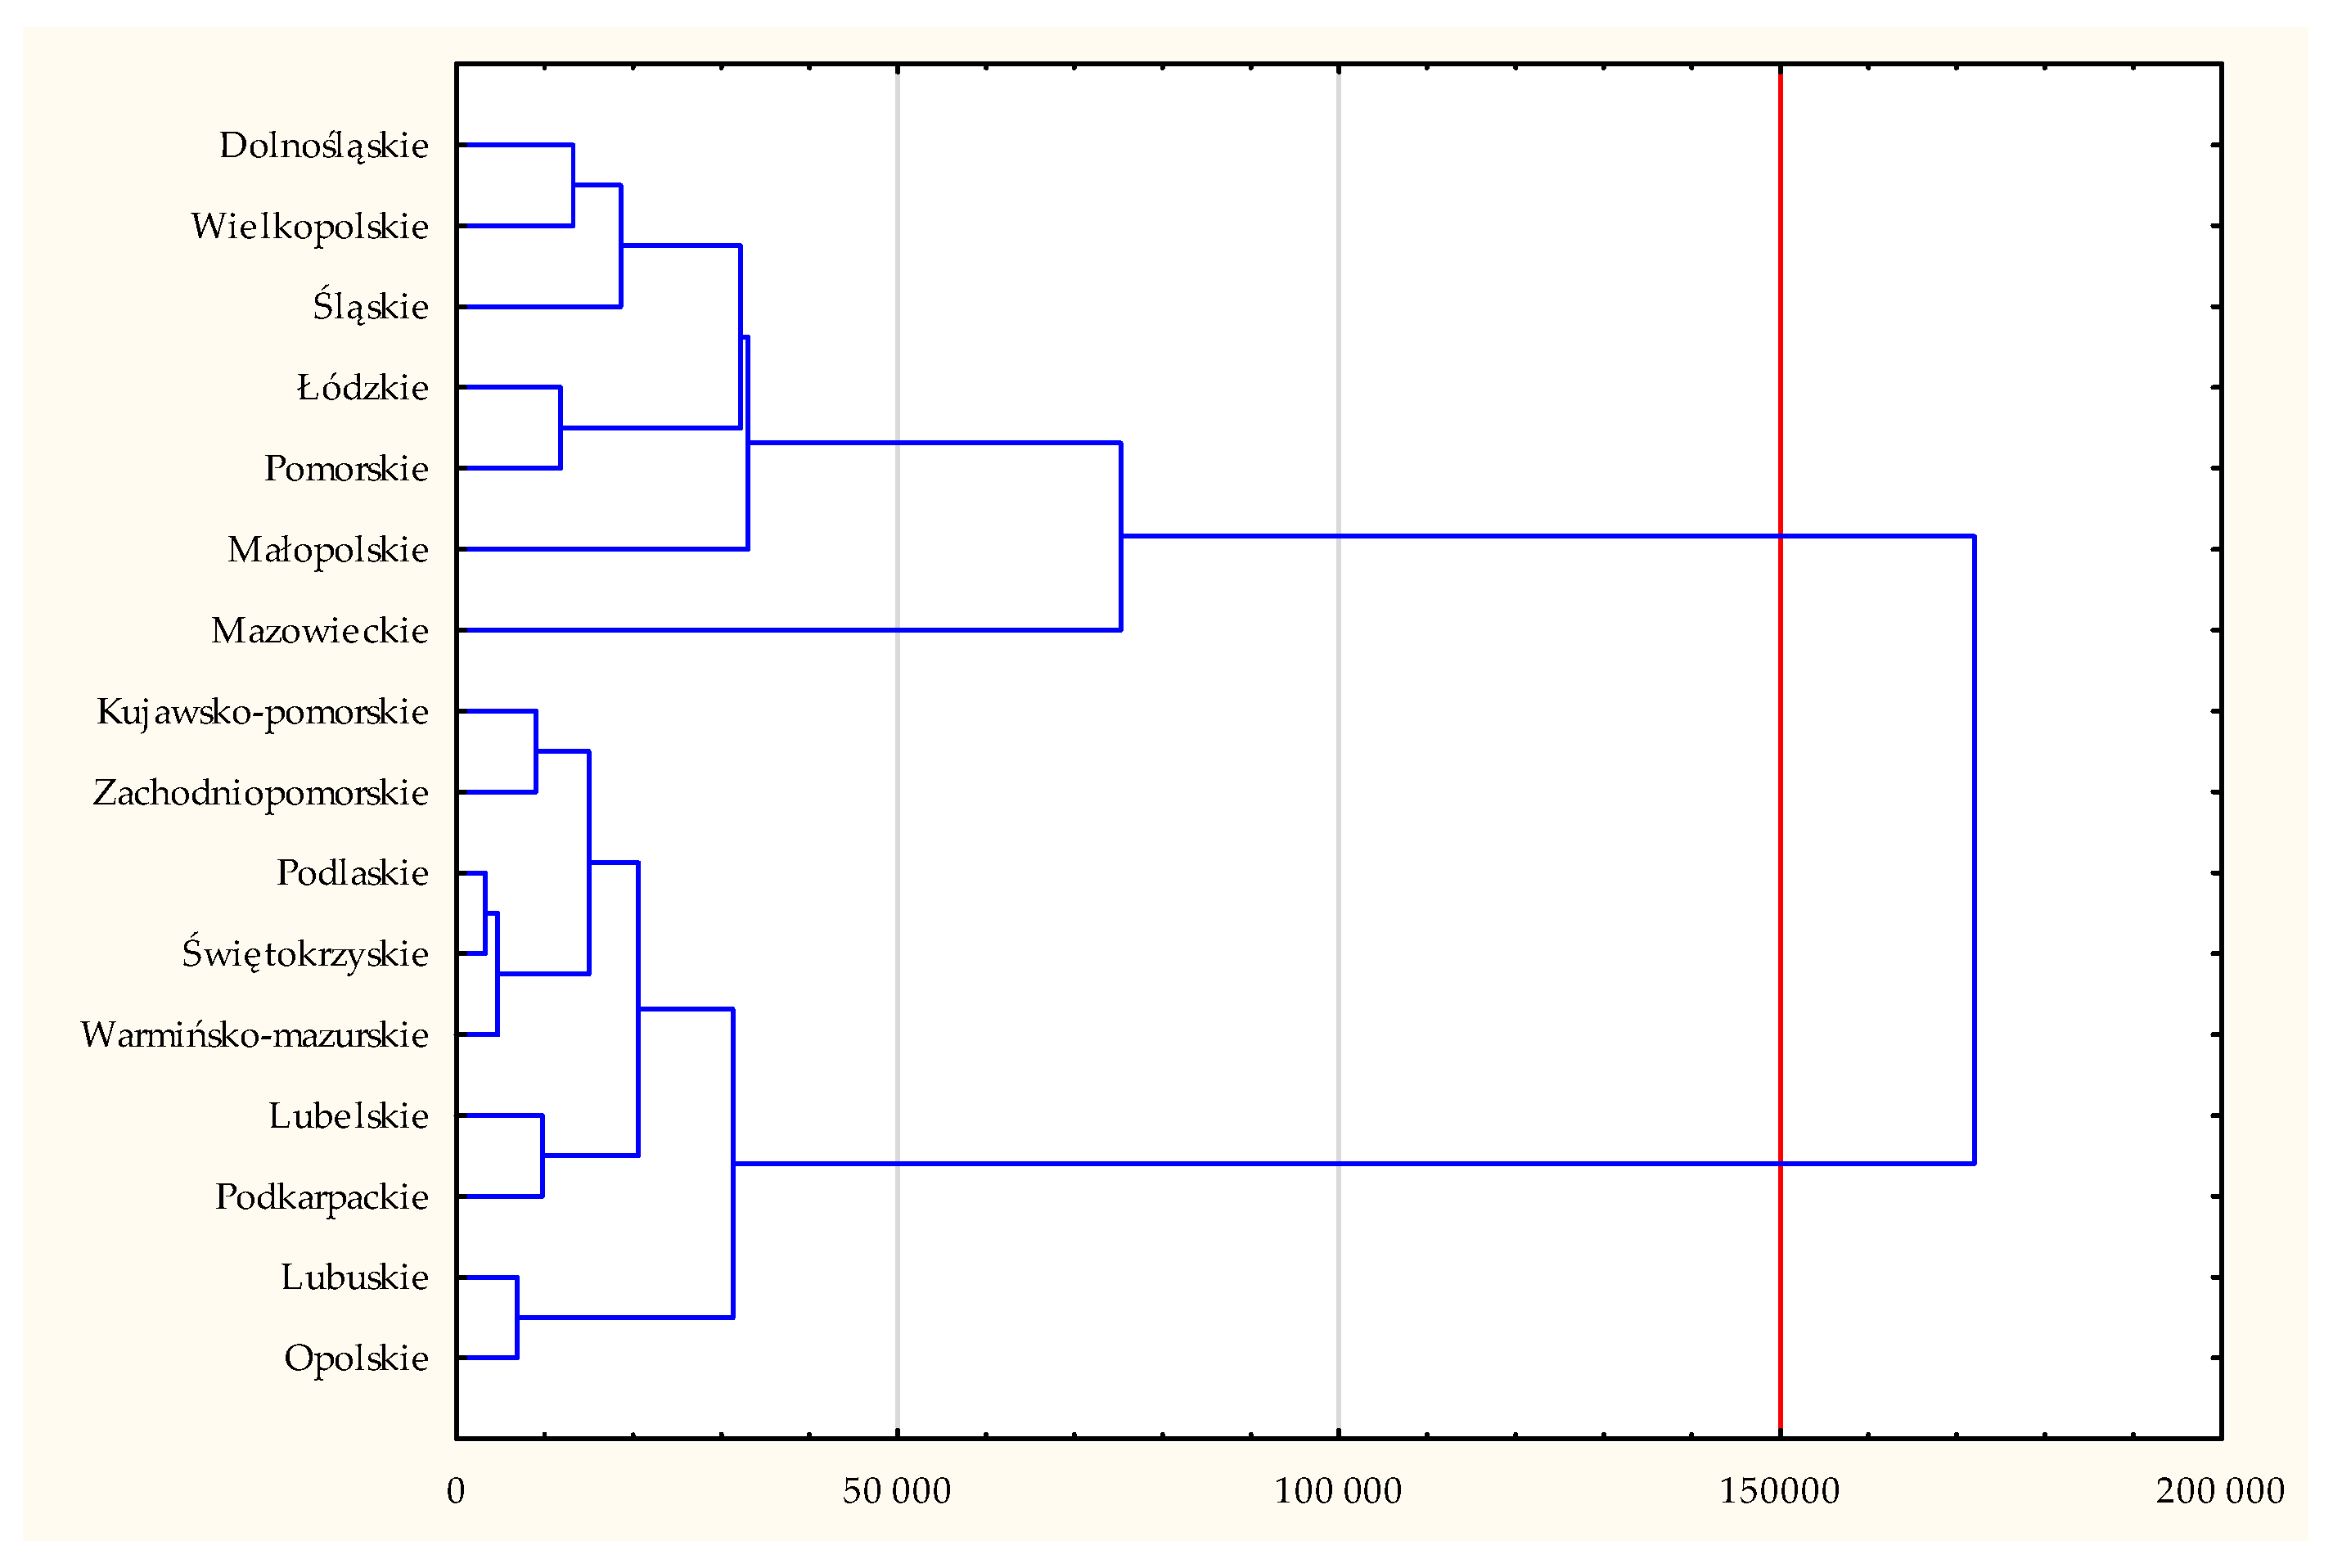
The process of grouping the research results was reflected in a binary tree (dendrogram), which illustrates sets of objects according to the decreasing similarity between them. The results of the analysis are presented graphically on a dendrogram. The number of clusters was determined subjectively, based on a visual analysis of the diagram showing the course of clusters. When determining the number of clusters, the author made every effort to ensure that their number was not too large and that all clusters were quite distant from each other. Tree branches were cut at the place with the greatest difference in distance between nodes [89].
Then, using the Statistica program, the correlation of Spearman’s rank-order from the sample (at α = 0.05) was calculated between the abovementioned 31 diagnostic variables and the obtained Perkal’s index to determine whether there were monotonic relationships (also nonlinear) between them [90]. The information obtained on the strong relationships that occur can be used to improve the quality of life in the region, which may also contribute to increasing the level of competitiveness of a given voivodeship in the future.

3. Results

Entering a competitive arena leads to the achievement of a competitive position. Its exact determination is possible upon the establishment of a regional competitiveness ranking, which identifies the place of the entity in question with respect to others. Competitive position manifests the advantage over rival regions or the distance to make up for. According to Czudec [57] “the competitive position of a region determined upon its economic base is sufficient to say whether the region falls into the group of the national economic growth stimulators or the petitioners for state aid.” Thus, the competitive position is the outcome of the actions taken in the competitive process and the concerted impact of many interrelated factors such as the diversified economic structure, communication availability, innovation, personal entrepreneurship, the intellectual and cultural potential of the residents, technological infrastructure, the condition of the natural environment, research and development background, investment appeal, innovation and organizational potential, national and foreign investment, the effectiveness of SMEs and the existence of business support institutions [39,91].
The results of reports published on the website of the European Commission [11,72,73,74] indicate that the level of the RCI indicator at the mesoeconomic level showed large disproportions in the levels of competitiveness of Western and Eastern European regions. This was an interesting phenomenon, but the study focused on the development of the level of competitiveness at the regional level in Poland. The analysis of the RCI in 2010–2019 concerned only units forming the organizational structure of Poland. It made it possible to conclude that despite the low level of the RCI of individual voivodeships in Poland compared to the corresponding units of Western Europe, the level of competitiveness characterizing individual voivodeships in Poland was relatively stable, but the spaces were nevertheless varied.
Comparing the RCI level, it was noticed that the following voivodeships were characterized by a relatively high and stable level of competitiveness (compared to other voivodeships): Mazowieckie, Śląskie, Małopolskie and Dolnośląskie, which are presented in Table 1 (Appendix A, Table A1). In 2010–2016, only the Mazowieckie voivodeship retained its leadership position, while the competitive positions of the remaining regions underwent slight changes. It is worth appreciating the efforts of the local community and the decision makers of the Śląskie voivodeship, which caused it in 2019 to achieve the best competitive position compared to other voivodeships. In the case of the Mazowieckie voivodeship, a decline in the competitive position was recorded in 2019; this situation could have resulted, inter alia, from the geographical breakdown of the capital city area and separate representations of the RCI for the voivodeship (RCI = −0.45) and the capital area (RCI = 0.23).
A slightly lower, but stabilized, competitive position was occupied by the following voivodeships: Łódzkie and Zachodniopomorskie. The competitive positions of the remaining voivodeships underwent slight fluctuations. Greater dynamics of changes were visible in the case of the Lubelskie voivodeship, which from 12th place in 2010 was promoted in the ranking in 2013 to 8th place, and in the following years, it returned to 12th place, which is included in Table A1 in the Appendix A. It was similar in the case of the Wielkopolskie voivodeship, which in 2013 fell to 11th place in the ranking, then it returned to 7th place in the following years. A dramatic drop was also recorded in the case of the Lubuskie voivodeship, which finally took place in 2019. Positive changes took place in the Pomorskie, Podkarpackie and Kujawsko-Pomorskie voivodships, where the competitive position has been systematically improving since 2010.
The level of the RCI made it possible to distinguish a group of voivodeships occupying the weakest competitive position, which included the Warmińsko-Mazurskie, Podlaskie and Kujawsko-Pomorskie voivodeships (in 2013).
The research results obtained with the use of Multi-Dimensional Comparative Analysis made it possible to conclude that in 2018 voivodeships had the best competitive position compared to other voivodeships: Mazowieckie, Śląskie, Małopolskie, Dolnośląskie, Wielkopolskie, Pomorskie, which is shown in Figure 2. Similar results concerning the relatively high level of competitiveness were obtained in the studies presented by Malkowski [79] and Wojarska [34].
Comparing the presented results of this research with the research on the competitiveness of voivodeships in Poland [90], it can be concluded that some voivodeships in Poland are still classified as those with the lowest investment attractiveness, which concerned the Świętokrzyskie, Lubelskie, Warmińsko-Mazurskie and Podlaskie voivodeships. This fact was confirmed by the results of my own research, which allowed to distinguish a group of units characterized by a lower level of competitiveness. This group included the following voivodeships: Łódź, Zachodniopomorskie, Lubelskie, Warmińsko-Mazurskie, Podkarpackie Lubuskie, Świętokrzyskie, Kujawsko-Pomorskie, Opolskie and Podlaskie.
Then, an attempt was made to classify voivodeships according to the similarity of the features describing factor and result in competitiveness. For this purpose, a database of 31 variables was used, which had already been verified due to the value of the coefficient of variation (value > 10%). Using the Statistica software, a cluster analysis was performed using Ward’s method, and as a result, a dendrogram was obtained, which is shown in Figure 3. Based on the analysis of the binary tree prepared, it was possible to distinguish two groups of voivodeships that were internally homogeneous, consistent with the studied variables. The first group included the following voivodeships: Mazowieckie, Śląskie, Małopolskie, Dolnośląskie, Wielkopolskie, Pomorskie, Łódzkie. The characteristic of this group was the relatively high level of competitiveness compared to other voivodeships. When analyzing the distribution of the first group, it was noticed that closest to each other due to the studied variables was the cluster of the Dolnośląskie, Wielkopolskie and Śląskie voivodeships. The second subgroup was formed by the cluster of the Łódzkie and Pomorskie voivodeships.
The second cluster was formed by the following voivodeships: Zachodniopomorskie, Warmińsko-Mazurskie, Świętokrzyskie, Podlaskie, Podkarpackie, Opolskie, Lubuskie, Świętokrzyskie, Kujawsko-Pomorskie. This group was characterized by a lower level of competitiveness in relation to the first group of voivodeships. The dendrogram in group 2 also shows smaller clusters of voivodeships that formed: Lubuskie and Opolskie; Lubelskie and Podkarpackie, Podlaskie, Świętokrzyskie and Podlaskie; Kujawsko-Pomorskie and Zachodniopomorskie.
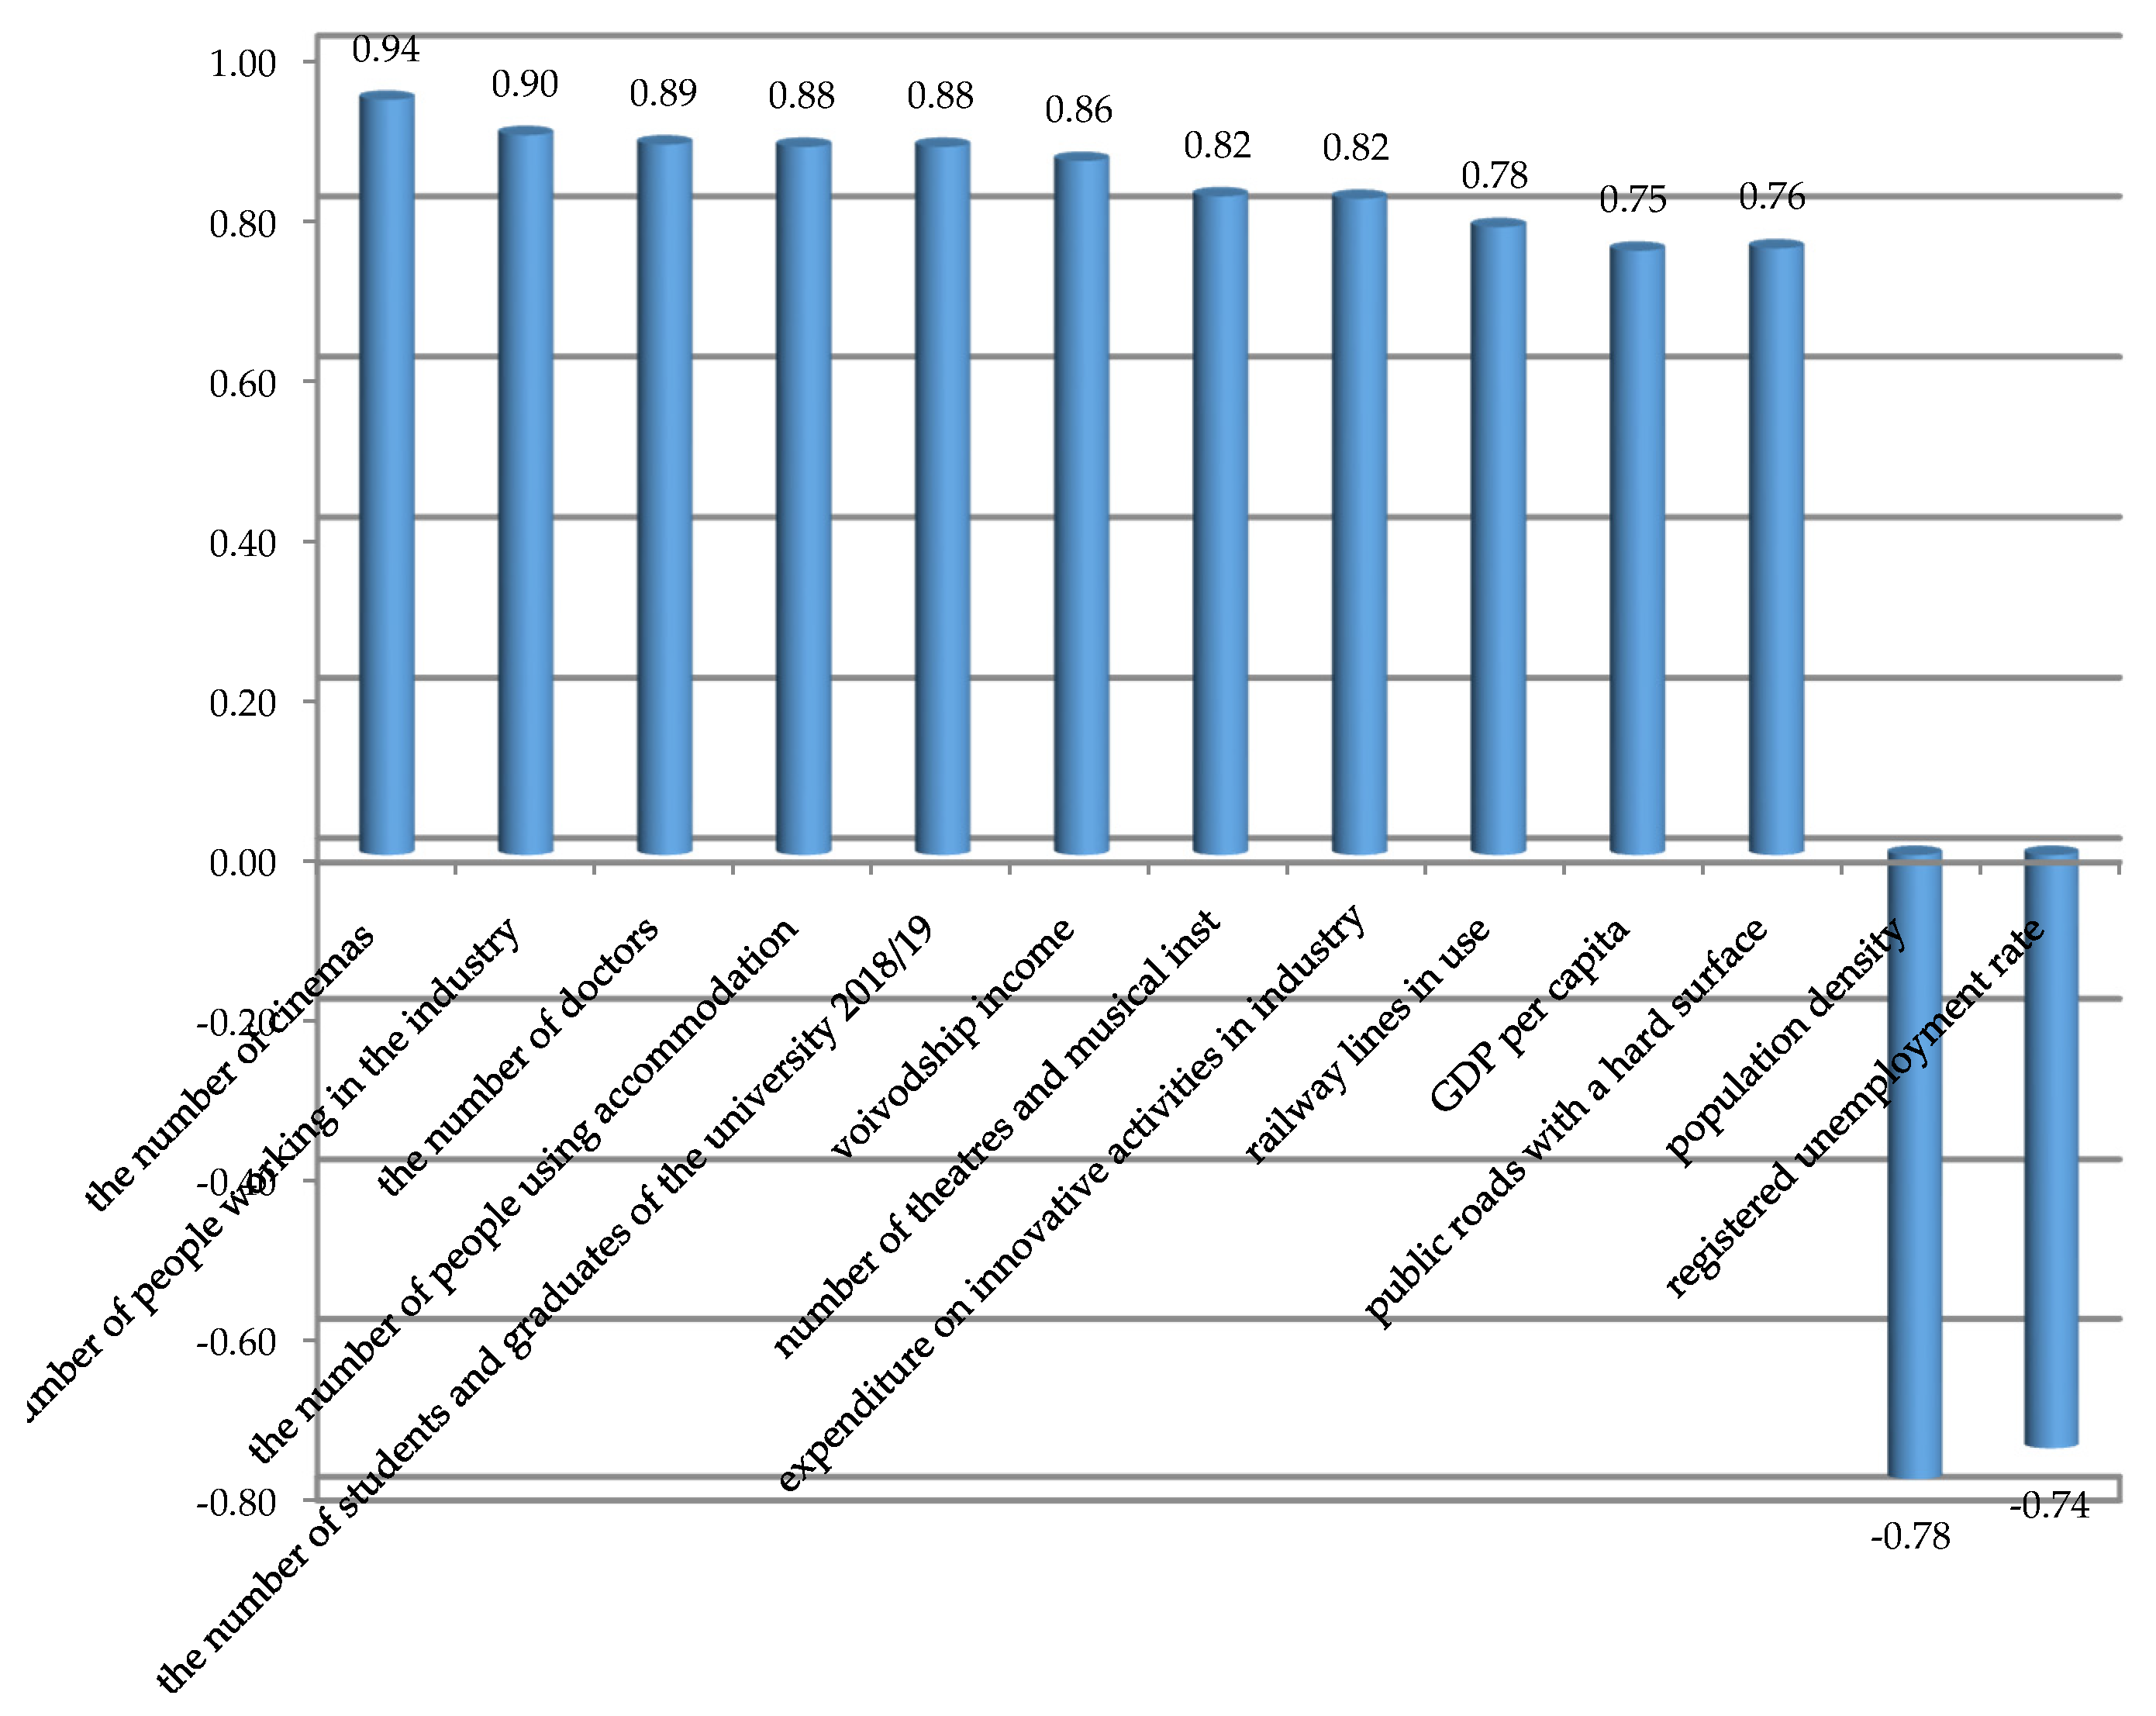
Additionally, possible dependencies of 31 selected diagnostic variables with the level of the Perkal index, which would be helpful in determining the possibilities of increasing competitiveness, were analyzed in detail. With the help of the Statistica program, the correlation of Spearman’s rank-order was calculated (at α = 0.05), which allowed to hierarchize the level of dependence from the largest to the smallest. The results of the analysis indicated that a strong positive correlation (above 0.75) occurred between the level of Perkal’s index and many variables presented in Figure 4. The group of variables presented included those whose improvement may increase the quality of life and competitiveness in voivodeships that are currently ranked in the lowest positions in the RCI ranking. In the context of the obtained results of statistical analysis, it can be concluded that the possibilities of increasing the level of competitiveness may be optimal management of resources, which should be reflected in the level of provincial income; modernization of the existing technical infrastructure (e.g., extension and improvement of the quality of railway lines and public roads); increase in innovation in industrial plants, development of industry and services (which will enable the creation of jobs); providing social and living and cultural facilities (e.g., increasing accommodation places, access to cultural and health institutions) and higher education. Thus, increasing the productivity in the region and improving the quality of life may, inter alia, contribute to the growth of GDP per capita, which is equated with the resulting competitiveness.

4. Discussion

The stimulation of regional competitiveness is a difficult and complex process. It requires the identification of competitiveness determinants and the effective use of competition instruments for the development of competitive potential. It leads to the emergence of a competitive position in relation to the compared regions. The diagnosis of the competitive position at the mesoregional level is complicated for many reasons, including the availability and scope of statistical data constituting the basis for the analysis, or the correct selection of the research method. The analysis should also be cross-checked with periodically published reports on regional competitiveness by the European Commission. Nevertheless, there is a certain information insufficiency in the case of local government units at a lower organizational level than the voivodeship, e.g., municipalities, in cases of both the availability of statistical information and a methodological gap. It seems that in the context of sustainable development, it would be worth considering the inclusion in the structure of indicators that diagnose the competitiveness of individuals, in addition to the generally accepted components, the variables describing ecological aspects.
The conducted own research taking into account the years 2010–2019, confirmed by previous studies, identified a group of leaders with a consistently high level of competitiveness (voivodeships: Mazowieckie, Śląskie, Wielkopolskie and Dolnośląskie). Detailed analysis of the conditions and identification of the determinants of the leaders’ competitiveness should enable the construction of benchmark solutions that could be adapted by individuals with similar diagnostic variables grouped in specific clusters. The study attempted to identify possible opportunities to increase the level of competitiveness at the voivodeship level. On the basis of the available static data, areas that may be of significant importance in creating competitiveness under favorable circumstances were identified. Unfortunately, the conditions of the Lockdown constituted a significant obstacle in creating or increasing competitiveness at the mesoeconomic level.
The apparent spatial disparity in the competitiveness of Polish regions is the product of many different causes. In the regions falling into the group of low and very low levels of competitiveness, this may be a result of long-term socioeconomic processes (such as sparse urbanization and industrialization), the polarized growth of competition leaders and the adverse effects of such polarization, i.e., the draining of competitive potential (such as qualified staff) from neighboring voivodeships.
The competitive process is not a sure bet; the achievement of a competitive position is not tantamount to a stable competitive advantage, i.e., an ideal situation that translates into financial performance. It may turn out that the competitive edge is temporary and potentially subject to a range of exogenous and endogenous factors. It was apparent in the case of the Lubelskie voivodeship, which increased its competitive advantage by three points over the years 2010–2019. However, there was also a spectacular downturn, as the competitive position of Lubuskie voivodeship faltered. The efforts of dissidents in the Pomorskie, Podkarpackie and Kujawsko-Pomorskie voivodeships, where actions were systematically undertaken to improve the competitive position, should be assessed positively.

5. Conclusions

The presented research results, taking into account a longer time horizon, made it possible to state that despite the economic realities, budget management by local government units is complicated. Efforts are made to supplement budgets with EU funds, the availability of EU funds, and the use of programs that provide for the equalization of inequalities between the regions of the EU. Nevertheless, there are still disproportions in the level of competitiveness of individual voivodeships in Poland. It also attesting to the fact that the concept of sustainable development on the local level is not being carried out on the identical level. It is a highly interesting phenomenon and possibly more detailed analyses pertaining to the stimulation of competitiveness in the excelling regions could lead to the creation of benchmark solutions. In this way, regions exhibiting lower levels of competitiveness can adapt the prepared projects or models in order to optimize their use of potential and elevate their investment appeal in all voivodeships in Poland.

Funding

This research received no external funding.

Institutional Review Board Statement

Not applicable.

Informed Consent Statement

Not applicable.

Data Availability Statement

Data are contained within the article.

Acknowledgments

The author is grateful to the authorities of the Faculty of Economics for help in financing the research.

Conflicts of Interest

The authors declare no conflict of interest.

Appendix A

Table A1. The RCI level in 2010–2019 in voivodeships in Poland [71,72,73,74].
Voivodeship2010201320162019
Mazowieckie56−0.180−0.128−0.45
Śląskie51−0.406−0.324−0.29
Małopolskie47−0.471−0.348−0.33
Dolnośląskie43−0.544−0.444−0.43
Łódzkie40−0.582−0.448−0.43
Wielkopolskie42−0.584−0.478−0.50
Pomorskie41−0.728−0.539−0.51
Opolskie39−0.584−0.656−0.56
Podkarpackie37−0.712−0.611−0.64
Zachodniopomorskie37−0.743−0.650−0.67
Świętokrzyskie34−0.744−0.691−0.68
Lubelskie36−0.666−0.588−0.68
Lubuskie31−0.729−0.692−0.68
Kujawsko-Pomorskie36−0.733−0.569−0.68
Podlaskie34−0.704−0.639−0.69
Warmińsko-Mazurskie29−0.871−0.699−0.84

References

  1. Klarin, T. The Concept of Sustainable Development: From its Beginning to the Contemporary Issues. Zagreb Int. Rev. Econ. Bus. 2018, 21, 67–94. [Google Scholar] [CrossRef] [Green Version]
  2. Semenenko, I.; Halhash, R.; Sieriebriak, K. Zrównoważony rozwój regionów na Ukrainie: Przed i po rozpoczęciu konfliktu. Eqfuilibrium. Q. J. Econ. Econ. Policy 2019, 14, 317–339. [Google Scholar] [CrossRef]
  3. Konstytucja Rzeczypospolitej Polskiej z dnia 2 kwietnia 1997 r. (Dz.U. 1997 nr 78 poz. 483). Available online: http://isap.sejm.gov.pl/isap.nsf/DocDetails.xsp?id=wdu19970780483 (accessed on 11 January 2021).
  4. Svetlačić, R.; Primorac, D.; Kozina, G. Sustainable Development as a Strategic Guiding Principles. Available online: https://bib.irb.hr/datoteka/833076.SUSTAINABLE_DEVELOPMENT_AS_A_STRATEGIC_GUIDING_PRINCIPLES.pdf (accessed on 11 January 2021).
  5. Dobrovolskienė, N.; Tvaronavičienė, M.; Tamošiūnienė, R. Tackling projects on sustainability: A lithuanian case study. Entrep. Sustain. Issues 2017, 4, 477–488. [Google Scholar] [CrossRef] [Green Version]
  6. Kot, S. Sustainable supply chain management in small and medium enterprises. Sustainability 2018, 10, 1143. [Google Scholar] [CrossRef] [Green Version]
  7. Pirvu, R.; Bădricea, R.; Manta, A.; Lupăimentscu, M. The Effects of the Cohesion Policy on the Sustainable Development of the Development Regions in Romania. Sustainability 2018, 10, 2577. [Google Scholar] [CrossRef] [Green Version]
  8. Ślusarczyk, B.; Grondys, K. The concept of sustainable development in the functioning of municipalities belonging to special economic zones in Poland. Sustainability 2018, 10, 2169. [Google Scholar] [CrossRef] [Green Version]
  9. Lin, C.S.; Chang, R.Y.; Dang, V.T. An integrated model to explain how corporate social responsibility affects corporate financial performance. Sustainability 2012, 7, 8292–8311. [Google Scholar] [CrossRef] [Green Version]
  10. Androniceanu, A.; Comǎnescu, M.; Dragulanescu, I.V. The impact of globalization on unemployment in Europe. In Proceedings of the 29th International Business Information Management Association Conference—Education Excellence and Innovation Management through Vision 2020: From Regional Development Sustainability to Global Economic Growth, Vienna, Austria, 3–4 May 2017; pp. 716–724. [Google Scholar]
  11. Annoni, P.; Dijkstra, L.; Gargano, N. The EU Regional Competitiveness Index 2016; Working Paper WP 02/2017; European Commission: Maastricht, The Netherlands, 2017. [CrossRef]
  12. DESA-UN. Sustainable Development Goals Report 2017. Available online: https://undesa.maps.arcgis.com/apps/MapSeries/index.html (accessed on 12 December 2020).
  13. Gosling-Goldsmith, J. Sustainable Development Goals and Uncertainty Visualization. Master’s Thesis, University of Twente, Enschede, The Netherlands, 2018; pp. 13–14. [Google Scholar]
  14. Mensah, J. Sustainable development: Meaning, history, principles, pillars, and implications for human action: Literature review. Cogent Soc. Sci. 2019, 5. [Google Scholar] [CrossRef]
  15. Chrobocińska, K.; Napiórkowska-Baryła, A.; Świdyńska, N. Witkowska-Dąbrowska, M. Environment and the Competitiveness of Communes on the Exemple of the Warmińsko-Mazurskie Voivodeship; Wydawnictwo Uniwersytetu Warmińsko-Mazurskiego: Olsztyn, Poland, 2021; pp. 16–31. [Google Scholar]
  16. Szymanik, E. Business Competitiveness—Main Aspects. In Zeszyty Naukowe; Uniwersytet Ekonomiczny w Krakowie: Kraków, Poland, 2016; pp. 107–124. [Google Scholar] [CrossRef]
  17. Łukiewska, K. Methodological Aspects of Measuring International Competitiveness of an Industry as a Case Study of the Food Industry; Wydawnictwo Uniwersytetu Warmińsko-Mazurskiego: Olsztyn, Poland, 2019; pp. 7–28. [Google Scholar]
  18. Kiseľáková, D.; Šofranková, B.; Onuferová, E.; Čabinová, V. The evaluation of competitive position of EU-28 economies with using global multi-criteria indices. Equilib. Q. J. Econ. Econ. Policy 2019, 14, 441–446. [Google Scholar] [CrossRef]
  19. Cellini, R.; Soci, A. Pop competitiveness. PSL Q. Rev. 2002, 55, 71–101. [Google Scholar]
  20. Aiginger, K.; Firgo, M. Regional Competitiveness under New Perspectives; WWW: Vienna, Austria, 2016. [Google Scholar]
  21. Gardiner, B.; Martin, R.; Tyler, P. Competitiveness, productivity and economic growth across the European regions. Reg. Compet. 2012, 55–78. [Google Scholar] [CrossRef]
  22. Budd, L.; Hirmis, A.K. Competitiveness conceptual framework for regional competitiveness. Reg. Stud. 2004. [Google Scholar] [CrossRef]
  23. Piecuch, J.; Szarek, J. Competitiveness of the Economy of the Małopolskie Voivodeship and the Development of the Startup Ecosystem. Probl. Glob. Agric. 2018, 18, 183–193. [Google Scholar] [CrossRef] [Green Version]
  24. European Commision. European Competitiveness Report 2010; European Commision: Luxembourg, 2010. [CrossRef]
  25. Martin, R. Cambridge Econometrics, Ecorys-Nei. A Study on the Factors of Regional Competitiveness: Report for the European Commission DG Regio 2003. Available online: https://ec.europa.eu/regional_policy/sources/docgener/studies/pdf/3cr/competitiveness.pdf (accessed on 13 December 2020).
  26. Martin, R. Thinking about Regional Competitiveness: Critical Issues (Policy Paper Prepared for East Midland Development Agency). Nottingham Trent University. 2005. Available online: http://irep.ntu.ac.uk/id/eprint/519/1/202832_thinkingaboutregionalcompetitiveness2005.pdf (accessed on 16 December 2020).
  27. Huggins, R.; Izushi, H.; Thompson, P. Regional competitiveness: Theories and methodologies for empirical analysis. Bus. Econ. Res. J. 2013, 6, 155–172. (accessed on 10 December 2020). [Google Scholar] [CrossRef]
  28. Tusińska, M. International Competitiveness and the Socio-Economic Development. The Case of Poland against Other EU Countries; Wydawnictwo Uniwersytetu Ekonomicznego w Katowicach: Katowice, Poland, 2014; p. 21. [Google Scholar]
  29. Siudek, T.; Zawojska, A. Competitiveness in the economic concepts, theories and empirical research. Acta Oeconomia 2014, 13, 91–108. [Google Scholar]
  30. Békés, G.; Ottaviano, G.I.P. Micro-founded measurement of regional competitiveness in Europe. In Measuring Competitiveness in Europe: Resource Allocation, Granularity and Trade; Altomonte, C., Békés, G., Eds.; Institute of Economics, Hungarian Academy of Sciences: Budapest, Hungary, 2016. [Google Scholar]
  31. Chrobocińska, K. Selected factors in the location of service activities conducted by small enterprises. Zesz. Nauk. Uniw. Przyr. Humanist. Siedlcach. Seria Adm. Zarządzanie 2020, 27–36. [Google Scholar] [CrossRef]
  32. Kosiedowski, W. Competitiveness of the Regions of East-Central Europe in their Integration with the EU. In Regional Competitiveness. The Role of Information and Telecommunication Technologies; Runiewicz, M., Ed.; Wydawnictwo Wyższa Szkoła Przedsiębiorczości i Zarządzania: Warszawa, Poland, 2016; pp. 32–38. [Google Scholar]
  33. Pietrzyk, I. Regional Competitiveness according to the European commission. In Polityka Regionalna i jej rola w Podnoszeniu Konkurencyjności Regionów; Klamut, M., Cybulski, L., Eds.; Wydawnictwo Akademii Ekonomicznej w im: Oskara Langego, Poland, 2000; p. 31. [Google Scholar]
  34. Wojarska, M. Competitiveness of the Świętokrzyskie Voivodeship against Other Polish Regions]. Available online: https://www.researchgate.net/publication/301285669_Konkurencyjnosc_wojewodztwa_swietokrzyskiego_na_tle_pozostalych_regionow_Polski (accessed on 16 December 2020).
  35. Jankowska, B. International Competitiveness of an Industry as a Case Study of the Construction Industry in Years 1994–2001; Wydawnictwo Akademii Ekonomicznej w Poznaniu: Poznań, Poland, 2005; p. 41. [Google Scholar]
  36. Meyer-Stamer, J. Systemic Competitiveness and Local Economic Development. In Large Scale Systemic Change: Theories, Modelling and Practices; Bodhanya, S., Ed.; Mesopartner: Duisberg, Germany, 2008; p. 3. [Google Scholar]
  37. Kruk, H. Regional Competitiveness in Environmental Matters; Wydawnictwo Dom Organizatora: Toruń, Poland, 2010; p. 73. [Google Scholar]
  38. Sixth Periodic Report on the Social and Economic Situation and Development of the Regions of the European Union; European Commission: Luxembourg, 1999; p. 75.
  39. Winiarski, B. Regional Competitiveness Factors, In Konkurencyjność Regionów; Klamut, M., Ed.; Wydawnictwo Naukowe Akademii Ekonomicznej: Wrocław, Poland, 1999; pp. 50–51. [Google Scholar]
  40. Koopman, R.; Wang, Z.; Wei, S.J. Tracing Value-Added and Double Counting in Gross Exports. Am. Econ. Rev. 2014, 104, 459–494. [Google Scholar] [CrossRef] [Green Version]
  41. Wang, Z.; Wei, S.-J.; Zhu, K. Quantifying International Production Sharing at the Bilateral and Sector Levels; Working Paper No. 19677; National Bureau of Economic Research: Washington, DC, USA, 2013; Available online: http://www.nber.org/papers/w19677 (accessed on 18 December 2020).
  42. Altomonte, C.; Békés, G. Measuring competitiveness in a granular and global world. In Measuring Competitiveness in Europe: Resource Allocation, Granularity and Trade; Altomonte, C., Békés, G., Eds.; Bruegel: Brussels, Belgium, 2016. [Google Scholar]
  43. Begg, I. Cities and competitiveness. Urban Stud. 1999, 36, 795–809. [Google Scholar] [CrossRef]
  44. Lengyel, I. The pyramid model: Enhancing regional competitiveness in Hungary. Acta Oeconomica 2004, 54, 323–342. [Google Scholar] [CrossRef]
  45. Parkinson, M.; Champion, T.; Simmie, J.; Turok, I.; Crookston, M.; Katz, B.; Park, A. State of the English cities. Social research (NatCen). The Office of the Deputy Prime Minister, 2, 2006. Available online: http://image.guardian.co.uk/sys-files/Politics/documents/2006/03/07/StateoftheEnglishCitiespart1.pdf (accessed on 16 December 2020).
  46. Łaźniewska, E.; Chmielewski, R.; Nowak, P. Definitions, Models, and Studies on Regional Competitiveness. In Konkurencyjność Regionalna: Koncepcje—Strategie—Przykłady; Łaźniewska, E., Gorynia, M., Eds.; Wydawnictwo Naukowe PWN: Warszawa, Poland, 2012; pp. 72–88. [Google Scholar]
  47. Nowak, P. A New Paradigm of Regional Development as a Case Study of Selected Regions in Western Europe]. Ph.D. Thesis, Uniwersytet Ekonomiczny w Poznaniu, Poznań, Poland, 2011; pp. 53–62. Available online: https://www.wbc.poznan.pl/dlibra/show-content/publication/edition/178703?id=178703 (accessed on 13 November 2020).
  48. Czaplicka-Kolarz, K.; Bondaruk, J.; Kruczek, M.; Trząski, L.; Gieroszka, A.; Markowska, M.; Skalny, A.; Kantor, M.; Wiesner, M.; Uszok, E.; et al. Method for the Assessment of the Regional Competitive Position Arising from its R+D+I (Innovation, New Knowledge) Potential in the Context of Intelligent Specialisation. 2013. Available online: http://www.gig.eu/sites/default/files/attachments/przetargi/metoda_oceny_pozycji_konkurencyjnej_2013.09.30_druk.pdf (accessed on 16 December 2020).
  49. Chrobocińska, K. Selected regional competitiveness assessment models. Socio Econ. Probl. State 2016, 14, 5–10. [Google Scholar] [CrossRef]
  50. Wojtasik-Terech, A. Regional competitiveness and local government debt. Prac. Nauk. Uniw. Ekon. Wrocławiu 2019, 63, 152–164. [Google Scholar] [CrossRef]
  51. Porter, M.E. The Competitive Advantage of Nations: With a New Introduction; Free Press: New York, NY, USA, 1990. [Google Scholar]
  52. Song, K.H.; Choi, S.; Han, I.H.H. Competitiveness Evaluation Methodology for Aviation Industry Sustainability Using Network DEA. Sustainability 2020, 12, 10323. [Google Scholar] [CrossRef]
  53. Porter, M.E. Competitive Strategy. Techniques for Analyzing Industries and Competitors; Wydawnictwo MT Biznes Sp. z o.o: Warszawa, Poland, 2006; p. 63. [Google Scholar]
  54. Malewska, K. Resource-Based Approach for Strategic Management in Polish Businesses. In Wybory Strategiczne Firm: Nowe Instrumenty Analizy i Wdrażania; Płoszajski, P., Bełza, G., Eds.; Szkoła Główna Handlowa w Warszawie: Warszawa, Poland, 2006; pp. 247–255. [Google Scholar]
  55. Dierickx, I.; Cool, K. Asset Stock Accumulation and Sustainability of Competitive Advantage. Manag. Sci. 1989, 35, 1504–1511. [Google Scholar] [CrossRef] [Green Version]
  56. Hamel, G.; Prahalad, C.H. The Core Competencies of the Corporation. Harv. Bus. Rev. 1990, 3, 79–91. [Google Scholar]
  57. Czudec, W. Regional Competitiveness and Strategies. Econ. Manag. 2010, 2, 33–42. [Google Scholar]
  58. Rogalska, E. Multiple-criteria analysis of regional entrepreneurship conditions in Poland. Equilib. Q. J. Econ. Econ. Policy 2018, 13, 707–723. [Google Scholar] [CrossRef] [Green Version]
  59. Balcerzak, A.P. Quality of institutions in the European Union countries. Application of TOPSIS based on entropy measure for objectiveweighting. Acta Politech. Hung. 2018, 17, 101–122. [Google Scholar] [CrossRef]
  60. Cheba, K.; Szopik-Depczyńska, K. Multidimensional comparative analysis of the competitive capacity of the European Union countries and geographical regions. Oeconomia Copernic. 2017, 8. [Google Scholar] [CrossRef] [Green Version]
  61. Balcerzak, A.P.; Pietrzak, M.B. Quality of Institutions for Knowledgebased Economy within New Institutional Economics Framework. Multiple Criteria Decision Analysis for European Countries in the Years 2000–2013. Econ. Sociol. 2016, 9, 66–81. [Google Scholar] [CrossRef]
  62. Szczuciński, P. The Use of Linear Ordering Methods for the Assessment of the Socio-Economic Development of Poviats in the Lubuskie Voivodeship. Metod. Ilościowe Bad. Ekon. 2016, 109–120. Available online: http://qme.sggw.pl/wp-content/uploads/MIBE_T17_z1.pdf (accessed on 15 December 2020).
  63. Czudec, W. Competitiveness of the Podkarpackie Voivodeship against Other Regions of Eastern Poland. Mod. Manag. Rev. 2013, 39–50. [Google Scholar] [CrossRef] [Green Version]
  64. Rogalska, E. Cluster analysis of entrepreneurship in Poland at NUTS3 level. In Globalization and Its Socio-Economic Consequences; University of Zilina: Zilina, Slovakia, 2016. [Google Scholar]
  65. Walczak, W. An Analysis of Business Competitiveness Factors. Available online: http://www.e-mentor.edu.pl/artykul/index/numer/37/id/784 (accessed on 2 November 2020).
  66. Gołębiewski, J.; Podlińska, O. The competitiveness of polish regions and European Union. In Problemy rozwoju regionalnego I lokalnego w Polsce; Krzyżanowska, K., Roman, M., Eds.; Wydawnictwo Urzędu Miejskiego w Pułtusku: Pułtusk, Poland, 2015; pp. 11–22. Available online: https://www.iz.sggw.pl/wp-content/uploads/problemy_rozwoju_regionalne.pdf (accessed on 12 December 2020).
  67. Skórska, A. R&D Activity as a Factor of Regional Competitiveness. Available online: https://www.polsl.pl/wydzialy/roz/zn/documents/zeszyt%20139/poprawione/sk%c3%b3rska.pdf (accessed on 12 December 2020).
  68. Borozan, D. Regional competitiveness: Some conceptual issues and policy implications. Interdiscip. Manag. Res. 2008, 4, 50–63. [Google Scholar]
  69. Storper, M. Community and economics. In Community, Economic Creativity, and Organization; Amin, A., Roberts, J., Eds.; Oxford University Press: New York, NY, USA, 2008; pp. 37–68. [Google Scholar]
  70. Competition in the Regions. Available online: https://ec.europa.eu/poland/news/170227_index_pl (accessed on 11 February 2021).
  71. Huovari, J.; Kangasharju, A.; Alanen, A. Constructing an Index for Regional Competitiveness. The Emergence of the Knowledge Economy. 2002, pp. 121–138. Available online: https://link.springer.com/chapter/10.1007/978-3-540-24823-1_7 (accessed on 11 December 2020).
  72. Dijkstra, L.; Annoni, P.; Kozovska, K. A New Regional Competitiveness Index: Theory, Methods and Findings; Regional Policy no 2; Publications Office of the European Union: Luxembourg, 2011; Available online: https://ec.europa.eu/regional_policy/sources/docgener/work/2011_02_competitiveness.pdf (accessed on 11 February 2021).
  73. Annoni, P.; Dijkstra, L. EU Regional Competitiveness Index RCI 2013. Available online: https://ec.europa.eu/regional_policy/sources/docgener/studies/pdf/6th_report/rci_2013_report_final.pdf (accessed on 11 February 2021).
  74. Annoni, P.; Dijkstra, L. The EU Regional Competitiveness Index 2019. Available online: https://ec.europa.eu/regional_policy/sources/docgener/work/2019_03_rci2019.pdf (accessed on 11 February 2021).
  75. Skórska, A. R&D Activity as a Factor of Regional Competitiveness. Scientific Papers of Silesian University of Technology, Organization and Management Series No. 139. 2019. Available online: https://www.polsl.pl/Wydzialy/ROZ/ZN/Documents/Zeszyt%20139/Poprawione/Sk%C3%B3rska.pdf (accessed on 10 February 2021).
  76. Budner, W. Business Location. Economic, Spatial, and Environmental Aspects; Wydawnictwo Akademii Ekonomicznej: Poznań, Poland, 2003; p. 47. [Google Scholar]
  77. Golejewska, A.; Gajda, D. Analysis of the Competitive Potential of Polish Regions, Analizy i opracowania Katedry Ekonomiki Integracji Europejskiej UG, 2012. Available online: http://gnu.univ.gda.pl/~keie/aio29.pdf (accessed on 10 December 2020).
  78. Gorzelak, G.; Jałowiecki, B. Regional Competitiveness. Studia Regionalne i Lokalne. 1981. Available online: https://www.infona.pl/resource/bwmeta1.element.desklight-e5c9630f-de01-4277-b6e7-810fc769f344 (accessed on 10 December 2020).
  79. Malkowski, A. A Multi-Dimensional Analysis of Spatial Disparity in the Socio-Economic Development of Voivodeships in Years 1999–2004. Available online: https://depot.ceon.pl/bitstream/handle/123456789/1251/Arkadiusz%20Malkowski%202007%20(2).pdf?sequence=1 (accessed on 24 November 2020).
  80. Sobala-Gwosdz, A. The Change in the Rural Standard of Living during the Transformation Period in the Podkarpackie Province; IGiGP Warsaw: Warszawa, Poland, 2004; pp. 93–106. [Google Scholar]
  81. Wlaźlak, K. Regional Development as a Mission for the Public Administration; Warszawa: Wolters Kluwer Polska, Poland, 2010; pp. 45–46. [Google Scholar]
  82. Berger, I. An overview and analysis on indices of regional competitiveness. Rev. Econ. Financ. 2011, 1, 17–33. [Google Scholar]
  83. Dimian, G.C.; Danciu, A. National and regional competitiveness in the crisi context. Successeful exemples. Theor. Appl. Econ. 2011, 67–78. Available online: https://core.ac.uk/download/pdf/26774988.pdf (accessed on 1 December 2020).
  84. Zeliaś, A. Dobór Zmiennych Diagnostycznych. W: Taksonomiczna Analiza Przestrzennego Zróżnicowania Poziomu Życia w Polsce w ujęciu Dynamicznym; Wydawnictwo Akademii Ekonomicznej w Krakowie: Kraków, Poland, 2000. [Google Scholar]
  85. Roczniki Statystyczne Województw 2018. Available online: https://stat.gov.pl/ (accessed on 10 December 2020).
  86. Młodak, A. Analiza Taksonomiczna w Statystyce Regionalnej; Difin: Warszawa, Poland, 2006. [Google Scholar]
  87. Nowicki, M. Raport o Konkurencyjności Województwa Pomorskiego; Urząd Marszałkowski Województwa Pomorskiego: Gdańsk, Poland, 2008. [Google Scholar]
  88. Wójciak, M. Competitiveness of Production Departments in Polish Economy; Wydawnictwo Akademii Ekonomicznej im. Karola Adamieckiego: Katowice, Poland, 2002; p. 47. [Google Scholar]
  89. Wierzbicka, W. Socio-Economic Potential of Cities Belonging to the Polish National Cittaslow Network. Oeconomia Coperinicana 2020. [Google Scholar] [CrossRef]
  90. Lieberson, S. Limitations in the Application of Non-Parametric Coefficients of Correlation. Am. Sociol. Rev. 1964, 29, 744–746. [Google Scholar] [CrossRef]
  91. Borowicz, A.; Kostyra, M.; Szlutka, S.; Wandałowski, M. Investment Appeal of Polish Voivodeships and Sub-Regions in 2016. Available online: https://www.ksse.com.pl/files/page/Centrum%20prasowe/Raporty/Atrakcyjnosc_inwestycyjna_2016-raport.pdf (accessed on 15 December 2020).
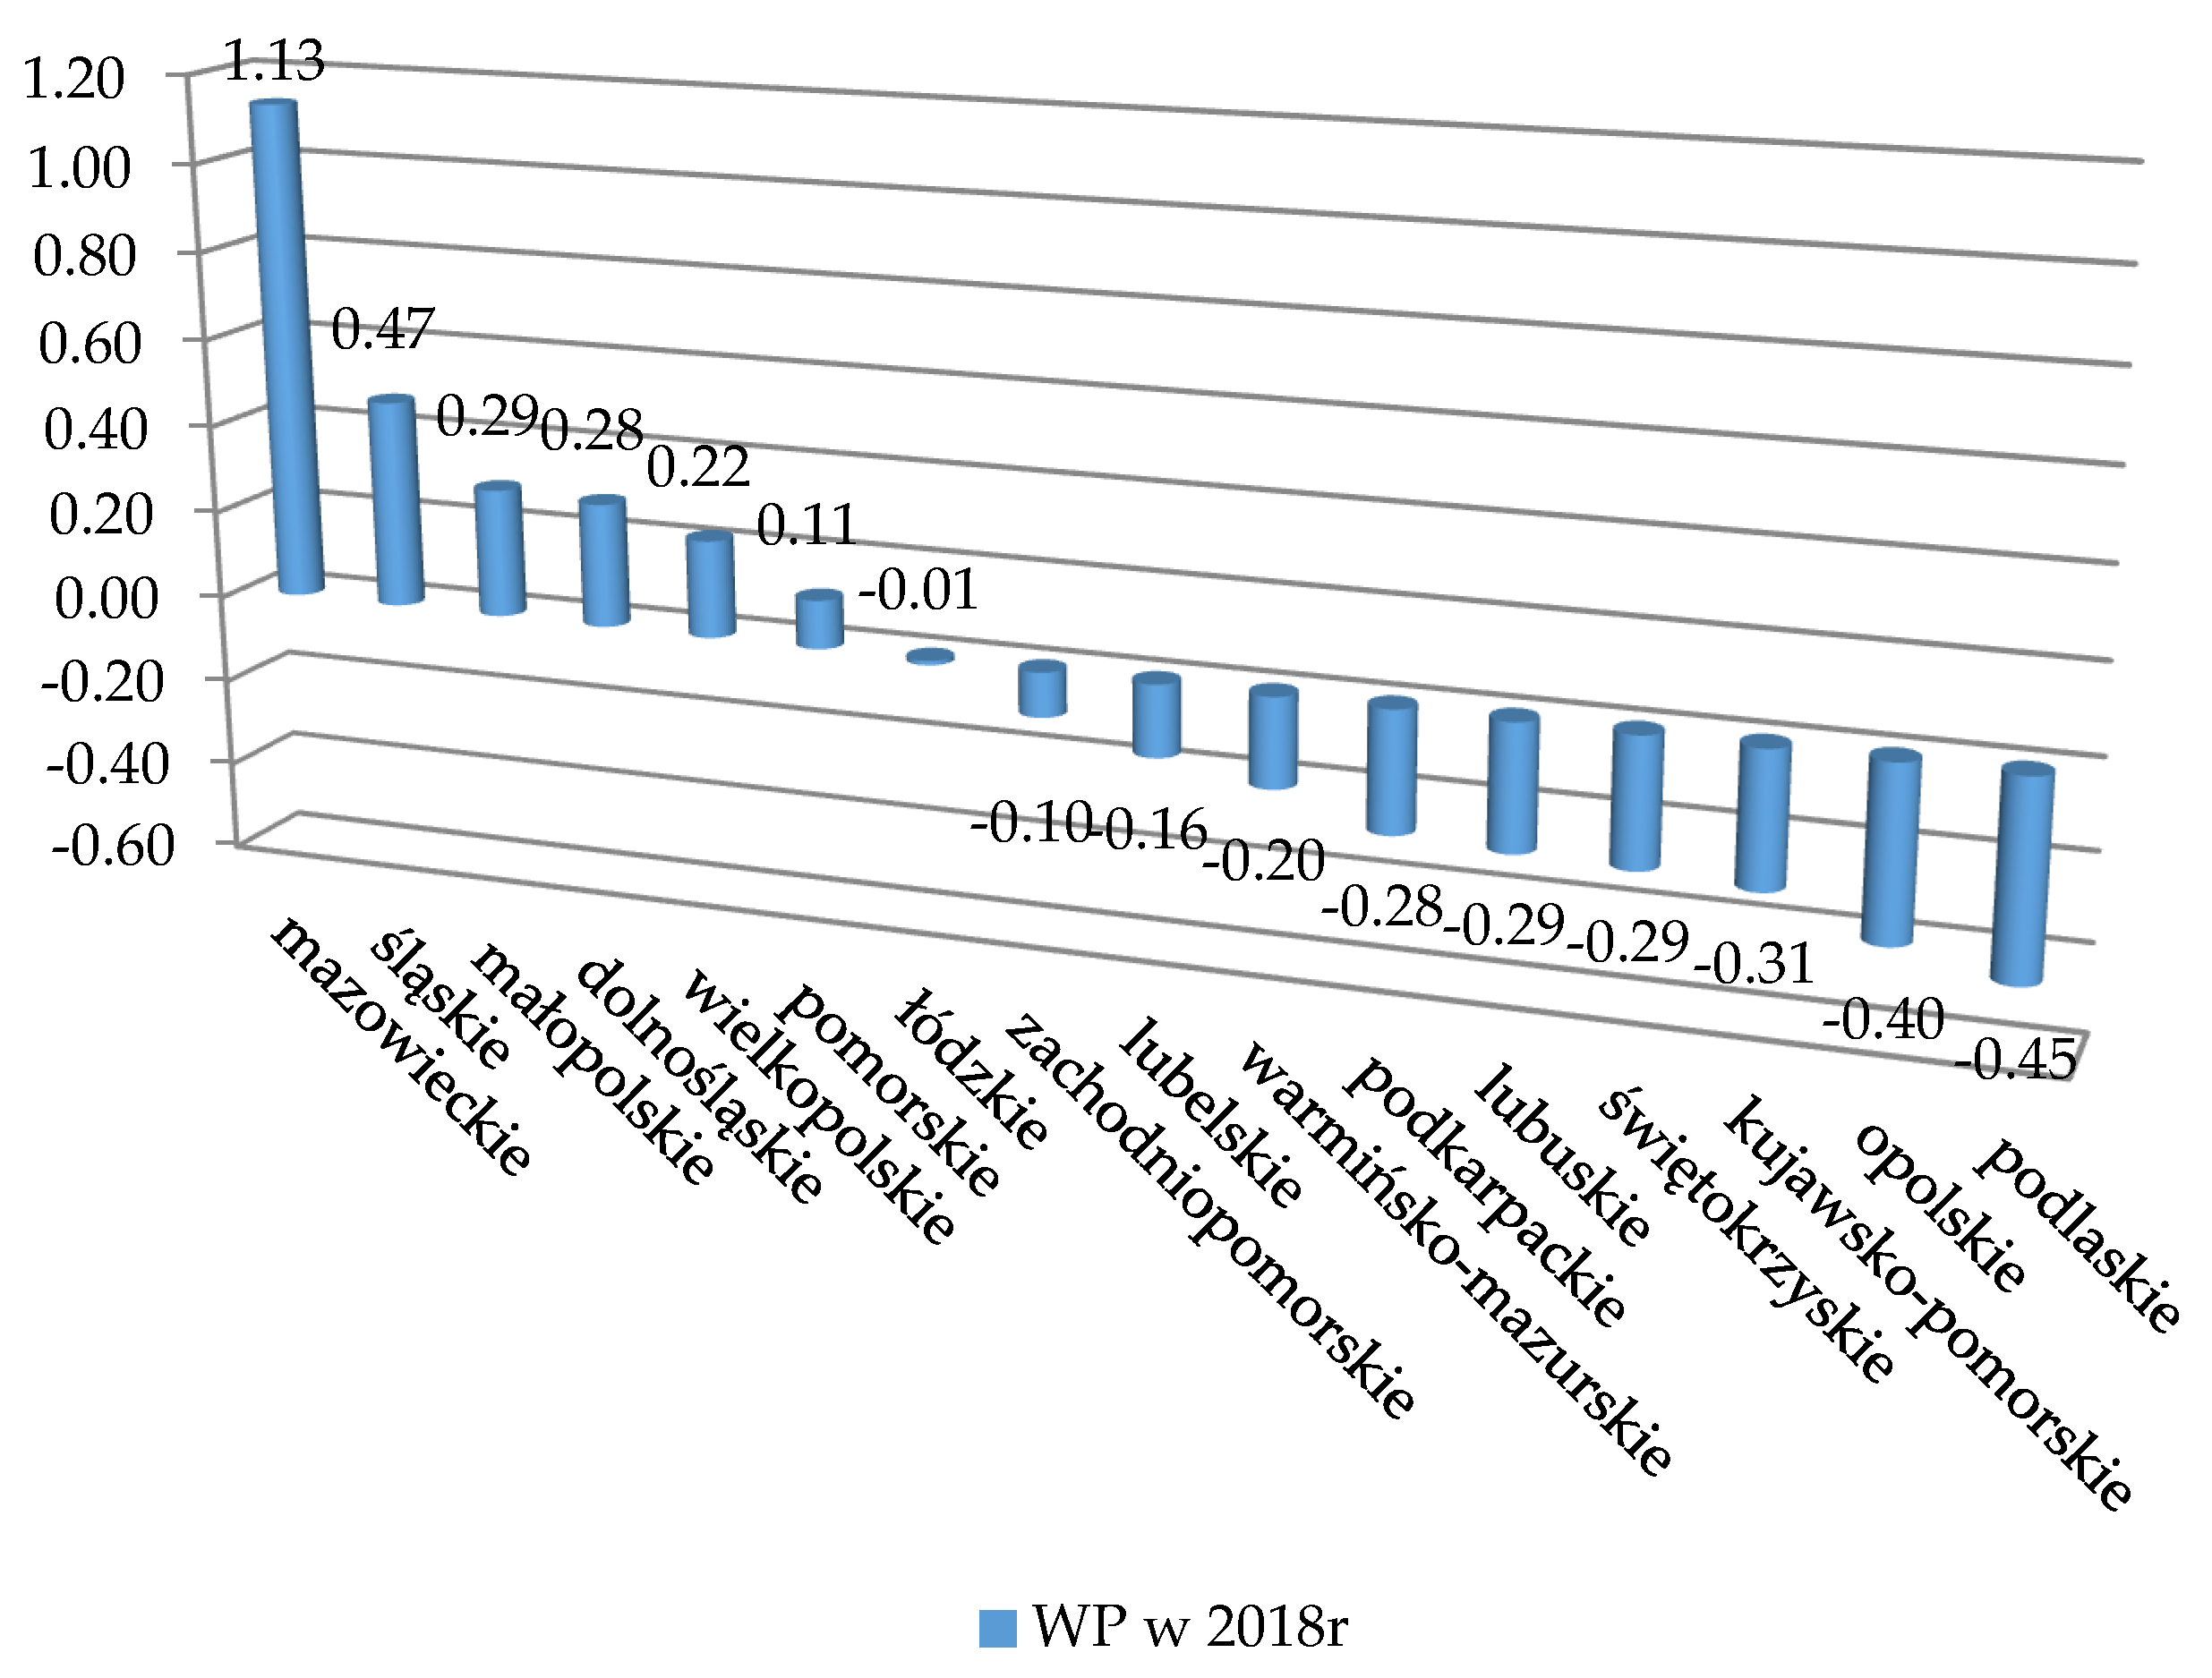
Figure 2. Perkal’s indicator level in 2018 r.
Sustainability 13 03202 g002
Figure 3. Typology of voivodeships according to the level of competitiveness in 2018.
Sustainability 13 03202 g003
Figure 4. Strong correlations according to Spearman’s rank-order.
Sustainability 13 03202 g004
Table 1. Ranking of provinces based on the RCI level of the indicator in years 2010–2019.
Ranking of Voivodeships
Lata
Rank2019 r.2016 r.2013 r.2010 r.
1ŚląskieMazowieckieMazowieckieMazowieckie
2MałopolskieŚląskieŚląskieŚląskie
3DolnośląskieMałopolskieMałopolskieMałopolskie
4PomorskieDolnośląskieDolnośląskieDolnośląskie
5MazowieckiePomorskieŁódzkieŁódzkie
6ŁódzkieŁódzkieOpolskieWielkopolskie
7WielkopolskieWielkopolskiePomorskiePomorskie
8OpolskieŚwiętokrzyskieLubelskieOpolskie
9ZachodniopomorskieLubelskieLubuskiePodkarpackie
10PodkarpackieZachodniopomorskieZachodniopomorskieZachodniopomorskie
11Kujawsko-PomorskieLubuskieWielkopolskieŚwiętokrzyskie
12LubelskiePodkarpackiePodlaskieLubelskie
13PodlaskieOpolskieŚwiętokrzyskieLubuskie
14ŚwiętokrzyskieKujawsko-PomorskiePodkarpackieKujawsko-Pomorskie
15LubuskiePodlaskieKujawsko-PomorskiePodlaskie
16Warmińsko-MazurskieWarmińsko-MazurskieWarmińsko-MazurskieWarmińsko-Mazurskie
Publisher’s Note: MDPI stays neutral with regard to jurisdictional claims in published maps and institutional affiliations.