Abstract
Green supply chain management has received increasing attention as consumers have become more environmentally conscious. Manufacturers are making green investments to meet consumers’ demands, while retailers in different markets often engage in cooperative promotion to attract more consumers. This study develops game theoretic models for investigating cooperative promotion for two cross-market firms with different channel structures, i.e., decentralized and centralized. The manufacturer determines the wholesale price for the retailers and the green investment of a product, and the retailers determine the promotional effort and retail price. This study finds that whether the firms join in cooperative promotion mainly depends on the wholesale price, as well as the impacts of the price, green investment, and cooperative promotional activities on the demand. When the wholesale price is relatively low, the retail price of the decentralized green supply chain must be lower than that of the centralized green supply chain. On the contrary, the difference in the retail price between the two green supply chains varies with the impacts of green investment and cooperative promotional activities on demand. In addition, due to the influence of channel structure, the contribution to cooperative promotion of the centralized supply chain is more than that of the decentralized supply chain with the most given conditions. Moreover, as the impact of cooperative promotional activities on demand increases, the centralized green supply chain does not necessarily result in higher profits than the decentralized green supply chain.
1. Introduction
In recent years, environmental issues have attracted more and more attention and the concept of green development has gradually attracted people’s attention, resulting in the birth of the green supply chain [1]. It is becoming more common for manufacturers to invest in green production to meet consumers’ demands, and retailers are attracting more consumers through various promotional activities. As they face fierce competition, retailers in different markets engage in cooperative promotion to seek more opportunities.
Over the past few decades, consumers have become increasingly concerned about the low-carbon economy and public environmental issues, so manufacturers have begun to increase their green investments to design environmentally green products [2]. Meanwhile, governments also support the green investments of enterprises—e.g., the US government provides subsidies to enterprises for purchasing electric vehicles [3], the Indian government has conducted a series of financial schemes to stimulate the widespread use of LED lights [4], and the Malaysian government has introduced a series of tax breaks and coupons to stimulate consumers to buy green products [5]. The above examples show that the green supply chain will be the focus of future development. In addition to the safe and efficient production of green products, how green products are promoted for customers effectively is also very important to the members of the green supply chain.
In addition to the support of governments and the efforts of manufacturers, retailers promote their products through various promotional activities. Especially in the home-building industry, it is common for cross-market firms to adopt cooperative promotion to promote their products. For example, Power Dekor, a flooring manufacturer selling formaldehyde-free and non-hazardous gases, cooperates with Fotile, which is committed to providing consumers with a safe and green kitchen environment, by jointly making advertisements and issuing green consumer coupons to attract more consumers. Sofia, a whole-house-customization manufacturer, collaborates with Gree, a home appliance company, to conduct a series of promotional activities to provide consumers with a green and intelligent living environment. In addition, Oppein has joined forces with Monalisa, DeRUCCI, Nature, Wanhua, Kujiale, and Dorothy to launch China’s pan-home industry, which is the most influential “Green Habitat Alliance”, to jointly promote their brands. The cooperation between such cross-market firms can not only provide a greener living environment for consumers, but also greatly enhances the brand values and social impacts of their products. In addition, there are many other cross-market brand partnerships that aim to better promote the partners’ products by sharing the expenses of promotional activities in some of China’s largest shopping malls, e.g., Easyhome and MACALLINE. Moreover, under such cross-market collaboration schemes, the partnering firms may have different supply chain channel structures, i.e., decentralized and centralized. The firms’ channel structures have significant impacts on cooperative promotion and the optimal decisions of the partners.
The above anecdotal evidence indicates that collaboration between firms operating in different markets for the efficient development of their green supply chains is an emerging issue that needs to be addressed. Although it is common in practice that cross-market firms cooperate in promoting their products/services, there are few studies on such collaborations. Firms have no knowledge about how to make the best decisions in their collaborations or what the implications of the collaborations for their corresponding green supply chains are. Moreover, the potential theoretical implications of cooperation for firms are unknown. To fill the above gap, this study researches the impacts of cooperative promotion of two cross-market firms on their optimal decisions and the sustainable development of their green supply chains. Specifically, this study develops game-theoretic models to address the following problems: (1) Under what conditions is such cooperation for two cross-market firms feasible? (2) What are the impacts of the channel structure on the cooperation and optimal decisions of the involved parties? (3) What are the impacts of cooperative promotion on the firms’ optimal strategies and their supply chains?
The rest of this study is organized as follows: In Section 2, this study provides a brief review of the literature to identify the research gap and the position of the study. In Section 3, this study presents the model description. In Section 4, this study derives the Nash equilibrium solutions and the findings about the cooperative promotion between two cross-market firms. In Section 5, this study detects the impacts of cooperative promotion on the green supply chains in an asymmetric situation. Finally, in Section 6, this study concludes the paper, discusses the managerial implications of the results, and suggests topics for future research.
2. Literature Review
As more and more environmental factors have profound impacts on people’s lives, a large amount of research has been done on green supply chains [6]. In addition, price, inventory management, and advertising are of great significance for improving the efficiency of overall supply chains [7].
With respect to the channel coordination of a green supply chain, a manufacturer creates four different forms of contracts with a fairness-focused retailer to pursue the channel coordination. Along with the changes in the retailer’s attitude of fairness, the optimal decisions of participants and the supply chain will also vary with different type of contracts [8]. Hong and Guo [9] took the green consciousness of all stakeholders in the supply chain into account, with the manufacturers being responsible for producing green products and the retailers for advertising and promoting green products in the marketplace. It is beneficial for the environmental protection to sign a cost-sharing contract between the retailer and manufacturer, but their optimal profits will vary with different cooperation contracts.
With three different channel structures, i.e., centralized, decentralized, and cooperative, Basiri and Heydari [10] sought the optimal price, promotional effort, and green investment for an alternative green product when a product was already on the market. Dong et al. [11] showed that a manufacturer’s investment in a green product will result in higher profits for the members of the supply chain, while the manufacturer pays less in environmental taxes. In addition, whether the retailer invests in a green product mainly depends on the effects of the competitor’s green investment, the intensity of competition, and the manufacturer’s green investment. When the retailer invests less efficiently in green products, the retailer will not necessarily earn higher profits due to green costs, etc. [2]. Considering the reverse logistics of supply chains, Hosseini-Motlagh et al. [12] studied the impact of a manufacturer’s energy-saving effort and re-manufacturing on environmental sustainability, as well as the optimal decisions of two competing retailers. In addition, the conservation of resources, reduction of waste, and minimization of energy consumption are the main objectives of the green supply chain at present. Iqbal et al. [13] derived the most suitable model for minimizing waste in the production of primary and secondary products, as well as reverse logistics—when a manufacturer uses raw materials to produce new products in the first stage, and the new products are produced by recycling old products in the second stage. Wei et al. [14] analyzed the optimal green investment, price, and discount of products, in addition to exploring which participants should collect the old products.
With intensified globalization and fast resource depletion, the circular economy has been widely proposed to address the issue of resource conservation. Vinante et al. [15] summarized the indicators for evaluating whether an enterprise has contributed to the circular economy, and made recommendations for more scientific evaluation of firms. Similarly, Sassanelli et al. [16] considered how to evaluate the performance of the circularity of enterprises. In the context of the circular economy, manufacturers are facing increasing competitive pressure. Conducting a comprehensive analysis of the various approaches taken by manufacturers to achieve sustainable development, based on 31 studies, Sassanelli et al. [17] provided practical suggestions for a better design of green products and a design for circular development. Facing the requirements of sustainable development, the concepts of re-manufacturing design and environmentally friendly design have gradually emerged. Go et al. [18] proposed a strategy for multi-generational recycling over the entire life cycle, from pre-manufacturing to post-use. In order to achieve the sustainable development of society, the concept of the circular economy has gradually been emphasized, and enterprises need to realize the transformation from the traditional business model to the sustainable circular development model [19]. Moreover, Moreno et al. [20] suggested ways to adopt a new business model in order to realize the circular economy.
There is also a growing body of research on the inventory management and logistics of green supply chains [21,22,23,24]. Parsaeifar et al. [7] found that the greater the competition among retailers is, the higher the retailers’ profits are. On the contrary, the greater the competition among suppliers is, the lower the retailers’ profits are. Their findings also helped with the better inventory management of closed-loop supply chains. Considering carbon emissions, Huang et al. [25] analyzed the impacts of different carbon policies, i.e., limited total carbon emissions, a carbon emissions tax, and carbon credit trading, on the production, transportation, and inventory of a supply chain. The findings will help firms reduce carbon emissions, costs, and inventory levels. With a supply chain consisting of a manufacturer and multiple retailers, Wang and Ye [24] researched the impact of carbon emissions on the optimal inventory management and price with just-in-time or economic order quantity inventory models. With respect to the impact of transport fleets on the environment, Mohtashami et al. [6] applied the queuing theory to optimize the energy consumption of transport fleets in forward and reverse logistics, as well as the transport network. Moreover, Dey and Saha [26] considered three different sourcing models; a retailer’s participation in the manufacturer’s green decisions can increase the retailer’s profit, but can decrease the product’s greening level.
The government often provides an incentive policy for manufacturers to produce green products, reduce carbon emissions, etc. Nielsen et al. [27] compared the government’s social welfare, the manufacturer’s profit, and consumers’ utility under single- and two-period procurement decisions. The results showed that all participants of the supply chain can earn higher profits in the presence of incentives. Moreover, for when the government provides a subsidy mechanism to the manufacturer and supplier, Sun et al. [1] studied the impacts of green investment and the various subsidy mechanisms on the establishment of a stable green supply chain. Kuiti et al. [28] examined the impacts of carbon cap-and-trade policies on participants between centralized and decentralized supply chains. Simultaneously, they demonstrated the importance of an carbon emissions trading market and explored which type of profit-sharing contract between a manufacturer and retailer is optimal.
In addition, some studies have focused on how the supply chain structure can be designed to reduce carbon emissions and operating costs with an uncertain demand [29]. Yang et al. [30] conducted a comparative analysis to find the optimal benefit-sharing contract along when a manufacturer provides trade credit to both retailers, only one retailer, or neither. With respect to the effects of intermediaries on the green supply chain, Nielsen et al. [31] found that dominant intermediaries can induce a retailer to produce products at a lower green cost while both the manufacturer and retailer can earn higher profits. With different supply chain structures, i.e., decentralized and centralized, the optimal decisions on inventory and price for participants will also vary. Considering the green sensitivity of consumers, the optimal microfinance interest rates and cooperation mechanisms for raw material suppliers were studied to pursue sustainable development [32].
In recent years, with the increasing awareness of environmental protection and the investment of manufacturers in green products, retailers have also joined in cooperation to promote green products. However, literature addressing the influence of channel structure, as well as cooperative promotion, on the performance of involved players is scarce. Table 1 indicates the positioning of this paper in the literature. To fill this research gap in the literature, this study derives results that help cross-market firms better pursue cooperation and make optimal decisions. The success of cooperation can not only enhance their competitiveness, but also attract more customers. In conclusion, this study produces theoretically significant results with profound management implications that promote research on and practice of the green supply chain.

Table 1.
Positioning of this paper in the literature.
3. Model Description
Before introducing the mathematical model, this study will first define the notation used throughout the paper, as shown in Table 2, followed by a presentation of the model description.
Table 2.
Notation used throughout the paper.
This study considers the cooperation between two firms that are facing fierce competition and that belong to different supply chains, denoted as supply chain i. In addition, this study assumes that the two green supply chains have different channel structures, i.e., supply chain 1 is decentralized and supply chain 2 is centralized. The retailer in supply chain 1 purchases the product from the manufacturer at the wholesale price and sells it to consumers at the retail price p. Hence, we adopt the subscripts and to donate the manufacturer and retailer in supply chain 1, respectively. Similarly, we adopt the subscripts to donate the centralized green supply chain 2.
This study denotes the effort of undertaking cooperative promotional activities in green supply chain i as , which is the decision variable for retailer 1 in supply chain 1 and the whole supply chain 2 [33]. In addition, this study denotes the green investment of manufacturer 1 or supply chain 2 as [7,10]. Following McGuire and Staelin [34] and Choi [35], this study assumes that consumers’ demand for product i, , is negatively proportional to the price of product . In addition, the product demand of supply chain i increases with its effort of green investment and its effort of undertaking cooperative promotional activities [10,33]. This study also assumes that the two supply chains’ actions have symmetric effects, i.e., the effects of the prices on demand , the effects of their efforts of undertaking cooperative promotional activities on demand , and the effect of the effort of investing in greenness, on demand are the same in each demand function [2,36].
4. The Model
This study focuses on helping cross-market firms promote their products more effectively through cooperative promotion. This study develops a game-theoretic model to analyze the pros and cons of pursuing cooperative promotion between two firms that operate in different markets. This study first formulates the demand and profit functions of two green supply chains with decentralized and centralized structures. This study then derives the equilibrium solutions, analyzes their properties, and discusses their managerial implications. Finally, this study analyzes and compares the equilibrium solutions to explore the impact of cooperative promotion on the supply chains. This study presents the proofs of all of the results in Appendix A.
4.1. Demand and Profit Functions
This study assumes the unit costs of production of two products as 0 [33]. When the two firms conduct cooperative promotion, they perform promotional activities to attract consumers simultaneously, while each decides on their green investment. Thus, the demand functions of the two products are given by
Because the firms are in different markets, there is no leadership between them, and they make the optimal decisions simultaneously. Within supply chain 1, the manufacturer decides on the green investment , and the retailer decides on the effort of cooperative promotion . In addition, and are the decision variables of supply chain 2. Following Chu [37] and Karray [36], this study assumes that the promotional cost is quadratic in the effort of undertaking promotion. So, is the promotional cost of supply chain i with regard to undertaking cooperative promotional activities. This study denotes the green investment as [12,31]. Therefore, the profit functions of the involved players under cooperative promotion are as follows:
In Equations (2) and (3), the first terms are the revenues of the manufacturer and retailer of supply chain 1, and the second terms are the costs of undertaking the cooperative promotional activities and green investment. Similarly, in Equation (4), the first term is the whole supply chain’s revenue, the second term is the green investment, and the third term is the cost of undertaking the cooperative promotional activities. , , and are all positive.
4.2. Equilibrium Solutions
Based on the developed model, this study derives the equilibrium outcomes of the involved players.
The two firms make decisions simultaneously to independently maximize their profits. This study derives the Nash equilibrium solutions by solving the first-order conditions to obtain the equilibrium solutions, as shown in Table 3. In addition, to ensure the success of cooperation, all of the results in both models must be positive, i.e., , , , , , , , and .
Table 3.
Equilibrium solutions.
4.3. Model Analysis and Comparison
Based on the equilibrium solutions obtained above, this study first analyzes the conditions under which the cross-market firms will pursue cooperative promotion. This study then researches the two firms’ optimal decisions to examine the effects of cooperative promotion on the involved players and their corresponding supply chains.
This study identifies the necessary conditions for positive equilibrium solutions by solving the first-order conditions from the equilibrium solutions obtained in Table 3, as well as , to derive the conditions under which the firms will adopt cooperative promotion. Then, this study compares the two firms’ optimal prices, green investments, contributions to cooperation, and profits to examine the effects of cooperative promotion.
Proposition 1.
Cross-market firms will pursue cooperative promotion primarily depending on the wholesale price, as well as the impacts of price, green investment, and cooperative promotional activities on demand.
Under the defined conditions, the two firms can seek more opportunities and pursue the sustainable development of green supply chains by participating in cooperative promotion. Due to the decentralized channel structure of the supply chain, the manufacturer’s wholesale price is important for the retailer. For instance, when the wholesale price is relatively low (e.g., ), the impacts of green investment and the cooperative promotional activities on demand also vary in the corresponding interval so as to ensure that the firms can make optimal decisions.
In addition, this study compares the equilibrium solutions between two firms to ascertain the impacts of cooperative promotion.
Proposition 2.
Comparing the retail price yields the following:
- (1)
- When the wholesale price is relatively small, the retail price of the decentralized supply chain is lower than that of centralized supply chain.
- (2)
- When the wholesale price is relatively large, the retail price of the decentralized supply chain is not necessarily lower than that of the centralized supply chain.
When the wholesale price varies, so does the difference between the retail prices of two firms. When the wholesale price is relatively low, i.e., , the retailer in the decentralized supply chain can attract more consumers with the relatively lower retail price while promoting the sustainable development of the supply chain. On the contrary, when the wholesale price is relatively high, i.e., , the retail price of the retailer in the decentralized supply chain is not necessarily lower than that in the centralized supply chain, partly due to the higher wholesale price. In addition, in order to attract more consumers and generate higher profits, the retail price will vary with the impacts of the green investment and cooperative promotional activities on demand.
Proposition 3.
When comparing the costs of cooperative promotion, this study observes that the retailer in the decentralized supply chain spends more than that in the centralized supply chain under most of the stated conditions.
The retailer in the decentralized supply chain has to pay for the expenses of cooperative promotional activities in addition to the wholesale cost of the product to the manufacturer. In contrast, in the centralized supply chain, the resources can be pooled together to invest in cooperative promotion to attract more consumers. Therefore, under most of given the conditions, the centralized supply chain can invest more in cooperative promotion to seek higher profits. Specially, when and , the difference in the contributions to cooperative promotion will be the opposite. That is, when the manufacturer’s wholesale price is relatively high and the impact of cooperative promotion on demand is relatively small, the retailer in the decentralized supply chain is willing to put more effort into cooperative promotion to attract more consumers.
Proposition 4.
The wholesale price, as well as the impacts of green investment and cooperative promotional activities on demand, mainly affects the difference in profits between two green supply chains.
When the firms carry out cooperative promotion, with variations in the wholesale price and the effects of green investment and cooperative promotional activities on demand, the decentralized supply chain will not necessarily obtain a higher profit than the centralized supply chain. Under most of the given conditions, the difference in profits between the decentralized and centralized supply chains decreases as the impact of cooperative promotional activities on demand increases. The retailer itself is better at boosting profit through various promotional activities in the market, and the manufacturer focuses on designing green products. As the impact of cooperative promotion on demand increases, the profitability of the decentralized supply chain is relatively higher. In particular, compared with the decentralized supply chain, the centralized supply chain is likely to gain more profit as the impact of cooperative promotion on demand increases. In other words, the difference in green investment between two supply chains changes with the wholesale price, as well as the impacts of green investment and cooperative promotional activities on demand; the centralized supply chain can better integrate resources and obtain higher profit than the decentralized supply chain.
5. Extended Models
In order to further study the impact of cooperative promotion on the green supply chain and expand the applicability of the above model, the asymmetric case is considered in this section.
In the above model, the study assumes that the impacts of price, cooperative promotional activities, and green investment on demand are the same. This study relaxes these assumptions by assuming that , , and are different. Therefore, the profit functions of the players in the asymmetric case are as follows:
To more clearly demonstrate the impacts of cooperative promotion on the players, numerical studies are conducted to investigate changes in the price, effort of promotional activities, green investment, and profit, i.e., , , , and , between the two green supply chains. We assume , , , , , and to examine the impacts of cooperative promotion on the green supply chains. The study shows the results in Figure 1, Figure 2, Figure 3 and Figure 4.
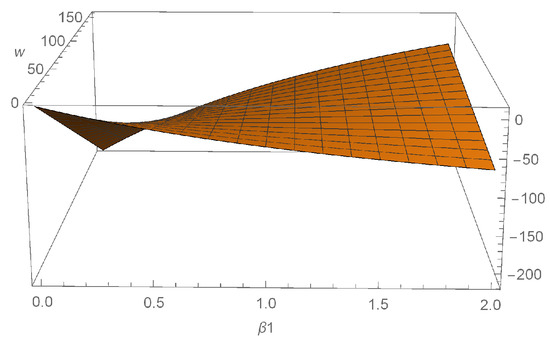
Figure 1.
Differences in price between the two supply chains.
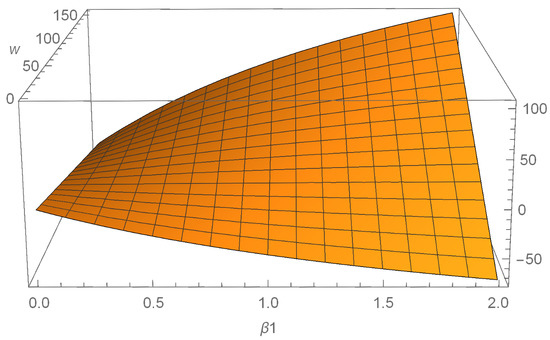
Figure 2.
Differences in effort of promotional activities between the two supply chains.
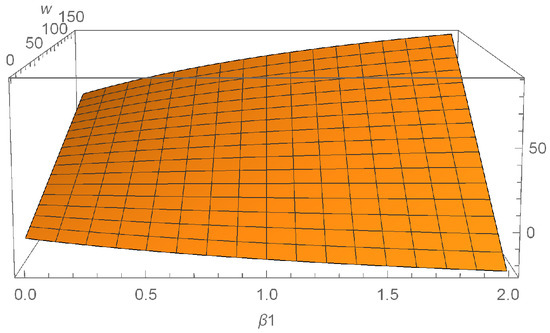
Figure 3.
Differences in green investment between the two supply chains.
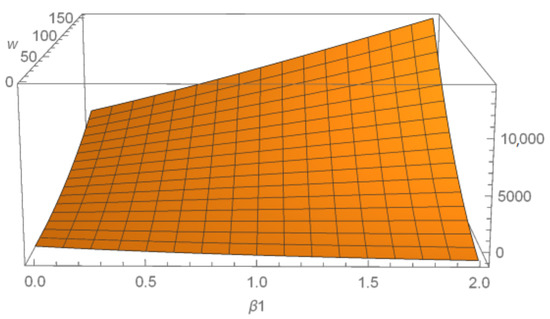
Figure 4.
Differences in profit between the two supply chains.
The results show that the retail price of the centralized supply chain must be lower than that of the decentralized supply chain due to the double marginal effect. In addition, the green investment and the expenditure on cooperative promotion of the centralized supply chain are mainly influenced by the wholesale price, as well as the effects of price, green investment, and cooperative promotional activities on demand. Therefore, in actual cooperations, firms should weigh the investment in green products and the expenditure on cooperative promotion according to the actual situation for profit maximization.
6. Discussions and Conclusions
First, the important findings and contributions of this study are summarized, followed by a discussion of the limitations and suggestions of topics for future research.
6.1. Discussions
This study considers cooperative promotion between a supply chain with a centralized channel structure and a supply chain with a decentralized channel structure. The study first analyzed the factors that determine whether cooperative promotion is feasible. Then, it analyzed the impacts of cooperative promotion and the channel structure on the optimal decision-making of the players.
The main findings are as follows: (1) The success of cooperative promotion depends not only on the wholesale price of the manufacturer, but also on the effects of the price, cooperative promotion, and green investment on demand. (2) When the wholesale price is relatively low, the retail price of the decentralized green supply chain must be lower than that of the centralized green supply chain. Conversely, comparisons between the retail prices of the two green supply chains vary as the impacts of green investment and cooperative promotion on demand change. (3) The retailer in the decentralized supply chain is always less willing than that in the centralized supply chain to pursue cooperative promotion in the most feasible intervals due to the influence of the manufacturer’s wholesale price. As the impacts of cooperative promotion and green investment on demand change, the retailer in the decentralized supply chain may be more willing to pay more for cooperative promotion than that in the centralized supply chain. (4) As the wholesale price and the impacts of green investment and cooperative promotion on demand change, so does the difference in green investment in products between the two green supply chains. (5) The difference in the profits of the two green supply chains changes as the wholesale price and the effects of cooperative promotion and green investment on demand vary. In addition, the difference in their profits decreases in most feasible domains.
This study makes three contributions: (1) This study analyzes cross-market firms’ optimal strategies for cooperative promotion, their profitability, and the impacts of cooperative promotion on their corresponding supply chains. (2) Differently from previous studies, which mostly focused on cooperation between firms selling competitive and complementary products, this study considers the cooperation of cross-market firms belonging to two green supply chains with different channel structures. (3) The findings can help cross-market firms in managing cooperative promotion more effectively and improving their profitability, thus further promoting the sustainable development of their respective supply chains.
6.2. Conclusions
This study investigated cooperative promotion between two cross-market firms and how it affects the players’ optimal decisions and their corresponding supply chains. With the continuous enhancement of people’s awareness of environmental protection, the government and various institutions have strengthened their support for enterprises’ green investments. While ensuring the efficient production of green products, finding how more consumers can be attracted to purchase green products has become increasingly important. Hence, cross-market firms have increasingly pursued cooperative promotion to promote their products together. In this context, this study identified the factors that drive cross-market firms to participate in cooperative promotion and examined the effects of cooperative promotion on the firms and their corresponding supply chains. This study developed game-theoretic models to address the posed research questions. The findings can help managers in making more rational decisions and pursuing cooperative promotion more efficiently and effectively.
Future research could consider the risk attitudes of the players and the contract options in studying the profit distribution problem. In addition, it is desirable to consider the impacts of different preferential methods on cooperative promotion. For instance, when two firms conduct cooperative promotion by giving coupons to consumers, it is worth studying if the coupons should be issued by the manufacturer, the retailer, or both. Moreover, future research could explore the impacts of the coupon cost-sharing ratio on the optimal decision-making of the participants.
Author Contributions
Conceptualization, K.Y. and G.H.; methodology, K.Y. and G.H.; software, K.Y. and G.H.; validation, K.Y., G.H. and T.C.E.C.; formal analysis, K.Y., G.H. and T.C.E.C.; investigation, K.Y., G.H. and T.C.E.C.; writing—original draft preparation, K.Y., G.H. and T.C.E.C.; writing—review and editing, K.Y., G.H. and T.C.E.C. All authors have read and agreed to the published version of the manuscript.
Funding
This research was supported by the National Natural Science Foundation of China (NSFC) under grant number 71831001, the Beijing Logistics Informatics Research Base, and the Fundamental Research Funds for the Central Universities under grant number 2020YJ050.
Institutional Review Board Statement
Not applicable.
Informed Consent Statement
Not applicable.
Data Availability Statement
Not applicable.
Acknowledgments
The authors would like to thank two anonymous reviewers for their thoughtful comments and suggestions on the manuscript.
Conflicts of Interest
The authors declare no conflict of interest.
Appendix A
Appendix A.1. Proof of Proposition 1
This study seeks the optimal solutions for the corresponding variables by maximizing the profits of the involved players undertaking cooperative promotion. First, the profit function has its maximum values when the Hessian matrix is negative definite. Then, according to the requirement that the relevant variables are positive, we derive the feasible conditions for the cooperation.
Appendix A.1.1. The Hessian Matrix of Models
First, it is necessary for the Hessian matrix and to be negative definite for two supply chains, so and . So, we can conclude that and .
Appendix A.1.2. Equilibrium Solutions of Cooperative Promotion
Additionally, this study solves the second-order conditions , where
to derive the equilibrium solutions in Table 3.
The other necessary conditions are , , , , , , , and .
Analysis of
When the denominator is equal to 0 and , this study discusses the numerator as follows:
- (1)
- When , i.e., ,So, and , .
- (2)
- When , i.e., ,
Here, this study focuses on the above difference and sets . The discriminate of the nominator equals , and the solutions are and when , , and and when , , and .
- (1)
- When ,
- (2)
- When ,
- (3)
- When , , and ,
Similarly, this study assumes and focuses on the nominator of the above difference. The discriminate of the nominator is equal to . The solutions are and .
So, , if , , and if , .
- ①
- When , , , and , .
- ②
- When ,
So, if , , and , . If , , and , . Similarly, we can conclude that if , , and , . If , , and , . If , , and , .
In addition, the changes in signs for , , and are consistent, as shown in Table 3. So, when , and .
Analysis of
When the nominator equals 0, this study assumes that .
So, when , . When and , . When and , .
Similarly, , when , , and when , .
so , and when , . In sum, when , , , and . When , , if , and if , .
So, we can conclude that if and , . If , , and , . If , , and , . If , , and , . When , , if or , . When , , if or , .
Analysis of
Similarly, this study assumes that , so the nominator is equal to . We first investigate , the discriminate of which equals . The solutions are and .
- (1)
- When , , and , .
- (2)
- When , , if the denominator is equal to 0, this study assumes ..
For the sake of clarify, we study the nominator of the above difference, and the discriminate equals . Similarly, ; when , , and when , .
So, if , , and , . If , , and , . If , , and , .
- (3)
- When and ,
- (4)
- When ,
So, when and , .
In addition, this study analyzes the endpoint values, etc. that are derived from the above analysis.
So, when , . When , if , , and if , .
Analysis of p1 − ω
- (1)
- When ,
- ①
- When ,
Similarly, when the nominator equals 0, we focus on analyzing .
So, if and , .
- ②
- When ,if , .
So, if , , and , .
If , .
So, if , , and , .
Similarly, when , we focus on .
So, we can conclude that if , , and , . If , , and , .
- (2)
- When ,
- ①
- When , i.e., ,, so this is invalid.
- ②
- When ,
we can similarly get, when and , . When , if , , and if , .
So, when , , and , .
In sum, we can conclude that the feasible conditions for the cross-market cooperation of two supply chains with different channel structures are: When , , and ; when , if , and ; if , , and ; if , , and or , and .
Appendix A.2. Proof of Proposition 2
This study compares the contribution of cooperative promotion to further discuss the effect of cooperative promotion on the two firms.
Similarly, this study assumes in order to study the nominator. The discriminate equals . The solutions are and . , so and .
So, and . When and , .
Similarly, the discriminate of the nominator equals .
and .
So, when , and , and when , and . In addition, , , and .
So, when , and if , . If and , , or , .
When and , if , , and if , . When , , and , . When and , . When and , if , , and if , .
Appendix A.3. Proof of Proposition 3
Similarly, this study assumes that in order to study . The discriminate equals . So, when , . When or , .
- (1)
- When ,
- ①
- When , , and , .
- ②
- When ,
So, if , , and , . If , , and , . If , within the feasible domain.
- (2)
- When , and when , the solutions are and .
So, when , and . When , and .
So, we can get , , , and . When , and . When , and .
So, if , , and , . If , , and , .
- (3)
- When ,
, , , , , and .
So, if , or and , .
Because , , , and , when , ; if , , and if , . When and , within the feasible domain.
Appendix A.4. Proof of Proposition 4
So, when , , and when , .
So, when , , and , . When , if and , . If , when , , and when , . When , if and , , and if , . When , and , . Similarly, when and , the difference of is consistent with the above analysis.
Based on the above-derived interval in which cooperative promotion is feasible, the difference in overall profitability of the two supply chains is analyzed. It is difficult to clearly analyze the profit trends on all feasible intervals through mathematical analysis, so this study uses numerical analysis to derive the results, as shown in the following figure.

Figure A1.
Differences in profit for cooperative promotion.
References
- Sun, H.; Wan, Y.; Zhang, L.; Zhou, Z. Evolutionary game of the green investment in a two-echelon supply chain under a government subsidy mechanism. J. Clean. Prod. 2019, 235, 1315–1326. [Google Scholar] [CrossRef]
- Yan, Y.; Zhao, R.; Chen, H. Prisoner’s dilemma on competing retailers’ investment in green supply chain management. J. Clean. Prod. 2018, 184, 65–81. [Google Scholar] [CrossRef]
- Helveston, J.P.; Liu, Y.; Feit, E.M.; Fuchs, E.; Klampfl, E.; Michalek, J.J. Will subsidies drive electric vehicle adoption? Measuring consumer preferences in the US and China. Transp. Res. Part Policy Pract. 2015, 73, 96–112. [Google Scholar] [CrossRef]
- Ujala, Y. Free LED Bulb Scheme—PM Jan Dhan Yojana. 2015. Available online: http://pmjandhanyo.jana.co.in/ujala-free-led-bulb-scheme-9-price/ (accessed on 18 October 2018).
- MIDA. Malaysian Investment Development Authority? Tax Incentives for Green Industry. 2018. Available online: http://www.mida.gov.my/home/tax-incentives-for-green-industry/posts/ (accessed on 21 October 2018).
- Mohtashami, Z.; Aghsami, A.; Jolai, F. A green closed loop supply chain design using queuing system for reducing environmental impact and energy consumption. J. Clean. Prod. 2020, 242, 118452. [Google Scholar] [CrossRef]
- Parsaeifar, S.; Bozorgi-Amiri, A.; Naimi-Sadigh, A.; Sangari, M.S. A game theoretical for coordination of pricing, recycling, and green product decisions in the supply chain. J. Clean. Prod. 2019, 226, 37–49. [Google Scholar] [CrossRef]
- Qian, X.; Chan, F.T.; Zhang, J.; Yin, M.; Zhang, Q. Channel coordination of a two-echelon sustainable supply chain with a fair-minded retailer under cap-and-trade regulation. J. Clean. Prod. 2020, 244, 118715. [Google Scholar] [CrossRef]
- Hong, Z.; Guo, X. Green product supply chain contracts considering environmental responsibilities. Omega 2019, 83, 155–166. [Google Scholar] [CrossRef]
- Basiri, Z.; Heydari, J. A mathematical model for green supply chain coordination with substitutable products. J. Clean. Prod. 2017, 145, 232–249. [Google Scholar] [CrossRef]
- Dong, C.; Liu, Q.; Shen, B. To be or not to be green? Strategic investment for green product development in a supply chain. Transp. Res. Part Logist. Transp. Rev. 2019, 131, 193–227. [Google Scholar] [CrossRef]
- Hosseini-Motlagh, S.M.; Johari, M.; Ebrahimi, S.; Rogetzer, P. Competitive channels coordination in a closed-loop supply chain based on energy-saving effort and cost-tariff contract. Comput. Ind. Eng. 2020, 149, 106763. [Google Scholar] [CrossRef]
- Iqbal, M.W.; Kang, Y.; Jeon, H.W. Zero waste strategy for green supply chain management with minimization of energy consumption. J. Clean. Prod. 2020, 245, 118827. [Google Scholar] [CrossRef]
- Wei, J.; Wang, Y.; Zhao, J. Interaction between greening and remanufacturing strategies in a manufacturer-retailer supply chain. J. Clean. Prod. 2018, 189, 585–601. [Google Scholar] [CrossRef]
- Vinante, C.; Sacco, P.; Orzes, G.; Borgianni, Y. Circular Economy Metrics: Literature Review and Company-Level Classification Framework. J. Clean. Prod. 2020, 125090. [Google Scholar] [CrossRef]
- Sassanelli, C.; Rosa, P.; Rocca, R.; Terzi, S. Circular economy performance assessment methods: A systematic literature review. J. Clean. Prod. 2019, 229, 440–453. [Google Scholar] [CrossRef]
- Sassanelli, C.; Urbinati, A.; Rosa, P.; Chiaroni, D.; Terzi, S. ddressing circular economy through design for X approaches: A systematic literature review. Comput. Ind. 2020, 120, 103245. [Google Scholar] [CrossRef]
- Go, T.F.; Wahab, D.A.; Hishamuddin, H. Multiple generation life-cycles for product sustainability: The way forward. J. Clean. Prod. 2015, 95, 16–29. [Google Scholar] [CrossRef]
- Pigosso, D.C.A.; McAloone, T.C. How can design science contribute to a circular economy? Int. Conf. Eng. Des. ICED 2017, 5, 299–307. [Google Scholar]
- Moreno, M.; De los Rios, C.; Rowe, Z.; Charnley, F. A conceptual framework for circular design. Sustainability 2016, 8, 937. [Google Scholar] [CrossRef]
- Shu, T.; Wu, Q.; Chen, S.; Wang, S.; Lai, K.K.; Yang, H. Manufacturers’/remanufacturers’ inventory control strategies with cap-and-trade regulation. J. Clean. Prod. 2017, 159, 11–25. [Google Scholar] [CrossRef]
- Toptal, A.; Özlü, H.; Konur, D. Joint decisions on inventory replenishment and emission reduction investment under different emission regulations. Int. J. Prod. Res. 2014, 52, 243–269. [Google Scholar] [CrossRef]
- Validi, S.; Bhattacharya, A.; Byrne, P.J. Integrated low-carbon distribution system for the demand side of a product distribution supply chain: A DoE-guided MOPSO optimiser-based solution approach. Int. J. Prod. Res. 2014, 52, 3074–3096. [Google Scholar] [CrossRef]
- Wang, S.; Ye, B. A comparison between just-in-time and economic order quantity models with carbon emissions. J. Clean. Prod. 2018, 187, 662–671. [Google Scholar] [CrossRef]
- Huang, Y.S.; Fang, C.C.; Lin, Y.A. Inventory management in supply chains with consideration of Logistics, green investment and different carbon emissions policies. Comput. Ind. Eng. 2020, 139, 106207. [Google Scholar] [CrossRef]
- Dey, K.; Saha, S. Influence of procurement decisions in two-period green supply chain. J. Clean. Prod. 2018, 190, 388–402. [Google Scholar] [CrossRef]
- Nielsen, I.E.; Majumder, S.; Saha, S. Exploring the intervention of intermediary in a green supply chain. J. Clean. Prod. 2019, 233, 1525–1544. [Google Scholar] [CrossRef]
- Kuiti, M.R.; Ghosh, D.; Basu, P.; Bisi, A. Do cap-and-trade policies drive environmental and social goals in supply chains: Strategic decisions, collaboration, and contract choices. Int. J. Prod. Econ. 2020, 223, 107537. [Google Scholar] [CrossRef]
- Zhen, L.; Huang, L.; Wang, W. Green and sustainable closed-loop supply chain network design under uncertainty. J. Clean. Prod. 2019, 227, 1195–1209. [Google Scholar] [CrossRef]
- Yang, H.; Miao, L.; Zhao, C. The credit strategy of a green supply chain based on capital constraints. J. Clean. Prod. 2019, 224, 930–939. [Google Scholar] [CrossRef]
- Nielsen, I.E.; Majumder, S.; Sana, S.S.; Saha, S. Comparative analysis of government incentives and game structures on single and two-period green supply chain. J. Clean. Prod. 2019, 235, 1371–1398. [Google Scholar] [CrossRef]
- Kang, K.; Zhao, Y.; Ma, Y.; Li, Z. Green supply chain poverty alleviation through microfinance game model and cooperative analysis. J. Clean. Prod. 2019, 226, 1022–1041. [Google Scholar] [CrossRef]
- Karray, S. Cooperative promotions in the distribution channel. Omega 2015, 51, 49–58. [Google Scholar] [CrossRef]
- McGuire, T.W.; Staelin, R. An industry equilibrium analysis of downstream vertical integration. Mark. Sci. 1983, 2, 161–191. [Google Scholar] [CrossRef]
- Choi, S.C. Price competition in a channel structure with a common retailer. Mark. Sci. 1991, 10, 271–296. [Google Scholar] [CrossRef]
- Karray, S. Effectiveness of retail joint promotions under different channel structures. Eur. J. Oper. Res. 2011, 210, 745–751. [Google Scholar] [CrossRef]
- Chu, W.; Desai, P.S. Channel coordination mechanisms for customer satisfaction. Mark. Sci. 1995, 14, 343–359. [Google Scholar] [CrossRef]
Publisher’s Note: MDPI stays neutral with regard to jurisdictional claims in published maps and institutional affiliations. |
© 2021 by the authors. Licensee MDPI, Basel, Switzerland. This article is an open access article distributed under the terms and conditions of the Creative Commons Attribution (CC BY) license (http://creativecommons.org/licenses/by/4.0/).