
Firefly Algorithm-Based Photovoltaic Array Reconfiguration for Maximum Power Extraction during Mismatch Conditions

 ,
,  , ,
, ,  and
and 
Abstract
1. Introduction
Past Studies Related to the Reconfiguration Technique in the PV Array System
2. System Description
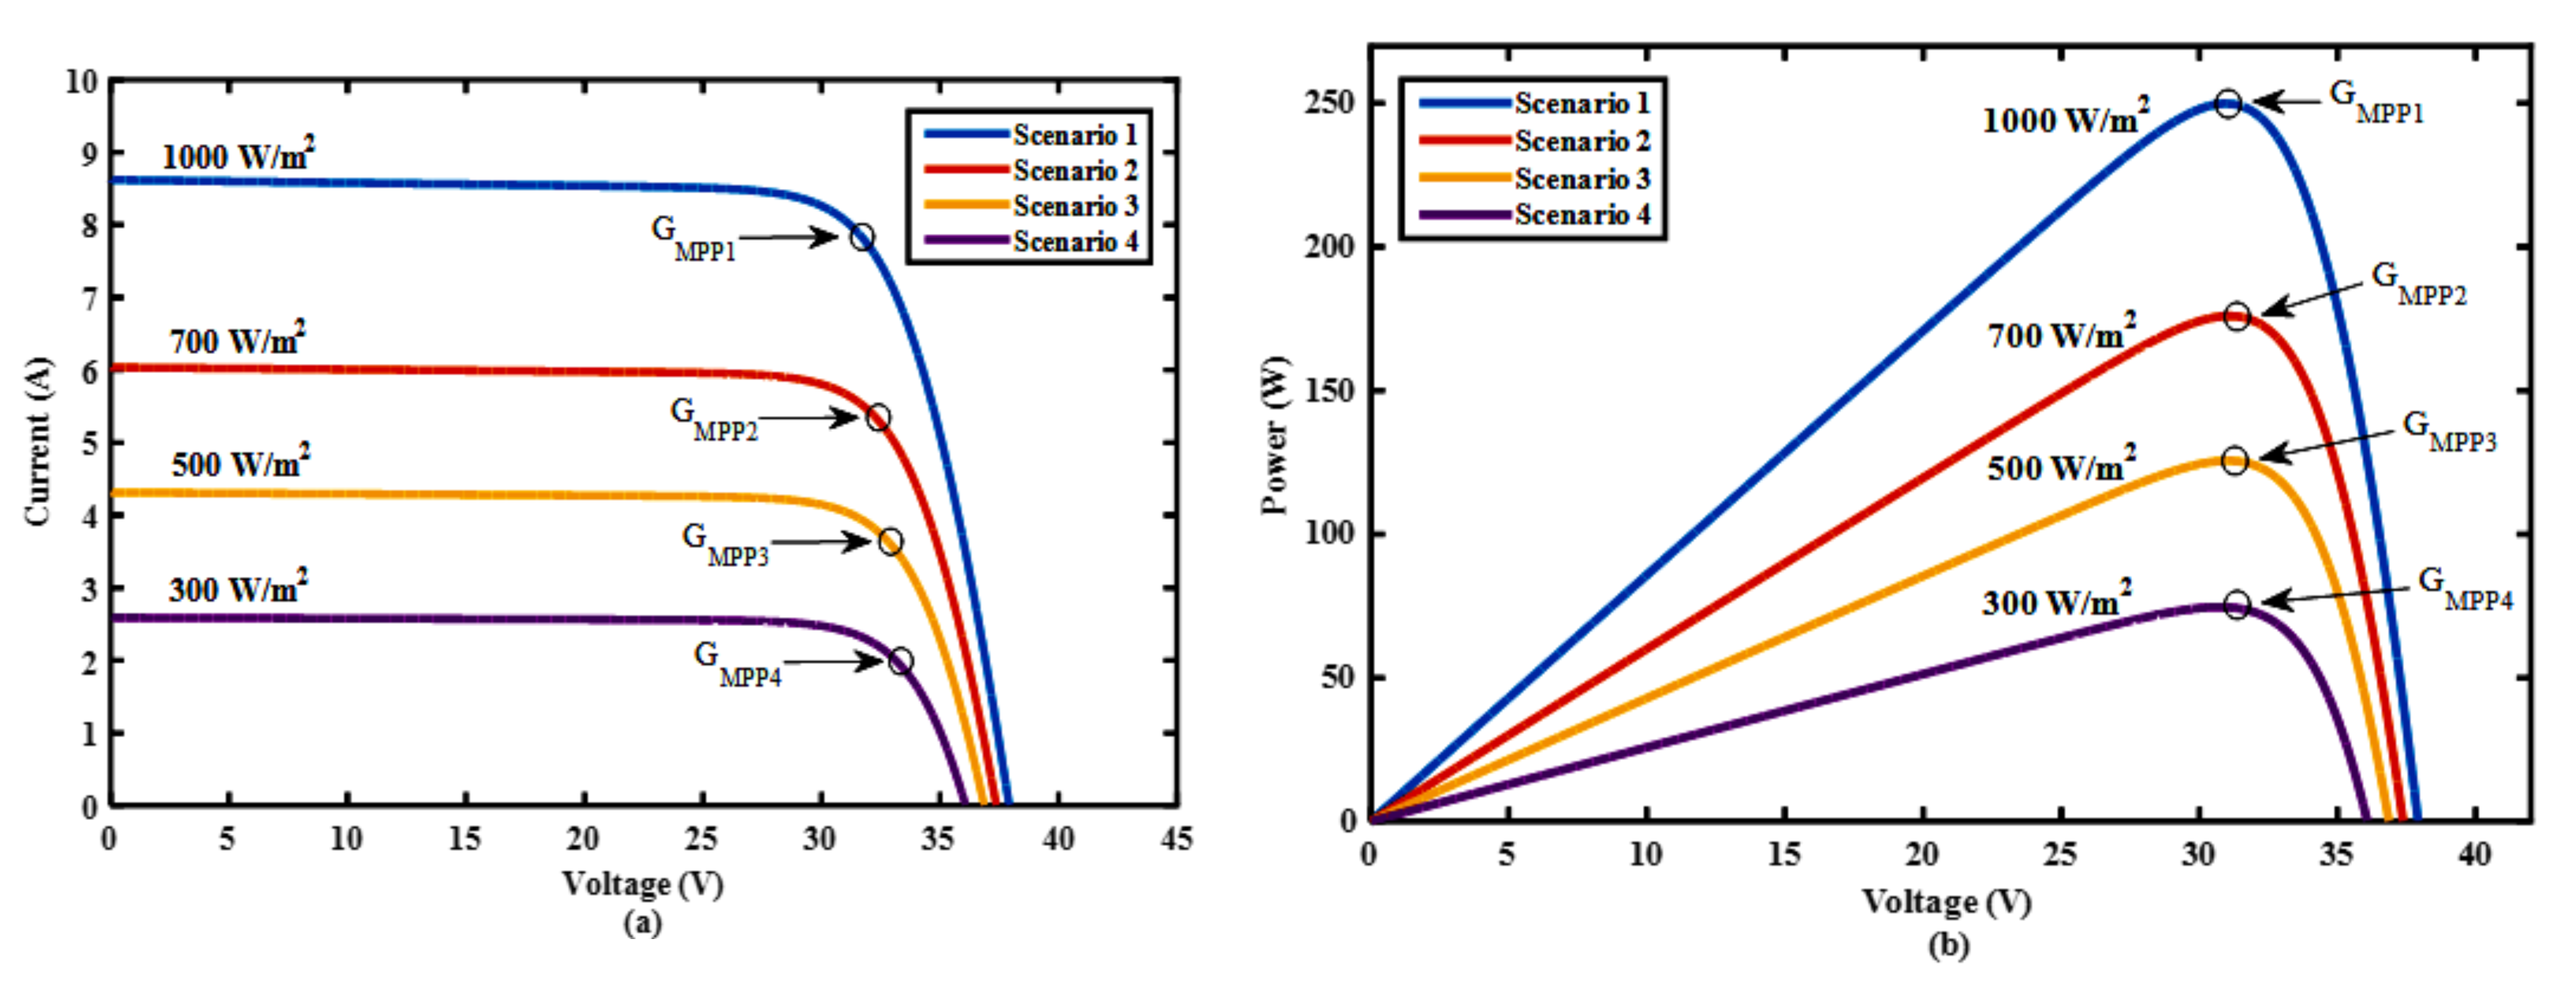
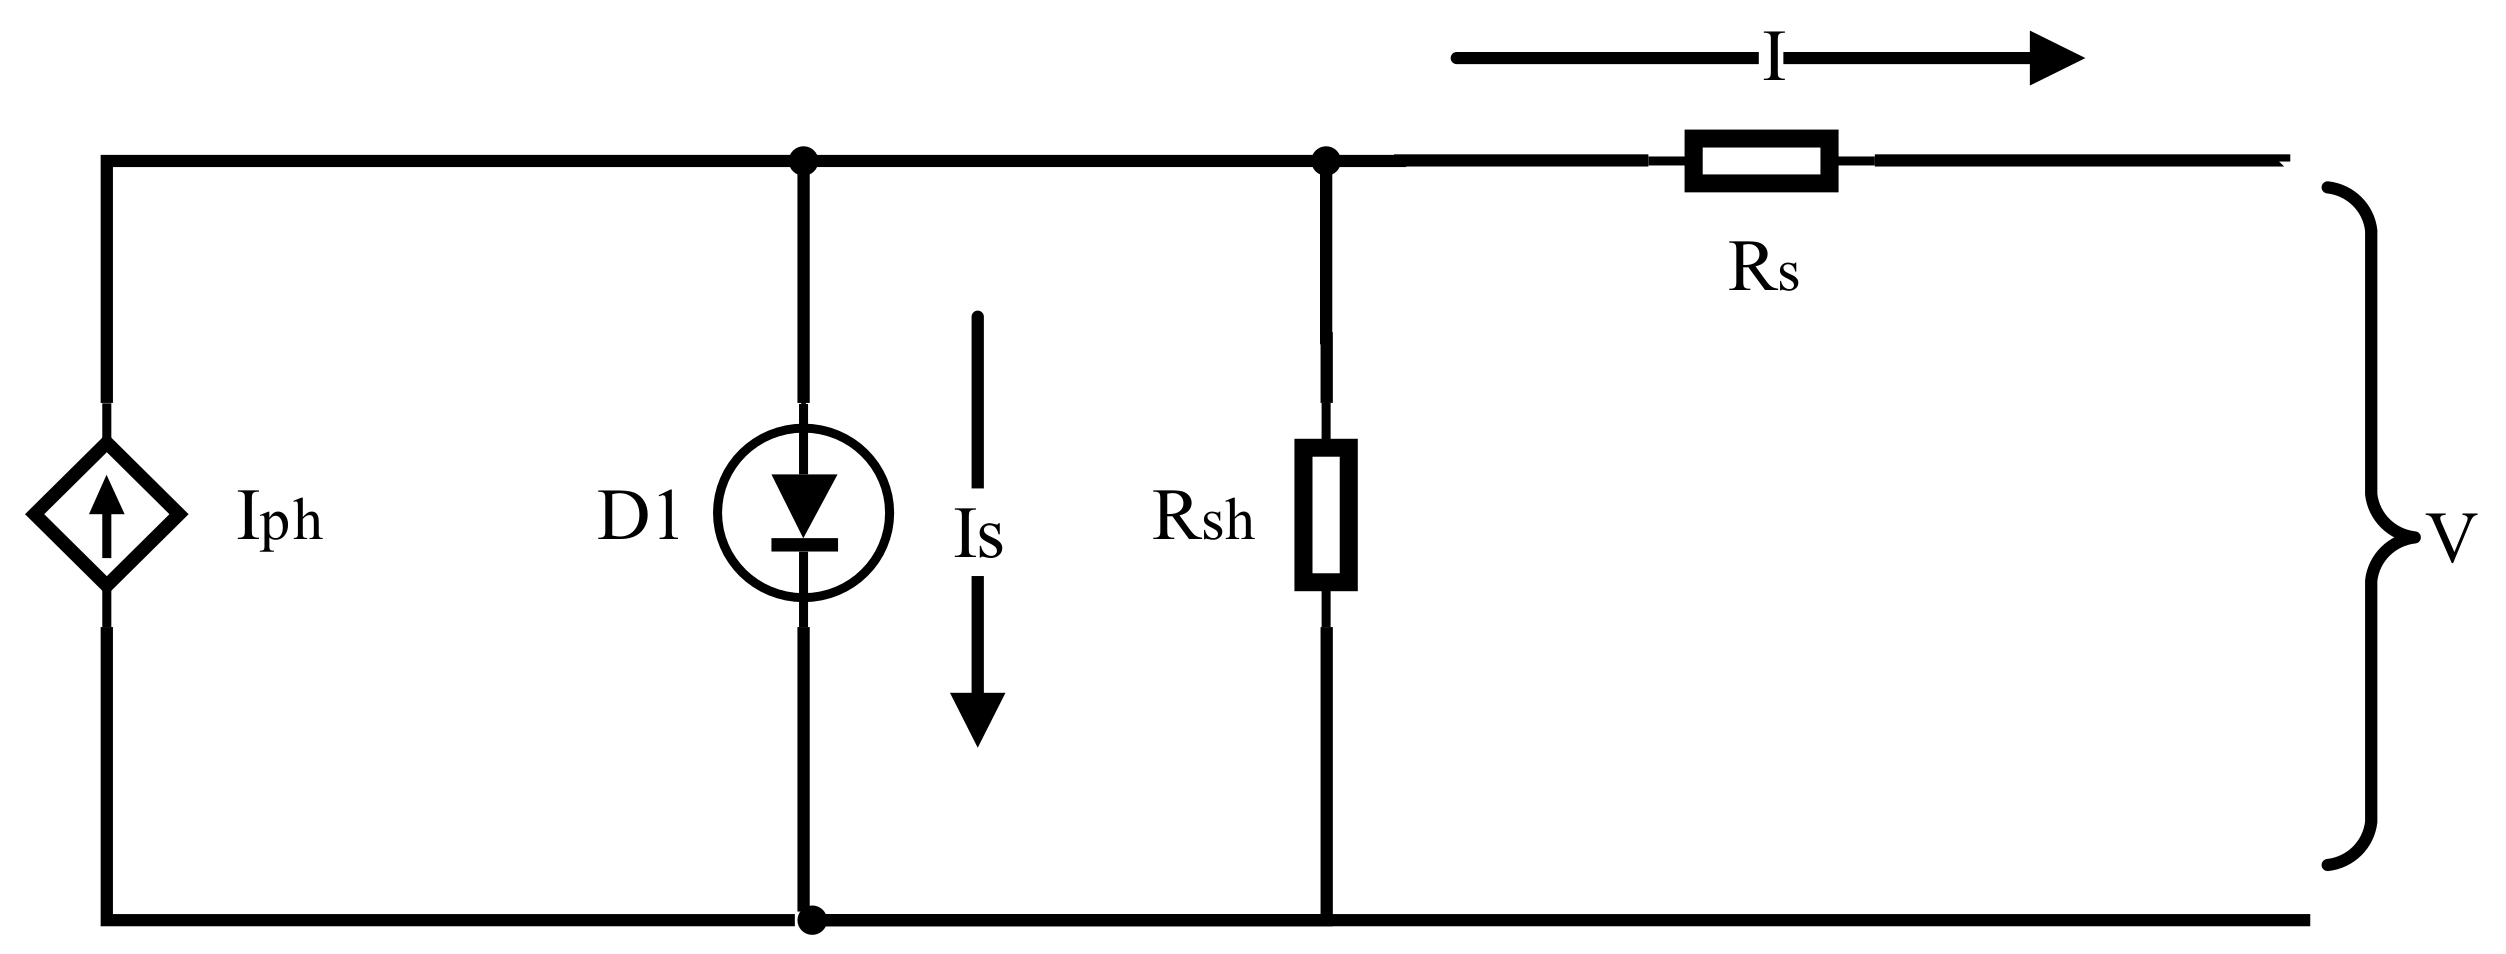
2.1. Mathematical Modeling of Solar Module
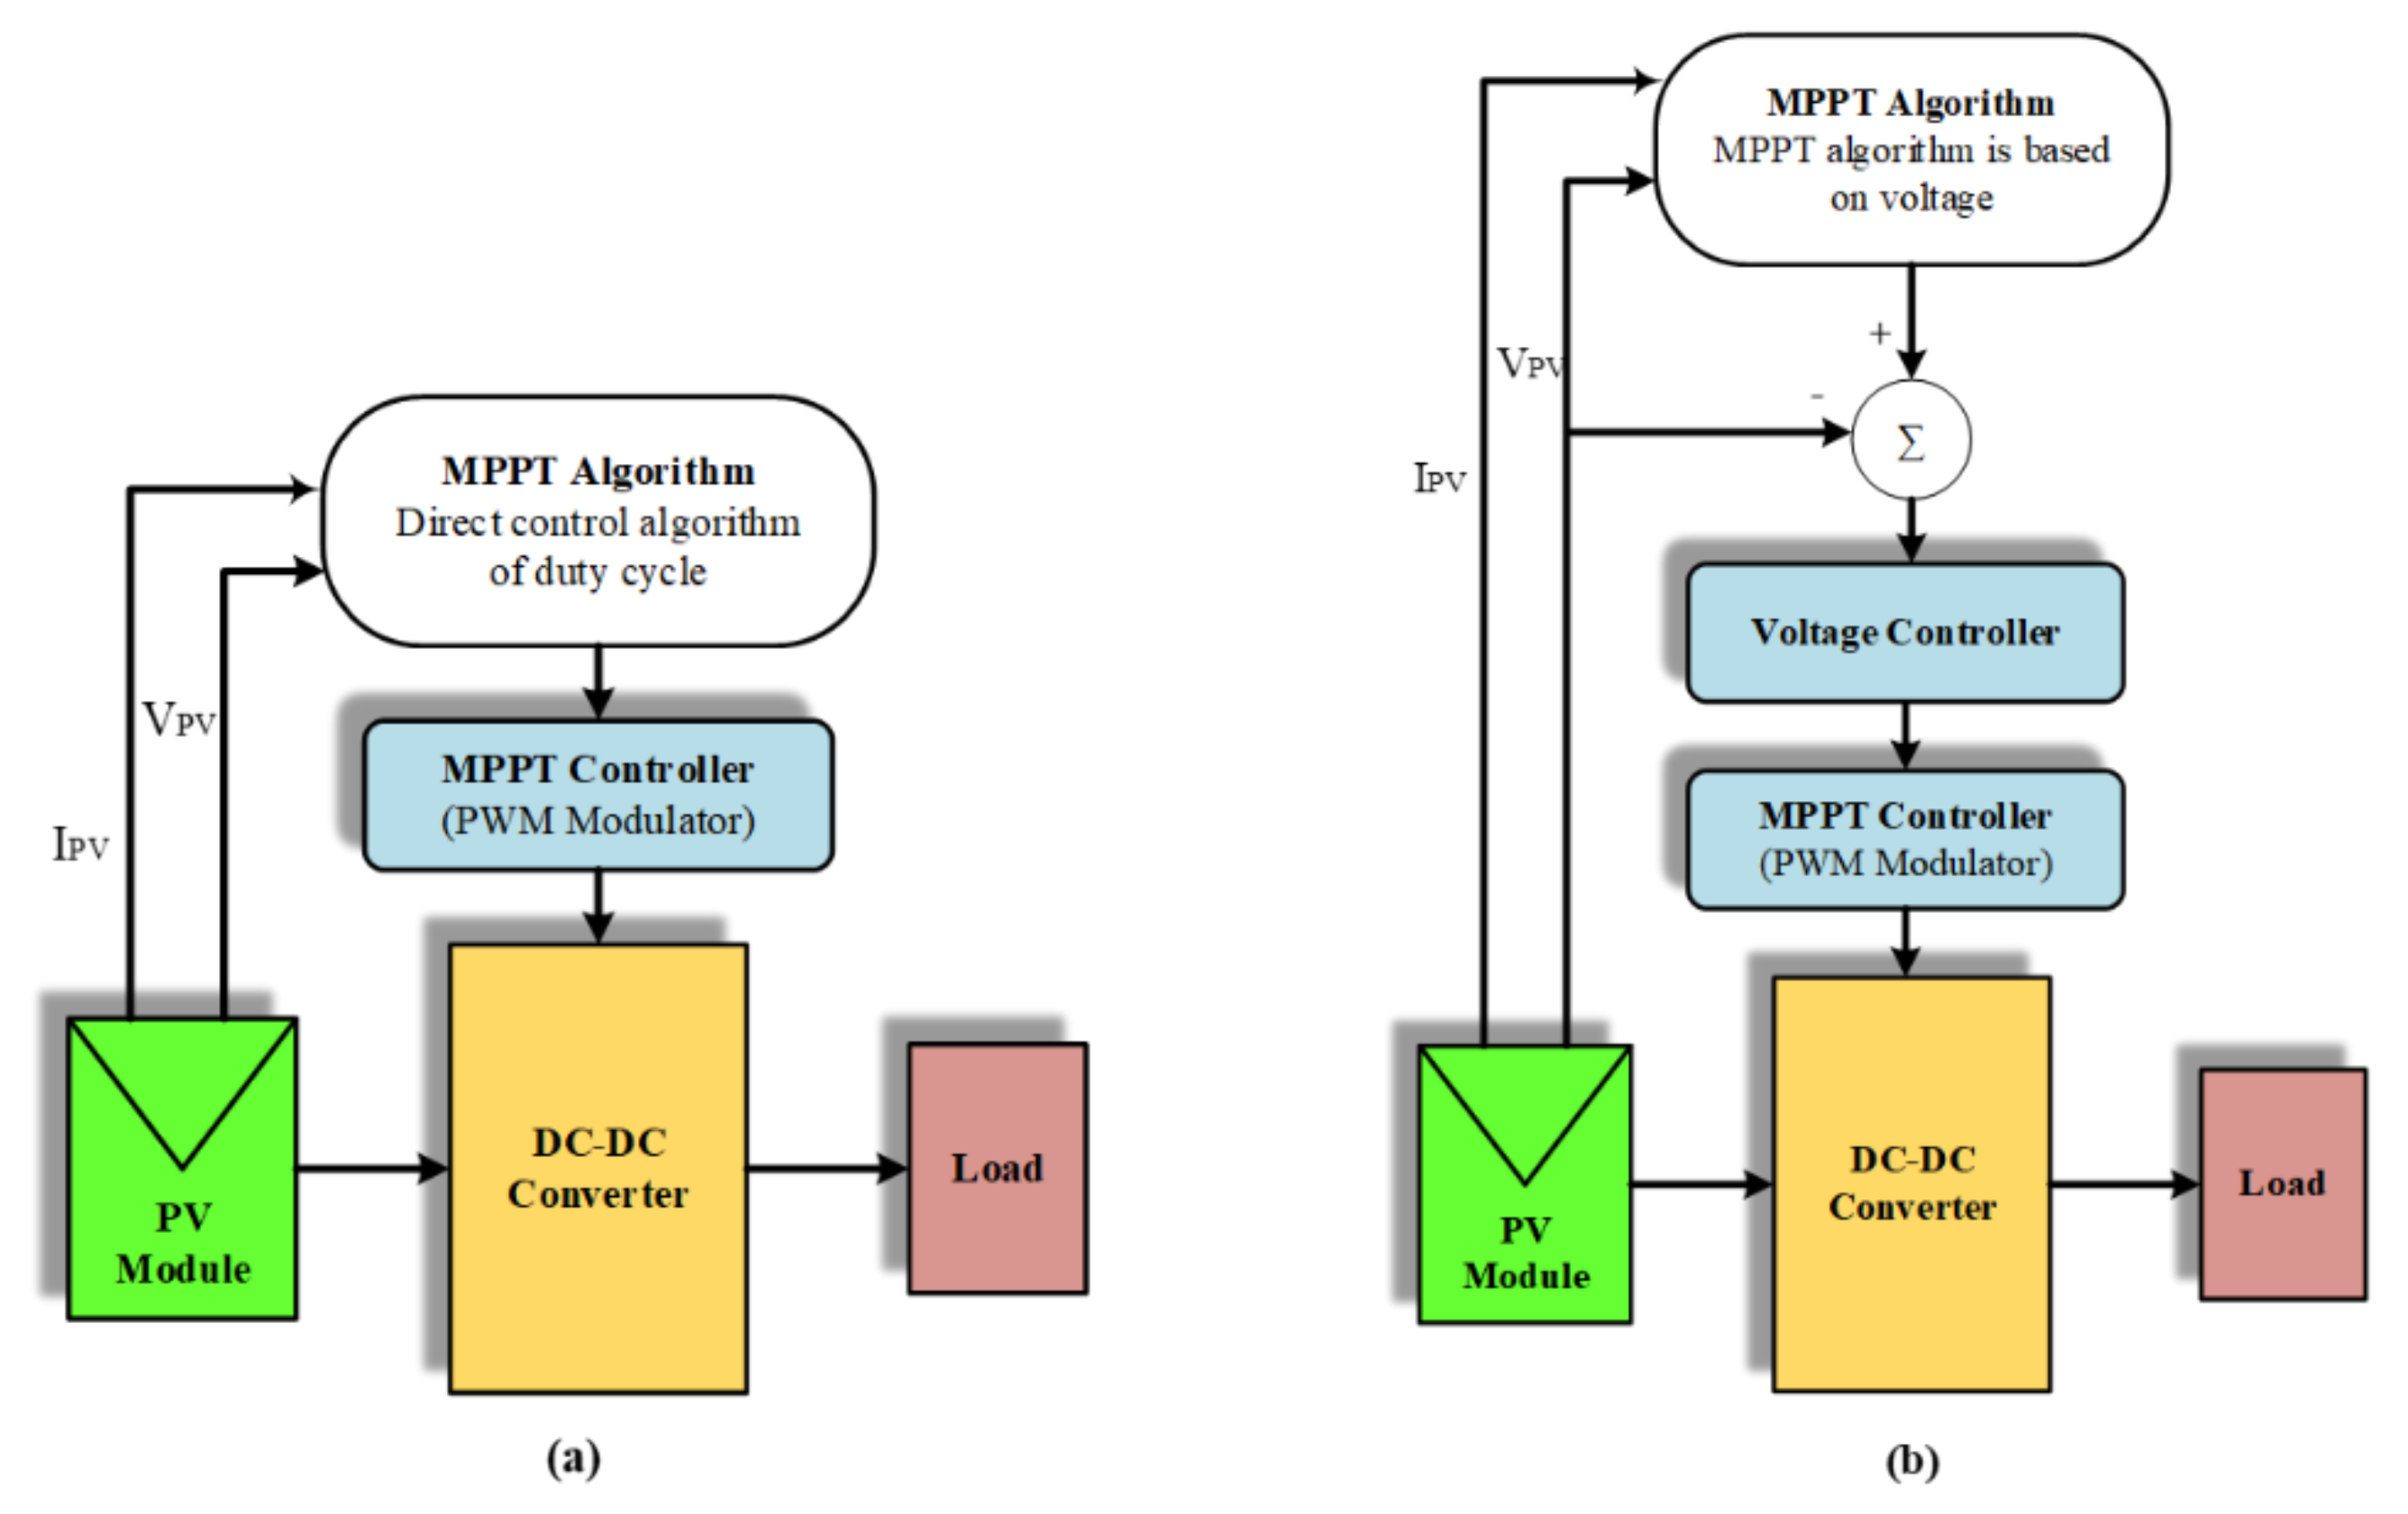
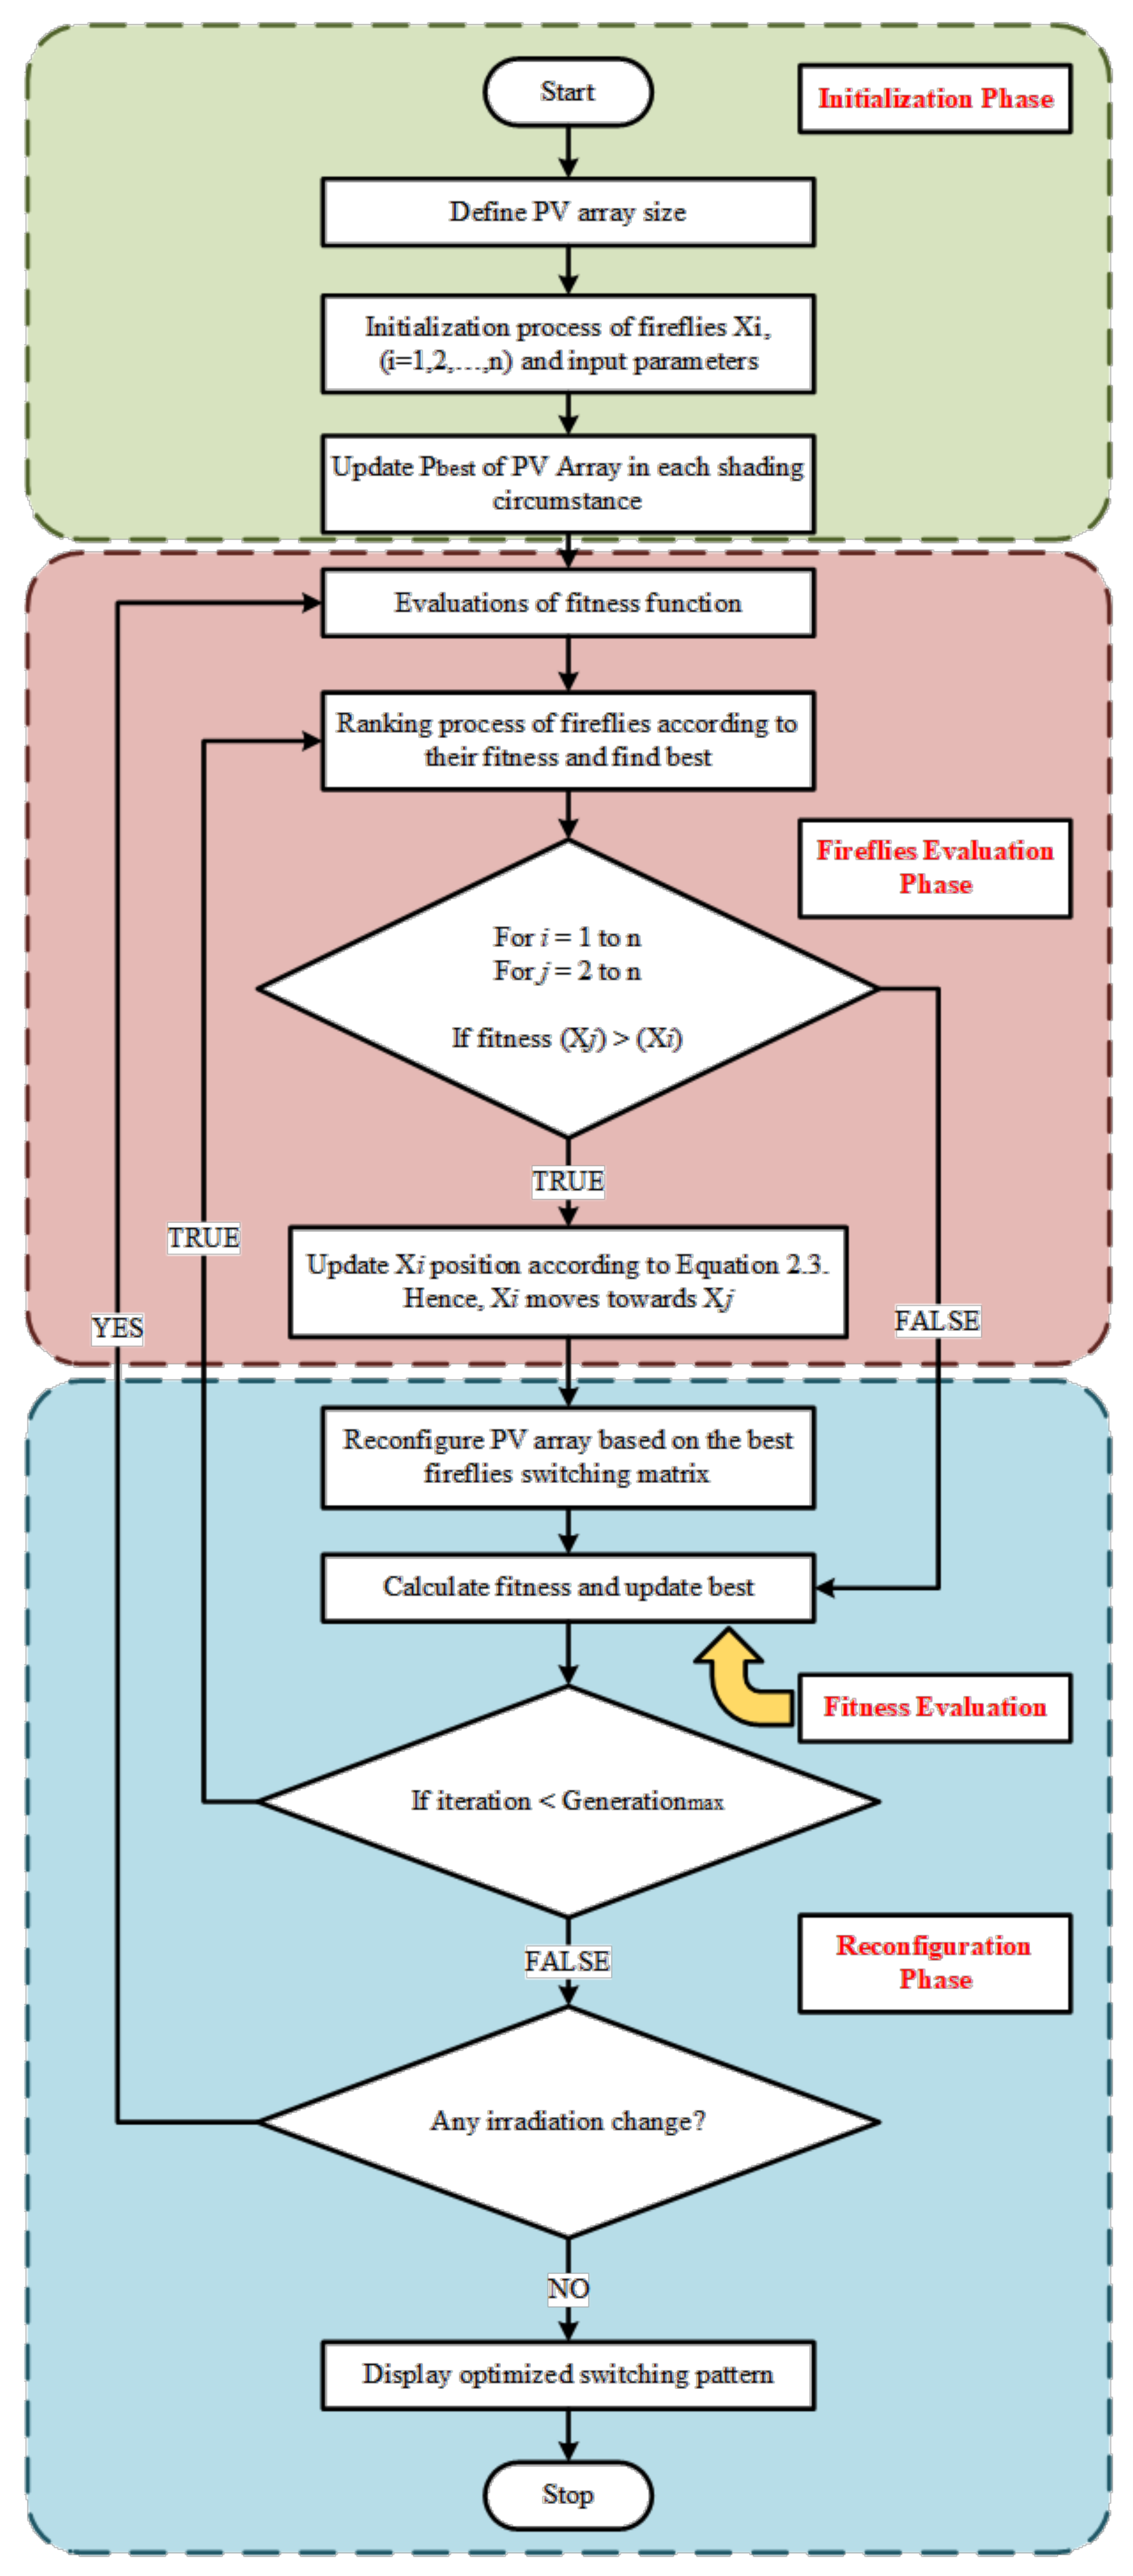
2.2. Firefly Algorithm (FA) Application in the Proposed REA Mechanism
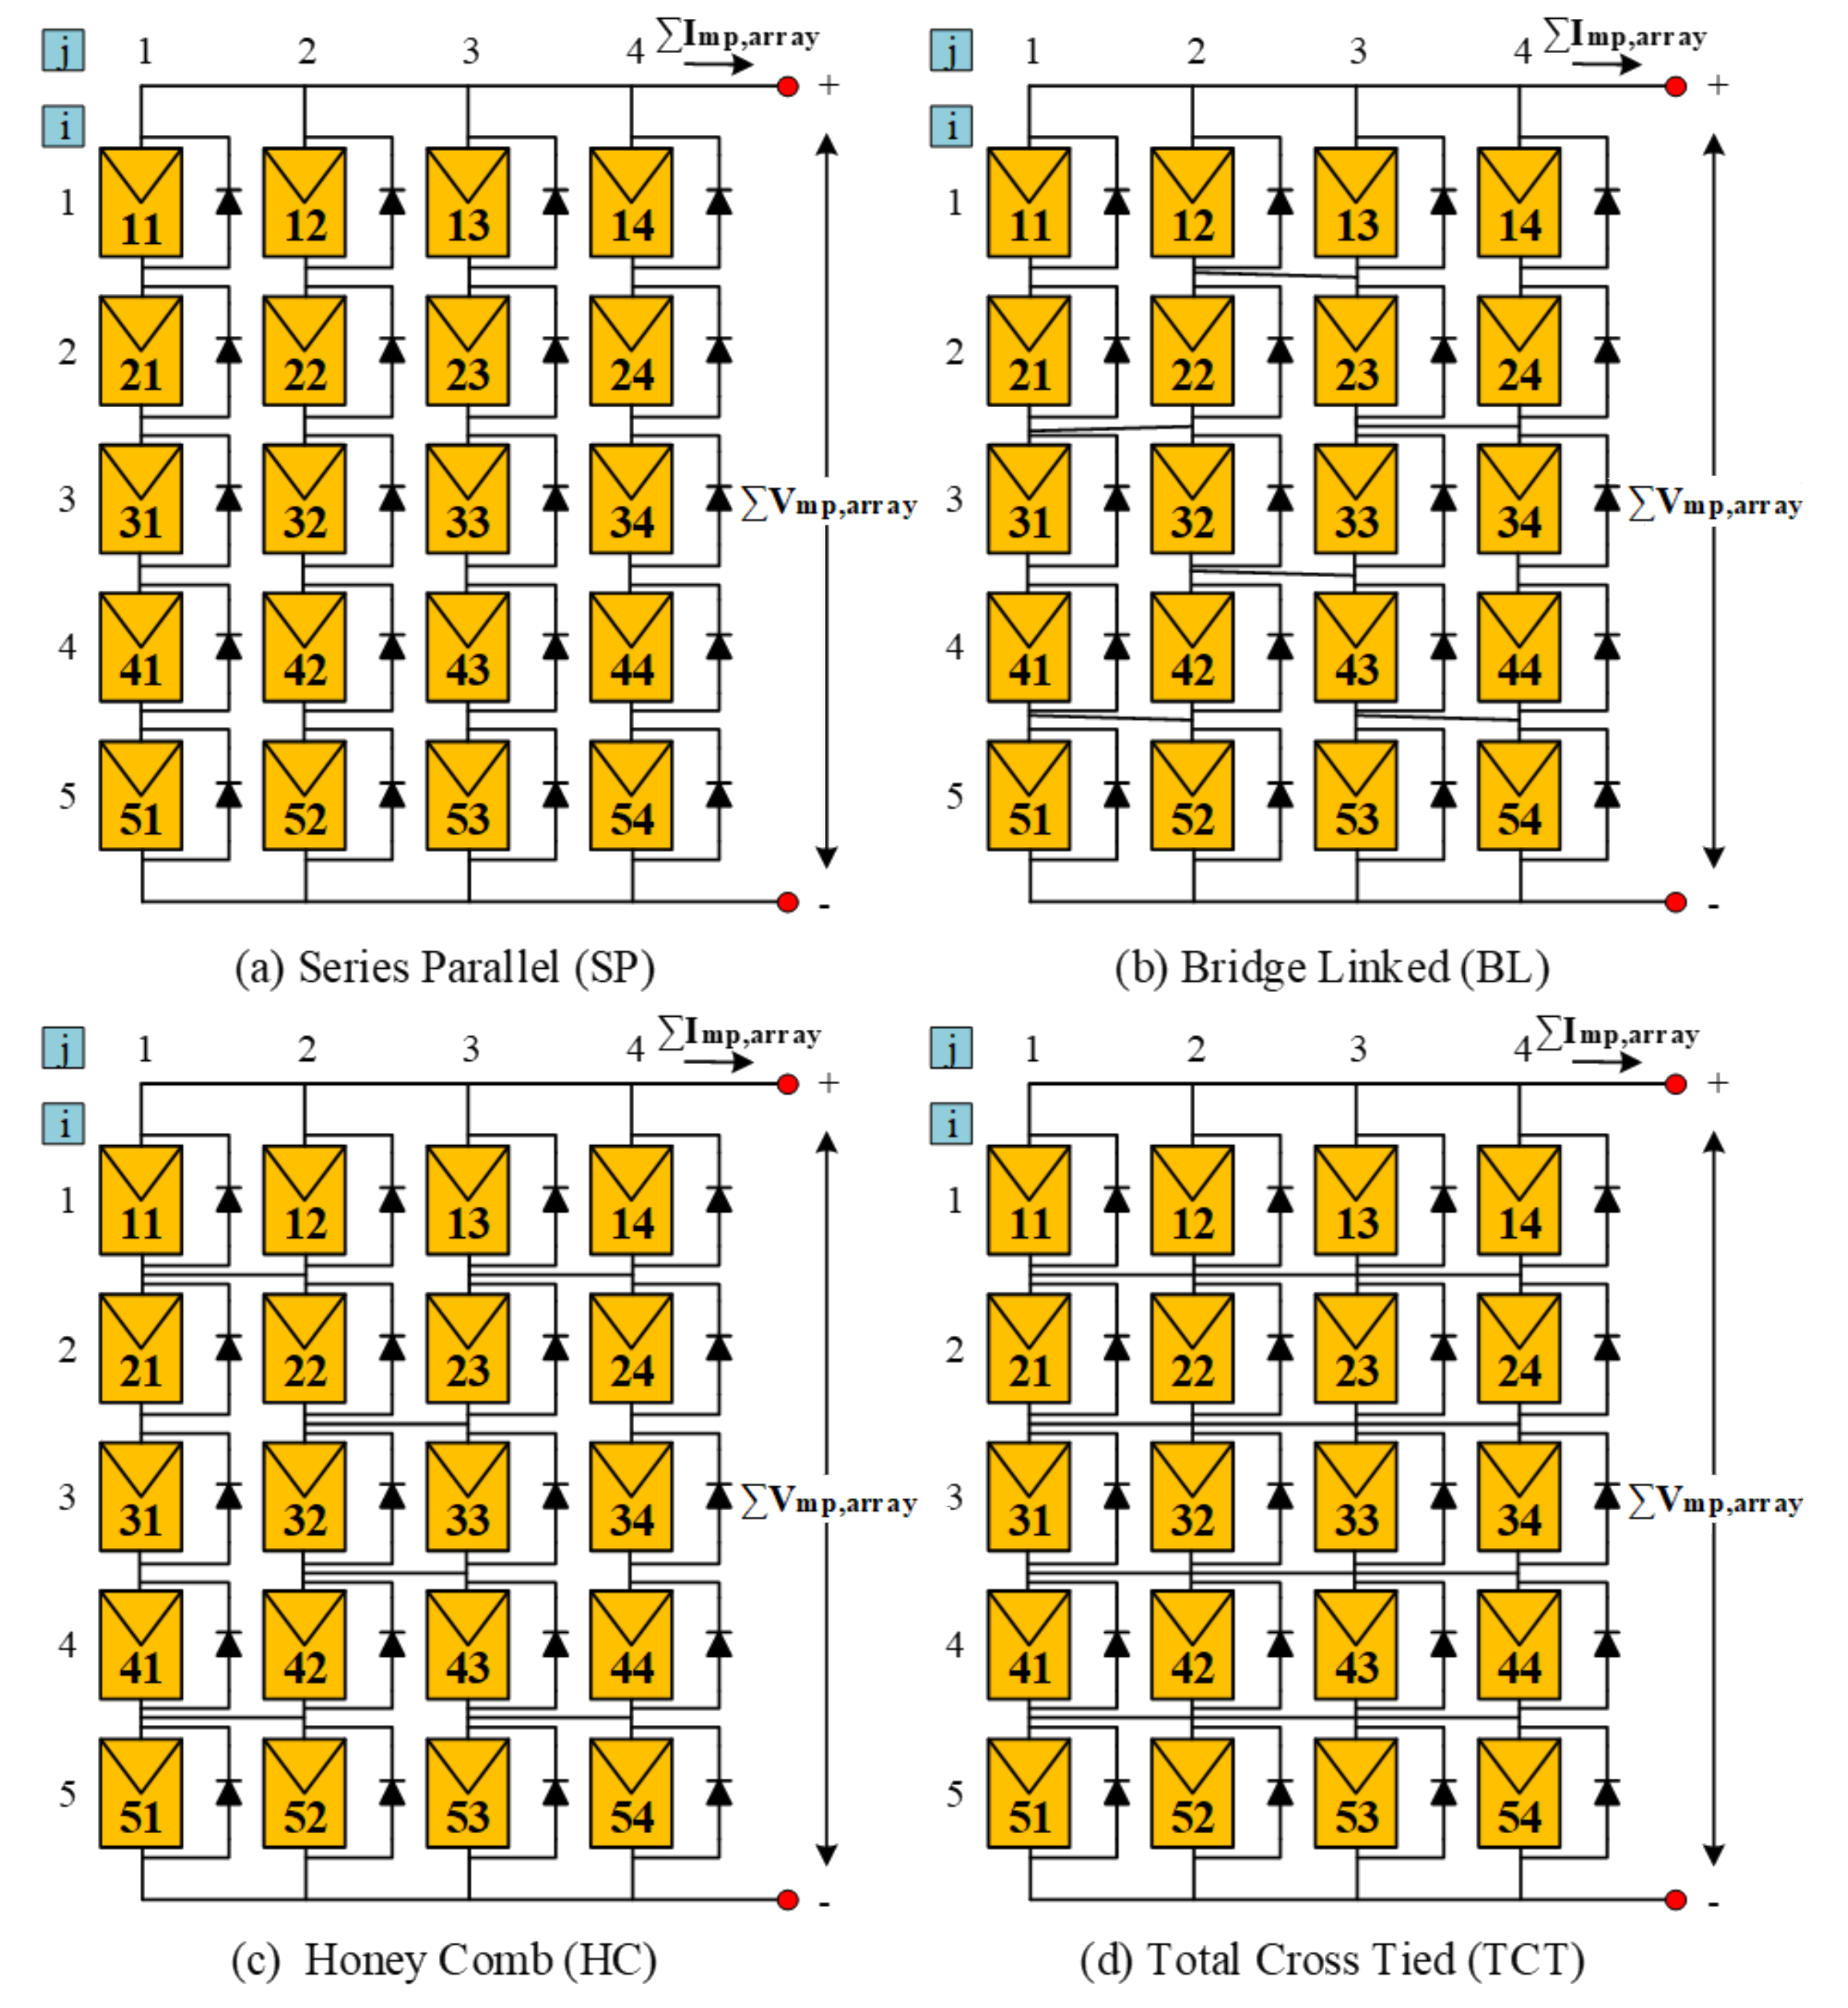
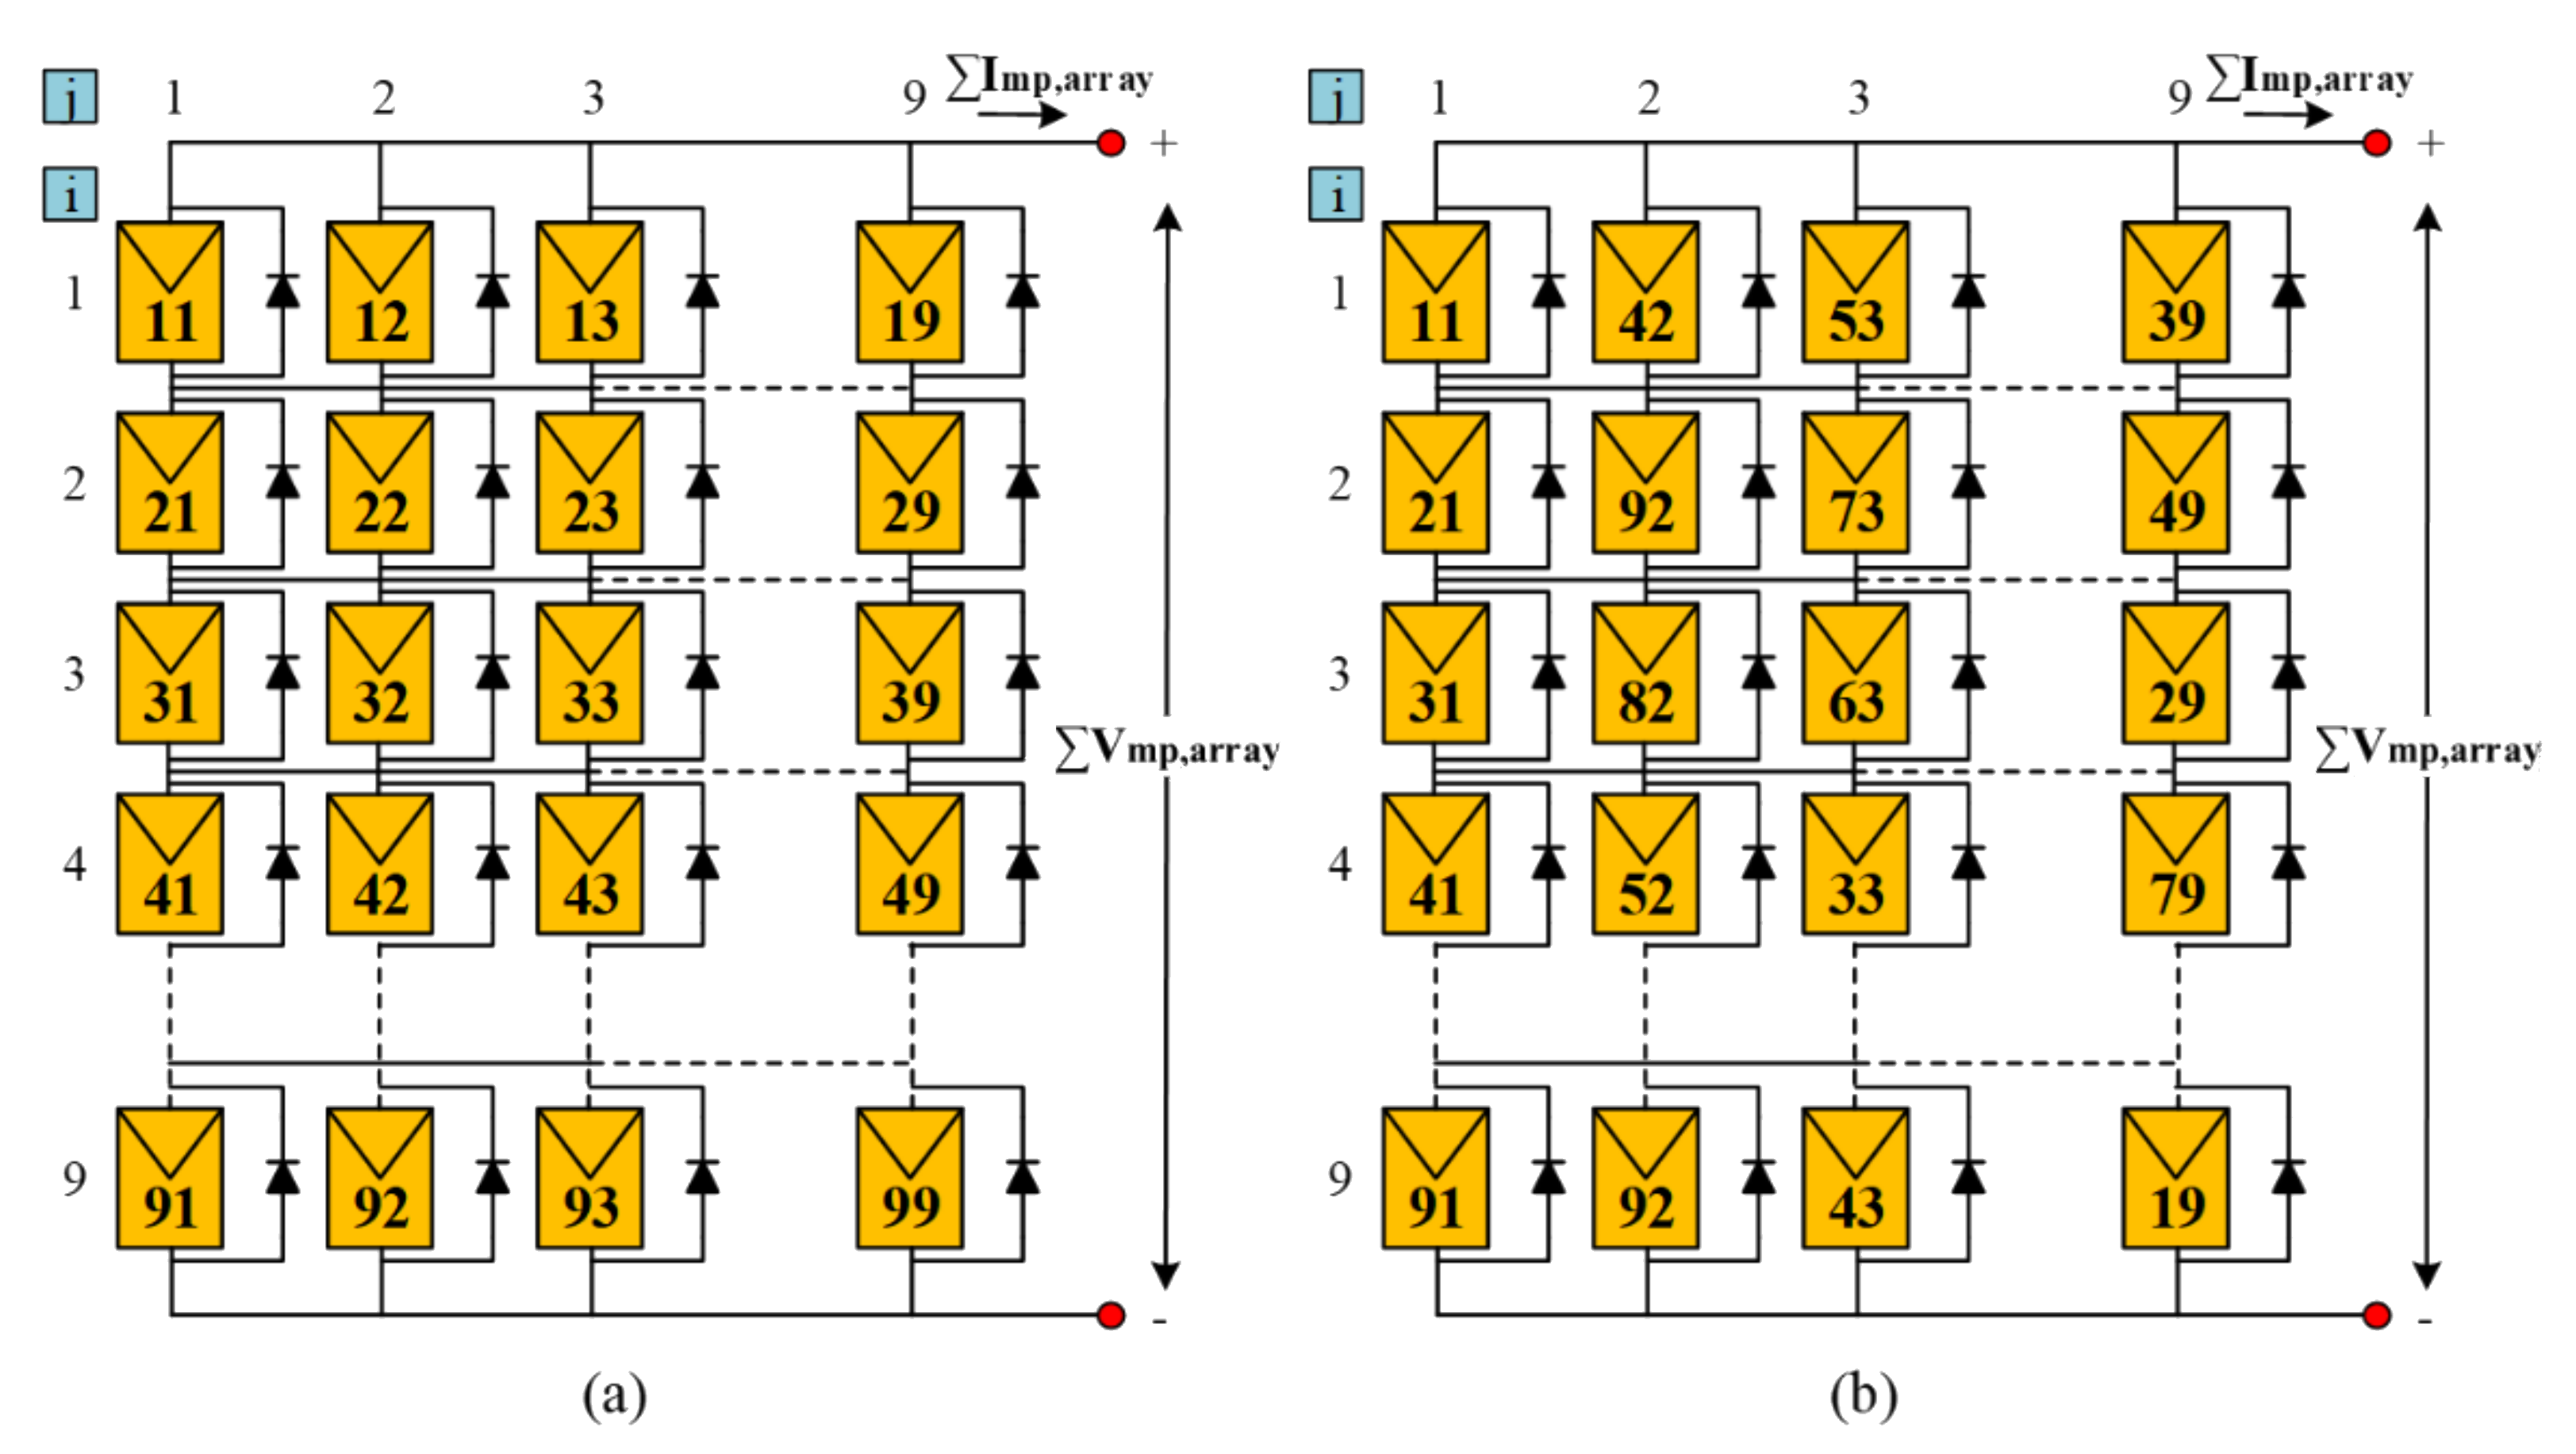
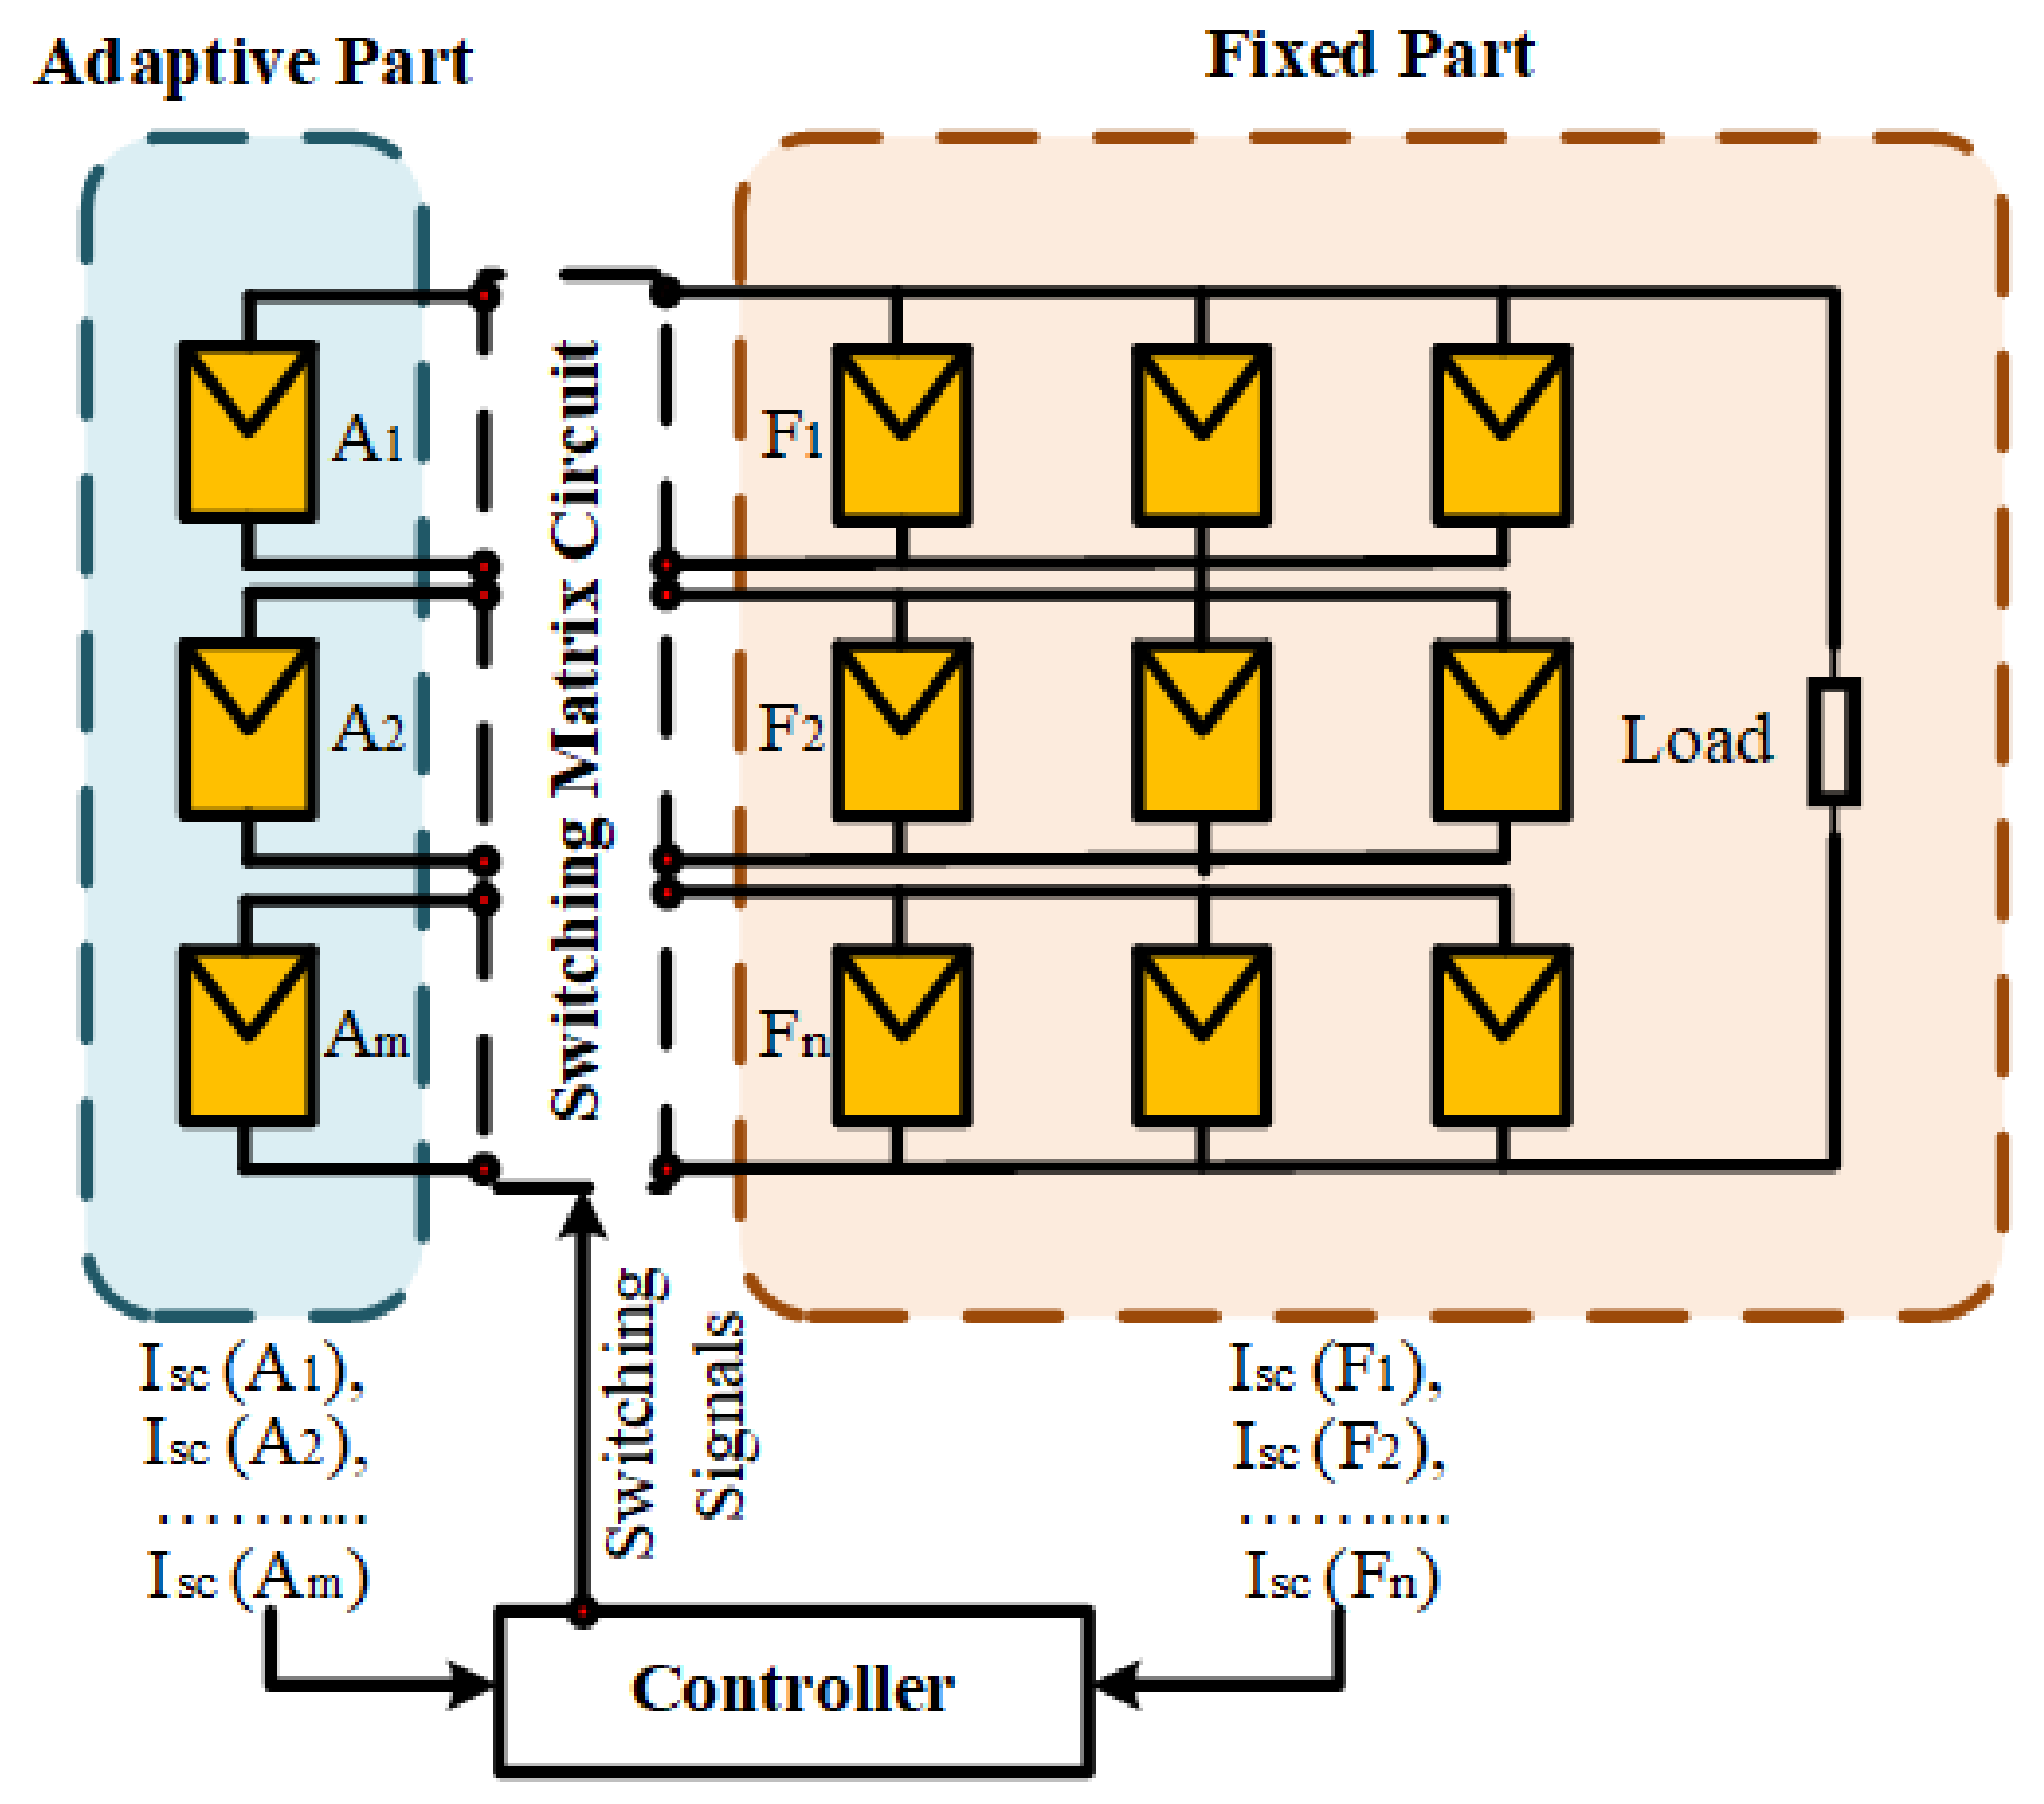
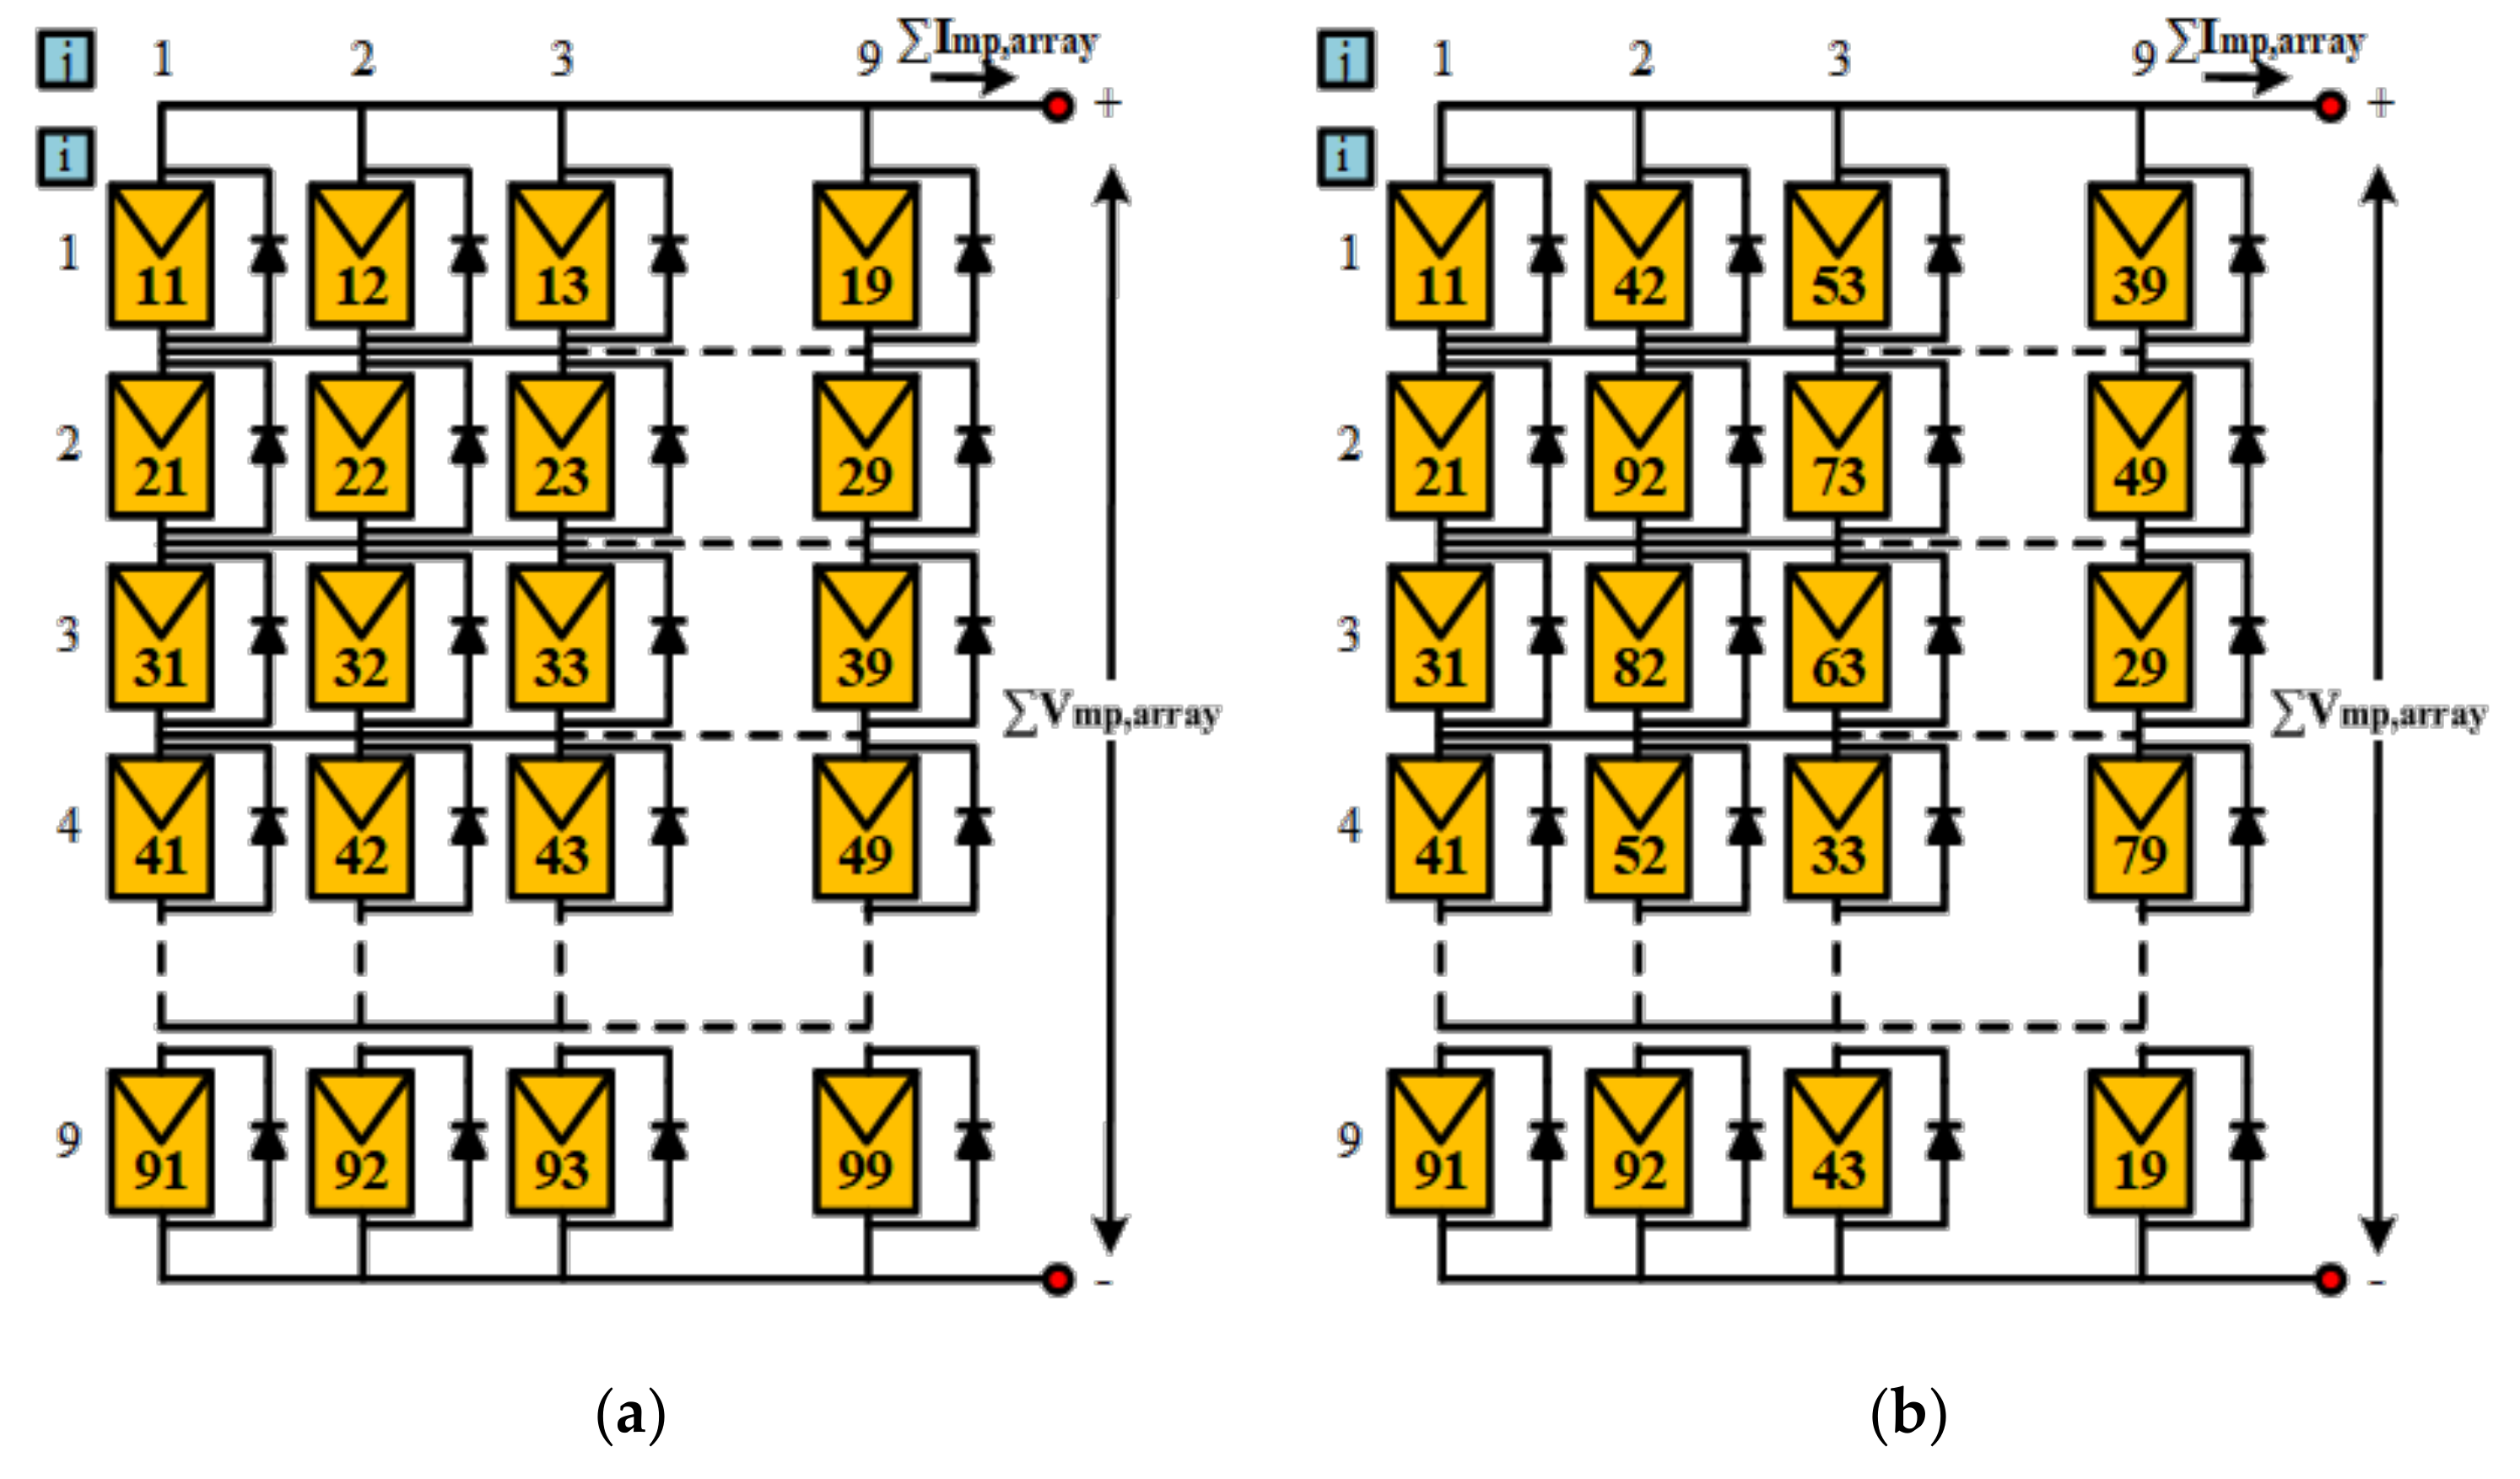
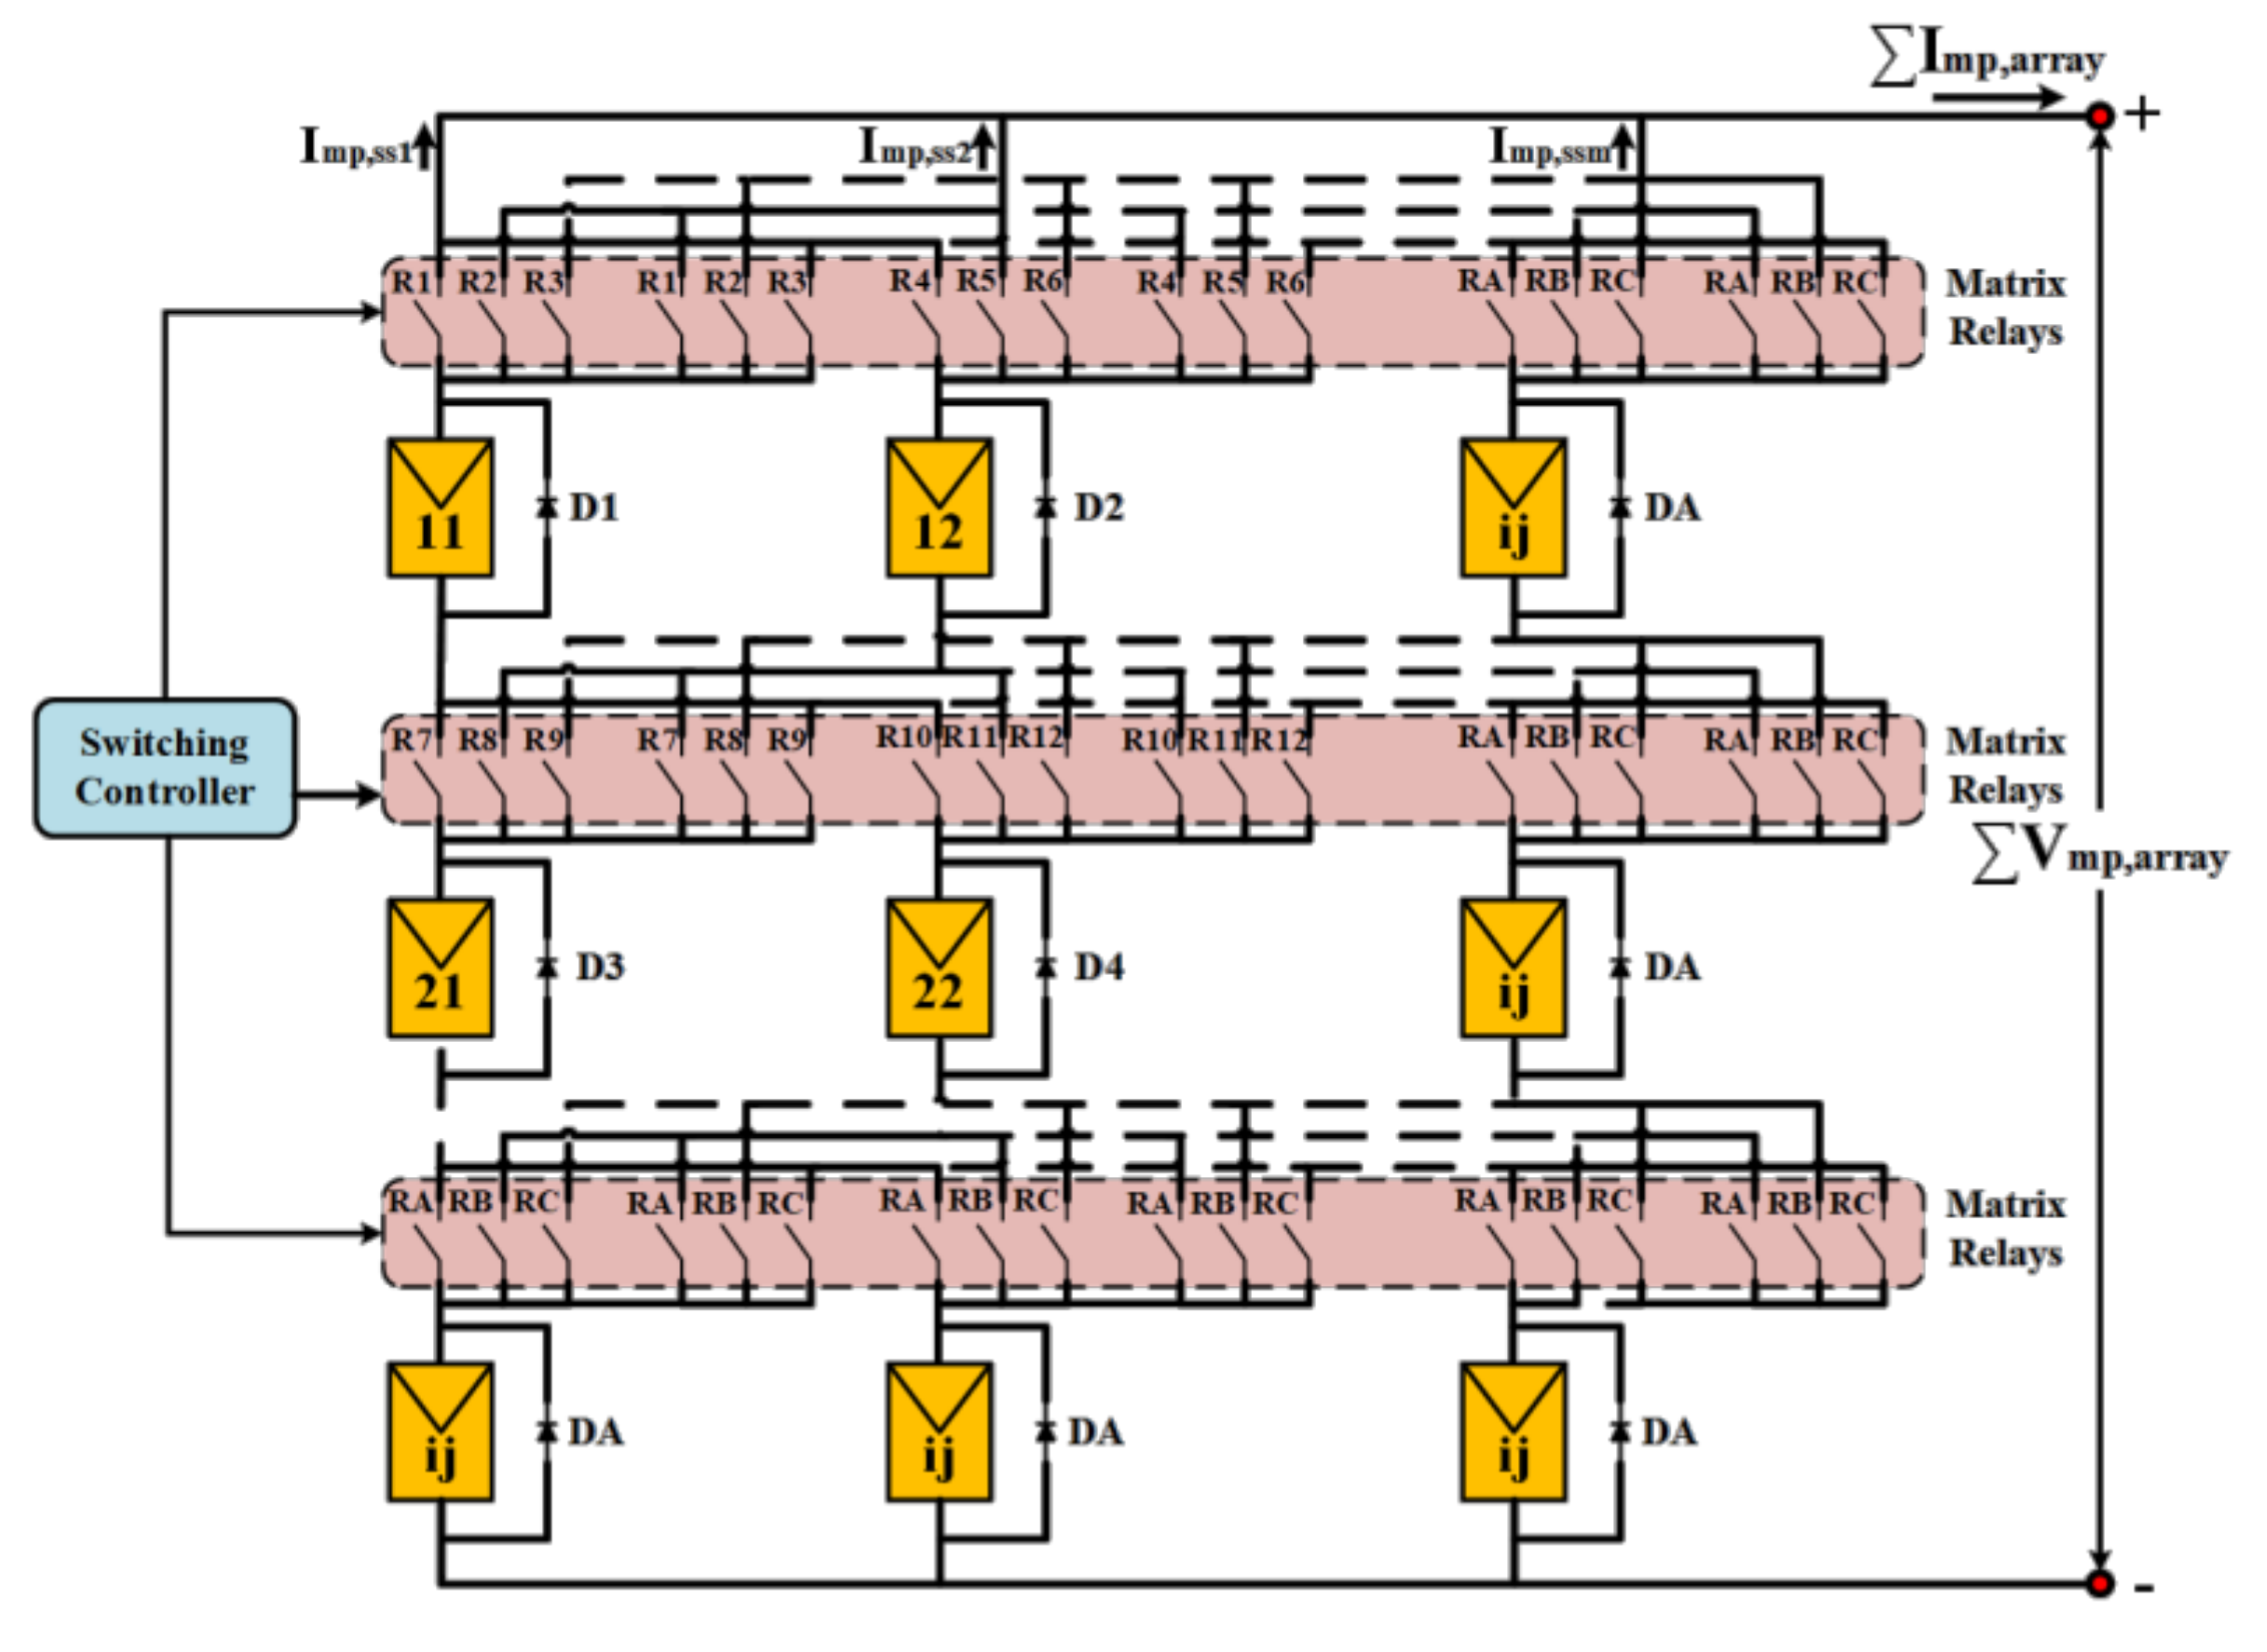
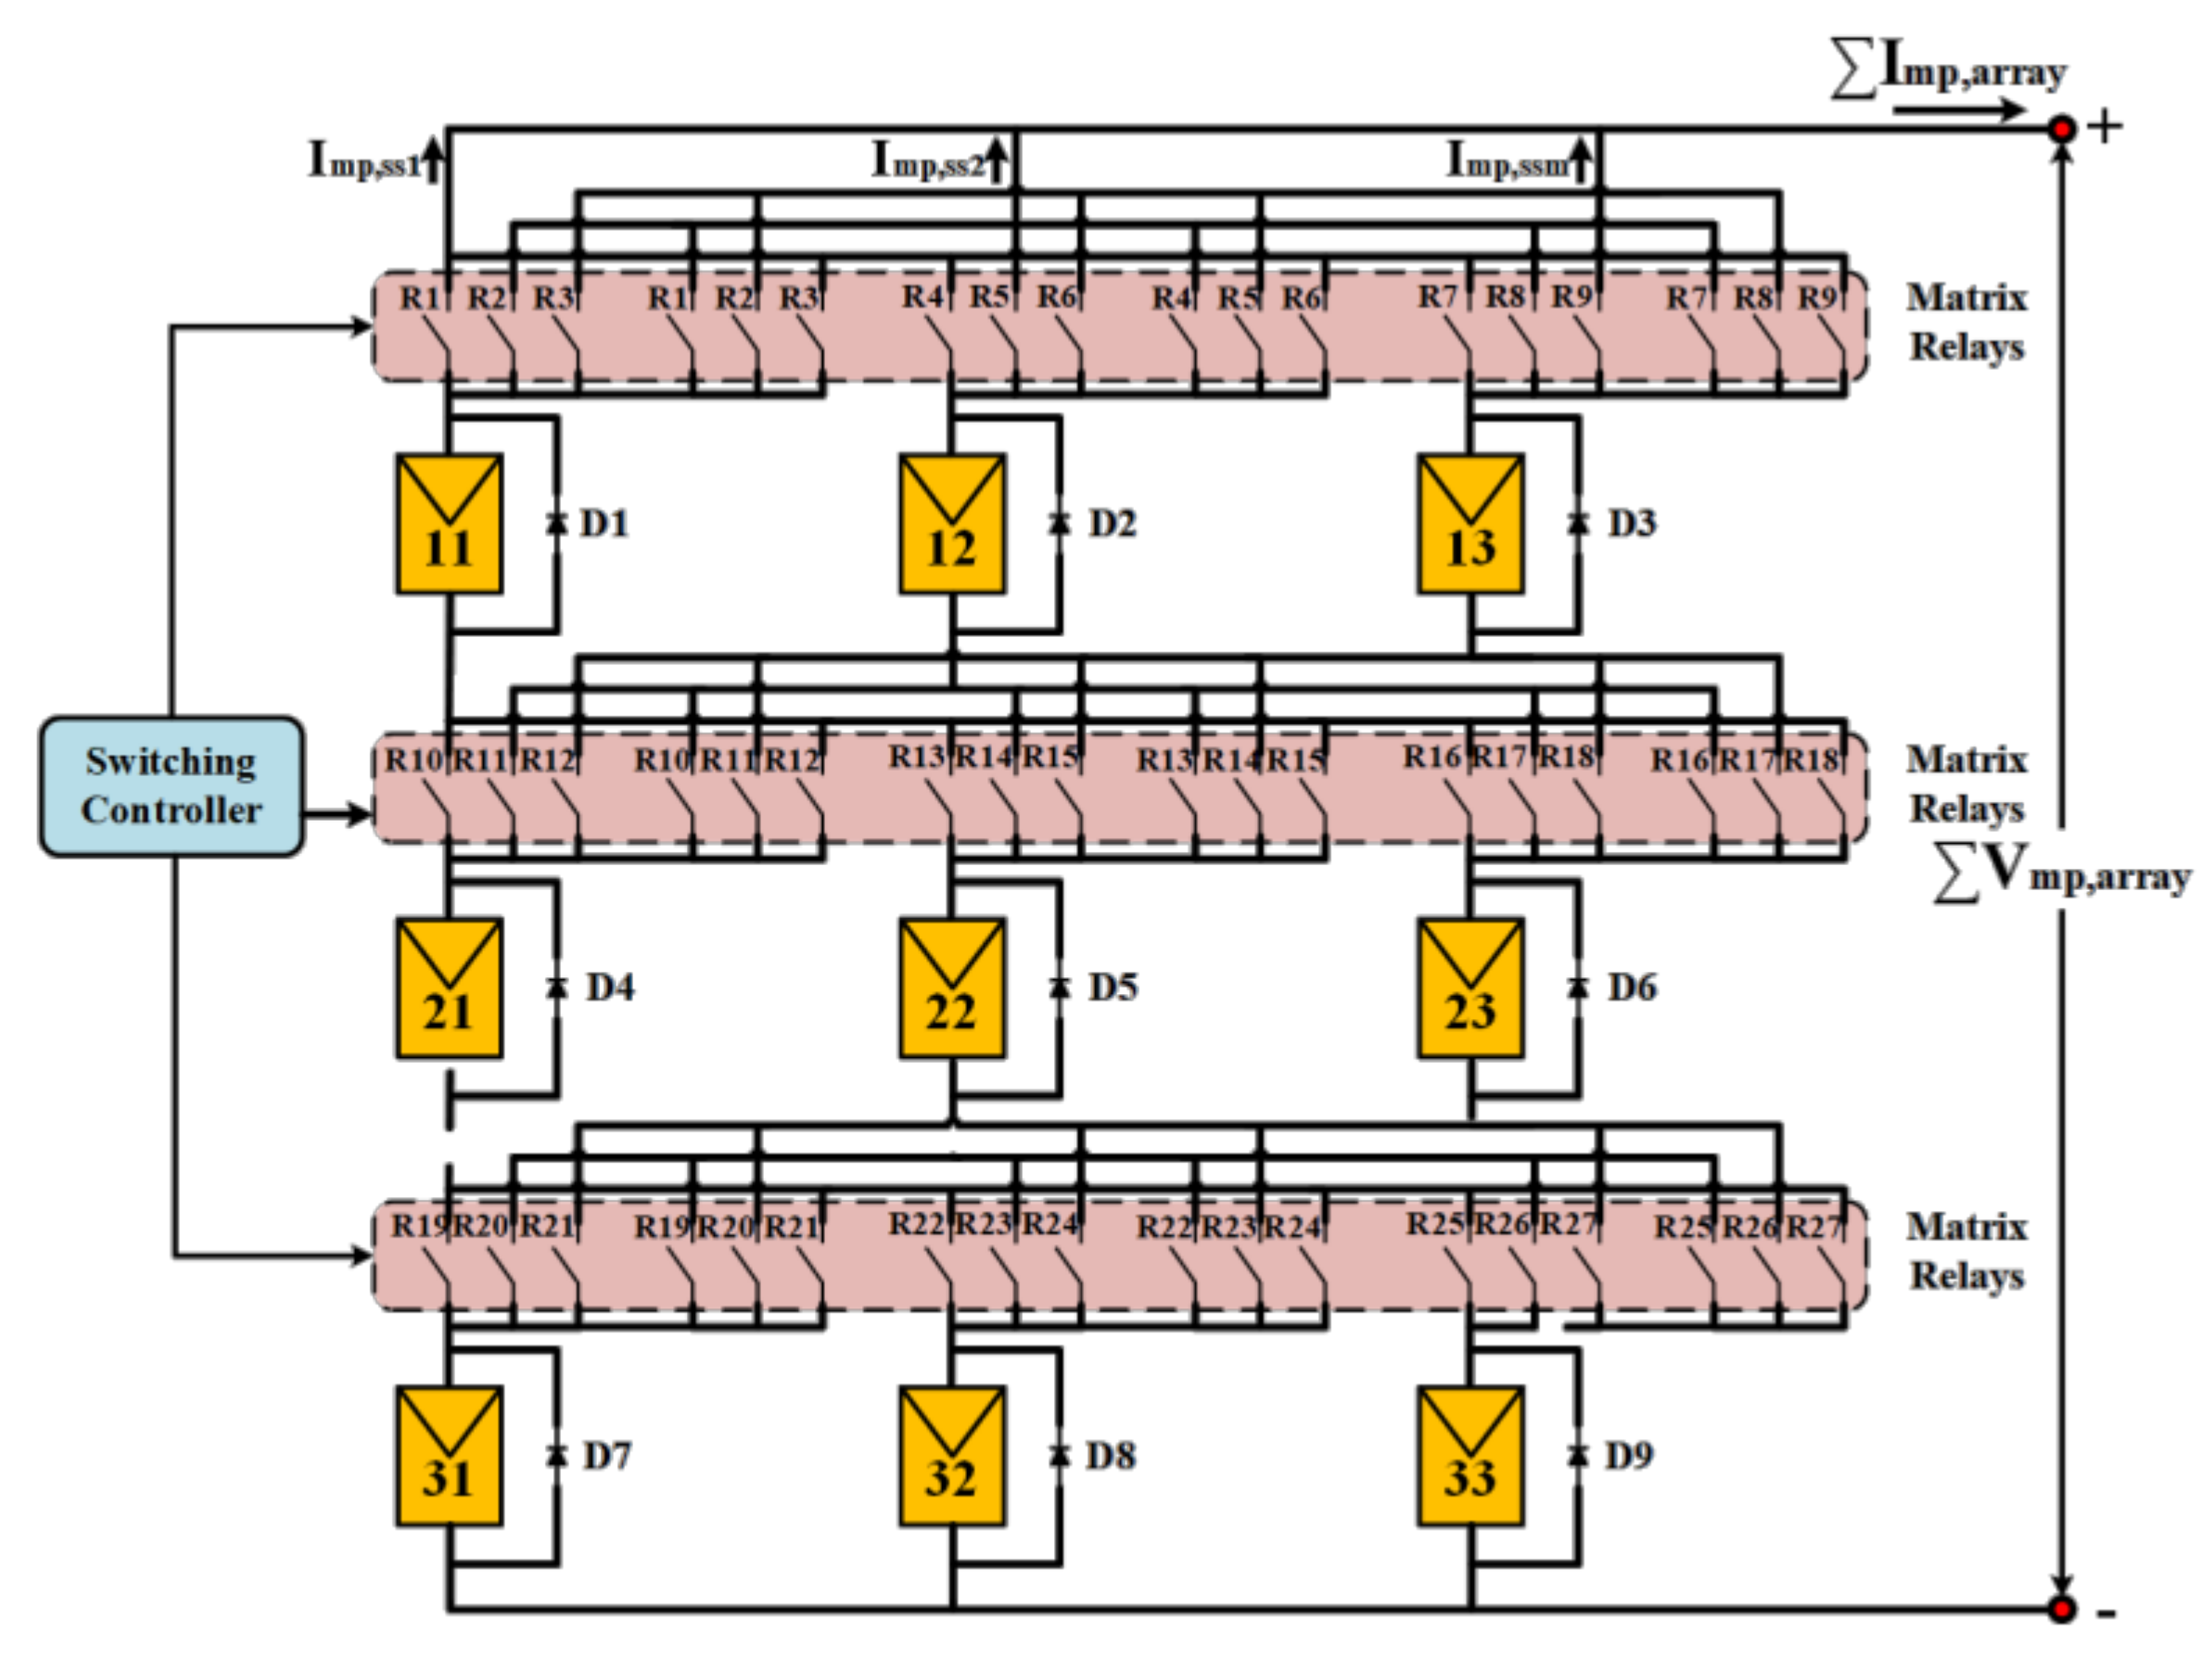
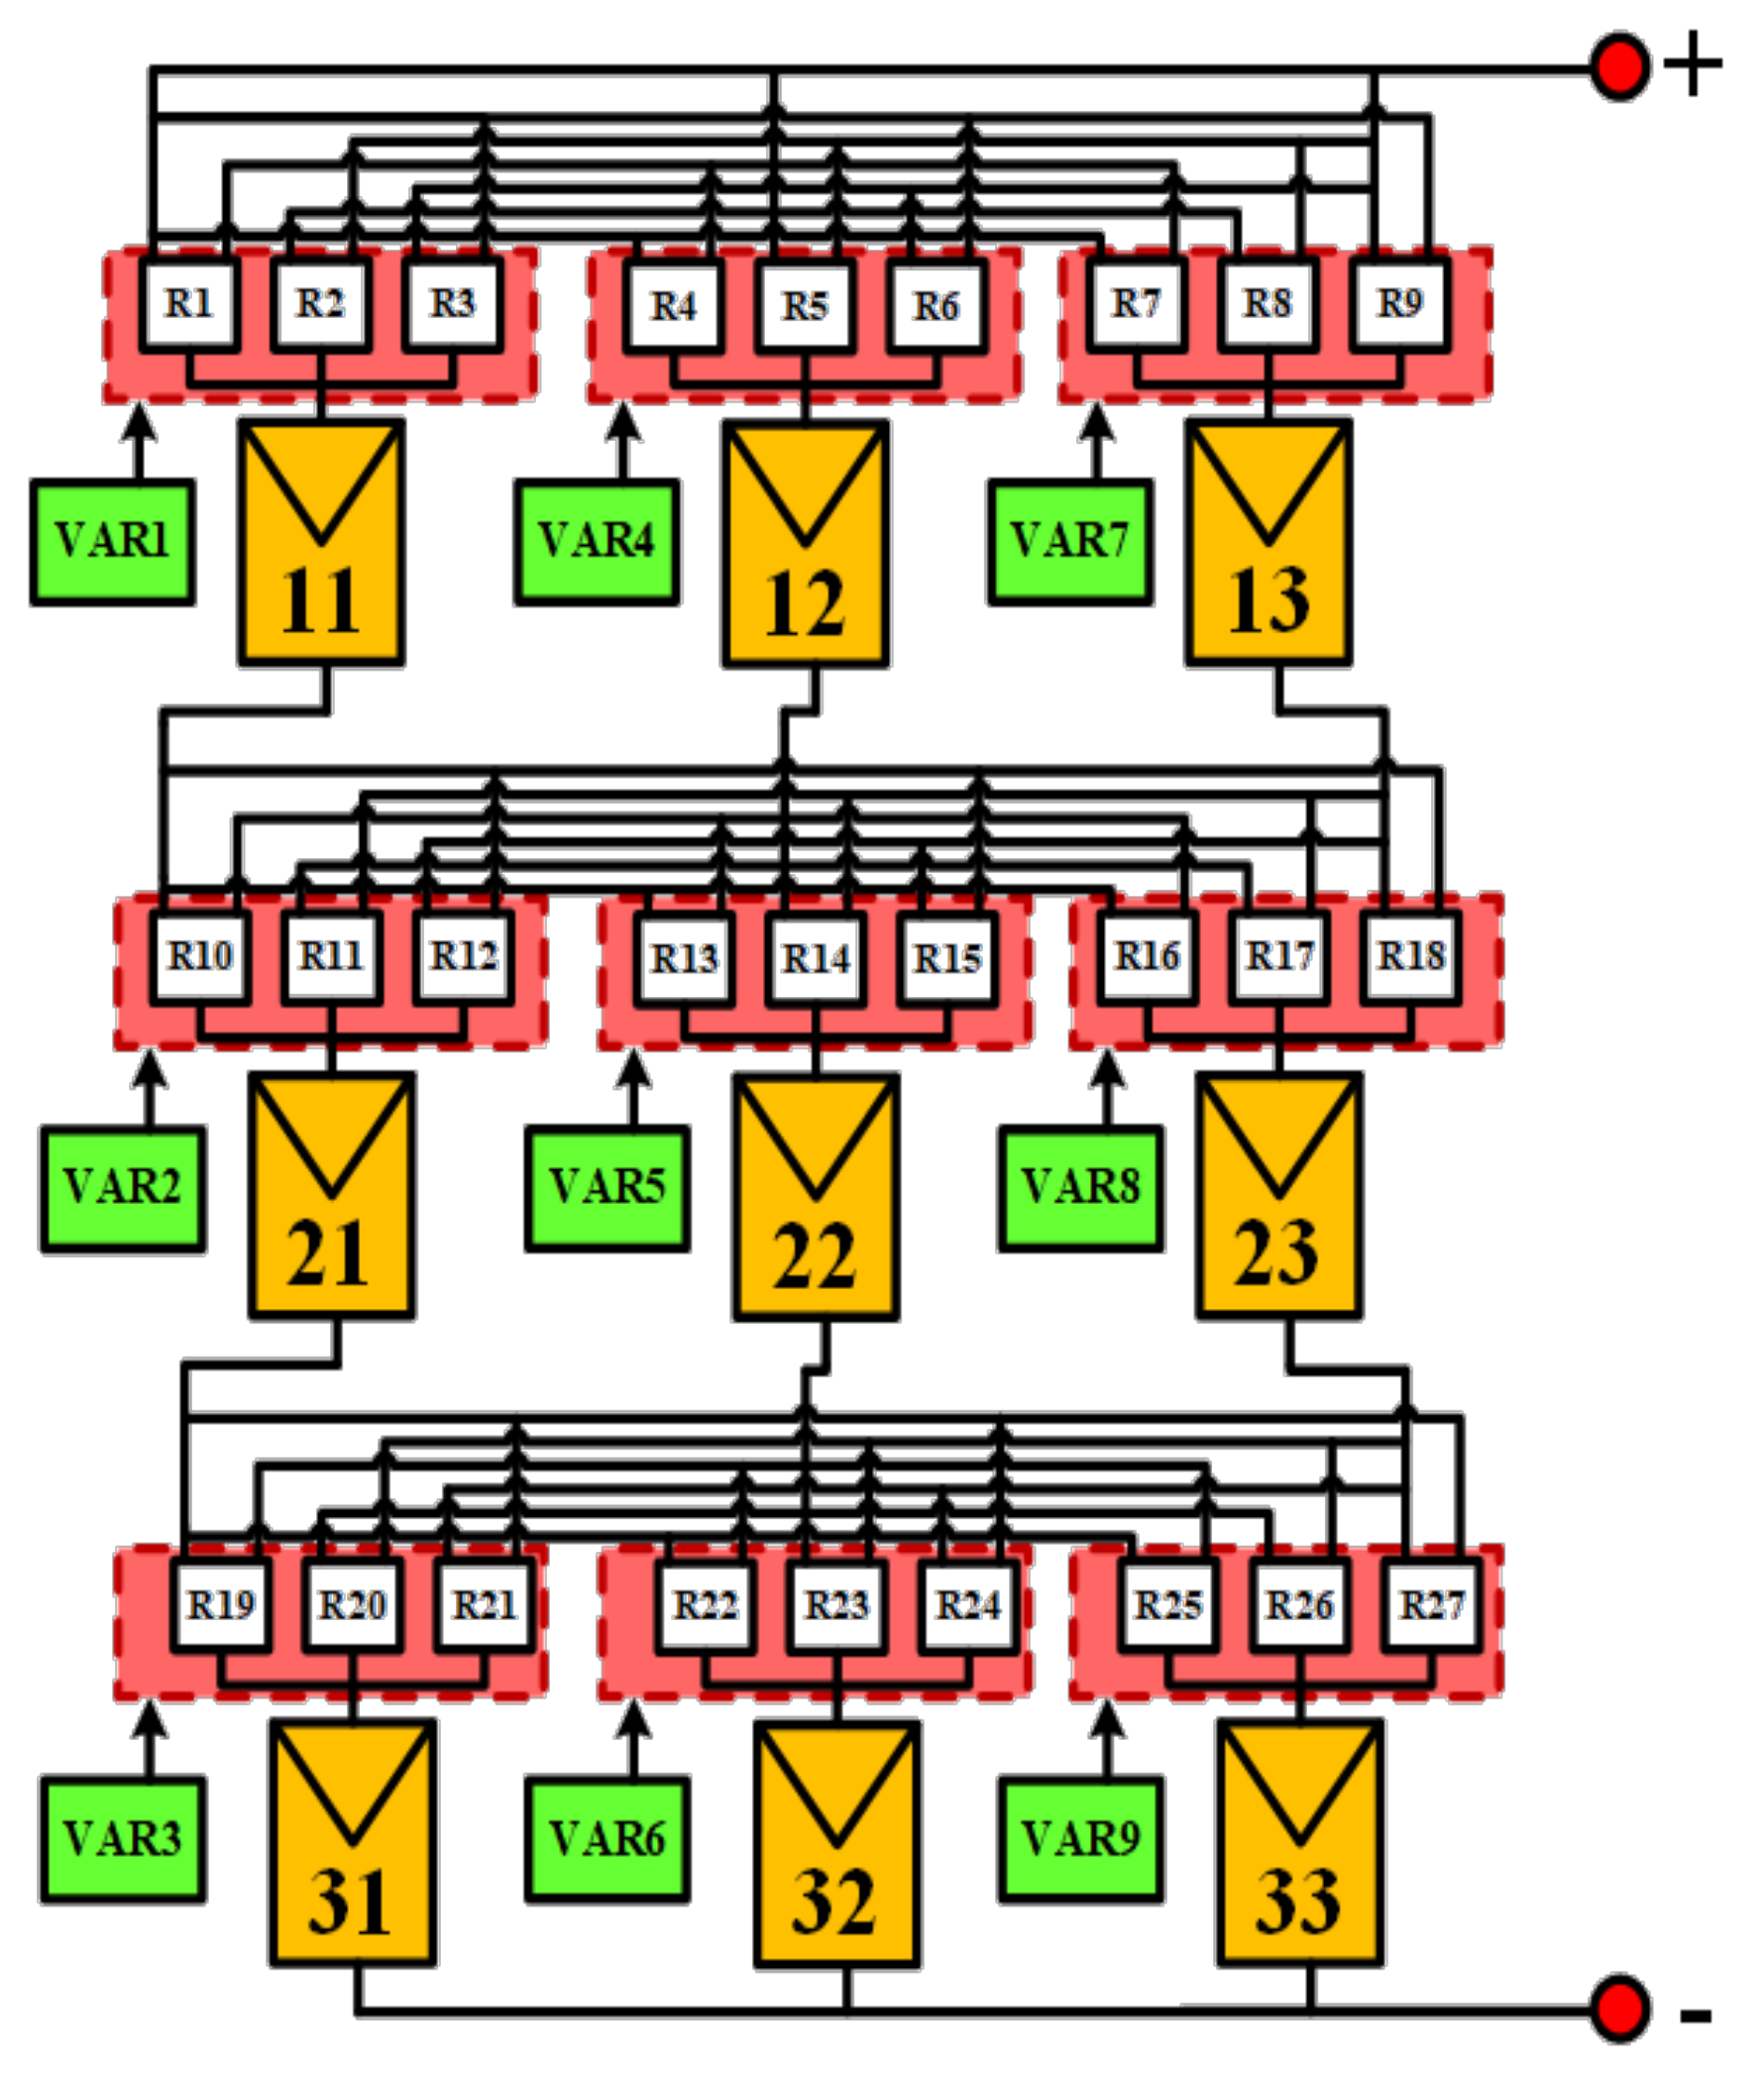
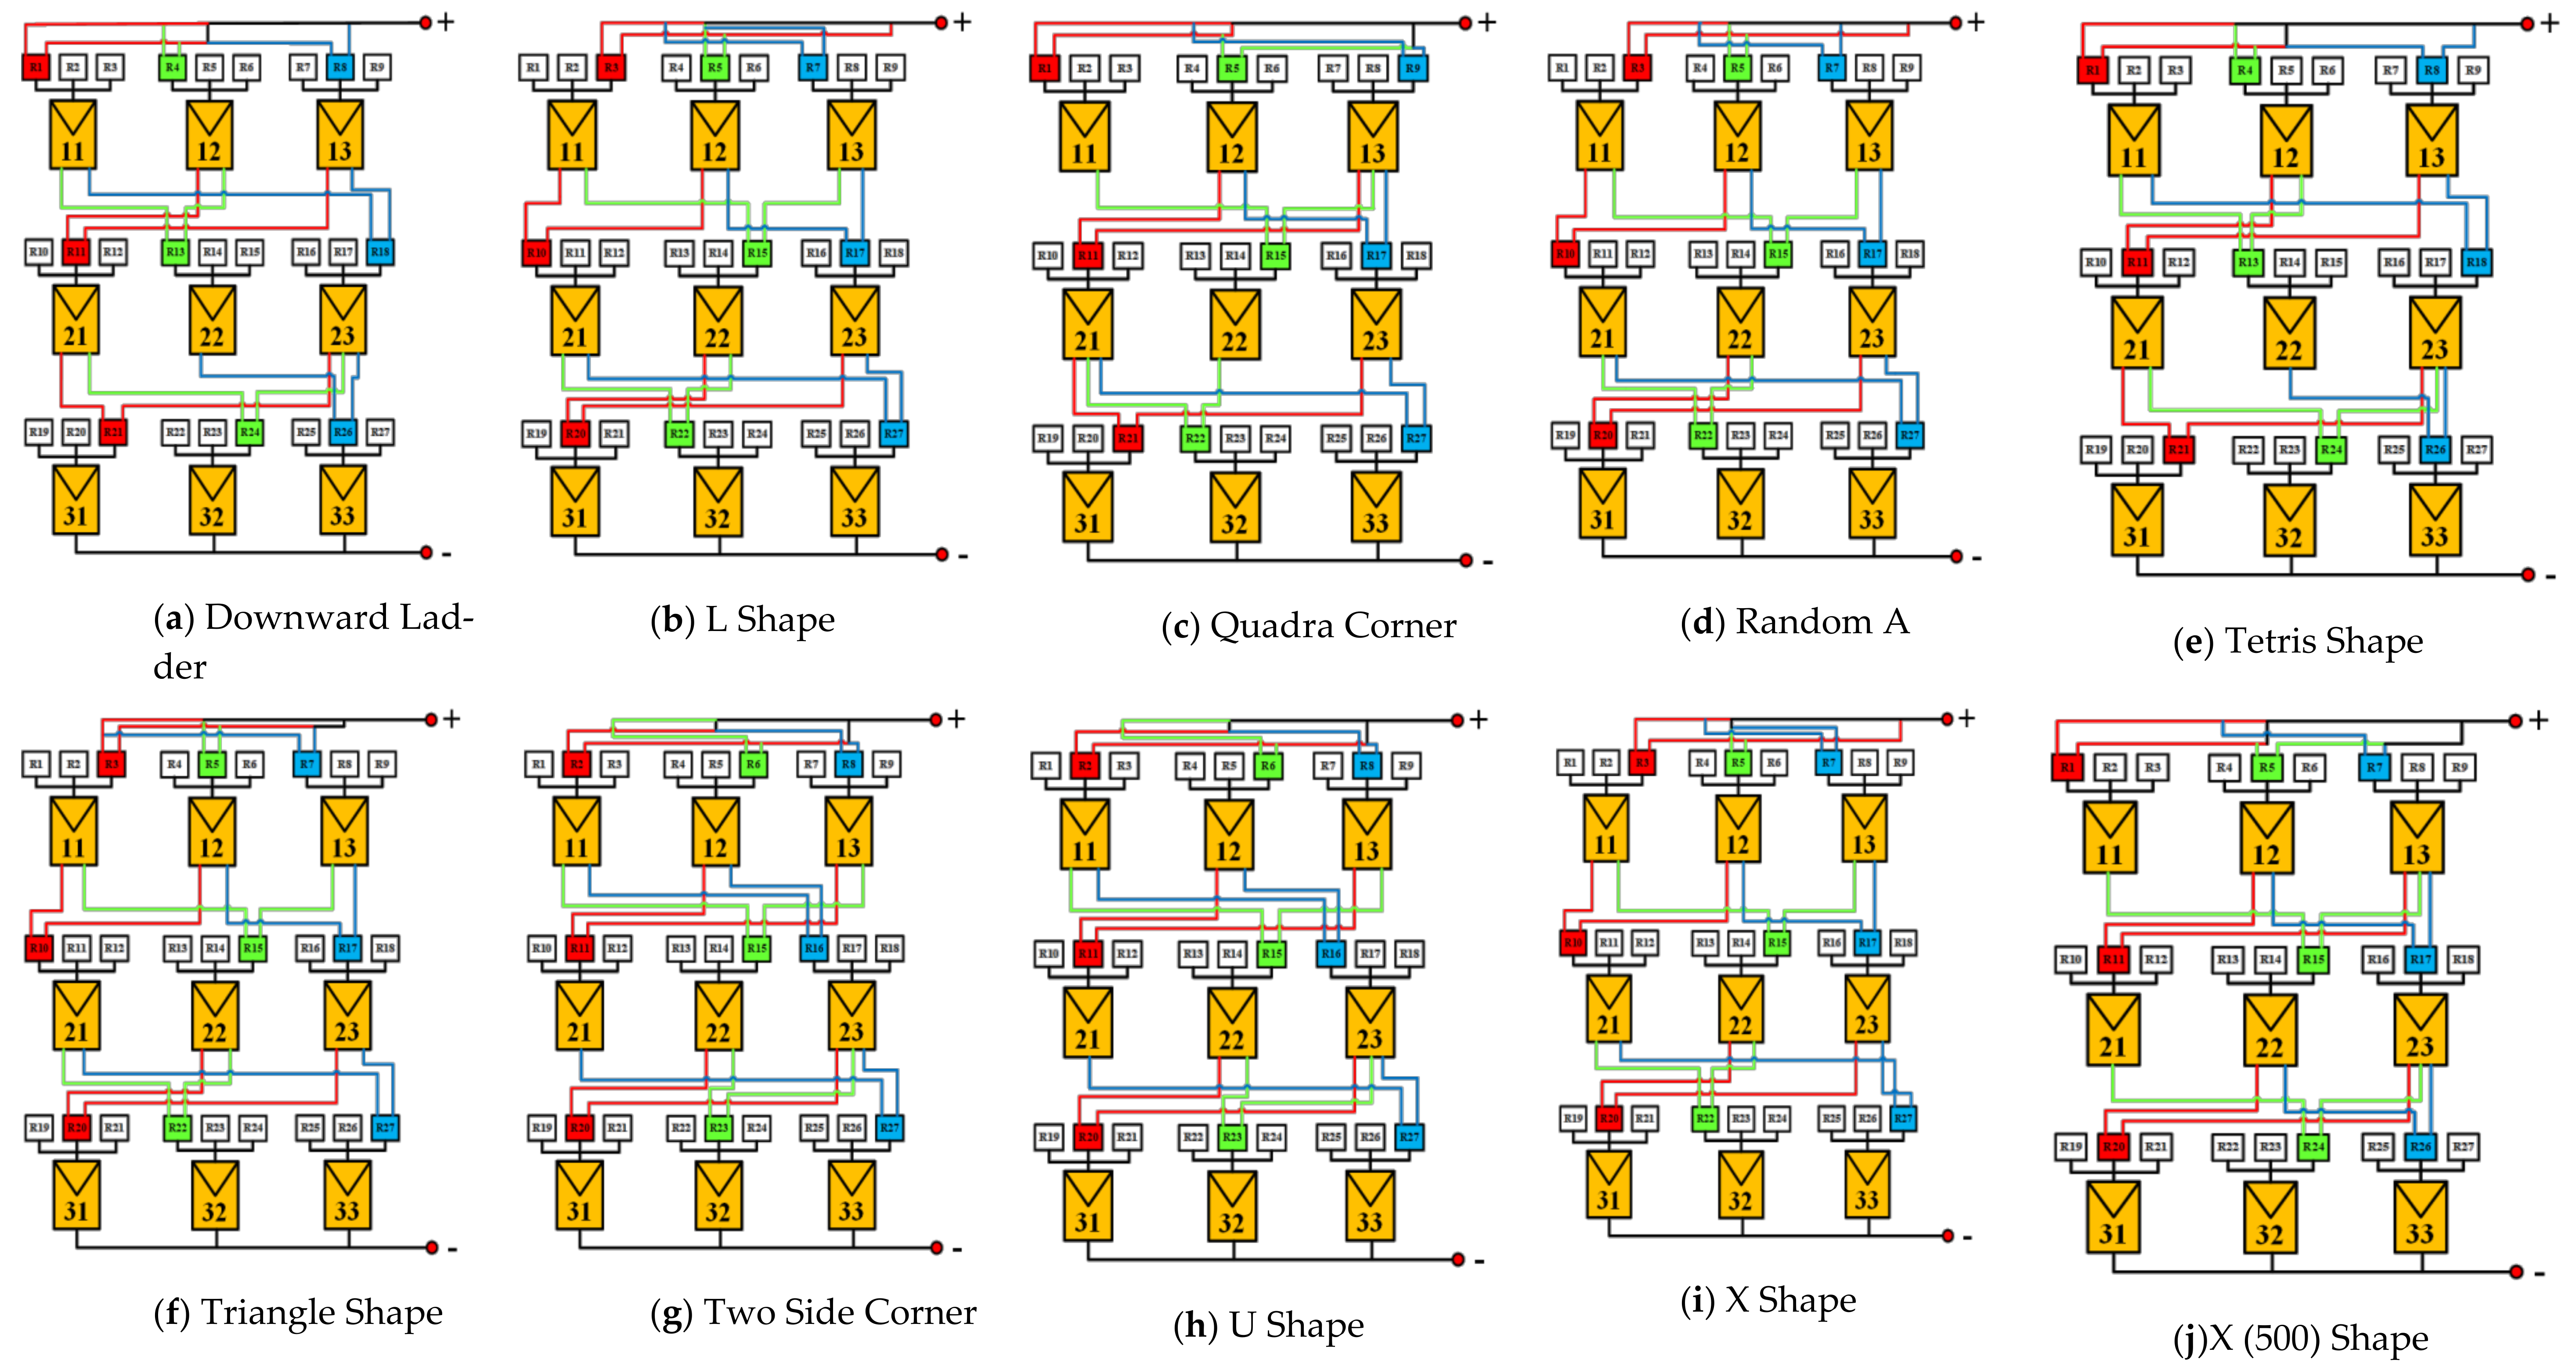
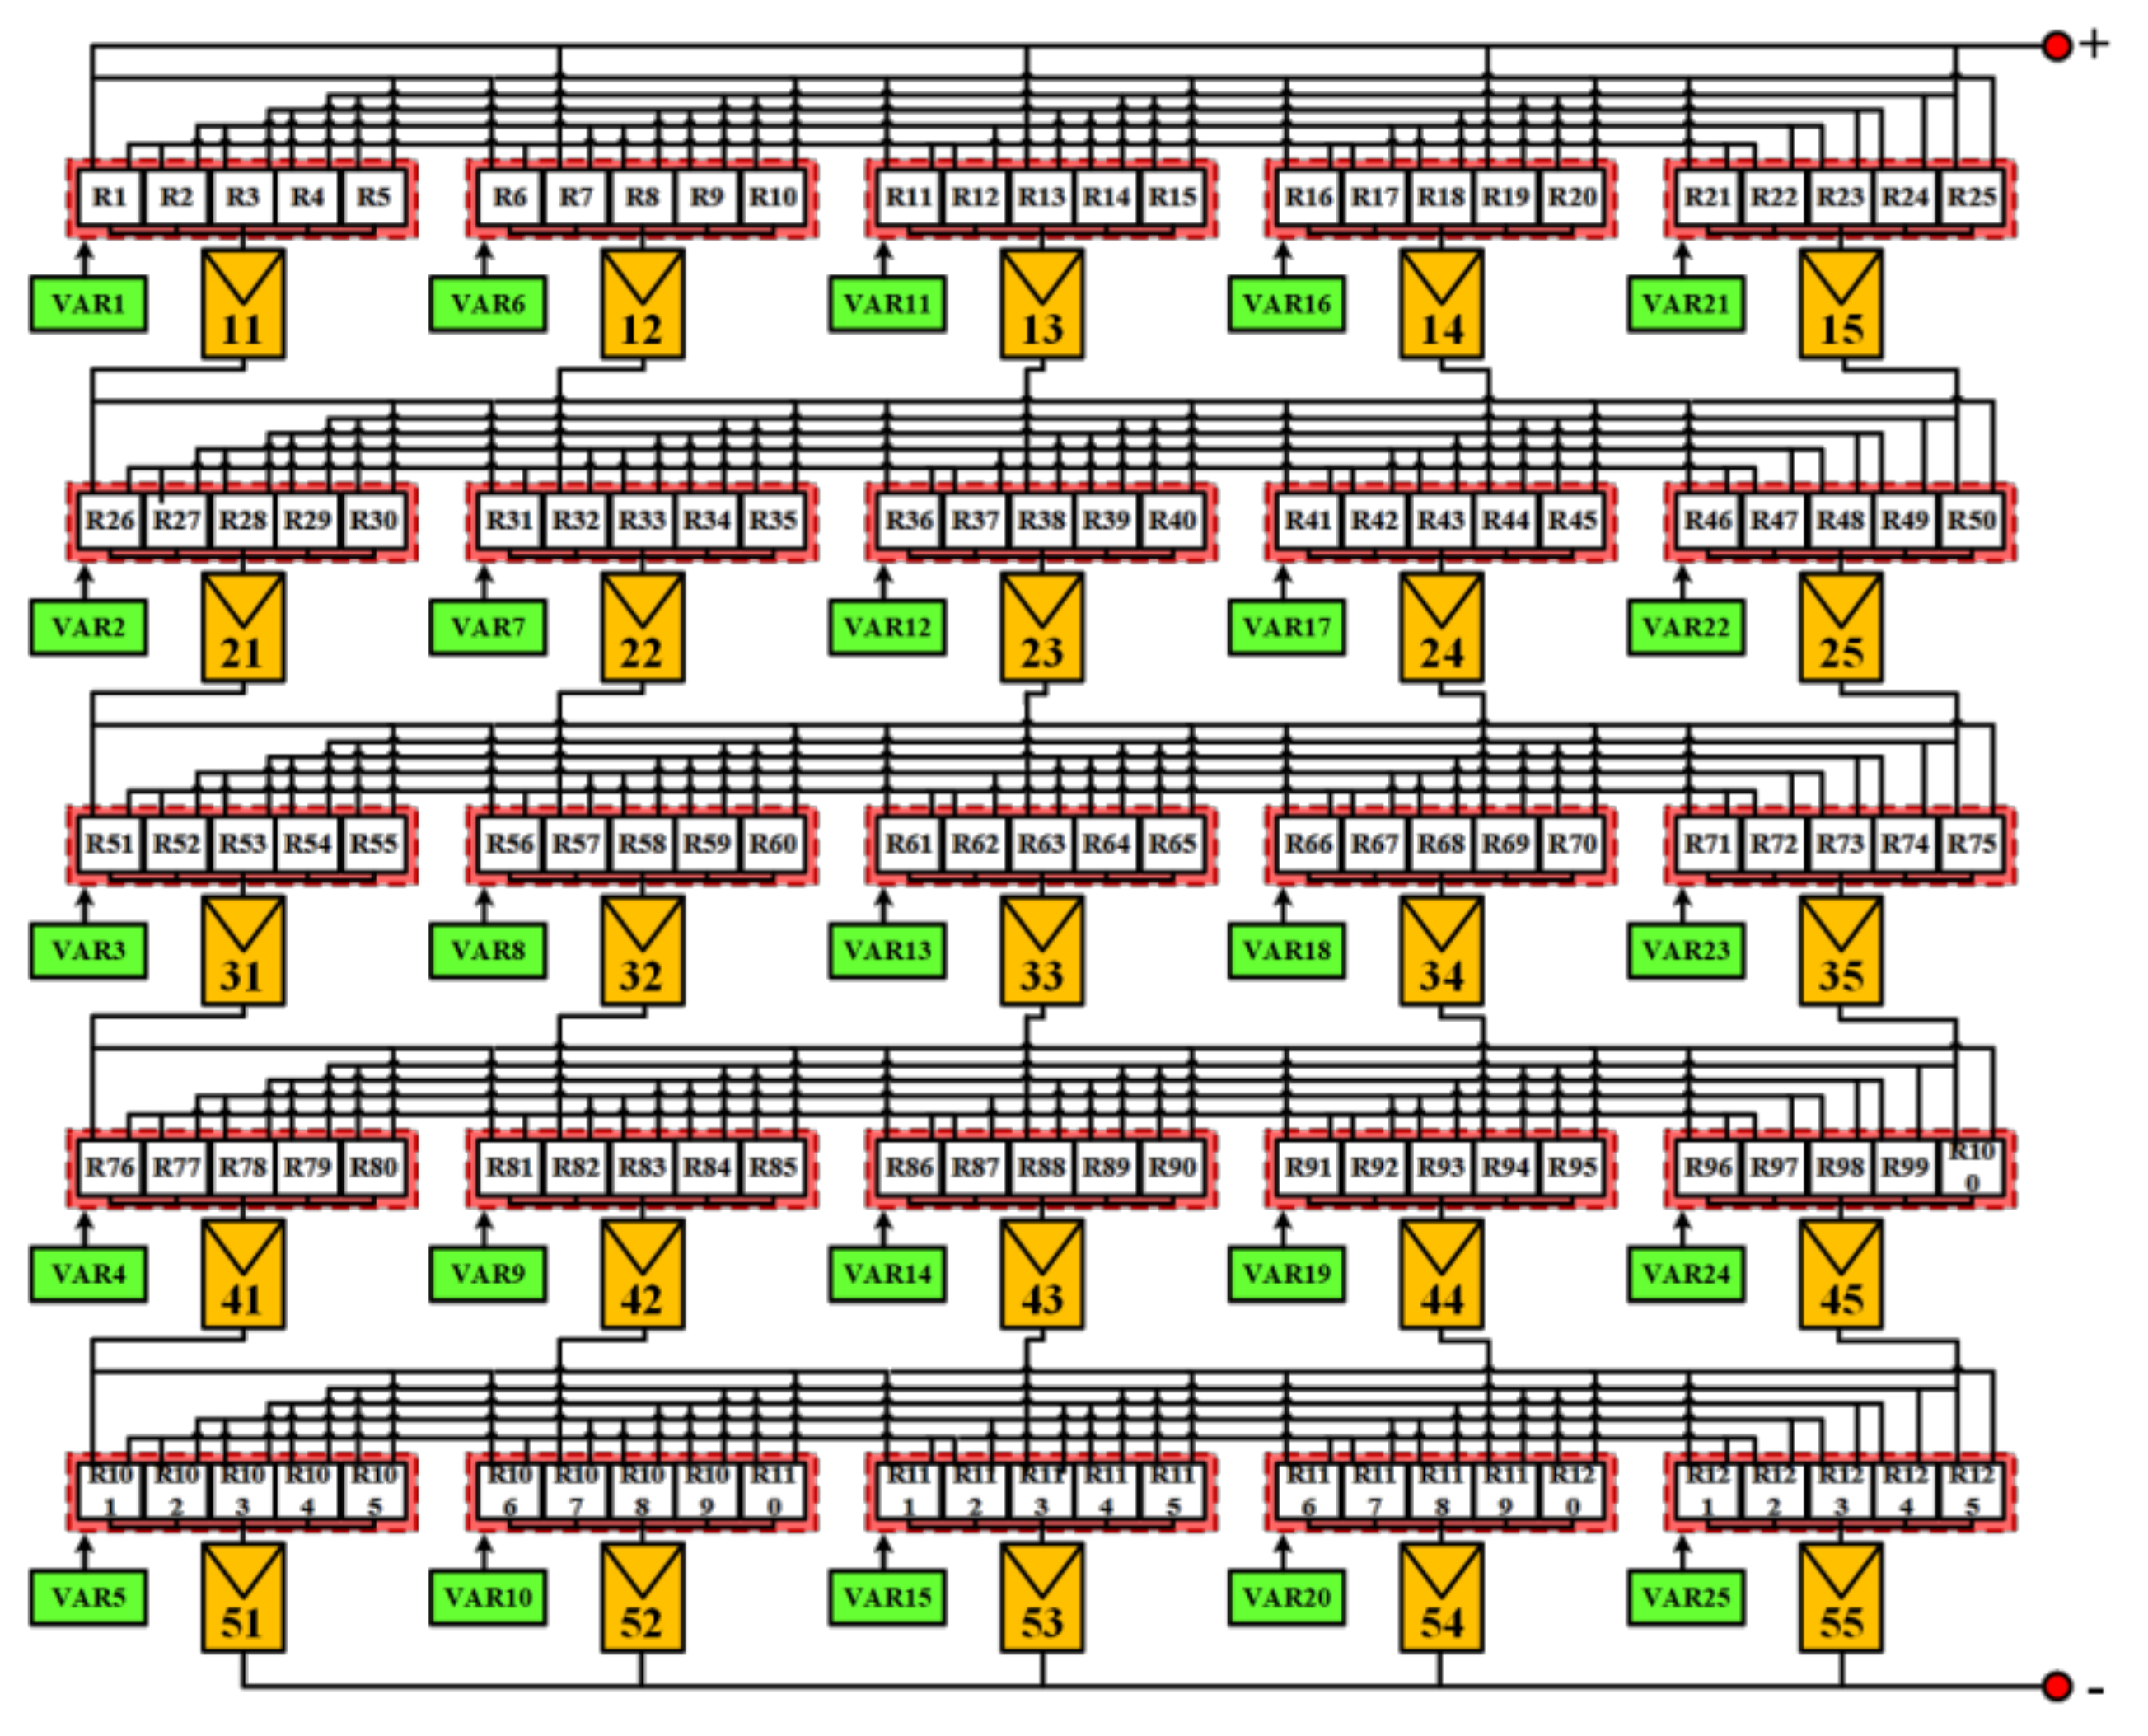
2.3. Proposed REA Mechanism Application-Based SP Interconnection
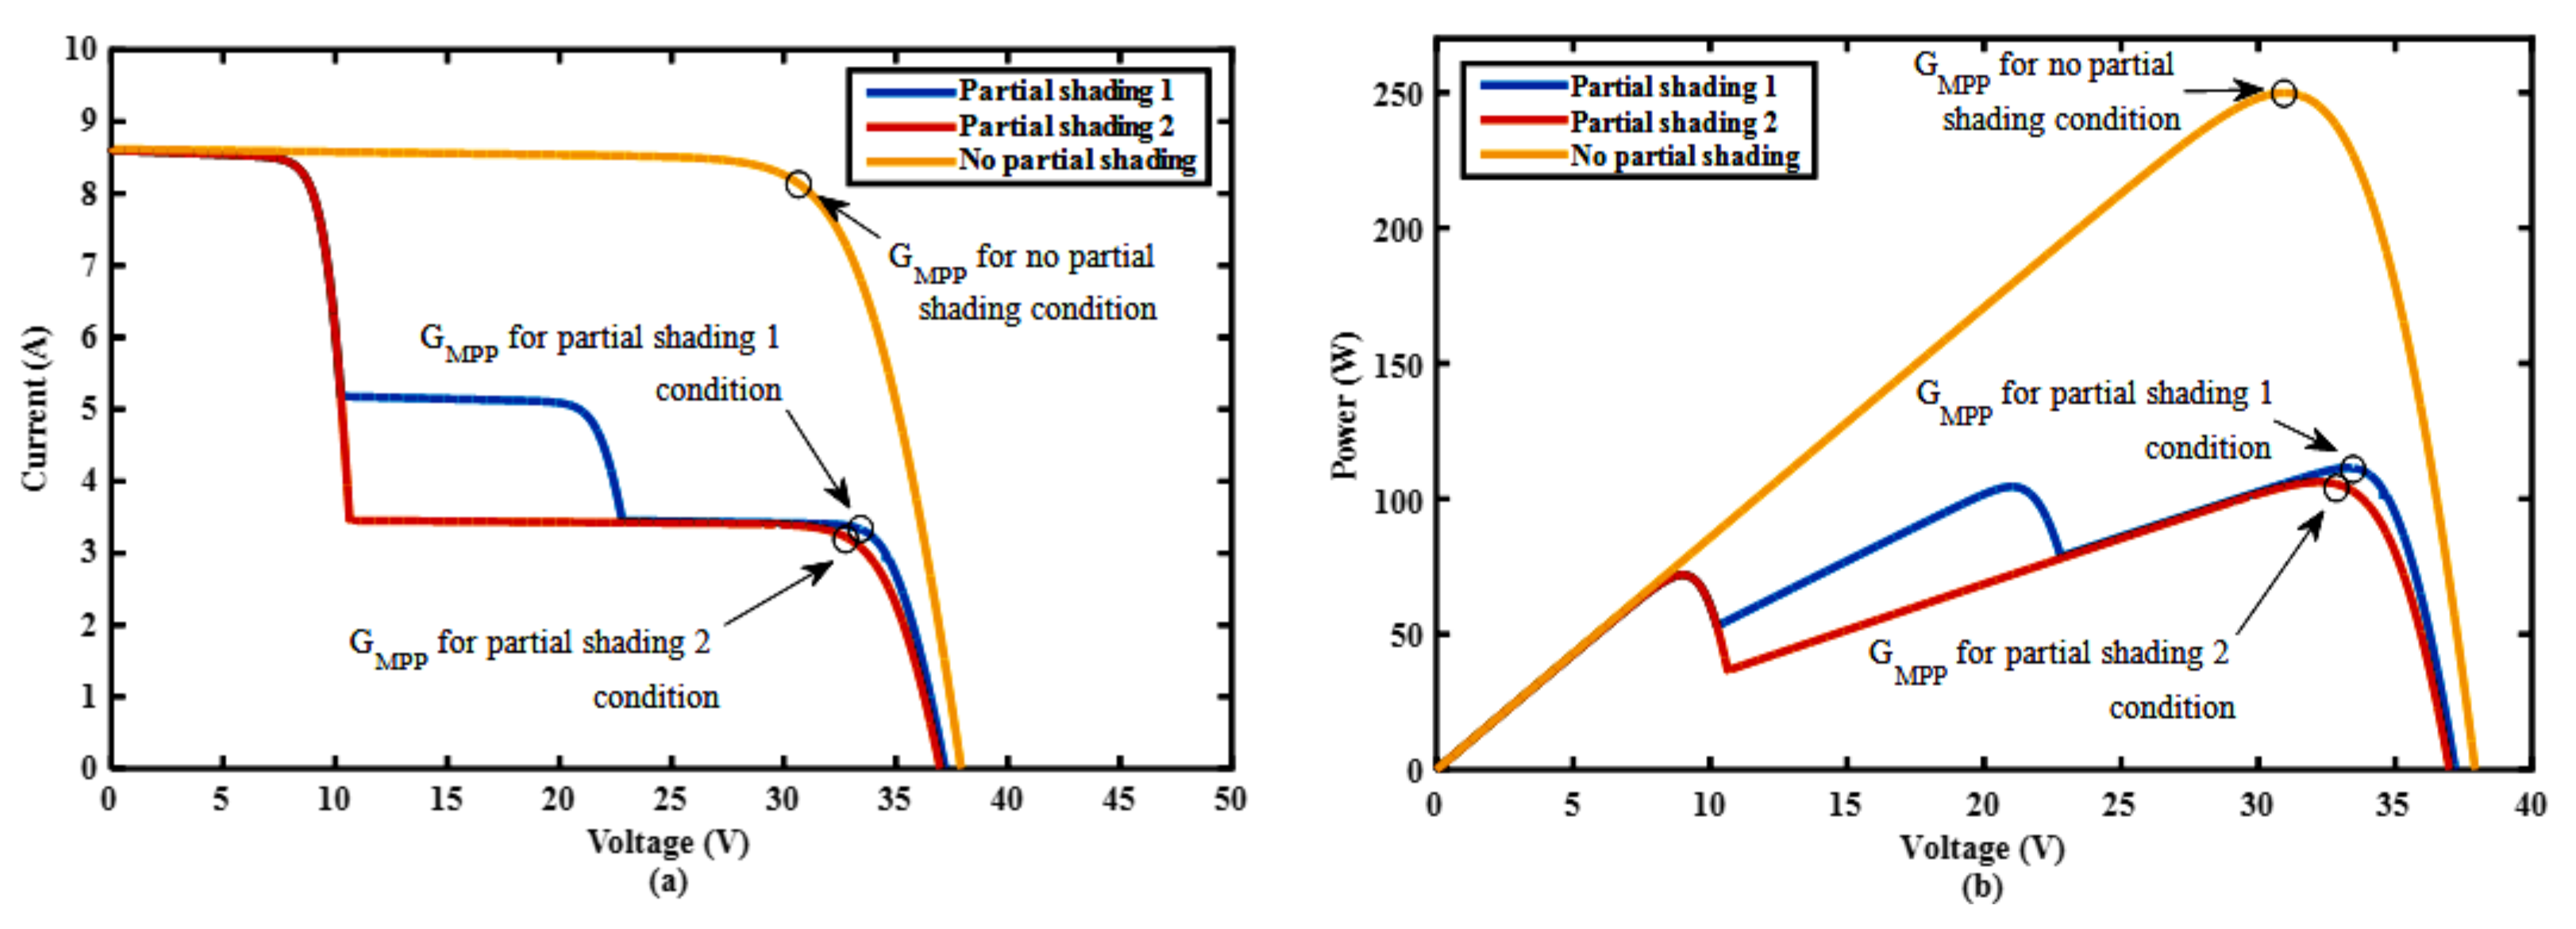
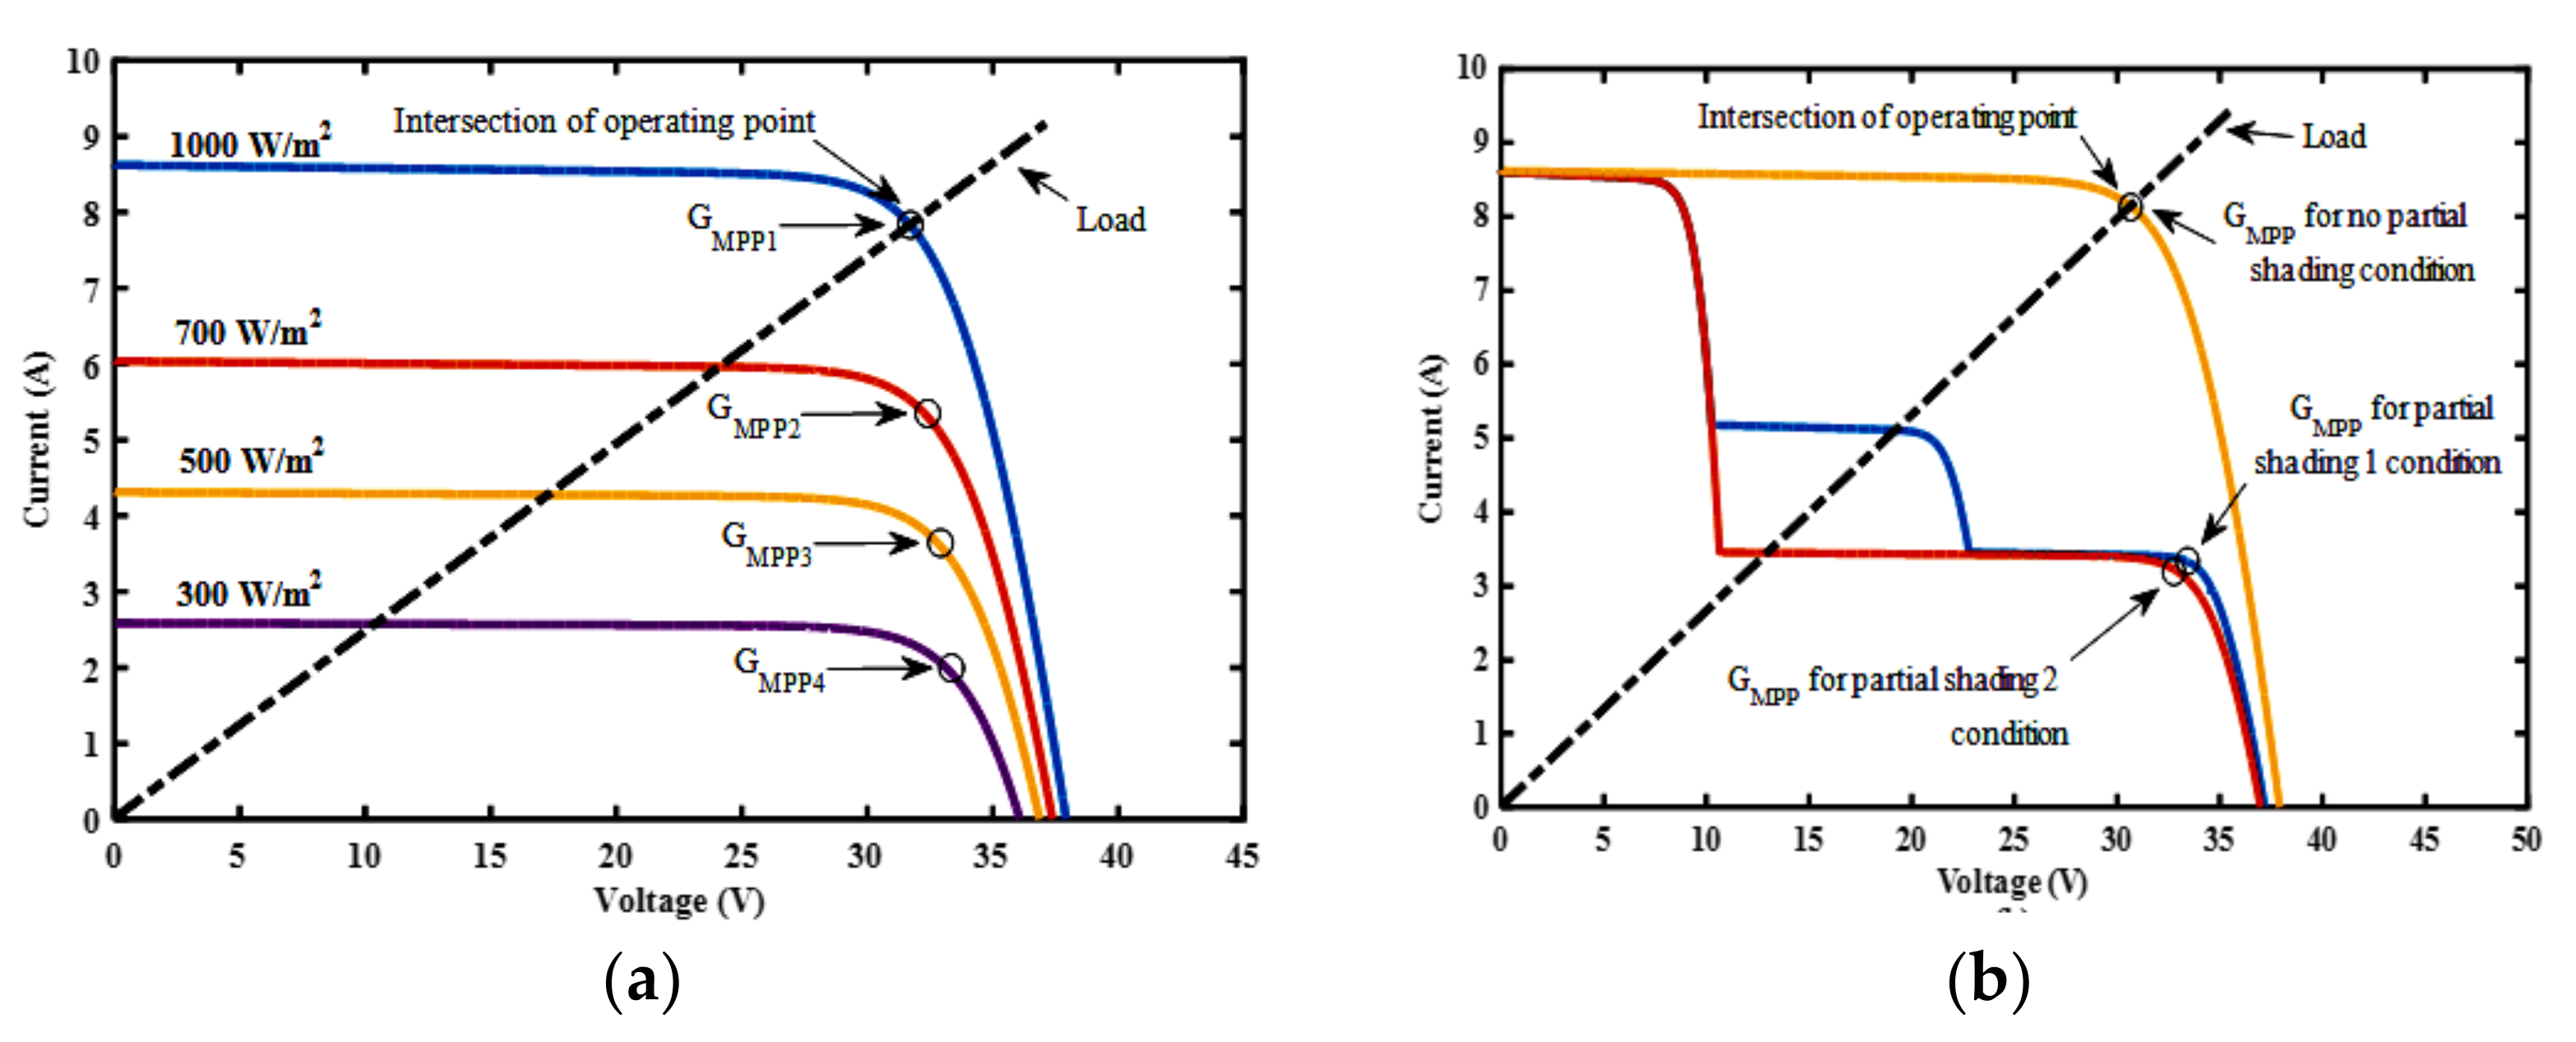
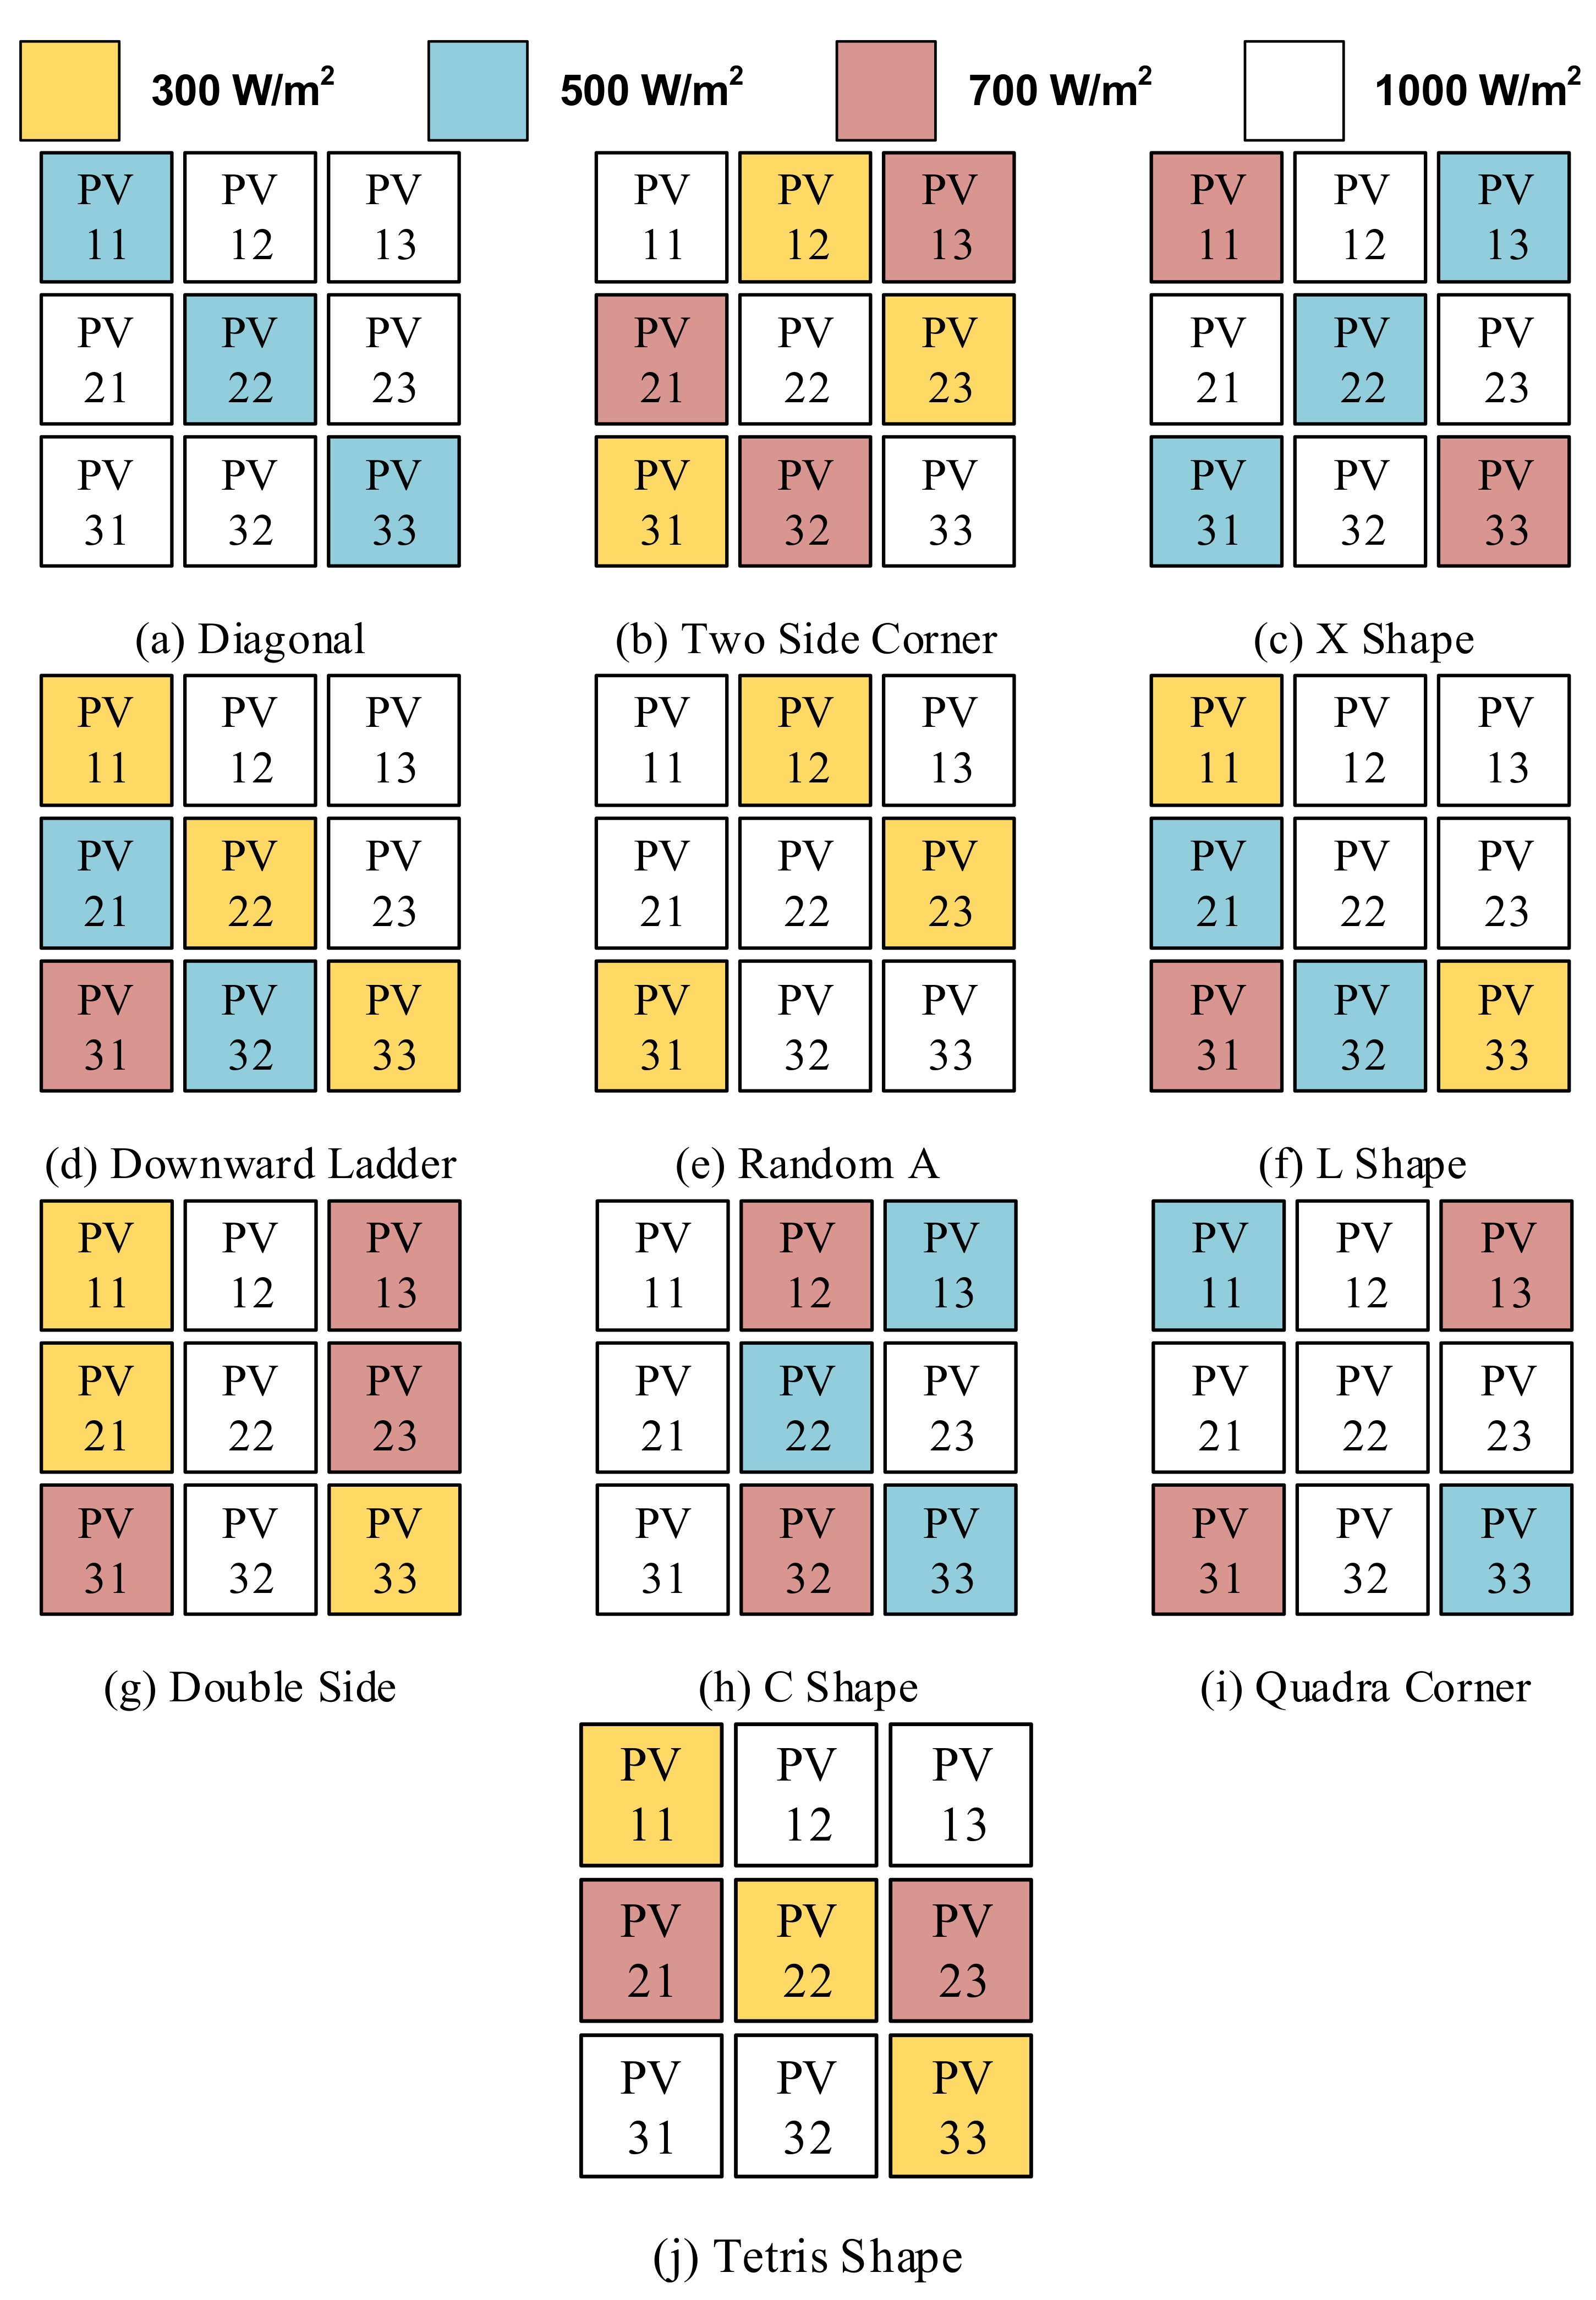
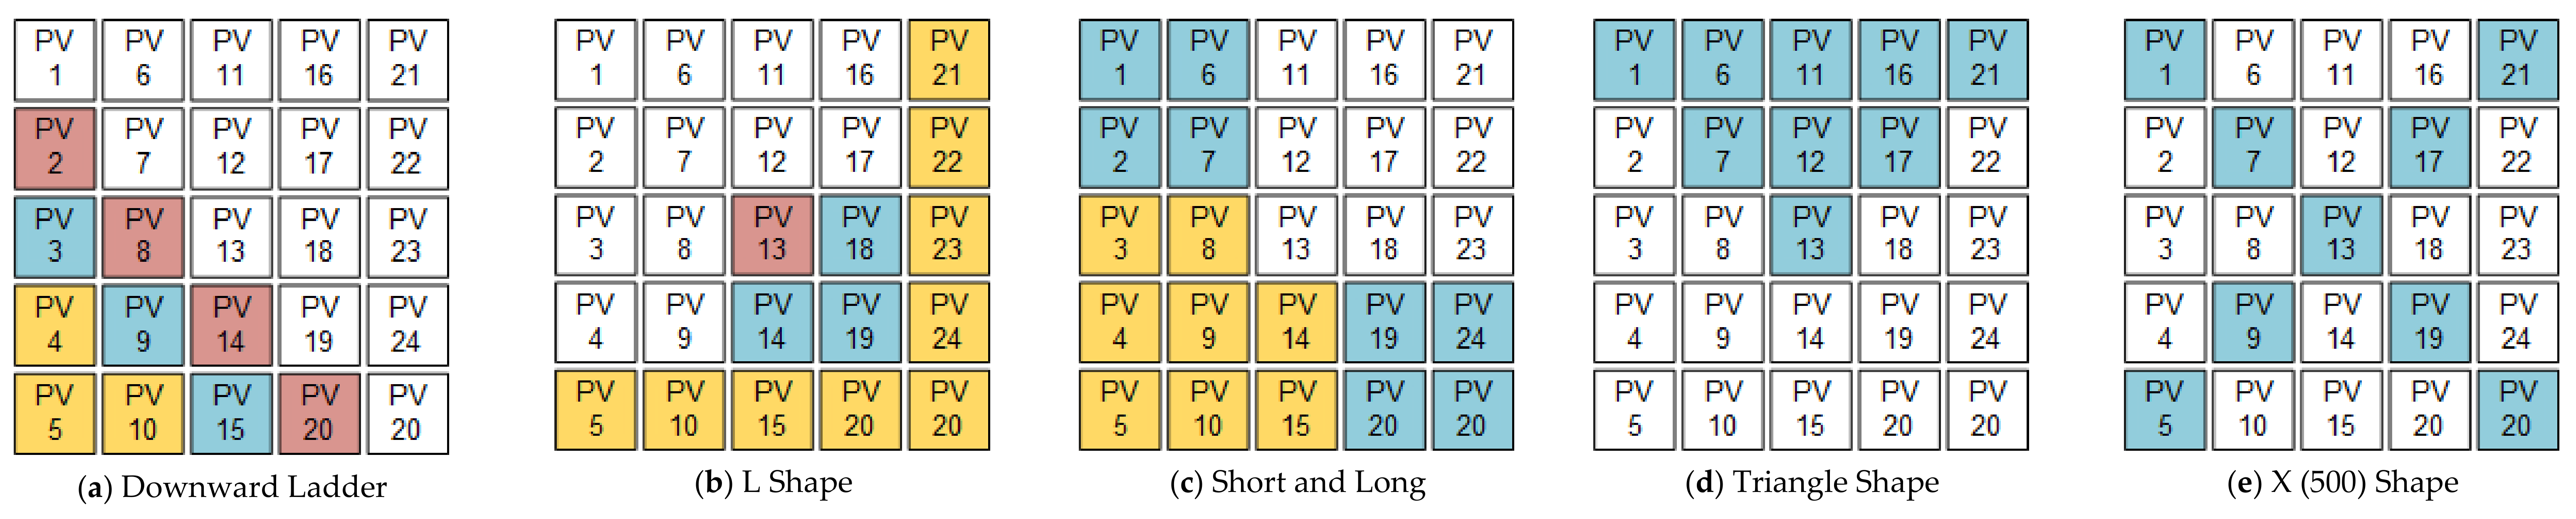
2.4. Analysis of Partial Shading (PS) Profiles
2.5. Analysis of PV Arrays and the Proposed REA Technique under Mismatch Profiles
- (a)
- Provides an extra safety circuit autonomously, which can be controlled automatically for maintenance purposes, such as damaged PV panel replacement, if the proposed solution is further developed in the future;
- (b)
- The proposed REA method can fully reconfigure the electrical wiring of the PV arrays’ interconnection without changing the physical location of the solar panels based on the surrounding climate or partial shading conditions, in order to enhance the performance of the PV systems under uncertain environmental climate conditions and assorted shading patterns;
- (c)
- The proposed REA approach can also reconfigure the electrical wiring by automatically disconnecting the unpredictable solar modules and reconnecting the working solar modules in the PV arrays, in order to reduce the greater energy loss caused by the non-working solar modules;
- (d)
- The REA technique can enhance the PV system’s power coefficient dynamically and ata highconvergence speed under any partial shading conditions;
- (e)
- The proposed PVAR technique is compatible with any algorithm, such as the particle swarm optimization (PSO), genetic algorithm (GA), and differential equation (DE) algorithms, as well as any other algorithms for the further improvement and ful reconfiguration of PV systems’ topology.
3. Conclusions
Supplementary Materials
Author Contributions
Funding
Institutional Review Board Statement
Informed Consent Statement
Data Availability Statement
Conflicts of Interest
References
- Vysakh, M.; Azharuddin, M.; Vilas, H.; Muralidhar, K.; Paul, D.; Jacob, B.; Rajasekar, N. Maximum power point tracking using modified PSO with CUK Converter. In Proceedings of the 2014 International Conference on Advances in Electrical Engineering (ICAEE), Singapore, 19 February 2014; pp. 1–6. [Google Scholar]
- Manoharan, P.; Subramaniam, U.; Babu, T.S.; Padmanaban, S.; Holm-Nielsen, J.B.; Mitolo, M.; Ravichandran, S. Improved perturb & observation maximum power point tracking technique for solar photovoltaic power generation systems. IEEE Syst. J. 2020, 1–13. [Google Scholar] [CrossRef]
- Kumar, N.M.; Yadav, S.K.; Chopra, S.S.; Bajpai, U.; Gupta, R.P.; Padmanaban, S.; Blaabjerg, F. Operational performance of on-grid solar photovoltaic system integrated into pre-fabricated portable cabin buildings in warm and temperate climates. Energy Sustain. Dev. 2020, 57, 109–118. [Google Scholar] [CrossRef]
- Shamshuddin, M.A.; Babu, T.S.; Dragicevic, T.; Miyatake, M.; Rajasekar, N. Priority-based energy management technique for integration of solar PV, battery, and fuel cell systems in an autonomous DC microgrid. Electr. Power Components Syst. 2017, 45, 1881–1891. [Google Scholar] [CrossRef]
- Dalia, Y.; Babu, T.S.; Allam, D.; Ramachandaramurthy, V.; Beshr, E.; Eteiba, M. Fractional chaos maps with flower pollination algorithm for partial shading mitigation of photovoltaic systems. Energies 2019, 12, 3548. [Google Scholar]
- Dalia, Y.; Babu, T.S.; Allam, D.; Ramachandaramurthy, V.K.; Eteiba, M.B. A novel chaotic flower pollination algorithm for global maximum power point tracking for photovoltaic system under partial shading conditions. IEEE Access 2019, 7, 121432–121445. [Google Scholar]
- Malvoni, M.; Kumar, N.M.; Chopra, S.S.; Hatziargyriou, N. Performance and degradation assessment of large-scale grid-connected solar photovoltaic power plant in tropical semi-arid environment of India. Sol. Energy 2020, 203, 101–113. [Google Scholar] [CrossRef]
- Kumar, M.S.; Vishnupriyan, J.; Kumar, N.M. Model Predictive Control Strategy-based Voltage Sensing of Quasi Z-Source Cascaded Multi-Level PV Inverter with Distributed MPPT Algorithm. Int. J. Renew. Energy Res. 2020, 10, 183–192. [Google Scholar]
- Ram, J.P.; Babu, T.S.; Rajasekar, N. Fpa based approach for solar maximum power point tracking. In Proceedings of the 2016 IEEE 6th International Conference on Power Systems (ICPS), New Delhi, India, 4–6 March 2016; pp. 1–6. [Google Scholar]
- Femia, N.; Petrone, G.; Spagnuolo, G.; Vitelli, M. Optimization of perturb and observe maximum power point tracking method. IEEE Trans. Power Electron. 2005, 20, 963–973. [Google Scholar] [CrossRef]
- Safari, A.; Mekhilef, S. Simulation and hardware implementation of incremental conductance MPPT with direct control method using cuk converter. IEEE Trans. Ind. Electron. 2011, 58, 1154–1161. [Google Scholar] [CrossRef]
- Tan, C.Y.; Rahim, N.A.; Selvaraj, J. Employing dual scaling mode for adaptive hill climbing method on buck converter. IET Renew. Power Gener. 2015, 9, 1010–1018. [Google Scholar] [CrossRef]
- Babu, G.G.; Sudhakar, T.; Rajasekar, N.; Sangeetha, K. Modified particle swarm optimization technique based maximum power point tracking for uniform and under partial shading condition. Appl. Soft Comput. 2015, 34, 613–624. [Google Scholar] [CrossRef]
- Ajmal, A.M.; Babu, T.S.; Ramachandaramurthy, V.K.; Yousri, D.; Ekanayake, J.B. Static and dynamic reconfiguration approaches for mitigation of partial shading influence in photovoltaic arrays. Sustain. Energy Technol. Assessments 2020, 40, 100738. [Google Scholar] [CrossRef]
- Darussalam, R.; Pramana, R.I.; Rajani, A. Experimental Investigation of Serial Parallel and Total-Cross-Tied Configuration Photovoltaic Under Partial Shading Conditions. In Proceedings of the 2017 International Conference on Sustainable Energy Engineering and Application (ICSEEA), Jakarta, Indonesia, 23–24 October 2017; pp. 140–144. [Google Scholar]
- Deshkar, S.N.; Dhale, S.B.; Mukherjee, J.S.; Babu, T.S.; Rajasekar, N. Solar PV array reconfiguration under partial shading conditions for maximum power extraction using genetic algorithm. Renew. Sustain. Energy Rev. 2015, 43, 102–110. [Google Scholar] [CrossRef]
- Rajan, N.A.; Shrikant, K.D.; Dhanalakshmi, B.; Rajasekar, N. Solar PV array reconfiguration using the concept of Standard deviation and Genetic Algorithm. Energy Procedia 2017, 117, 1062–1069. [Google Scholar] [CrossRef]
- Balato, M.; Costanzo, L.; Vitelli, M. Series-Parallel PV array reconfiguration: Maximization of the extraction of energy and much more. Appl. Energy 2015, 159, 145–160. [Google Scholar] [CrossRef]
- Babu, T.S.; Ram, J.P.; Dragicevic, T.; Miyatake, M.; Blaabjerg, F.; Rajasekar, N. Particle Swarm Optimization based Solar PV Array Reconfiguration of the Maximum Power Extraction under Partial Shading Conditions. IEEE Trans. Sustain. Energy 2017, 9, 74–85. [Google Scholar] [CrossRef]
- Tajuddin, M.F.N.; Arif, M.S.; Ayob, S.M.; Salam, Z. Perturbative methods for maximum power point tracking (MPPT) of photovoltaic (PV) systems: A review. Int. J. Energy Res. 2015, 39, 1153–1178. [Google Scholar] [CrossRef]
- Ishaque, K.; Salam, Z. A Deterministic Particle Swarm Optimization Maximum Power Point Tracker for Photovoltaic System under Partial Shading Condition. IEEE Trans. Ind. Electron. 2012, 60, 1. [Google Scholar] [CrossRef]
- Rani, B.I.; Ilango, G.S.; Nagamani, C. Enhanced power generation from PV array under partial shading conditions by shade dispersion using Su Do Ku configuration. IEEE Trans. Sustain. Energy 2013, 4, 594–601. [Google Scholar] [CrossRef]
- IIyer, S.R. Performance Comparison of Zig-Zag and Su Do Ku Schemes in a Partially Shaded Photo Voltaic Array under Static Shadow Conditions. In Proceedings of the 2017 Innovations in Power and Advanced Computing Technologies (i-PACT), Vellore, India, 21–22 April 2017; pp. 17–22. [Google Scholar]
- Rao, P.S.; Ilango, G.S.; Nagamani, C. Maximum power from PV arrays using a fixed configuration under different shading conditions. IEEE J. Photovoltaics 2014, 4, 679–686. [Google Scholar] [CrossRef]
- Yousri, D.; Babu, T.S.; Mirjalili, S.; Rajasekar, N.; Elaziz, M.A. A novel objective function with artificial ecosystem-based optimization for relieving the mismatching power loss of large-scale photovoltaic array. Energy Convers. Manag. 2020, 225, 113385. [Google Scholar] [CrossRef]
- Liu, Y.; Pang, Z.; Cheng, Z. Research on an adaptive solar photovoltaic array using shading degree model-based reconfiguration algorithm. In Proceedings of the 2010 Chinese Control and Decision Conference, Xuzhou, China, 26–28 May 2010; pp. 2356–2360. [Google Scholar] [CrossRef]
- Yousri, D.; Thanikanti, S.B.; Balasubramanian, K.; Osama, A.; Fathy, A. Multi-Objective Grey Wolf Optimizer for Optimal Design of Switching Matrix for Shaded PV array Dynamic Reconfiguration. IEEE Access 2020, 8, 159931–159946. [Google Scholar] [CrossRef]
- Wohlgemuth, J.; Herrmann, W. Hot spot tests for crystalline silicon modules. In Proceedings of the 31st IEEE Photovoltaic Specialists Conference, Lake Buena Vista, FL, USA, 3–7 January 2005; pp. 1062–1065. [Google Scholar]
- Rajput, P.; Tiwari, G.; Sastry, O. Thermal modelling and experimental validation of hot spot in crystalline silicon photovoltaic modules for real outdoor condition. Sol. Energy 2016, 139, 569–580. [Google Scholar] [CrossRef]
- Babu, T.S.; Yousri, D.; Balasubramanian, K. Photovoltaic array reconfiguration system for maximizing the harvested power using population-based algorithms. IEEE Access 2020, 8, 109608–109624. [Google Scholar] [CrossRef]
- Yousri, D.; Babu, T.S.; Beshr, E.; Eteiba, M.B.; Allam, D. A robust strategy based on marine predators algorithm for large scale photovoltaic array reconfiguration to mitigate the partial shading effect on the performance of PV system. IEEE Access 2020, 8, 112407–112426. [Google Scholar] [CrossRef]
- Parlak, K.Ş. PV array reconfiguration method under partial shading conditions. Int. J. Electr. Power Energy Syst. 2014, 63, 713–721. [Google Scholar] [CrossRef]
- Horoufiany, M.; Ghandehari, R. Optimization of the Sudoku based reconfiguration technique for PV arrays power enhancement under mutual shading conditions. Sol. Energy 2018, 159, 1037–1046. [Google Scholar] [CrossRef]
- Chao, K.-H.; Lai, P.-L.; Liao, B.-J. The optimal configuration of photovoltaic module arrays based on adaptive switching controls. Energy Convers. Manag. 2015, 100, 157–167. [Google Scholar] [CrossRef]
- Nguyen, D.; Lehman, B. An adaptive solar photovoltaic array using model-based reconfiguration algorithm. IEEE Trans. Ind. Electron. 2008, 55, 2644–2654. [Google Scholar] [CrossRef]
- Jazayeri, M.; Jazayeri, K.; Uysal, S. Adaptive photovoltaic array reconfiguration based on real cloud patterns to mitigate effects of non-uniform spatial irradiance profiles. Sol. Energy 2017, 155, 506–516. [Google Scholar] [CrossRef]
- Velasco-Quesada, G.; Guinjoan-Gispert, F.; Pique-Lopez, R.; Roman-Lumbreras, M.; Conesa-Roca, A. Electrical PV array reconfiguration strategy for energy extraction improvement in grid-connected PV systems. IEEE Trans. Ind. Electron. 2009, 56, 4319–4331. [Google Scholar] [CrossRef]
- Balato, M.; Costanzo, L.; Vitelli, M. Series-parallel PV arrays: A comparison between the performances of two algorithms for strings with an equal or with a different number of PV modules. In Proceedings of the 2016 IEEE International Power Electronics and Motion Control Conference, PEMC, Varna, Bulgaria, 25–28 September 2016; pp. 1269–1274. [Google Scholar] [CrossRef]
- La Manna, D.; Vigni, V.L.; Sanseverino, E.R.; Di Dio, V.; Romano, P. Reconfigurable electrical interconnection strategies for photovoltaic arrays: A review. Renew. Sustain. Energy Rev. 2014, 33, 412–426. [Google Scholar] [CrossRef]
- Rao, P.S.; Dinesh, P.; Ilango, G.S.; Nagamani, C. Optimal Su-Do-Ku based interconnection scheme for increased power output from PV array under partial shading conditions. Front. Energy 2015, 9, 199–210. [Google Scholar] [CrossRef]
- Villalva, M.G.; Gazoli, J.R.; Filho, E.R. Comprehensive Approach to Modeling and Simulation of Photovoltaic Arrays. IEEE Trans. Power Electron. 2009, 24, 1198–1208. [Google Scholar] [CrossRef]
- De Soto, W.; Klein, S.; Beckman, W. Improvement and validation of a model for photovoltaic array performance. Sol. Energy 2006, 80, 78–88. [Google Scholar] [CrossRef]
- Sera, D.; Teodorescu, R.; Rodriguez, P. PV panel model based on datasheet values. In Proceedings of the IEEE International Symposium on Industrial Electronics, Vigo, Spain, 4-7 June 2007; pp. 2392–2396. [Google Scholar] [CrossRef]
- Yadir, S.; Benhmida, M.; Sidki, M.; Assaid, E.; Khaidar, M. New method for extracting the model physical parameters of solar cells using explicit analytic solutions of current-voltage equation. In Proceedings of the 2009 International Conference on Microelectronics (ICM 2009), Marrakech, Morocco, 19–22 December 2009; pp. 390–393. [Google Scholar] [CrossRef]
- Patnaik, B.; Mohod, J.D.; Duttagupta, S.P. Distributed multi-sensor network for real time monitoring of illumination states for a reconfigurable solar photovoltaic array. In Proceedings of the ISPTS-1, 1st International Symposium on Physics and Technology of Sensors, Pune, India, 7–10 March 2012; pp. 106–109. [Google Scholar] [CrossRef]
- Aydilek, İ.B. A Hybrid Firefly and Particle Swarm Optimization Algorithm for Computationally Expensive Numerical Problems. Appl. Soft Comput. 2018, 66, 232–249. [Google Scholar] [CrossRef]
- Chiewchanchairat, K.; Bumroongsri, P.; Kheawhom, S. Reconfiguration of distribution system with distributed generation using Firefly algorithm. KKU Eng. J. 2015, 42, 107–115. [Google Scholar] [CrossRef]
- Tze, C.; Kho, K.; Ahmed, J.; Kashem, S.; Lung, Y. A comprehensive review on PV configurations to maximize power under partial shading. In Proceedings of the TENCON 2017-2017 IEEE Region 10 Conference, Penang, Malaysia, 5–8 November 2017; pp. 763–768. [Google Scholar] [CrossRef]
- Wu, Z.; Zhang, C.; Alkahtani, M.; Hu, Y.; Zhang, J. Cost Effective Offline Reconfiguration for Large-Scale Non-Uniformly Aging Photovoltaic Arrays Efficiency Enhancement. IEEE Access 2020, 8, 80572–80581. [Google Scholar] [CrossRef]


| Ref | Type of Interconnection and Array Size | Control Algorithm/Technique | Remarks |
|---|---|---|---|
| [19] | Total Cross Tied (TCT) 9 × 9 array size | Particle swarm optimization (PSO) | Relocation of physical PV arrays based on particle swarm optimization (PSO) is proposed in this paper. Extensive simulations were done for the proposed method, which involves the electrical connections’ alteration while the physical location remains static. |
| [17] | Total Cross Tied (TCT) 9 × 9 array size | Standard deviation genetic algorithm (SDGA) | The method introduced in this paper involved the standard deviation genetic algorithm (SDGA) as an optimization algorithm for electrical connection adjustment, while the PV array’s physical location remains unchanged. As a result of the final connection matrix, uniform shade dispersion throughout the panels with new electrical interconnection was obtained to boost the PV array’s maximum power. |
| [16] | Total Cross Tied (TCT) 9 × 9 array size | Genetic algorithm (GA) | The genetic algorithm (GA) technique was implemented in this paper for the total cross tied (TCT) scheme to establish a new electrical configuration and enhance the PV arrays’ output power. The method modified the electrical connections, and the physical location of the solar panel was fixed. |
| [32] | Total Cross Tied (TCT) 3 × 3 array size | Scanning algorithm (SA) with adaptive part and fixed part scheme | A novel algorithm entitled configuration scanning algorithm (SA) had been executed in this paper to verify all possible electrical connections by utilizing the solar panel’s short current values measured at particular parts only. Each row of an array is arranged by connecting the panels with the closest short circuit current values. |
| [33] | Total Cross Tied (TCT) 9 × 9 array size | Sudoku | This paper implemented a fixed reconfiguration solution based on the Sudoku puzzle pattern as an optimization tool to minimize the shading effects. The PV array’s physical location in a total cross tied (TCT) scheme had been rearranged based on a new modification of Sudoku dispersion rules. |
| [34] | Total Cross Tied (TCT) 4 × 3 array size | Particle swarm optimization (PSO) with fixed part and adaptive switching controls | This paper proposed an adaptive reconfiguration solution for module arrays to maximize the PV generation output power. The strategy used is based on the particle swarm optimization (PSO) algorithm to detect if shading or malfunctions of the PV array have occurred; after that, the algorithm immediately reconfigures the optimal PV array connection. |
| [22] | Total Cross Tied (TCT) 9 × 9 array size | Sudoku | This paper’s reconfiguration method is based on the Sudoku puzzle pattern, using it in distributing shading effects throughout the PV arrays without reconfiguring the electrical connections in a total cross tied (TCT) scheme. |
| [35] | Total Cross Tied (TCT) 3 × 3 array size | Bubble sort of modelbase with an adaptive bank and fixed part | This paper implemented an adaptive reconfiguration scheme for the reduction of shading’s negative effects. A switching matrix controller connects the adaptive solar bank and a fixed part of the PV module arrays to increase the output power production in real-time. |
| [36] | Total Cross Tied (TCT) 4 × 4 array size | Irradiance equalization | A dynamic reconfiguration algorithm based on the irradiance equalization principle wasemployed in this paper to mitigate the spatial uncertainty irradiance causing negative effects on the PV array’s power production. The authorshave aimed to create balanced irradiance dispersion in a row of interconnected series of PV arrays, and utilize the irradiance threshold to achieve the nearest optimal configuration ofirradiance equalization. |
| [37] | Series-Parallel (SP) 3 × 2 array size | Electrical array reconfiguration (EAR) with static part and dynamic part | The authors applied dynamical electrical array reconfiguration (EAR) to raise the energy production of a grid-connected PV system under numerous operating conditions. The strategy is appliedusing a controllable switching matrix between the central inverter and the PV generator. |
| Parameters | Value |
|---|---|
| Maximum power (Pmax) | 280 W |
| Open circuit voltage (Voc) | 63.4 V |
| Short circuit current (Isc) | 5.89 A |
| Voltage at maximum power point (Vmp) | 52.4 V |
| Current at maximum power point (Imp) | 5.34 A |
| Cells per module | 96 |
| Photo generated current (Iph) | 5.9184 A |
| Diode saturation current (Is) | 4.7452 × 10⁻¹⁰ A |
| Temperature coefficient of Isc (µIsc) | 0.05%/°C |
| Temperature coefficient of Voc (µVoc) | −0.29%/°C |
| Conditions | MPP, W | Shading Strength (SS), % | Improvement Efficiency with SP Scheme, % | ||
|---|---|---|---|---|---|
| Series–Parallel (SP) | TCT | FA | |||
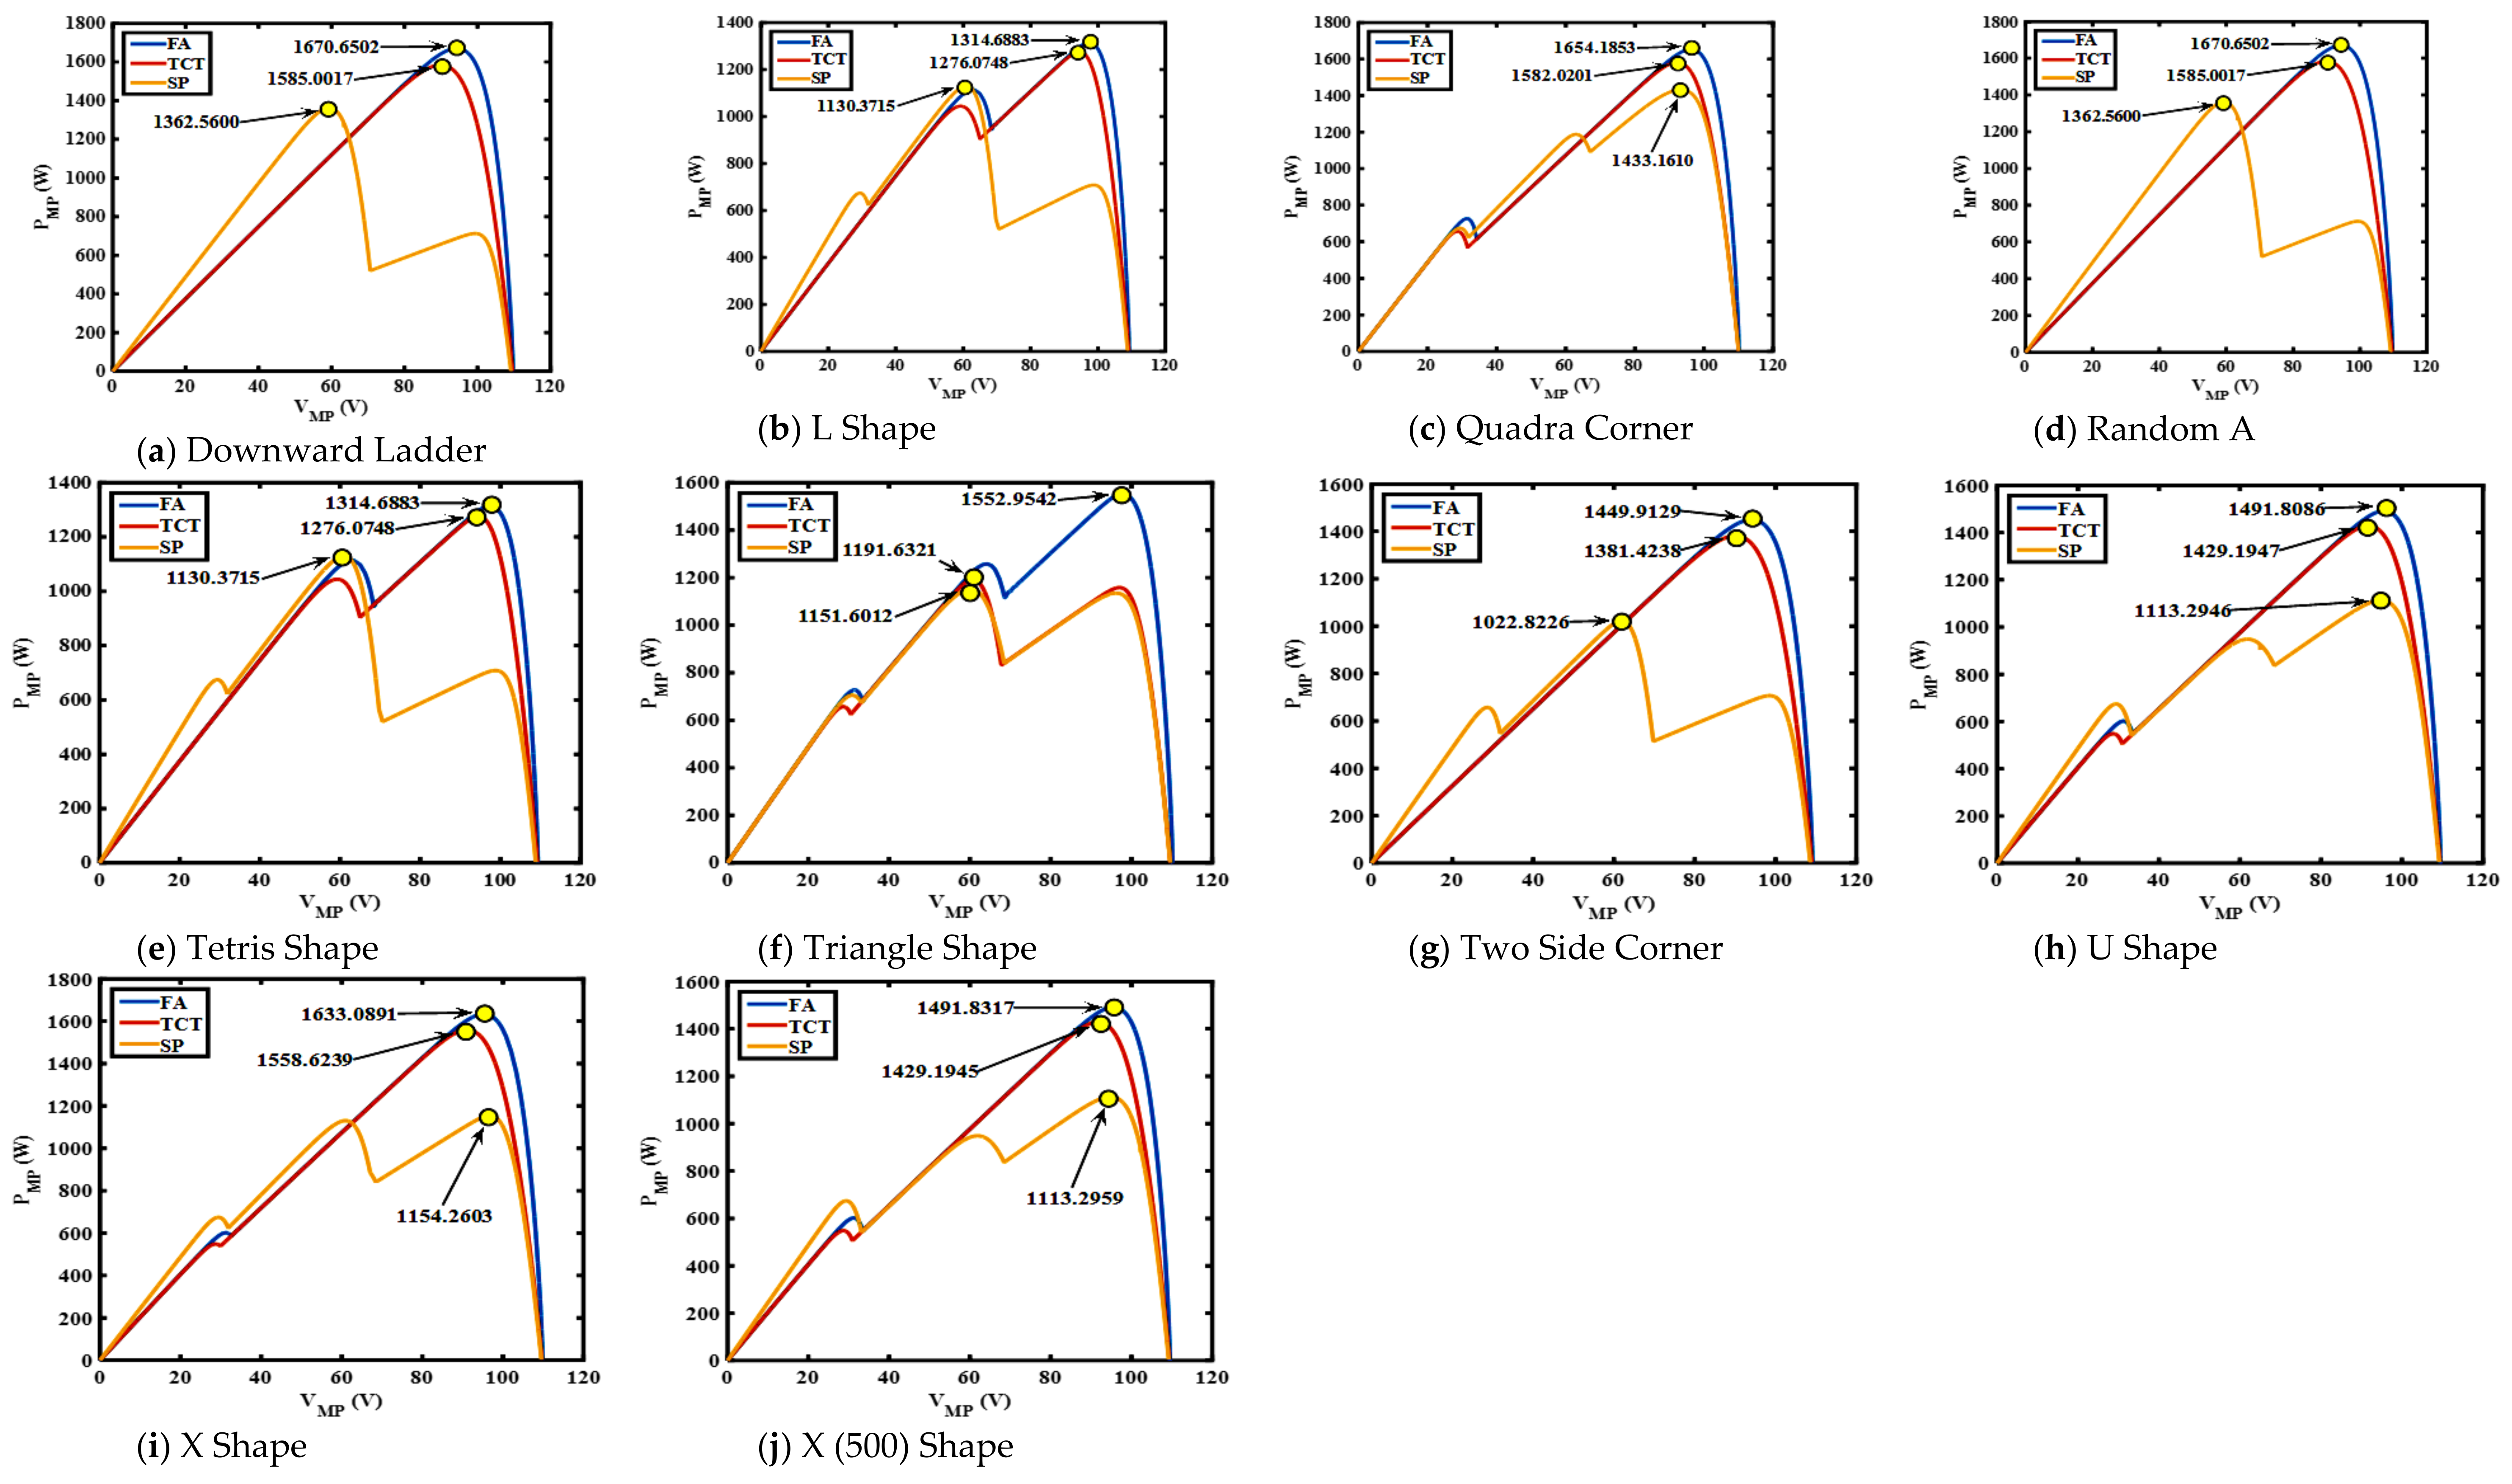
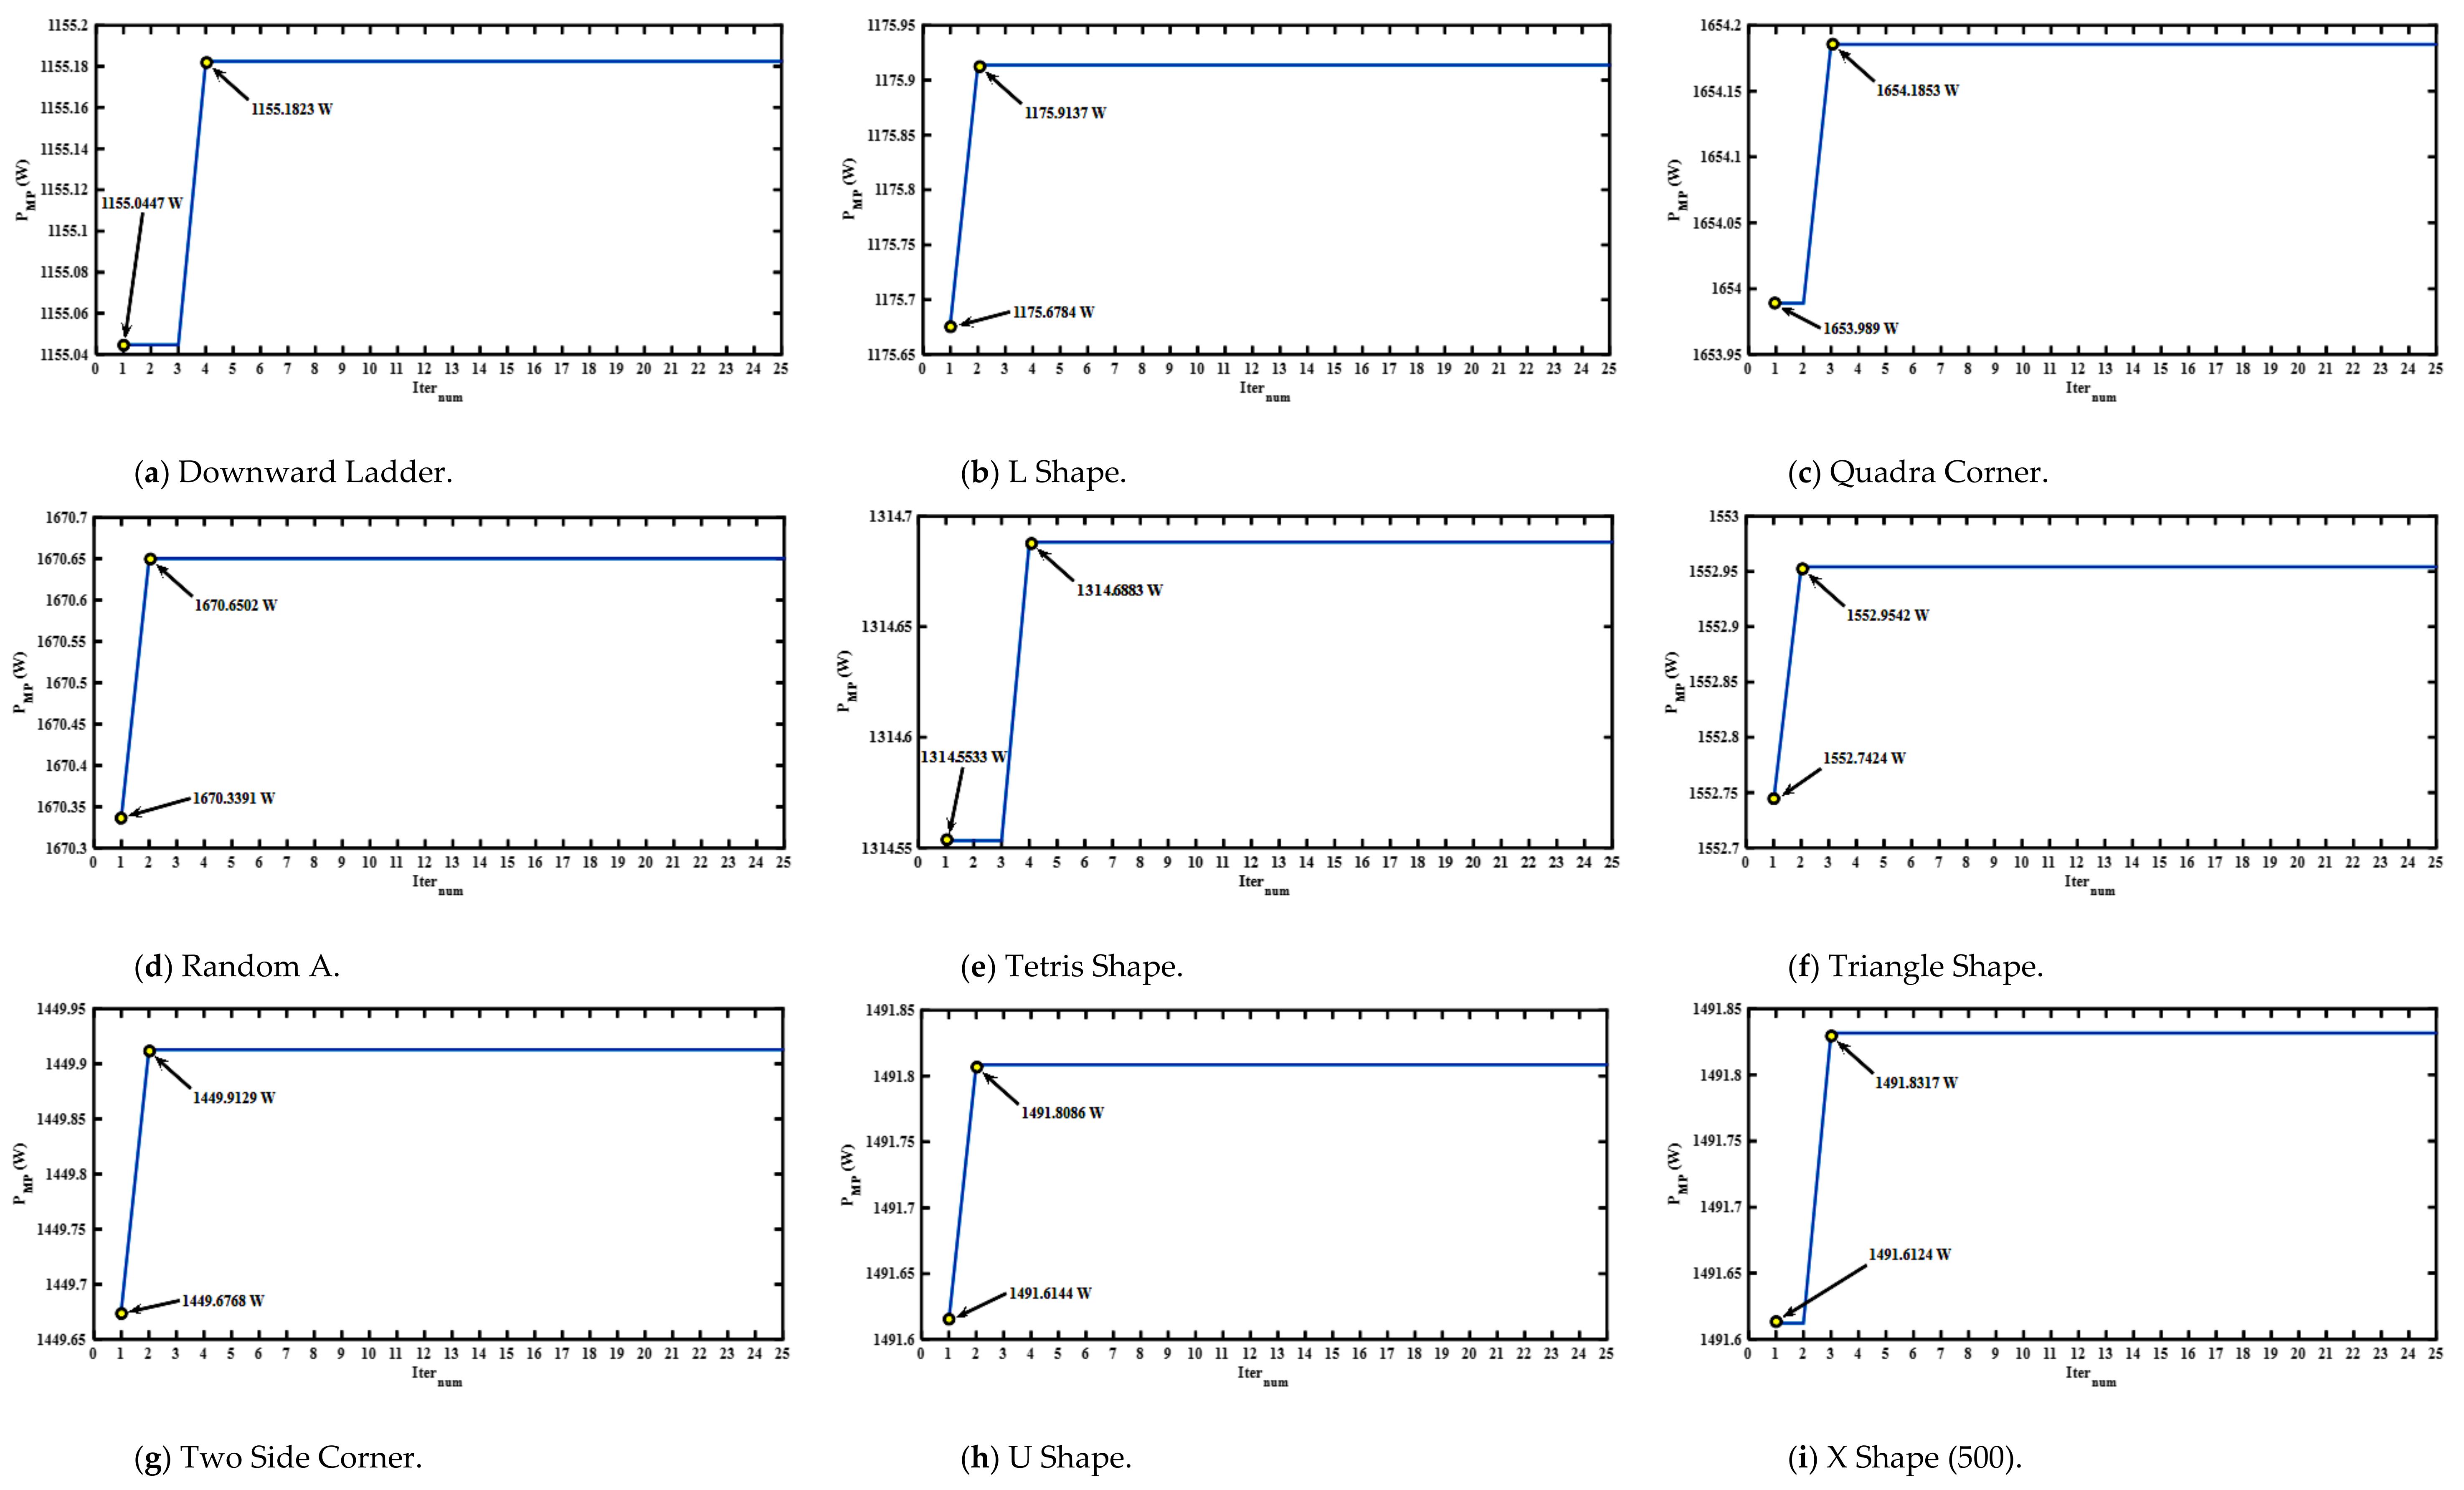
| Downward Ladder | 938.2692 | 1123.0762 | 1155.1823 | 37.78 | 23.12 |
| L Shape | 1147.9575 | 1145.1144 | 1175.9137 | 22.22 | 2.43 |
| Quadra Corner | 1433.161 | 1582.0201 | 1654.1853 | 17.78 | 15.42 |
| Random A | 1362.56 | 1585.0017 | 1670.6502 | 23.33 | 22.61 |
| Tetris Shape | 1130.3715 | 1276.0748 | 1314.6883 | 30.00 | 16.31 |
| Triangle Shape | 1151.6012 | 1191.6321 | 1552.9542 | 22.22 | 34.85 |
| Two Side Corner | 1022.8226 | 1381.4238 | 1449.9129 | 33.33 | 41.76 |
| U Shape | 1113.2946 | 1429.1947 | 1491.8086 | 27.78 | 34 |
| X Shape | 1154.2603 | 1558.6239 | 1633.0891 | 23.33 | 41.48 |
| X (500) Shape | 1113.2959 | 1429.1945 | 1491.8317 | 27.78 | 34 |
| Conditions | Iternum Required to Achieve Asteady State in the Highest Gmpp |
|---|---|
| Downward Ladder | 4 |
| L Shape | 2 |
| Quadra Corner | 3 |
| Random A | 2 |
| Tetris Shape | 4 |
| Triangle Shape | 2 |
| Two Side Corner | 2 |
| U Shape | 2 |
| X Shape | 2 |
| X (500) Shape | 3 |
| Conditions | MPP, W | Shading Strength (SS), % | Improvement Efficiency with SP Scheme, % | ||
|---|---|---|---|---|---|
| SP | TCT | FA | |||
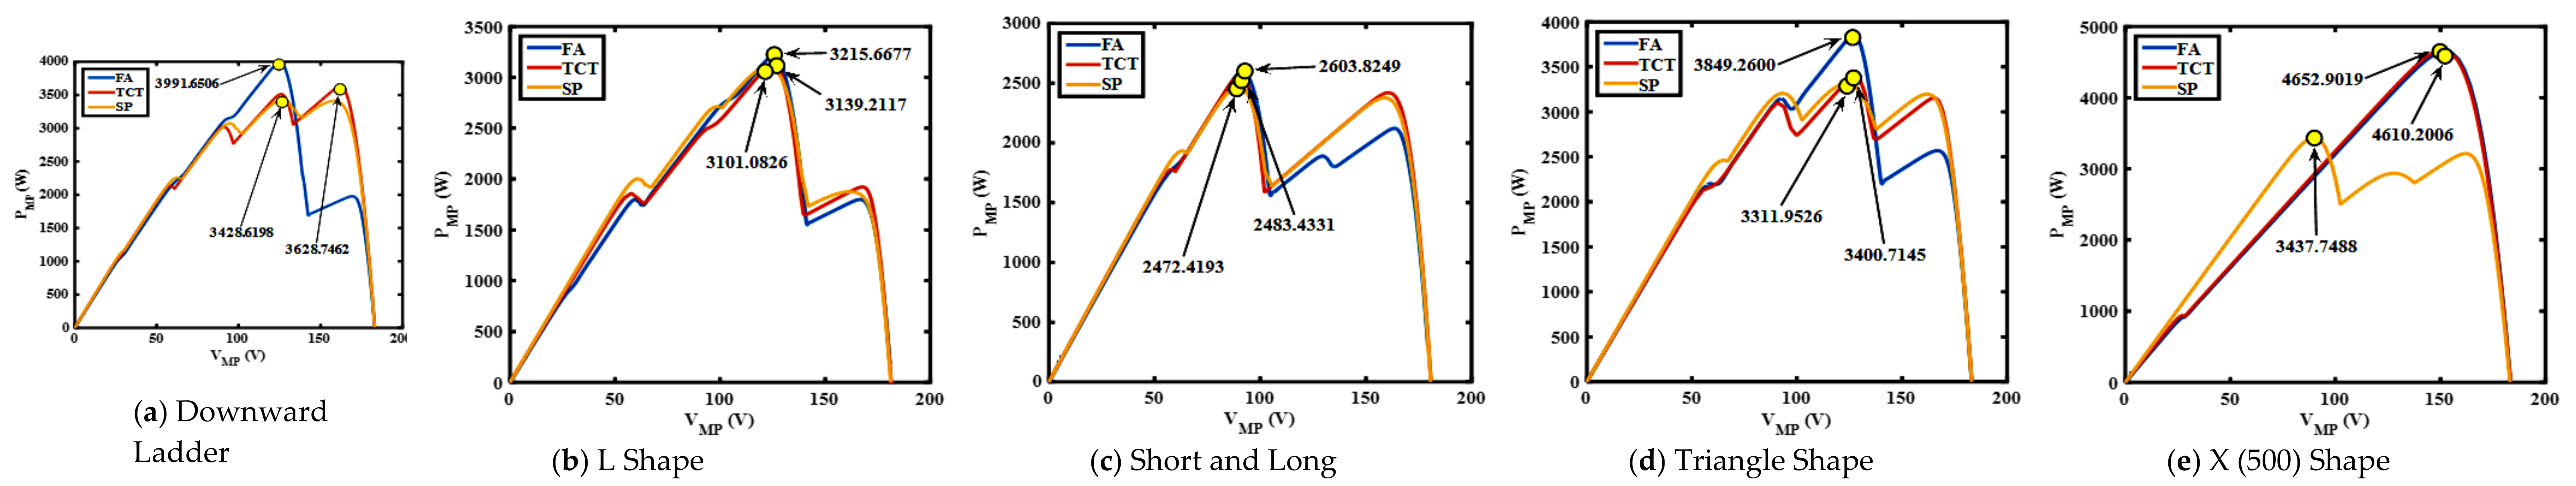
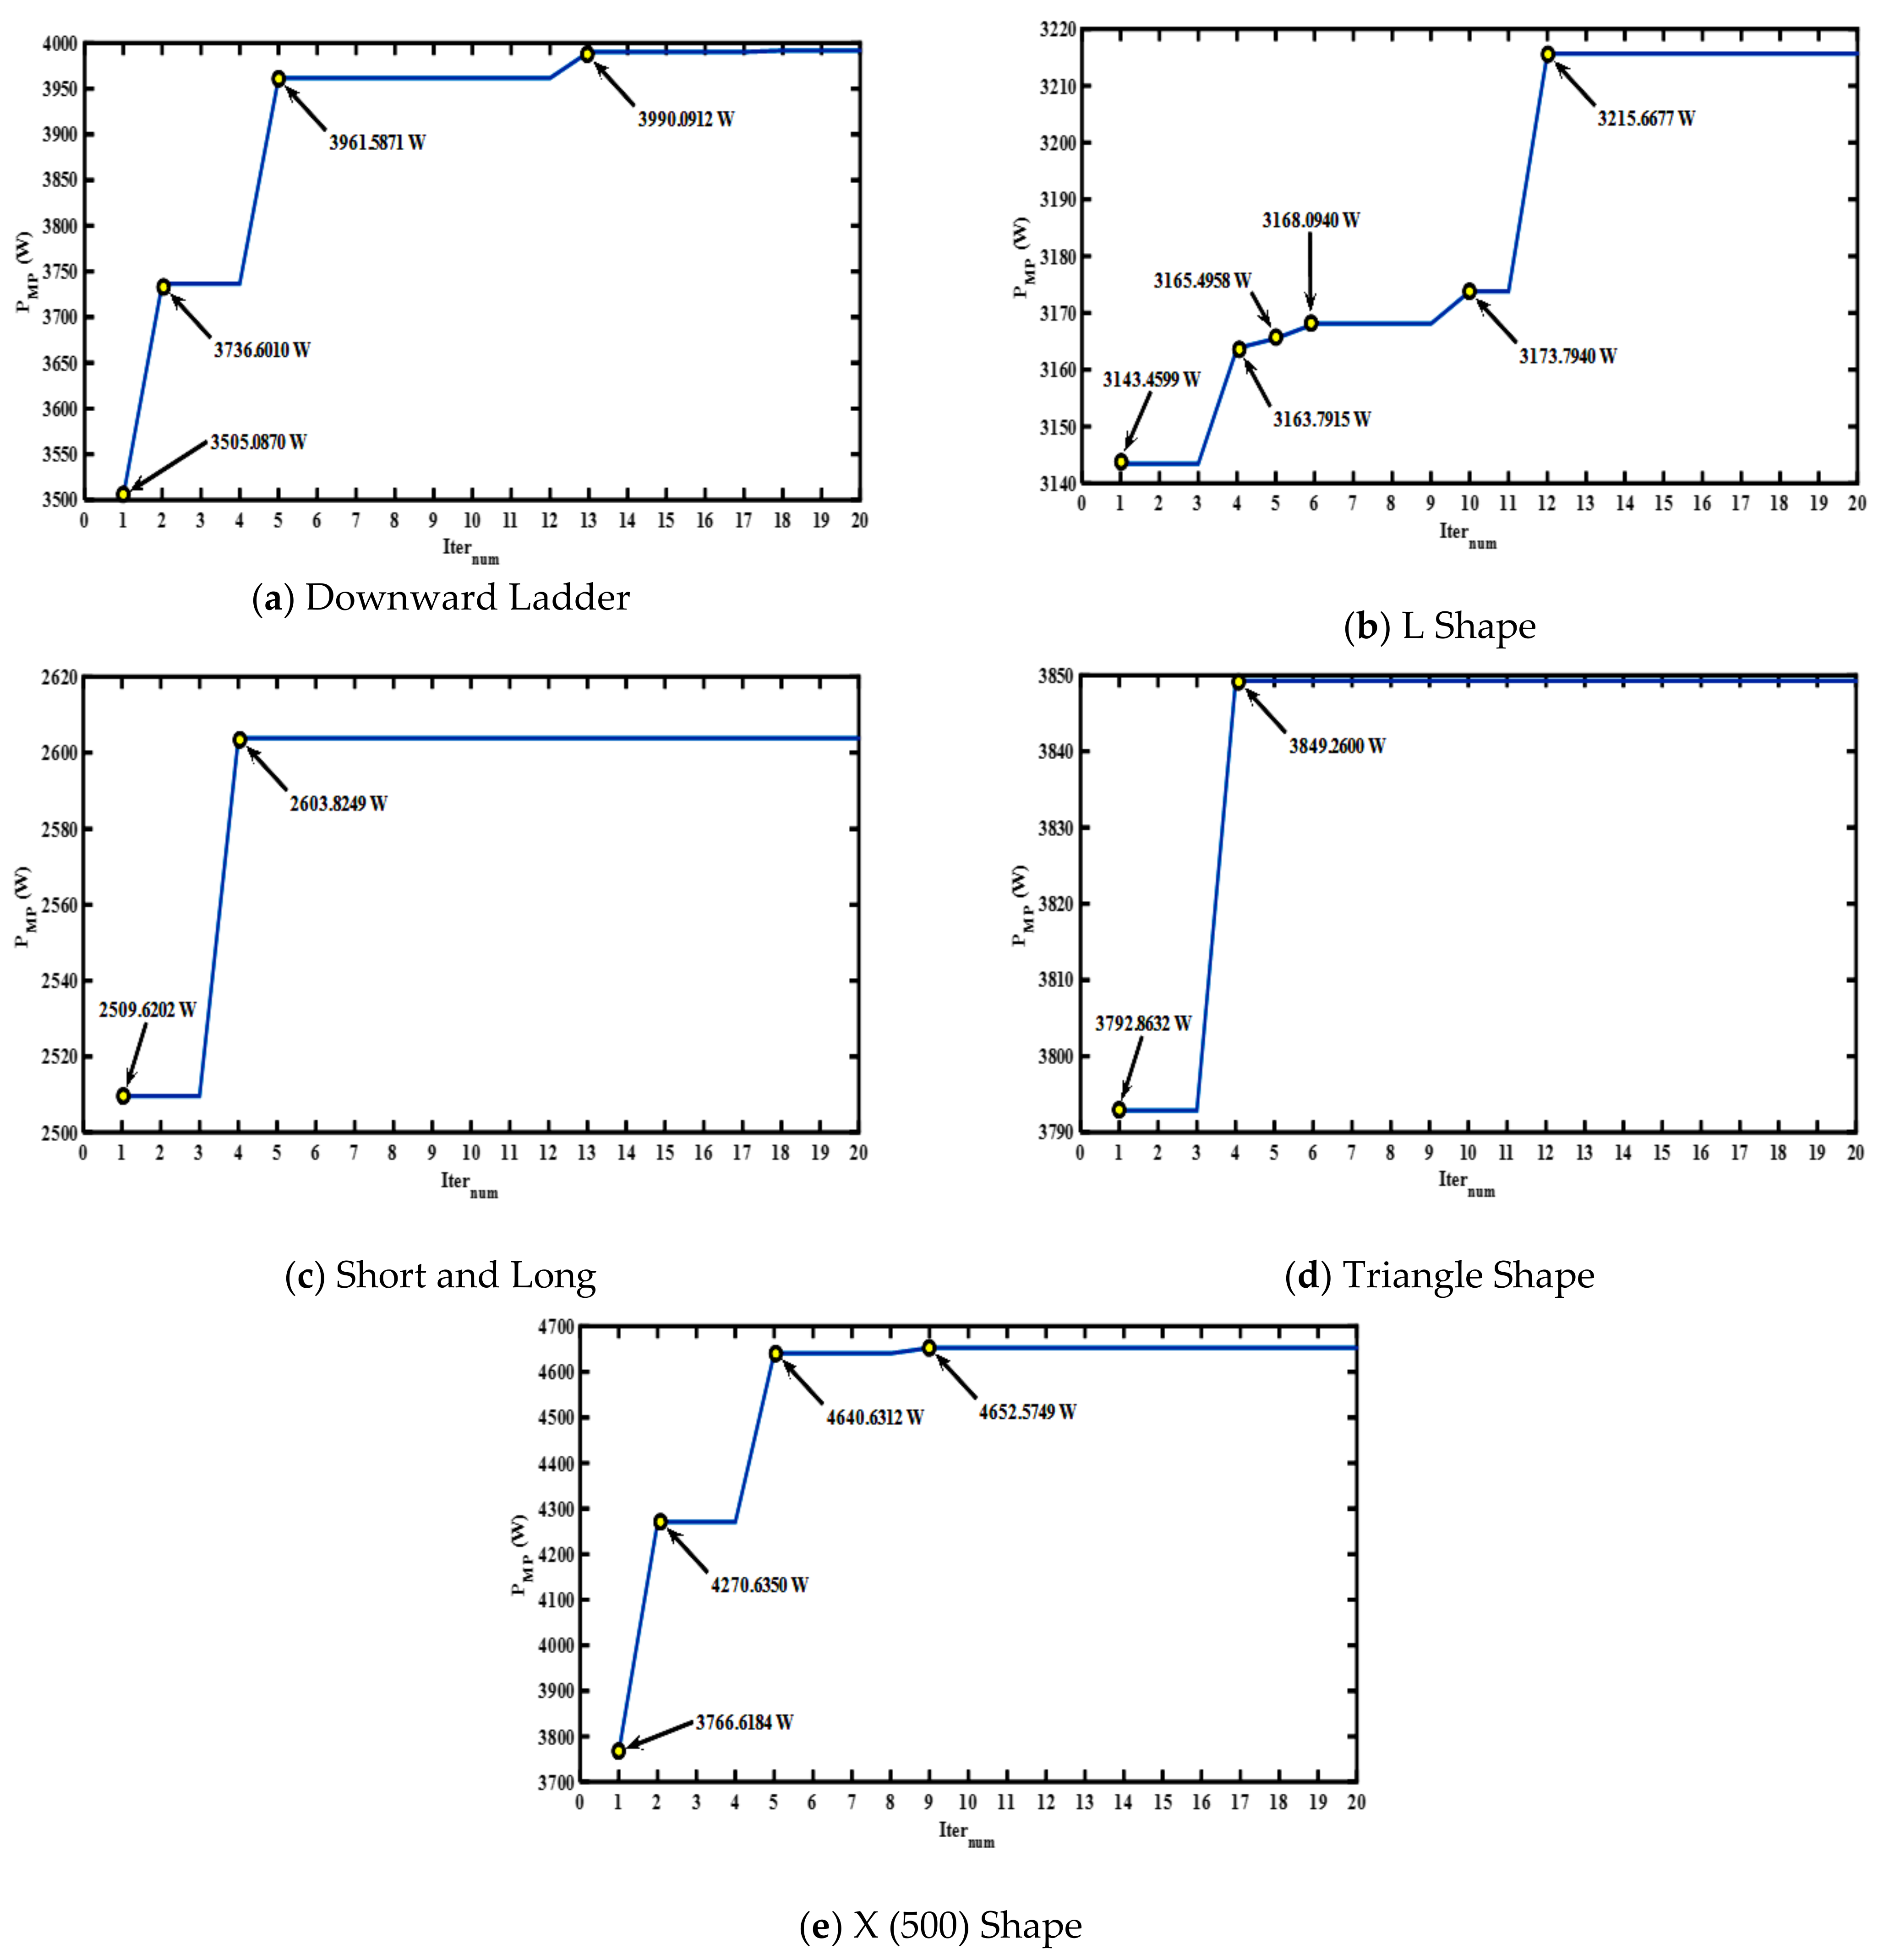
| Downward Ladder | 3428.6198 | 3628.7462 | 3991.6506 | 19.2 | 16.42 |
| L Shape | 3101.0826 | 3139.2117 | 3215.6677 | 32.4 | 3.69 |
| Short and Long | 2472.4193 | 2483.4331 | 2603.8249 | 38.4 | 5.31 |
| Triangle | 3311.9526 | 3400.7145 | 3849.2600 | 18.0 | 16.22 |
| X (500) Shape | 3437.7488 | 4610.2006 | 4652.9019 | 18.0 | 35.35 |
Publisher’s Note: MDPI stays neutral with regard to jurisdictional claims in published maps and institutional affiliations. |
© 2021 by the authors. Licensee MDPI, Basel, Switzerland. This article is an open access article distributed under the terms and conditions of the Creative Commons Attribution (CC BY) license (http://creativecommons.org/licenses/by/4.0/).
Share and Cite
Nazeri, M.N.R.; Tajuddin, M.F.N.; Babu, T.S.; Azmi, A.; Malvoni, M.; Kumar, N.M. Firefly Algorithm-Based Photovoltaic Array Reconfiguration for Maximum Power Extraction during Mismatch Conditions. Sustainability 2021, 13, 3206. https://doi.org/10.3390/su13063206
Nazeri MNR, Tajuddin MFN, Babu TS, Azmi A, Malvoni M, Kumar NM. Firefly Algorithm-Based Photovoltaic Array Reconfiguration for Maximum Power Extraction during Mismatch Conditions. Sustainability. 2021; 13(6):3206. https://doi.org/10.3390/su13063206
Chicago/Turabian StyleNazeri, Mohammad Nor Rafiq, Mohammad Faridun Naim Tajuddin, Thanikanti Sudhakar Babu, Azralmukmin Azmi, Maria Malvoni, and Nallapaneni Manoj Kumar. 2021. "Firefly Algorithm-Based Photovoltaic Array Reconfiguration for Maximum Power Extraction during Mismatch Conditions" Sustainability 13, no. 6: 3206. https://doi.org/10.3390/su13063206
APA StyleNazeri, M. N. R., Tajuddin, M. F. N., Babu, T. S., Azmi, A., Malvoni, M., & Kumar, N. M. (2021). Firefly Algorithm-Based Photovoltaic Array Reconfiguration for Maximum Power Extraction during Mismatch Conditions. Sustainability, 13(6), 3206. https://doi.org/10.3390/su13063206