Abstract
China has always been a major agricultural country, and the issues of agriculture, rural areas and farmers have always been fundamental issues of China’s reform and development. First of all, most previous studies did not combine agricultural development with rural economic development to consider the rural development status. Through the network-slack-based measure (SBM) model, agricultural development and rural economic development are taken as the first stage and the second stage, respectively, to determine the overall efficiency of rural development. Secondly, most previous studies directly selected a number of agricultural materials as inputs to evaluate agricultural production efficiency, and did not consider the impact of a variety of agricultural materials comprehensively. We use the entropy method to calculate a comprehensive index including a variety of agricultural materials. Third, most previous studies did not take into account the harmful effects of agricultural production on the environment. We take carbon emissions and agricultural non-point source pollution (ANPSP) as undesirable outputs into the model, and consider the impact of agricultural production on the ecological environment comprehensively. On the basis of the above innovation, we adopt the two-stage SBM-undesirable model to comprehensively and systematically study the efficiency of rural development in China. Furthermore, the gap of rural development efficiency is determined by sigma convergence and a convergence test. All the data are from the National Bureau of Statistics of China. The results show that the development level of China’s rural agricultural eco-efficiency is significantly higher than that of rural economic development, and the low efficiency of the whole rural development is mainly affected by the low efficiency of rural economic development. The distribution of efficiency value shows that the eastern region is the best, and the development level of the remaining three regions is very low. The regional development gap is large, and this gap still exists for a long period of time. Nevertheless, the efficiency of rural development has improved year by year. Based on empirical analysis, we put forward some feasible suggestions to provide reference for policymakers in formulating rural development policies, narrowing the regional gap and rural sustainable development.
1. Introduction
China has always been a big agricultural country, and the issues of agriculture, rural areas and farmers (called “three rural” issues) have always been the fundamental issues of China’s reform and development. Since 1978, China’s rural reform and development have experienced four stages [1]. At present, China is in a critical period when socialism has entered a new era and major social contradictions have undergone profound changes. Nowadays, the main contradiction in Chinese society is the contradiction between unbalanced and inadequate development and the people’s ever-growing needs for a better life. With the continuous improvement of the basic conditions of agricultural production and the simultaneous increase of production capacity, grain production has increased year by year and farmers’ incomes have also increased steadily, which gradually become reasonable [2]. However, due to the large population base and wide distribution of rural areas in China, rural economic development is still lagging behind. There is an obvious gap between China’s rural development and that of developed countries [3]. China’s unbalanced and inadequate development is mainly reflected in the “three rural” issues [4]. To solve the “three rural” issues effectively is the key to solving the main social contradictions. The goal of rural development in China is to make agriculture strong, the countryside beautiful and farmers rich [5].
The Rural Revitalization Strategy (RRS), which was first put forward by Xi Jinping in the report of the 19th National Congress of the Communist Party of China in 2017, has made a significant decision making arrangements for the effective solution of the “three rural” issues [4,5,6,7,8]. It is in accordance with the general requirements of “industrial prosperity, ecological livability, rural civilization, effective governance, and prosperous lives”, adheres to the overall urban and rural development, and promotes the revitalization of rural areas comprehensively and in an orderly way. Based on the coordinated development of industry, ecology, and other resources, the Rural Revitalization Strategy aims to put the rural areas in an equal position with the city and pay attention to the initiative of the countryside, so as to stimulate the vitality of rural development, and to establish a more sustainable endogenous growth mechanism. The all-round development of rural areas is of overall and historical significance to China’s construction of a modern country.
In the 21st century, with the increasing support and protection of agriculture in China, the development of agriculture and rural economy has continued to improve. The process of agricultural modernization has been accelerated, rural reform has been promoted comprehensively, and public services in urban and rural areas have been developed in an all-round way. Poverty reduction and income increase of farmers, and the rapid growth of rural residents’ consumption level. The family Engel’s coefficient of rural residents of a country’s rural inhabitants directly reflects the development of the country’s primary industry, but also reflects whether the country’s economic structure is reasonable. Since the reform and opening, China’s agricultural development has made gratifying achievements. The consumption structure of urban and rural residents in China has been significantly optimized, and Engel’s coefficient has decreased significantly. By comparing the changes of the family Engel’s coefficient of rural residents in China from 1978 to 2019, we can clearly see that the overall development trend is in two opposite directions: the level of per capita income continues to rise, the Engel’s coefficient continues to decline, becoming more reasonable. Figure 1 and Figure 2 show that the family Engel’s coefficient of rural residents in China has dropped from 67.7% in 1978 to 30% in 2019, and the rural residents have reached the level of well-off and relative affluence from the poverty level. The proportion of per capita expenditure on cultural, educational, and recreational goods and services in rural households has increased from 5.15% in 1980 to 15.4% in 2019, and the proportion of development and the enjoyment of consumption is increasing. The per capita net income of rural households has increased from 133.6 yuan to 16,021 yuan, an increase of nearly 120 times. Rural residents have initially entered a well-off level.
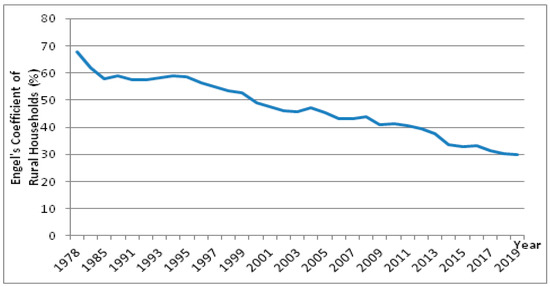
Figure 1.
The change of family Engel coefficient of rural residents in China. Source: Author collated the data from the National Bureau of Statistics of China.
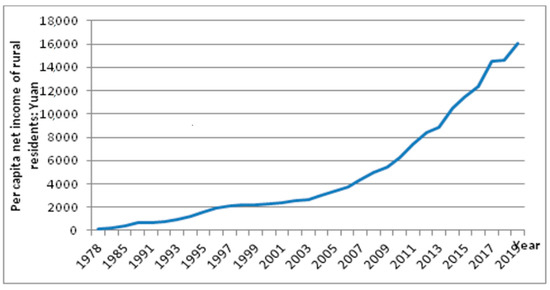
Figure 2.
Per capita net income of rural residents in China. Source: Author collated the data from the National Bureau of Statistics of China.
Scholars have made fruitful achievements in the study of rural revitalization and agricultural eco-efficiency evaluation, which play a positive role in guiding rural revitalization and agricultural sustainable development. First of all, due to the differences in research object, research period and research purpose, different organizations and scholars have different expressions for the connotation of agricultural ecological efficiency, but the basic core idea is the same, that is, the proportion of economic output and environmental cost [9,10,11,12,13,14,15,16,17,18]. Secondly, a growing number of data envelopment analysis (DEA) models are used for quantitative analysis in research methods, and DEA models have been greatly expanded, such as super efficiency DEA model, slack-based measure (SBM) model, three-stage DEA model, etc. [19,20,21]. Many scholars have proved the applicability of these methods to study the efficiency of rural agricultural development [18,22]. Finally, according to the different research objects, the calculation indicators are mainly considered from three aspects of economy, resources and environment, which are targeted and reasonable [23,24]. The evaluation of rural agricultural development in China by scholars mostly starts from the national or provincial level [23,25,26]. Due to the large area of each province and the imbalance of regional development, it may be more meaningful to study the ecological efficiency from the perspective of provincial level.
The innovation of this paper is mainly reflected in the following aspects.
- (1)
- This paper measures the rural development efficiency of 30 areas under the Rural Revitalization Strategy in China. Although scholars have done a lot of research on rural development efficiency, there is still no formal definition of rural development efficiency. Based on the research of scholars, the efficiency of rural development studied in this paper should take into account the relationship between development and the ecological environment. This means that in the input-output process of rural development, the desirable output (such as farmers’ income level, consumption level, etc.) should be produced as much as possible, and the undesirable output (such as carbon emissions, agricultural non-point source pollution) should be reduced. Specifically, it has the following characteristics: reducing the intensity of resource consumption and the emission of agricultural pollutants, improving the comprehensive utilization rate of resources and the output capacity of the rural economy.
- (2)
- The two-stage network SBM-undesirable model is selected for the research model. The basic industries of agricultural ecological development and economic development are taken into comprehensive consideration. Through structuring the evaluation index system including undesirable output, the efficiency of rural development considering environmental factors is measured. From the perspective of the Rural Revitalization Strategy, previous research on rural development paid more attention to one of the two aspects of agricultural eco-efficiency or economic development efficiency. In agricultural production, there are undesirable outputs, mainly including agricultural non-point source pollution and carbon emissions. Taking agricultural non-point source pollution and carbon emissions as undesirable output into the evaluation index can better reflect the actual level of agricultural development. In addition, previous studies on agricultural eco-efficiency mainly focused on agriculture in a broad sense, including agriculture, forestry, animal husbandry, and fisheries. The narrow sense of agriculture occupies the main position and is more representative. Moreover, the agricultural non-point source pollution basically comes from the planting industry. What the paper studies is the ecological efficiency of narrow agriculture, so the establishment of an evaluation index based on undesirable can reflect the actual level of agricultural eco-efficiency more scientifically and objectively.
- (3)
- The paper studies the spatial-temporal evolution and convergence of the development efficiency of rural revitalization. After searching for relevant literature, it finds that there is basically no analysis of the spatial evolution characteristics and convergence of China’s 30 areas and four economic regions. The implementation of the Rural Revitalization Strategy is an important foundation for the construction of a modern economic system, and the implementation results are directly related to China’s long-term stability and the realization of the great Chinese dream. Therefore, it is necessary to analyze the balance of the implementation efficiency of the Rural Revitalization Strategy and judge the gap of rural development in China.
2. Literature Review
2.1. Rural Revitalization Strategy
The RRS was first put forward by General Secretary Xi [4,27,28]. The following year, China initiated the RRS to foster further agricultural reform and rural development [29]. The RRS is a major strategic plan for China to effectively solve the “three rural” problem, and is also a significant strategy for building a moderately prosperous society in all respects and realizing the great rejuvenation of the Chinese nation issues [1]. At present, China is in a critical period when socialism enters a new era and major social contradictions undergo profound changes. Domestically, the main social contradictions have changed. At present, China’s unbalanced and inadequate development is mainly reflected in the “three rural” issues [5]. Internationally, the degree of economic globalization has further deepened, agricultural science and technology have developed rapidly, the international agricultural market has been integrated rapidly, and competition has intensified [30].
The concept of rural revitalization is relative to the decline of rural areas. In China, rural revitalization mainly refers to the comprehensive revitalization of agriculture, rural areas, and farmers, and ultimately realizes the wishes of a good life for a strong agriculture, beautiful countryside, and rich farmers [31]. To implement the RRS, we should promote the overall revitalization of rural areas in accordance with the general requirements of “industrial prosperity, ecological livability, rural civilization, effective governance and prosperous lives” [32]. Each dimension is organically coordinated and mutually promoted, covering all aspects of rural development and indicating the future development blueprint of rural areas [33]. The proposal of the RRS is a new requirement on how to achieve better development of agriculture, rural areas, and farmers in the new situation, focusing on solving the difficulties encountered in the transformation and development of agriculture, rural areas, and farmers in the new period.
2.2. Rural Development
Scholars have conducted extensive and in-depth research on the theory of rural development. British urban sociologist Howard [34] advocated the combination of cities and countryside in the Garden City of Tomorrow. He did not agree with the old urban–rural antagonism development mode, and put forward the theory of urban–rural integration. Lewis [35] also showed in their research that they were very positive about Howard’s theory that cities and countryside should develop in a balanced way. Nas and Wuisman [36] believed that the integration of urban and rural areas essentially meant that urban and rural areas enjoyed equal conditions in life and production. Mili [37] pointed that the logical starting point of Marxist thought of urban-rural integration and development is to criticize the capitalist mode of production, and explained that Chinese RRS is a vivid practice of Marxist thinking on urban–rural integration development and the latest development of Marxist thinking on urban–rural integration development. Different scholars also analyze the development efficiency of rural revitalization from different research methods. Huang et al. [29] provides an introduction to readers with useful information summarising the development of China’s agricultural sector and the transformation of its rural economy over the 40 years of economic reform. Zhang and Yu [38] pointed out that the scientific connotation of the RRS is to attach great importance to the development of agriculture at the practical level. Only by realizing the rapid development of the rural economy and promoting the realization of agricultural modernization early can we solve all kinds of problems in rural areas and realize the effective development of rural agriculture and farmers. Guo [39] focused on the prominent problems of insufficient space utilization, hardening of remediation mode and difficulty in resource integration in rural land remediation, and put forward research countermeasures based on the appeal of rural revitalization to existing land improvement. There are also Wu [40], Liu [41], Duan and Wang [42], Li et al. [43], and other scholars that take rural land rectification as the research object.
Now, a growing number of scholars use DEA to analyze the results of rural development in various aspects. Liang et al. [44] used DEA to calculate the cultivated land efficiency in China from 1997 to 2004, further analyzed the influencing factors of cultivated land efficiency according to Ordinary Least Squares OLS, and concluded that the change in cultivated land efficiency was mainly caused by pure technical efficiency finally. Yan [45] conducted an empirical analysis of the investment efficiency of China’s rural water conservancy during the period of 2011 to 2015 using the DEA model and Malmquist productivity index (MPI) model from the spatiotemporal perspective. It is found that the main reason for the annual average investment efficiency fluctuation of China’s rural water conservancy during the study period is scale efficiency. Kuang et al. [46] took carbon emissions resulting from cultivated land use into the measurement framework of Clue, and an SBM model with undesirable outputs, boxplot, kernel density estimation and Tobit regression model were adopted for the analysis of 31 provinces in China from 2000 to 2017. More scholars use DEA methods to study rural development, such as Mao and Koo [47], Vennesland [48], Cui and Yan [49], Ye and Wang [50], Poudel et al. [51], and so on. In accordance with global environmental conservation awareness, undesirable outputs of production, e.g., water and air pollutants, are being increasingly recognized as dangerous. In the presence of undesirable outputs, however, there are often situations where desirable outputs are allowed to be increased and at the same time, while undesirable outputs are allowed to be decreased. Therefore, modeling undesirable factors in data envelopment analysis is very important and several authors have proposed methods for this purpose [19,20,21,52,53,54].
2.3. The Influencing Factors of Rural Development
In the process of rural development being affected by a variety of factors, many scholars have carried out in-depth research on this part of the content. For example, Martinčík [55] and Martinčík and Šlehoferová [56] thought that the factors affecting rural development were mainly macroeconomic performance, growth potential, quality of life. Vaishar and Zapletalová [57] analyzed the sustainable development of rural micro areas in Czech borderland in terms of three aspects of demographic, economic, society. On the basis of his research, Hlavsa [58] added infrastructure factors to analyze the sustainability of rural development. One of the important research directions is the analysis of the influencing factors of rural development DEA efficiency. Kuang, et al. [46] used a Tobit regression model to analyze the DEA efficiency of carbon emissions in China, and the results showed that natural conditions, cultivated land resource endowments, agricultural production conditions, regional economic development and regional science and technology development are important factors resulting in the disparity of China’s CLUE, and are key factors that affect DEA efficiency. By using the two-step method of DEA and Tobit, Luan, et al. [59] assessed 29 provinces’ fairness of pension coverage in rural China in 2009 and analyzed the related factors based on the output index from pension coverage. Factors affecting DEA efficiency include the aging level, the relative size of the government intervention, and the proportion of primary industry. Wang and Zhang [22] combined CCR and BCC models to study the efficiency of financial expenditure for agriculture, which indicated that overall efficiency was not high and the whole Shandong province and some among the 17 cities had been in the decreasing stage of returns to scale. Furthermore, Tobit regression was used to analyze the factors affecting efficiency, and the selected factors included the level of fertilizer use, the degree of financial self-sufficiency, economic development, the urbanization rate, the total power of agricultural machinery. Using an input-oriented DEA model, You and Zhang [60] this study analyzed eco-efficiency of intensive agricultural production in 31 provinces in China. Tobit regression was used to analyze the impact of farmland area per capita, income per capita, population per household, and population burden coefficient on the efficiency of intensive agricultural ecology.
3. Research Model: Network Slack-Based Measure (SBM)-Undesirable Model
In the empirical analysis, DEA is used, which the first model was set up by American scholars Charnes and Cooper et al. [61] in 1978. The model is a valuable tool to evaluate the relative efficiencies among decision making units (DMUs) with multiple inputs and multiple outputs, and it has been widely applied in various fields [62]. As a non-parametric evaluation tool, DEA does not require a priori information of production technology, thus cannot be underestimated in terms of avoiding subjective factors, simplifying operations, and reducing errors. The main principle of the traditional DEA model is that when the DMU has a certain input or output, the production frontier of the evaluated data is established through the transformed linear programming model and analysis of DMUs by projection analysis. By comparing the distance between each DMU and the established production frontier to represent its relative effectiveness, the relative efficiency value of each DMU can be obtained. Furthermore, by comparing the situation of each DMU with “optimal production” represented by the production frontier, we can find the cause of inefficiency and then obtain some management suggestions to improve the efficiency.
In order to be relevant to the development status of rural construction, on the one hand, we need to measure the efficiency of rural development from the perspective of inputs and outputs, so as to enhance the practical significance of rural construction. On the other hand, we also need to fully consider the slack of input and output. This is because the traditional efficiency measurement model only considers the proportion improvement of input or output, and the efficiency obtained is often overvalued, which will lead to inaccurate efficiency evaluation. The rural development process is a complex and multi-dimensional process, which is difficult to reflect from a certain aspect. Development is inseparable from economic development, especially from the development of agriculture. Agriculture is the foundation of rural industry, and the quality of agricultural development is an important factor affecting the living standard of rural residents. In order to find out the internal law of rural development, we need to open the “black box”, decomposing the development process, so as to investigate the efficiency of sub-stage and how the sub-stages influence the overall efficiency. In addition, the development goals of “resource-saving and environment-friendly” and “clear waters and green mountains are as good as mountains of gold and silver” also require us not to ignore the impact of undesirable outputs, which directly affects the efficiency and quality of the development of rural economics [63,64,65]. Based on the above new requirements of a rural development efficiency evaluation model, combining the network SBM model with the SBM-undesirable model, a new model considering the undesirable output of network SMB (network SBM-undesirable) is constructed [66,67,68,69,70,71]. Factors that affect the ecology in the process of agricultural production are regarded as undesirable output. Therefore, the model is used to measure agricultural eco-efficiency, rural economic development efficiency and the overall efficiency of rural development. The specific expression of the two-stage network SBM-undesirable model is as follows:
where is the overall efficiency value, is the stage. According to the actual situation of rural development, this paper divides efficiency calculation into two stages, so . is the weight value of stage . As economic benefits and agricultural ecological development have the same important position in rural revitalization, the weight of the two stages is set to 0.5, that is, . is the number of input, desirable output, and undesirable output of stage respectively. is the intermediate output between stage and stage . is the indicators of input desirable output, and undesirable output of stage respectively. and are slacks of input, desirable output, and undesirable output respectively in stage .
If there is and , then DMU is said to have overall DEA efficiency.
The production possibility set of network SBM-undesirable model can be set as follows:
At the same time, the stage efficiency of stage can be expressed as follows:
In the Formula (3), and are the optimal slack variables of input, desirable output, and undesirable output respectively. is the stage efficiency indicator to optimize the overall efficiency. If , the DMU is said to have DEA efficiency at stage . If and only if the DMU is DEA efficiency at all stages, the DMU has DEA efficiency as a whole.
Since the model (1) is fractional programming, it is difficult to solve. Therefore, it is necessary to transform it into linear programming by “Charnes Cooper” transformation. When the numerator and denominator of the objective function of model (1) are multiplied by scalar , the value of will not be changed. By adjusting the value of , the denominator can be exactly changed to 1. In this adjustment process, it can be considered as a new constraint condition into the model, so we only need to find the minimum numerator value.
The specific transformation is as follows:
Multiply by both the numerator and denominator of the objective function in the model (1) to obtain the following model:
If the optimal solution of linear programming (5) is:
Then the optimal solution of model (1) is:
The internal network structure and indicator system of rural development can be substituted into the model (5) to solve the overall efficiency and sub-stage efficiency.
4. Empirical Analysis on the Efficiency of Rural Revitalization
4.1. Construction of the Evaluation Index System
The establishment of the evaluation index system is the premise and foundation of the evaluation of the rural development level. Whether the selection and determination of evaluation indicators are reasonable or not is related to the objectivity, authenticity, and scientificity of evaluation results directly. The construction of an evaluation index system mainly includes the selection of the evaluation index and the establishment of an evaluation model [71]. Rural revitalization is a comprehensive revitalization that includes the revitalization of industry, talents, culture, ecology, and organization, which is also called “five in one” [72]. The relationship among the “five in one” is shown in Figure 3 the elements of which complement each other. As shown in the figure, industrial revitalization is the foundation and the core, and the key to realize it is the revitalization of talents. Without talent, there will be no industrial development. At the same time, we should not destroy the ecological environment to realize the sustainable development of rural areas. In the construction of rural areas, we should make full use of organizations to encourage villagers to learn relevant cultural knowledge, so that all people can participate in rural development and to realize common prosperity eventually.
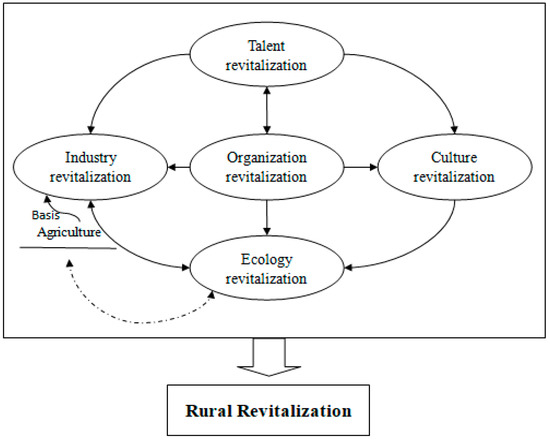
Figure 3.
“Five in one” of rural revitalization.
The evaluation index system of rural development is a multi-factor and multi-level system [45,47]. The system is based on “five in one” to reflect the current situation of rural agriculture, farmers’ life and ecological environment in rural areas. Talent revitalization is the key to rural revitalization, which is to make more talents willing to come and stay in rural areas, so that the quantity and the quality of rural talents can meet the needs of rural revitalization. Due to China’s vast territory, the wide distribution of rural areas, and great differences in the economic and social environment, the design of evaluation indicators for rural areas is not the same, so flexible methods should be adopted. Especially in many rural areas, when the indicators are difficult to obtain, some alternative indicators can be adapted to reflect the actual development situation from the other side [67].
Therefore, in addition to using the indicators that can explain the effect of agricultural development to construct the evaluation index system, we also add the indicators of agricultural damage to the environment and the indicators of rural living standards in rural development to supplement and revise, so as to better evaluate, the construction and development effect of rural areas. According to the selection of research indicators and the needs of research objectives, this paper adopts a two-stage SBM-undesirable model to conduct an empirical analysis of rural development. The rural development process is divided into two parts: the first stage is the development process of ecological agriculture, and the second stage is the process of rural economic development. The specific indicators are shown in Table 1.

Table 1.
Input and output index system.
4.2. Data Preparation
Here, MaxDEA8.0 is used to analyze the panel data of 30 areas in China from 2013 to 2018 based on the considered undesirable output of network SBM model. The difference in rural scale in China is quite obvious. Therefore, it explores the efficiency of rural development under the assumption of variable returns to scale. The advantage of this choice is that it can better find other factors that affect the efficiency of rural development besides the scale factor. In addition, in order to adjust the efficiency of rural development in 30 areas from both input and output, the two-stage network SBM model is adopted as the research model from the non-oriented, and the agricultural non-point source pollution (ANPSP) and the total carbon emissions are considered as the undesirable outputs. Because agricultural ecological development and rural economic development have the same important position in rural development, the weights of the two stages are set to 0.5. The model structure is shown in Figure 4 Furthermore, the collected sample data is brought into the model to measure the agricultural ecological development stage and rural economic construction stage respectively, and finally the overall efficiency is comprehensively analyzed.
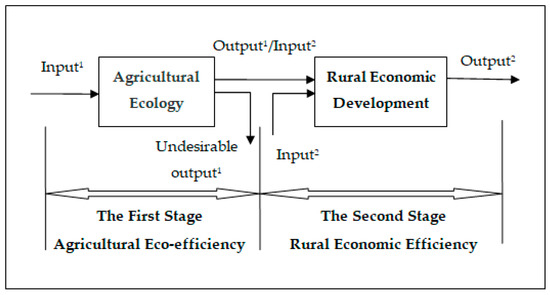
Figure 4.
Two-stage network slack-based measure (SBM)-undesirable model.
4.3. Result Analysis
In the model considering carbon emissions and pollutant emissions, when the efficiency value is equal to 1 means that DMU reaches the DEA efficiency state. When the efficiency value is less than 1, it means that DMU is inefficient. Agricultural development in different areas is affected by the natural environment, such as soil fertility, light conditions, temperature, water quality, which affect the efficiency of rural development directly. Therefore, according to the distribution of natural resources and the level of economic and social development of China’s provincial administrative regions, 30 areas are divided into four regions of eastern, central, western, and northeast. The specific division results are shown in Table 2. The average value of comprehensive efficiency in different regions is summarized, and the average value of comprehensive efficiency is taken as a reference to reflect the efficiency level of rural development in different regions. At the same time, in order to reflect the changes of the comprehensive efficiency level more intuitively in different regions from 2013 to 2018, the paper constructs a diagram of time curves through relevant data to reflect the comprehensive efficiency of different regions.
Table 2.
Division of China’s four economic regions.
By using a two-stage SBM-undesirable model to measure rural development conditions in 30 areas of China, with sorting and analysis of the result of the efficiency, the changes in agricultural eco-efficiency, rural economic efficiency, and the whole model (i.e., rural overall development) efficiency can be obtained from 2013 to 2018, and Figure 5 can be drawn accordingly.
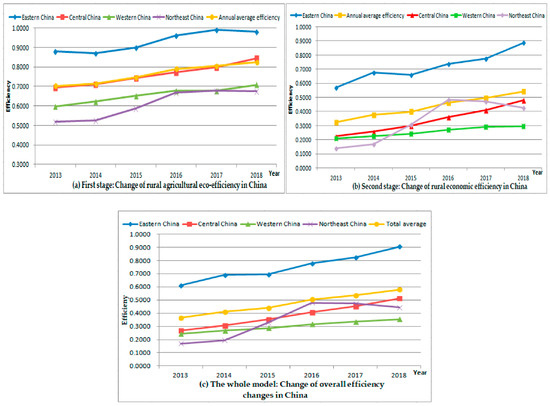
Figure 5.
Operation results of two-stage network SBM-undesirable model.
- (1)
- Analysis of agricultural eco-efficiency. Firstly, from the vertical change of efficiency, the rural agricultural eco-efficiency of 30 areas is 0.703, 0.7147, 0.746, 0.7904, 0.8058 and 0.8244 respectively in China from 2013 to 2018, showing an upward trend year by year. In other words, agricultural ecological development has been improved on the whole, and the average efficiency in 6 years is 0.764. The number of areas reaching agricultural ecological DEA efficiency is 6, 6, 6, 11, 10, 13 from 2013 to 2018 separately, which indicates that the number of areas with DEA efficiency has increased year by year. Secondly, from the perspective of different regions horizontally, the six-year average efficiency of eastern China is 0.9310, reaching the highest, exceeding the total average (0.764). The average in central China is 0.7610, slightly less than the total average. The average values of the western region and the northeast region are 0.6562 and 0.6091, respectively, which are lower than the total average. From the vertical analysis shown in Figure 5a, although each region shows a rising trend year by year, the changing pattern of each region is still different. The annual average of efficiency in the eastern region is above the total annual average, the annual average of efficiency in the central region fluctuates around the total average, and the annual average of the western region and the northeast region is below the total average.
- (2)
- Analysis of rural economic efficiency. Firstly, from the vertical perspective, the average annual efficiency of the rural economic development stage in 30 areas in China from 2013 to 2018 is 0.3247, 0.377, 0.3997, 0.4649, 0.4944, 0.5430 respectively, which shows an upward trend. That is, although the total efficiency is not high, the overall situation has been developing well. This is mainly due to the fact that in recent years, the Chinese government has taken rural economic construction as an important political task, and has successively implemented a series of policies to support and strengthen agriculture, benefit and enrich farmers, so as to promote the development of the rural economy. Secondly, from the perspective of different regions, the average efficiency of eastern China in the six years is 0.7177, which is the first of the four economic regions, far exceeding the average of the total efficiency (0.4339). In addition, the areas that reached DEA efficiency in six years are basically located in the eastern region. This is mainly due to the economic and geographical advantages of the eastern region. The average efficiency of the central region, the western region and the northeast region is 0.339, 0.2554 and 0.3327 separately, which are all lower than the average of the total efficiency. This shows that there is a serious imbalance in the development of the rural economy in China, and the development of the central, western and northeast regions are lagging behind that of the eastern regions. The efficiency of rural economic development in central, western and northeast China is low. On the one hand, it is limited by the relatively backward infrastructure conditions and unbalanced distribution of natural resources, such as blocked road traffic, imperfect water and electricity facilities and communication equipment, and insufficient supporting facilities. On the other hand, it is caused by the unbalanced development of regional economic development level.
- (3)
- Analysis of the overall efficiency of the model. From 2013 to 2018, the overall efficiency of rural development in China increased year by year, but the growth rate was small. The range of the overall efficiency changed greatly, which implies that there is a big gap in rural development, and the distance from the effective frontier was still very large. From the perspective of overall efficiency, the average comprehensive efficiency of 30 areas from 2013 to 2018 was 0.3646, 0.4091, 0.4401, 0.5047, 0.5346, and 0.5783, respectively. From the data trend, the overall efficiency level of rural development was rising steadily in China, with annual growth rates of 12.21%, 7.58%, 14.68%, 5.94%, and 8.16%, respectively, with an average annual growth rate of 9.67% in five years. From the numerical value, it shows that the level of rural development in China was not high, and there was much room for improvement. From the perspective of 30 areas, only Shanghai and Tianjin were in the overall efficiency effective state from 2013 to 2018, and for ineffective areas, we can improve from different angles and directions. From the perspective of the four economic regions, the efficiency of the eastern region was relatively good, while that of the central region, the western region and the northeast region was relatively poor. The average rural development efficiency of the three regions in the past six years was only about 0.3, up to 0.3836.
- (4)
- Comparative analysis of agricultural ecological efficiency and rural economic efficiency. Comparing the average efficiency values of the two stages, we can see that the efficiency of rural economic development in the second stage was significantly lower than that in the first stage. This shows that the main factor restricting the efficiency of rural development is the low efficiency of rural economic development in China. However, the average annual growth rate of agricultural ecological development efficiency was 3.24%, which was less than the average annual growth rate of rural economic development efficiency of 10.83%. It shows that although the efficiency of rural economic development is lower than that of agricultural ecological efficiency, its annual growth rate is higher than that of rural ecological efficiency. Therefore, in the process of rural revitalization, we should not only continue to accelerate the development of agriculture, but also strengthen market guidance to promote the development of rural industrial economy, so as to realize the rapid development of rural economy and rural revitalization.
The differences between the efficiency of rural agricultural ecological development and economic development in China are mainly explained by the following reasons, which are also the reasons for the low efficiency of rural development. Firstly, the supply of rural agricultural products in China has a regional, structural, seasonal surplus, that is, the supply exceeds the demand. The output of agricultural products in China has increased a lot. However, due to the backward production technology and technical facilities in rural areas, the quality of agricultural products has not kept up with the pace and has been at a low level, unable to meet the needs of consumers. With the improvement of material life, people pay more attention to quality, and the poor quality of agricultural products leads to the hoarding of agricultural products, which seriously hinders the economic development of rural areas. Secondly, the input intensity of agricultural production is chronically insufficient. The backward economic development in rural areas is inseparable from the investment in rural areas. On the one hand, it is limited by capital; on the other hand, it lacks the attraction for agricultural investment. The pressure of rural life is not so great and competition in the countryside is weak. No pressure, no motivation. As a result, farmers lack the motivation to improve their lives by investing more in agricultural production and lack enthusiasm for agricultural production. Thirdly, the rural industrial structure is unreasonable, the adjustment lags behind, has not formed the scale development. This is the main reason for the lack of impetus in rural economic development. China’s rural agricultural industrial structure is backward, the agricultural economic structure production is unreasonable, lack of distinctive main products, agricultural products are basically self-produced and self-sold, small farmer’s way of thinking, it is difficult to develop rural characteristics, there are many obstacles in the outward development of the agricultural products market.
4.4. Convergence of Rural Revitalization Efficiency in China
According to the overall efficiency and sub-stage efficiency of rural development of 30 areas and four economic regions calculated by the network SBM-undesirable model in China, the efficiency in different regions is quite different. So will this difference narrow over time? Is it convergent or divergent? Next, it uses the theory and method of economic convergence to judge the convergence of the overall efficiency and sub-stage efficiency of China’s rural development from 2013 to 2018, which can analyze the current situation and evolution trend of the regional disparity of rural development efficiency in China. Thus, it will help us to understand the regional differences of rural development more clearly, so as to promote the development of rural areas in different regions, and provide a direction for grasping the differences of rural development in different regions.
- (1)
- Sigma convergence method. The sigma convergence of rural revitalization efficiency shows the trend of the differences of overall efficiency and sub stage efficiency of China’s rural development over time in different areas and four major economic regions. It studies the phenomenon of low efficiency rural areas catching up with high efficiency rural areas in rural development at the beginning of the period. If there is sigma convergence in rural development efficiency, the gaps of rural development in different regions will decrease gradually. By contrast, the rural development gaps in different regions will continue to exist or even widen. Using the following formula to measure the efficiency of rural development sigma convergence:
Furthermore, the long-term sigma convergence can be further tested by the following formula:
where, . is the standard deviation of regional rural development efficiency, including in agricultural eco-efficiency and rural economic efficiency. is constant term, is time variable and is a random disturbance term. If and significant, it shows that the gaps of rural development efficiency across the regions is narrowing with time, that is, there is convergence. If and significant, it shows that the gaps of rural development efficiency across the regions are expanding over time, that is, there is no convergence. If , it indicates that the rural development efficiency remains at the initial level across the regions.
- (2)
- Result analysis. Formula (8) calculates the sigma convergence value of agricultural eco-efficiency, rural economic efficiency and the whole rural development efficiency in China and in four economic regions from 2013 to 2018, which as shown in Table 3.
Table 3. Convergence analysis of rural development efficiency.
Furthermore, the long-term convergence of rural development in the whole country and in the four economic regions is judged by formula (9), and the results are shown in Table 4.
Table 4.
The results of the sigma convergence test.
Firstly, from the perspective of the total sigma convergence value, whether it is the agricultural eco-efficiency, the rural economic efficiency or the overall efficiency of the model, the numerical changes are not particularly obvious, showing a trend of repeated fluctuations and expansion on the whole. The sigma convergence value of agricultural eco-efficiency is around 0.2, and the sigma convergence value of rural economic efficiency is around 0.3. Likewise, the overall rural development efficiency is also around 0.3, but its fluctuation trend is more gentle. This shows that the gap of rural agricultural ecological development in China is smaller than that of rural economic development. The gap in agricultural ecological development is declining on the whole, but it is on the rise in rural economic development. Because rural development is more affected by economic development, the gap of rural overall development will exist in the long run.
Secondly, from the division of the four economic regions, the change trend of the three efficiency values calculated in the four regions is roughly the same. First of all, sigma convergence value between the eastern and western regions is gradually decreasing, no matter whether in agricultural ecology, economic development or on the whole. However, the sigma convergence value between the central and northeast regions is gradually increasing. These show that in the eastern and western regions, the rural development gap is gradually narrowing, while the development gap between the central and northeast regions is gradually expanding. Secondly, from the specific value of each region, the sigma convergence value of agricultural eco-efficiency is the smallest, but the sigma convergence value of rural economic efficiency is the largest in the eastern region. This is mainly due to the economic and geographical advantages of the eastern region.
Affected by the surrounding industrial construction and urban expansion, rural development in the eastern region has formed the characteristics of interest intensification. Compared with the central and western regions and the northeast regions, the rural development in the eastern region has more economic development experience, and the level of economic development is higher than the other three regions, leading to a large development gap. In the northeast region, the sigma convergence values of the three efficiencies are all relatively large (we know from the previous analysis that the efficiency values in the Northeast region are all small), which have a declining trend after an initial ascent. The main reasons for this trend are as follows. On the one hand, it is limited by the relatively backward infrastructure conditions and the unbalanced distribution of natural resources, such as blocked road traffic, imperfect water and electricity facilities and communication equipment, and insufficient supporting facilities. On the other hand, it is the result of the ambition “to allow people from certain regions to become rich early, and the one who has been rich should help others” put forward from 1984 to 1992 [1,29]. Since the end of 2014, the central government has further implemented relevant policies on revitalizing northeast China [73]. For example, in order to consolidate and improve the core grain production areas, the pilot project of 100 million mu soil deep loosening gives priority to northeast China. In order to accelerate the comprehensive reform experiment of modern agriculture in “Two Great Plains” of Heilongjiang, and improve the benefits compensation mechanism of main grain-producing areas, the state agricultural funds are further inclined to the northeast region, and further strengthen the construction of grain storage and logistics facilities. The above measures have further improved the efficiency of rural economic development in northeast China, which also widens the rural development gap in the region.
Thirdly, the sigma convergence test is further used to evaluate the changes of rural development gaps in different regions of China. In the whole country, it shows that the agricultural development through the sigma test, showing convergence phenomena (< 0). Because the of rural economic development is greater than 0, there is no convergence phenomena, and the overall rural development has no sigma convergence phenomena. From the scope of the four economic regions, the of agricultural development and rural economic development in the eastern and western regions are all less than 0, which indicates that the rural development gaps in the eastern and western regions will gradually narrow and eventually achieve balanced development. Both agricultural development and economic development in the central and northeast regions have not passed the sigma test (> 0), indicating that the rural development gaps in the two regions will continue to expand.
5. Conclusions
5.1. Study Conclusion
Based on previous studies, this paper selects the panel data of 30 areas in China from 2013 to 2018 as samples, considers the non-point source pollution and carbon emission produced in the process of agricultural production as the undesirable outputs, and adopts the two-stage network SBM model to calculate and analyze the efficiency level of rural development in China. Under the model, three types of efficiency can be calculated, namely, agricultural eco-efficiency (the first stage), rural economic efficiency (the second stage) and overall efficiency of rural development (the whole model). On the basis of dividing the whole country into four economic regions, by comparing the distribution patterns of the three types of efficiency in the whole country and in the four economic regions, this paper discusses the relationships of the efficiencies and analyzes the spatial differences of the efficiencies from static and dynamic aspects. Furthermore, it uses the sigma-convergence method to determine the convergence of the efficiencies across the whole country and in the four economic regions.
Firstly, the results of the two-stage network SBM model can be shown as follows after analysis. (1) From 2013 to 2018, the total efficiency of rural development in China increased year by year, but the growth rate was small. The range of the total efficiency changed greatly, which implied that there are big gaps in rural development, and the distances from the effective frontier are still very large, and there is still a long way to go to achieve the sustainable development of rural areas. (2) Comparing the efficiency of the two stages, we could see that the efficiency of rural economic development in the second stage was significantly lower than that in the first stage. This shows that the main factor restricting the efficiency of rural development is the low efficiency of rural economic development in China. Although the efficiency of rural economic development was lower than that of agricultural ecological efficiency, its annual growth rate was higher than that of rural ecological efficiency. This means that the driving force of rural economic development is strong. (3) From the perspective of the four economic regions, during the investigation it could be seen that the efficiency in the eastern region was relatively high, which was above the total annual average, and the trend line of efficiency change was at the top. The western, central and northeastern regions were basically below the national average. Among them, the development efficiency of the northeast region showed a trend of first greatly rising and then slightly decreasing. It was clear that although the imbalance of rural development still exists, the Chinese government is still sparing no effort to develop the backward areas in order to achieve the common prosperity of the whole Chinese people.
Secondly, based on the analysis of three types of efficiency, this paper made a further analysis on the convergence of efficiency to evaluate the changes of rural development gaps in different regions of China. In the whole country, there was no sigma convergence in the efficiency of rural economic development and in the overall efficiency of rural development, but the agricultural eco-efficiency passed the sigma test. It showed that the gaps in agricultural development are gradually narrowing across the country, but gaps in rural economic development still exist. Therefore, the overall rural development gaps will exist for a long time. Among the four economic regions, the three types of efficiency in the eastern and western regions all passed the sigma test, but there was no sigma convergence in the central and northeastern regions. It showed that the rural development gaps in the eastern and western regions are gradually narrowing, but the rural development gaps in the central and northeastern regions are gradually widening and may become increasingly obvious.
5.2. Policy Recommendations
In the construction of rural areas, China should adhere to the development idea of innovation, coordination, green, openness and sharing, strive to meet the people’s growing demand for a better life and solve the problem of unbalanced and inadequate development. By eliminating the gaps between urban and rural regional development, eastern and western regional development and income distribution, we can effectively promote the coordinated development of different regions in order to achieve sustainable development and common prosperity at last.
First of all, it is necessary to establish a unified big market, activate and enliven various production factors, and enhance the internal driving force. By continuously pursuing the ability of rural innovation driven development and enhancing the efficiency of public resource allocation, we should speed up rural renewal and strive to improve the level of rural governance. In addition, it is necessary to accelerate the integration of urban and rural areas, and promote the flow of production factors to rural areas, the diversified development of rural economy, and the interactive development of urban and rural public facilities.
Second, it is necessary to promote the integration development of primary, secondary and tertiary industries. The goal of rural revitalization needs to be achieved through “industry promoting agriculture”, “city driving village” and the three major industries developing together. We should continue to expand the scale of China’s current agricultural operation, realize cross-border integration of industries, and create more new formats, to promote the effective development of the rural economy. In this process village cadres should play a leading role in attracting urban resources to rural areas, including capital and talent resources. The majority of farmers should seize this opportunity to develop rural industry vigorously, promote the integration of “three industries” effectively, and realize development of the rural economy strongly.
Finally, a new type of relationship needs to be built between urban and rural areas to promote the comprehensive integration of urban and rural areas in economic, cultural and other fields. We should promote the two-way flow of resource factors between urban and rural areas so as to achieve equalization of basic public services between urban and rural areas, and constantly narrow the urban–rural gaps. This is the basic guarantee for the transformation of rural construction from unbalanced and inadequate development to high-quality development. In the new situation, the government needs to implement the new development idea earnestly, and increase the supply of rural social security, especially basic public goods, so that farmers can receive more inclusive social security resources. In particular, by the end of 2020, China had completed the task of poverty alleviation in an all-round way. In order to avoid poverty returning in the rural population, it is necessary to establish and perfect a long-term mechanism, and pay close attention to the living conditions of relatively difficult villagers, so as to realize rural revitalization and common prosperity.
5.3. Limitation and Future Research
Although some valuable conclusions have been drawn in this paper, there are still some shortcomings due to the limitations of the authors’ knowledge and the restriction of other objective conditions, they are as follows: (1) The efficiency evaluation results of the two-stage network SBM model are not compared with other methods. It is impossible to judge the advantages and the disadvantages of different methods. (2) China’s vast territory is different from the geographical environment and crop planting habits, so the calculation of undesirable outputs with the same utilization rate and the same carbon emission coefficient may result in bias. (3) The selection of indicators in the two-stage SBM model needs to be further improved. In future research, we should further optimize the selection of indicators, improve the measurement of rural development, consider more external factors, and conduct in-depth research on other factors affecting efficiency of rural development.
Author Contributions
Conceptualization, X.Z.; Data curation, X.Z., R.Z., and Y.Z.; Formal analysis, X.Z. and R.Z.; Methodology, X.Z., and S.N.; Resources, X.Z. and S.N.; Software, Z.L. and and S.N.; Validation, X.Z., and S.N.; Writing—Original draft, X.Z.; All authors have read and agreed to the published version of the manuscript.
Funding
This research received no external funding.
Institutional Review Board Statement
The study did not involve humans or animals.
Informed Consent Statement
The study did not involve humans or animals.
Data Availability Statement
The data used in the paper is from the National Bureau of Statistics of China: https://data.stats.gov.cn/
Acknowledgments
This paper was supported by Wonkwang University in 2021.
Conflicts of Interest
The authors declare no conflict of interest.
References
- Chen, X.W. Forty years of rural reform in China: Retrospect and future prospects. China Agric. Econ. Rev. 2019, 11, 460–470. [Google Scholar] [CrossRef]
- Liu, X.P. Exploring in the approach to rural revitalization in the view of green development. IOP Conf. Ser. Earth Environ. Sci. 2019, 5, 73–78. [Google Scholar]
- Ou, G.C. Research on the rural revitalization strategy based on big data. Inf. Technol. Informatization 2019, 2, 157–160. [Google Scholar]
- Yin, X.; Chen, J.; Li, J. Rural innovation system: Revitalize the countryside for a sustainable development. J. Rural Stud. 2019, 1–7. [Google Scholar] [CrossRef]
- Xi, J.P. Secure a decisive victory in building a moderately prosperous society in all respects and strive for the great success of socialism with Chinese characteristics for a new era. In Proceedings of the 19th National Congress of the Communist Party of Beijing, Beijing, China, 18 October 2017. [Google Scholar]
- Wang, H.; Zhou, Y. The Necessary way for the development of China’s rural areas in the new Era-Rural Revitalization Strategy. Open J. Soc. Sci. 2018, 6, 97–106. [Google Scholar] [CrossRef]
- Sun, L. The exploration and promotion of the revitalization strategy of rural areas in Hainan Province. SSMME 2018, 4, 87–90. [Google Scholar]
- Song, G.W. Implementation of the rural revitalization development strategy in all respects. Soc. Sci. Rev. 2017, 32, 5–8. [Google Scholar]
- Hellweg, S.; Doka, G.; Finnveden, G.; Hungerbühler, K. Assessing the eco-efficiency of end-of-pipe technologies with the environmental cost efficiency indicator. J. Ind. Ecol. 2005, 9, 189–203. [Google Scholar] [CrossRef]
- Meier, M.A. Eco-efficiency evaluation of waste gas purification systems in the chemical industry. Reprod. Biol. Endocrinol. 1997, 2, 35–40. [Google Scholar]
- Pretty, J. Agricultural sustainability: Concepts, principles and evidence. Philos. Trans. R. Soc. B Biol. Sci. 2008, 363, 447–465. [Google Scholar] [CrossRef] [PubMed]
- Schaltegger, S.; Sturm, A. Ökologische rationalität: Ansatzpunkte zur ausgestaltung von ökologieorientierten management instrumenten. Unternehmung 1990, 4, 273–290. [Google Scholar]
- Verfaillie, H.; Bidwell, R. Measuring Eco-Efficiency a Guide to Reporting Company Performance; World Business Council for Sustainable Development (WBSCD): Geneva, Switzerland, 2001. [Google Scholar]
- Zaim, O.; Taskin, F. Environmental efficiency in carbon dioxide emissions in the OECD: A non-parametric approach. J. Environ. Manag. 2000, 58, 95–107. [Google Scholar] [CrossRef]
- Zhang, X.F. The evaluation and dynamic analysis of eco-efficiency—based on panel data of Western China’s provinces 2000–2010. Econ. Theory Bus. Manag. 2013, 2, 78–85. [Google Scholar]
- Zhou, G.M.; Peng, H.; Cao, F.Z. Circular economy and industrial eco-efficiency indicator system. Urban Environ. Urban Ecol. 2003, 16, 201–203. [Google Scholar]
- Zhu, D.J.; Zhu, Y. Eco efficiency and circular economy. Fudan J. 2005, 2, 60–66. [Google Scholar]
- Ding, X.; Wang, L.; He, J. The innovation system efficiency of regional agriculture and the driving factors considering eco-environmental effects under rural revitalization strategy. Sci. Technol. Manag. Res. 2018, 38, 230–237. [Google Scholar]
- Guo, D.; Wu, J. A complete ranking of DMUs with undesirable outputs using restrictions in DEA models. Math. Comput. Model. 2013, 58, 1102–1109. [Google Scholar] [CrossRef]
- Feng, H.; Zhu, L.Y.; Xu, X.N. Total factor productivity evaluation of two-stage process based on the undesirable outputs. Sci. Technol. Manag. Res. 2014, 24, 218–223. [Google Scholar]
- Li, L.; Lei, Y.; Pan, D.; Si, C. Research on sustainable development of resource-based cities based on the DEA approach: A case study of Jiaozuo, China. Math. Probl. Eng. 2016, 6, 1–10. [Google Scholar] [CrossRef]
- Wang, Q.; Zhang, X.R. Efficiency evaluation of fiscal expenditure for agriculture and its influential factors based on DEA-Tobit model--taking Shandong province for example. Syst. Eng. 2017, 35, 91–100. [Google Scholar]
- Zheng, D.F.; Hao, S.; Sun, C.Z.; Lyu, L. Spatial correlation and convergence analysis of eco-efficiency in China. Sustainability 2019, 11, 2490. [Google Scholar] [CrossRef]
- Wang, J. Study on the Utilization Efficiency of Agricultural Land in Jin-xian County under the Background of Rural Revitalization; Jiangxi Agricultural University: Jiangxi, China, 2019. [Google Scholar]
- Shang, J.; Ji, X.; Chen, X. Study on the impact of China’s urbanization on agricultural ecological efficiency: Based on panel data of 13 major grain-producing regions in China from 2009 to 2018. Chin. J. Eco-Agric. 2020, 8, 1265–1276. [Google Scholar]
- Grovermann, C.; Wossen, T.; Muller, A.; Nichterlein, K. Eco-eEfficiency and agricultural innovation systems in developing countries: Evidence from macro-level analysis. PLoS ONE 2019, 14, 1–16. [Google Scholar] [CrossRef] [PubMed]
- Han, J. Prioritizing agricultural, rural development and implementing the rural revitalization strategy. China Agric. Econ. Rev. 2019, 12, 14–19. [Google Scholar] [CrossRef]
- Chen, X.; Xin, X. The core of China’s rural revitalization: Exerting the functions of rural area. China Agric. Econ. Rev. 2019, 12, 1–13. [Google Scholar] [CrossRef]
- Huang, J.; Rozelle, S.; Zhu, X.; Zhao, S.; Sheng, Y. Agricultural and rural development in China during the past four decades: An introduction. Aust. J. Agric. Resour. Econ. 2020, 64, 1–13. [Google Scholar] [CrossRef]
- Huang, A.; Zhang, C.; Liu, P.; Wang, J.; Ren, W.; Zheng, Y. Input-output analysis of Chinese national agricultural science and technology park. In ICAIS 2019, Artificial Intelligence and Security; Springer: Cham, Switzerland, 2019; pp. 509–523. [Google Scholar]
- Chen, L. Exploration of China’s characteristic rural revitalization strategy in new era. J. Northwest A F Univ. 2018, 18, 55–62. [Google Scholar]
- Yuan, S.J. Basic conception of research on construction of rural logistics system in Hunan province based on rural revitalization strategy. In Proceedings of the 5th International Conference on Economics, Management, Law and Education (EMLE 2019), Krasnodar, Russia, 11–12 October 2019; Volume 110, pp. 862–864. [Google Scholar]
- Jia, J.; Li, X.F.; Shen, Y. Indicator system construction and empirical analysis for the strategy of rural vitalization. Finance Econ. 2018, 11, 70–82. [Google Scholar]
- Howard, E. Garden cities of To-Morrow. Organ. Environ. 1965, 16, 98–107. [Google Scholar] [CrossRef]
- Lewis, G.J. A welsh rural community in transition: A case study in mid-wales. Sociol. Rural. 1970, 10, 143–161. [Google Scholar] [CrossRef]
- Nas, P.; Wuisman, J. Urban-rural dimensions of social development. Soc. Cult. Dev. Hum. Resour. 2009, 5, 140–146. [Google Scholar]
- Mili, S. Logical evolution of Marxist thought of urban-rural integration and development. MFSSR 2019, 2019, 959–963. [Google Scholar]
- Zhang, S.; Yu, Z.X. Evaluation of modern agricultural development level in Huaibei area of Anhui province. Asian Agric. Res. 2017, 9, 34–39. [Google Scholar]
- Guo, Z. Land remediation boosts rural revitalization. Adv. Soc. Sci. 2019, 8, 1623–1627. [Google Scholar]
- Wu, Y. The pricing mechanism innovation of land remediation in hollow village—Investigation and thinking on Houzhai river basin in Guizhou province. Open J. Soc. Sci. 2017, 5, 196–208. [Google Scholar] [CrossRef][Green Version]
- Liu, Y.S. Introduction to land use and rural sustainability in China. Land Use Policy 2018, 74, 1–4. [Google Scholar] [CrossRef]
- Duan, L.L.; Wang, L.M. Is the protection of green water and green hills conducive to regional anti-poverty-new evidence from poor areas along the Yangtze River economic-belt. J. Guizhou Univ. Finance Econ. 2020, 38, 78–80. [Google Scholar]
- Li, Y.; Wu, W.; Liu, Y. Land consolidation for rural sustainability in China: Practical reflections and policy implications. Land Use Policy 2018, 74, 137–141. [Google Scholar] [CrossRef]
- Liang, L.T.; Qu, F.T.; Wang, C.H. Analysis on cultivated land use efficiency based on DEA. Resour. Environ. Yangtze Basin 2008, 2, 242–246. [Google Scholar]
- Yan, J. Spatiotemporal analysis for investment efficiency of China’s rural water conservancy based on DEA model and Malmquist productivity index model. Sustain. Comput. Inform. Syst. 2019, 21, 56–71. [Google Scholar] [CrossRef]
- Kuang, B.; Lu, X.H.; Zhou, M.; Chen, D.L. Provincial cultivated land use efficiency in China: Empirical analysis based on the SBM-DEA model with carbon emissions considered. Technol. Forecast. Soc. Change 2020, 151, 1–10. [Google Scholar] [CrossRef]
- Mao, W.; Koo, W.W. Productivity growth, technological progress, and efficiency change in Chinese agriculture after rural economic reforms: A DEA approach. China Econ. Rev. 1997, 8, 157–174. [Google Scholar] [CrossRef]
- Vennesland, B. Measuring rural economic development in Norway using data envelopment analysis. For. Policy Econ. 2005, 7, 109–119. [Google Scholar] [CrossRef]
- Cui, Y.; Yan, L. Performance of the government finance used in agriculture: An evaluation test with DEA model. Issues Agric. Econ. 2006, 9, 37–40. [Google Scholar]
- Ye, H.; Wang, Y.P. Grain direct subsidy efficiency and policy Based on DEA Model. Res. Agric. Mod. 2006, 27, 356–359. [Google Scholar]
- Poudel, K.L.; Johnson, T.G.; Yamamoto, N.; Gautam, S.; Mishra, B. Comparing technical efficiency of organic and conventional coffee farms in rural hill region of Nepal using data envelopment analysis (DEA) approach. Organic Agric. 2015, 5, 263–275. [Google Scholar] [CrossRef]
- Li, H.; Fang, K.N.; Yang, W.; Wang, D.; Hong, X.X. Regional environmental efficiency evaluation in China: Analysis based on the Super-SBM model with undesirable outputs. Math. Comput. Model.. 2013, 58, 1018–1031. [Google Scholar] [CrossRef]
- Li, H.; Yang, W.; Zhou, Z.; Huang, C. Resource allocation models’ construction for the reduction of undesirable outputs based on DEA methods. Math. Comput. Model. 2013, 58, 913–926. [Google Scholar] [CrossRef]
- Wu, J.; An, Q.; Xiong, B.; Chen, Y. Congestion measurement for regional industries in China: A data envelopment analysis approach with undesirable outputs. Energy Policy 2013, 57, 7–13. [Google Scholar] [CrossRef]
- Martinčík, D. Regional socio-economic level: Comprehensive comparative analysis. Econ. Manag. 2008, 1, 14–25. [Google Scholar]
- Martinčík, D.; Šlehoferová, M. Competitiveness and convergence of Czech regions: Persistence of discrepancies. Econ. Manag. 2014, 2, 14–33. [Google Scholar] [CrossRef][Green Version]
- Vaishar, A.; Zapletalová, J. Sustainable development of rural microregions in the Czech Borderland. Morav. Geogr. Rep. 2009, 17, 34–43. [Google Scholar]
- Hlavsa, T. The possibilities of complex assessment of the development and categorization of rural areas. Acta Univ. Agric. Silvic. Mendel. Brun. 2010, 58, 151–160. [Google Scholar] [CrossRef]
- Luan, W.J.; Sun, H.; Song, Y.Y.; Yang, W.Q.; Hu, H.W. The input-output efficiency assessment and influential factors analysis of rural pension coverage in rural China—Based on the two-step method of DEA and Tobit. J. Huazhong Agric. Univ. 2013, 1, 84–89. [Google Scholar]
- You, H.; Zhang, X.L. Ecoefficiency of intensive agricultural production and its influencing factors in China: An application of DEA-Tobit analysis. Discrete Dyn. Nat. Soc. 2016, 3, 1–14. [Google Scholar] [CrossRef]
- Charnes, A.; Cooper, W.W.; Rhodes, E. Measuring the efficiency of decision-making units. Eur. J. Oper. Res. 1978, 2, 429–444. [Google Scholar] [CrossRef]
- Wei, Q.L. Data envelopment analysis. Chin. Sci. Bull. 2001, 46, 1321–1332. [Google Scholar] [CrossRef]
- Olawumi, T.O.; Chan, D.W. A scientometric review of global research on sustainability and sustainable development. J. Clean. Prod. 2018, 183, 231–250. [Google Scholar] [CrossRef]
- Silvestre, B.S.; Tirca, D.M. Innovations for sustainable development: Moving toward a sustainable future. J. Clean. Prod. 2019, 208, 325–332. [Google Scholar] [CrossRef]
- Zhang, X.; Chen, N.; Sheng, H.; Ip, C.; Yang, L.; Chen, Y.; Sang, Z.; Tadesse, T.; Lim, T.; Rajabifard, A. Urban drought challenge to 2030 sustainable development goals. Sci. Total Environ. 2019, 693, 133–156. [Google Scholar] [CrossRef]
- Maghbouli, M.; Amirteimoori, A.; Kordrostami, S. Two-stage network structures with undesirable outputs: A DEA based approach. Measurement 2014, 48, 109–118. [Google Scholar] [CrossRef]
- Marschall, P.; Flessa, S. Efficiency of primary care in rural Burkina Faso. A two-stage DEA analysis. Health Econ. Rev. 2011, 1, 1–15. [Google Scholar] [CrossRef] [PubMed]
- Song, X.; Hao, Y.; Zhu, X. Analysis of the environmental efficiency of the Chinese transportation sector using an undesirable output slacks-based measure data envelopment analysis model. Sustainability 2015, 7, 9187–9206. [Google Scholar] [CrossRef]
- Wu, J.; Zhu, Q.; Chu, J.; Liang, L. Two-stage network structures with undesirable intermediate outputs reused: A DEA based approach. Comput. Econ. 2015, 46, 455–477. [Google Scholar] [CrossRef]
- Zhang, J.; Zeng, W.; Wang, J.; Yang, F.; Jiang, H. Regional low-carbon economy efficiency in China: Analysis based on the super-SBM model with Co2 emissions. J. Clean. Prod. 2015, 163, 202–211. [Google Scholar] [CrossRef]
- Chen, Q.; Chen, L.N.; Song, J. Research on the establishment of evaluation index system of Tianjin rural innovation capability. Tianjin Agric. Sci. 2015, 21, 41–45. [Google Scholar]
- Guo, X.Y.; Hu, Y. Construction of evaluation index system of rural revitalization level. Agric. Econ. Manag. 2020, 5, 5–15. [Google Scholar]
- Fang, Y.; Xu, K.; Guo, X.; Hong, Y. Identifying determinants of straw open field burning in northeast China: Toward greening agriculture base in newly industrializing countries. J. Rural Stud. 2020, 74, 111–123. [Google Scholar] [CrossRef]


Publisher’s Note: MDPI stays neutral with regard to jurisdictional claims in published maps and institutional affiliations. |
© 2021 by the authors. Licensee MDPI, Basel, Switzerland. This article is an open access article distributed under the terms and conditions of the Creative Commons Attribution (CC BY) license (http://creativecommons.org/licenses/by/4.0/).