
Mortars with Recycled Aggregates from Building-Related Processes: A ‘Four-Step’ Methodological Proposal for a Review


Abstract
1. Introduction
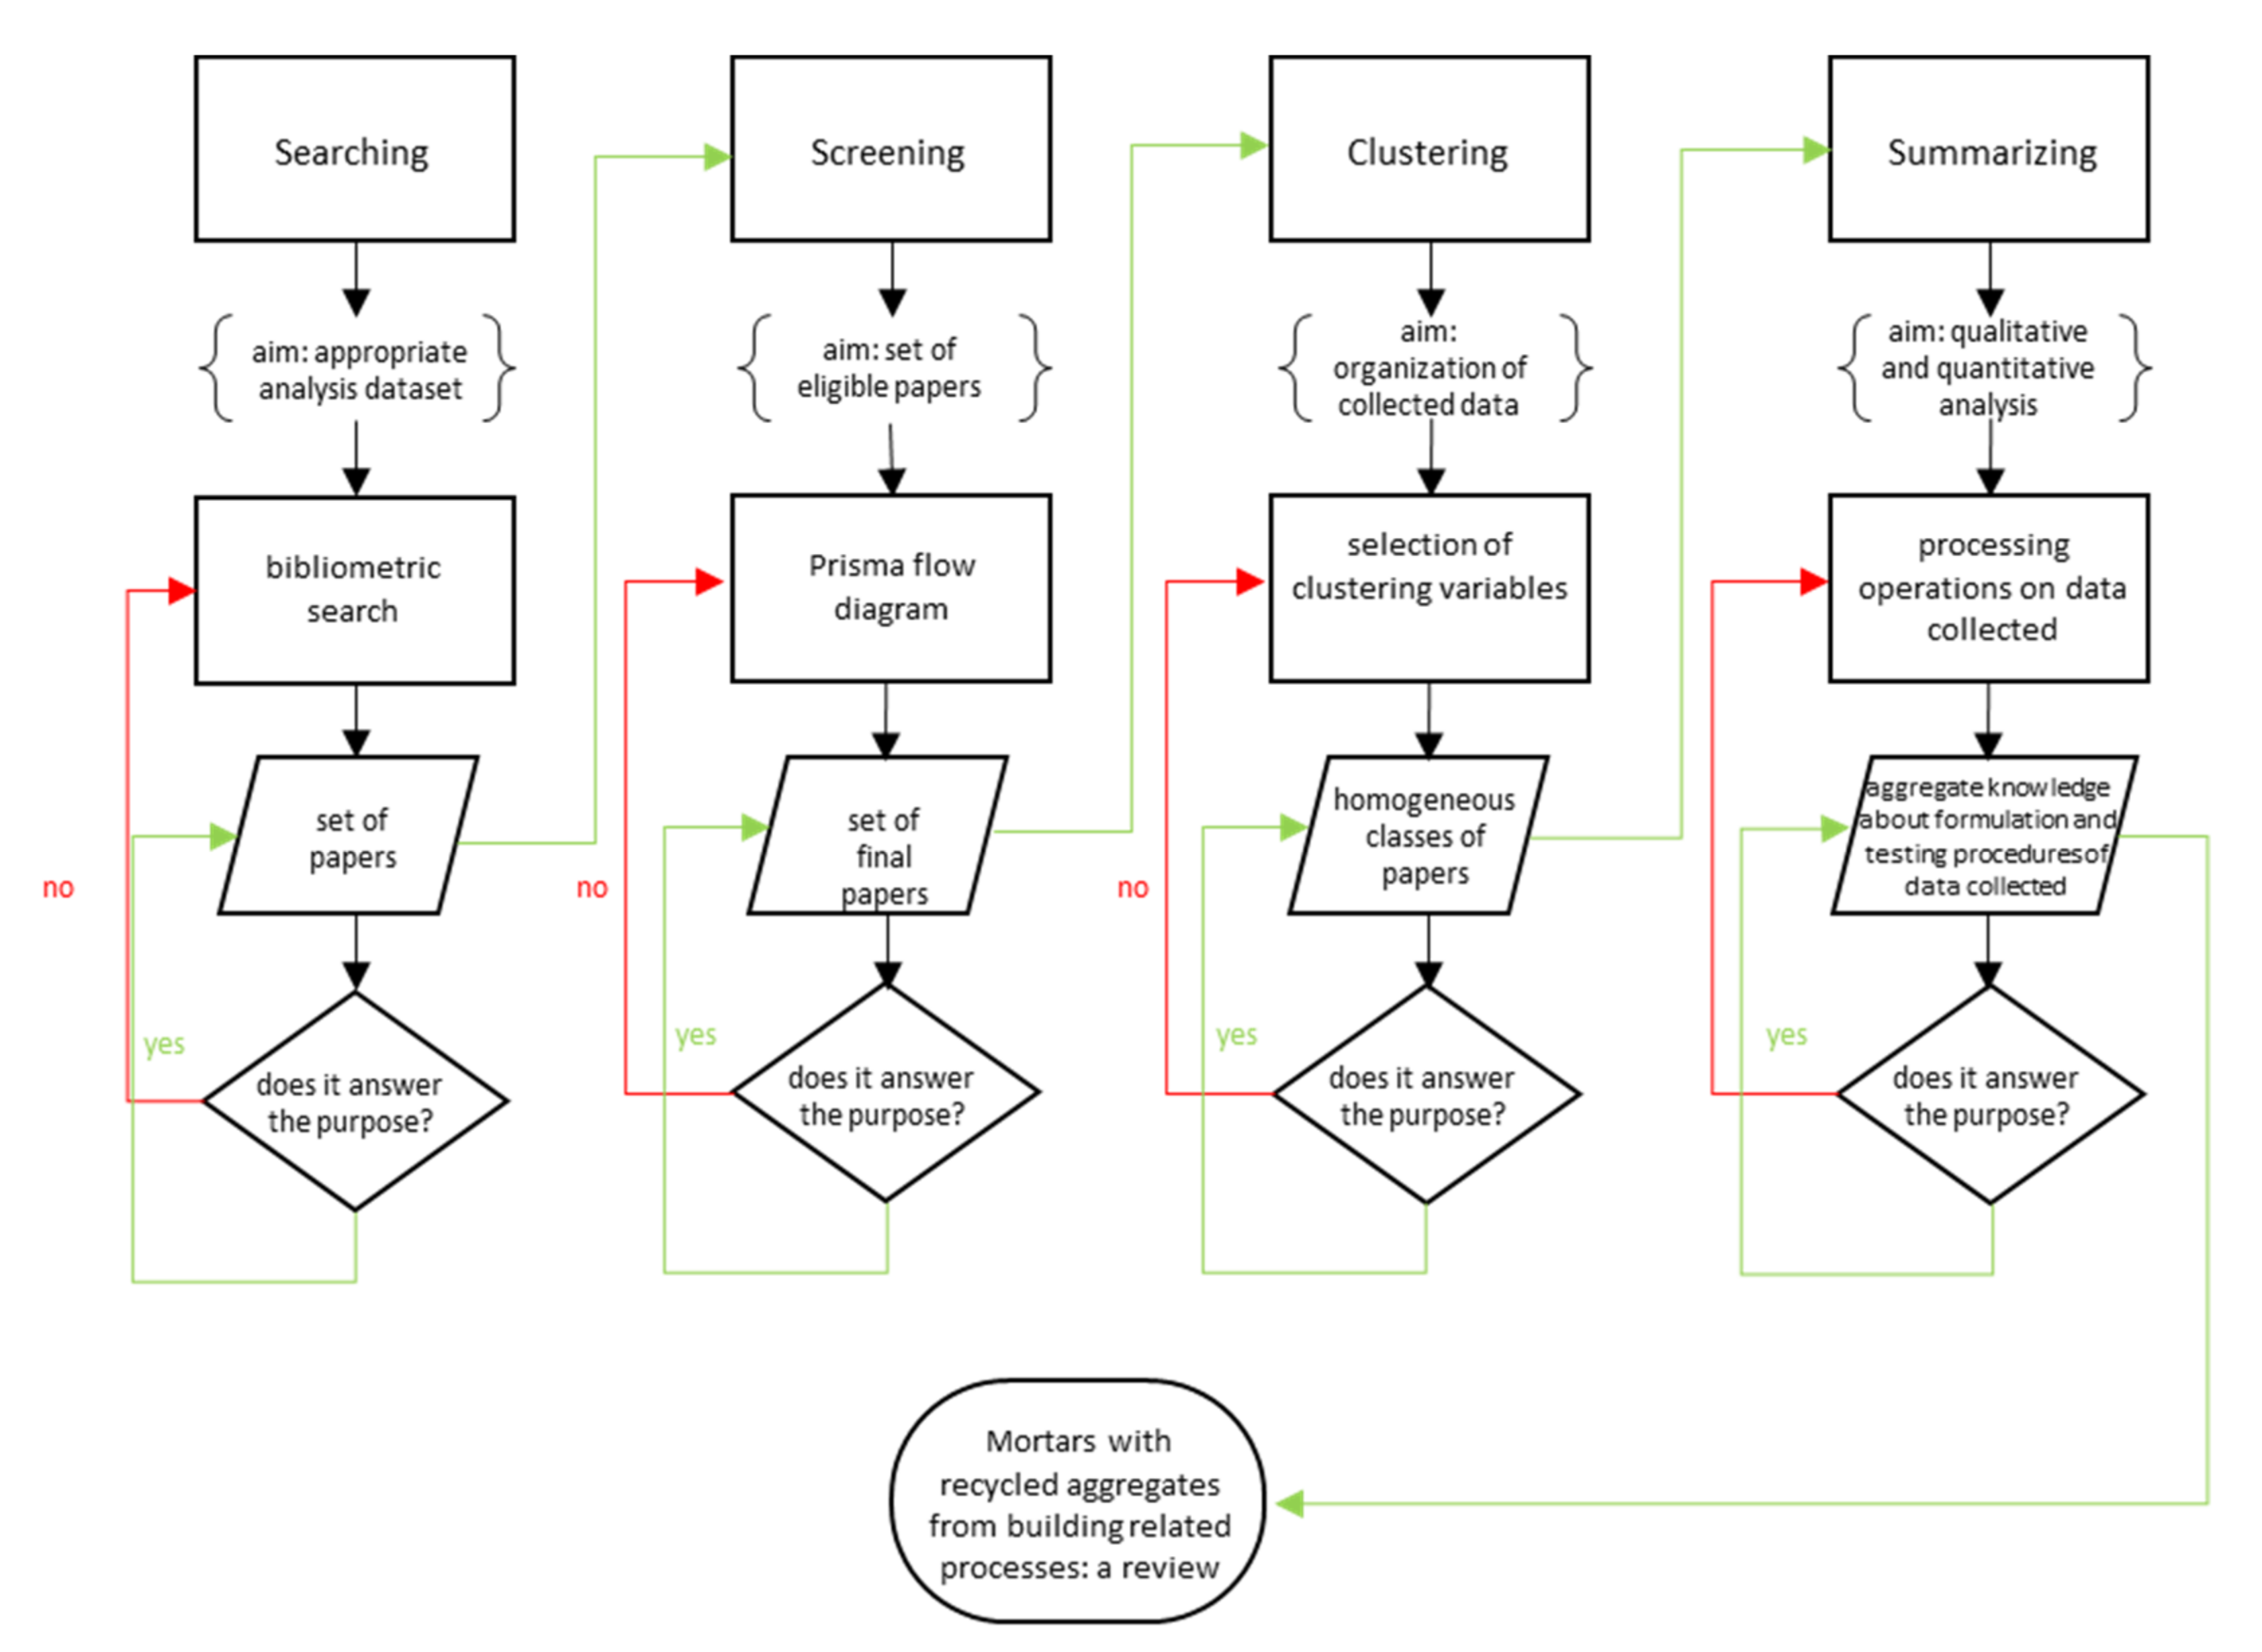
2. Methodology
2.1. Searching
2.2. Screening
- The object of the record. This criterion was used to eliminate the papers which did not answer the aim of the present study. Firstly, the articles which focused on geopolymers, concretes, and conglomerates for road asphalt or pavements were excluded. In fact, the formulation, the mixing procedure, and the chemical-mineralogical characteristics of geopolymers differ from traditional mortars. Secondly, because different types of conglomerate require specific laboratory tests, in accordance with the regulations, the papers about concretes and conglomerates for road applications were excluded, because the data they produced were beyond the interest of this review.
- The source of the RA. This filter eliminated the papers which employed sludge, since sludge is a highly heterogeneous material, and its consistency is not solid. Moreover, RA sourced from food industry waste or from biomasses were excluded because of their organic matter, as well as the RA containing hazardous or toxic materials from heavy industries, because of the supplementary treatments they need.
- The role of the RA. Papers in which the RA substituted the binder—rather than being used as an aggregate—were removed from the analysis dataset.
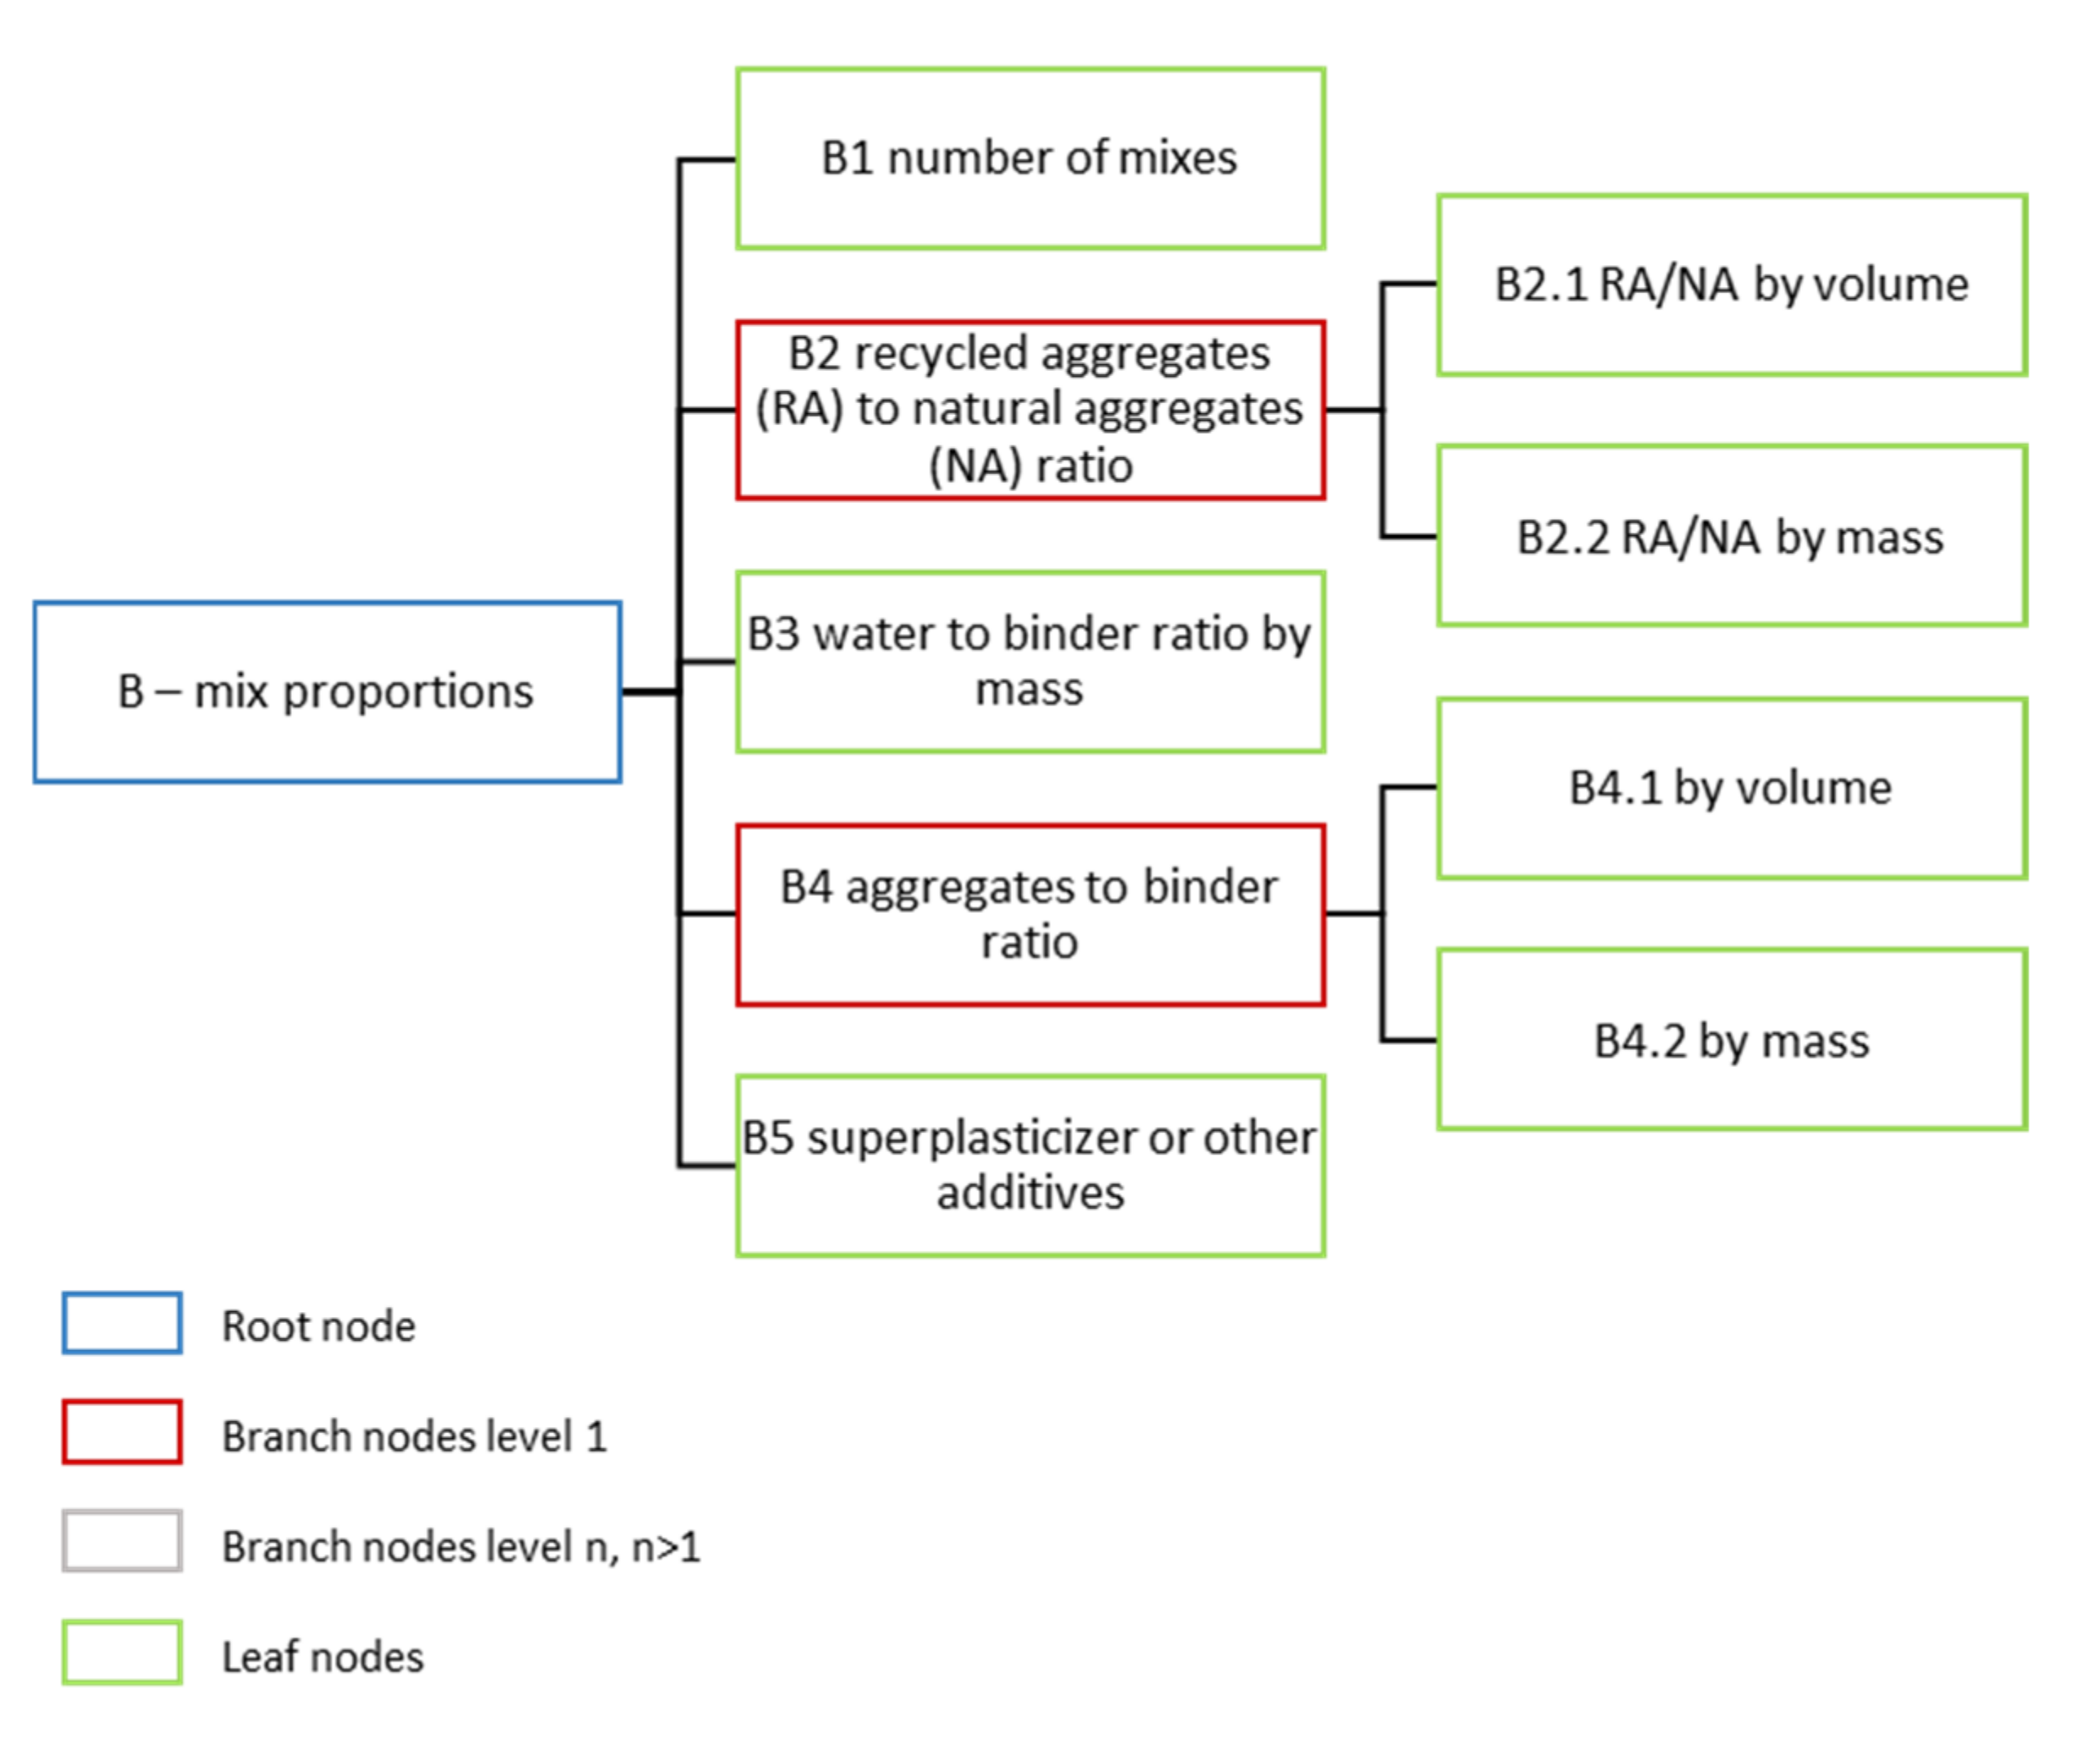
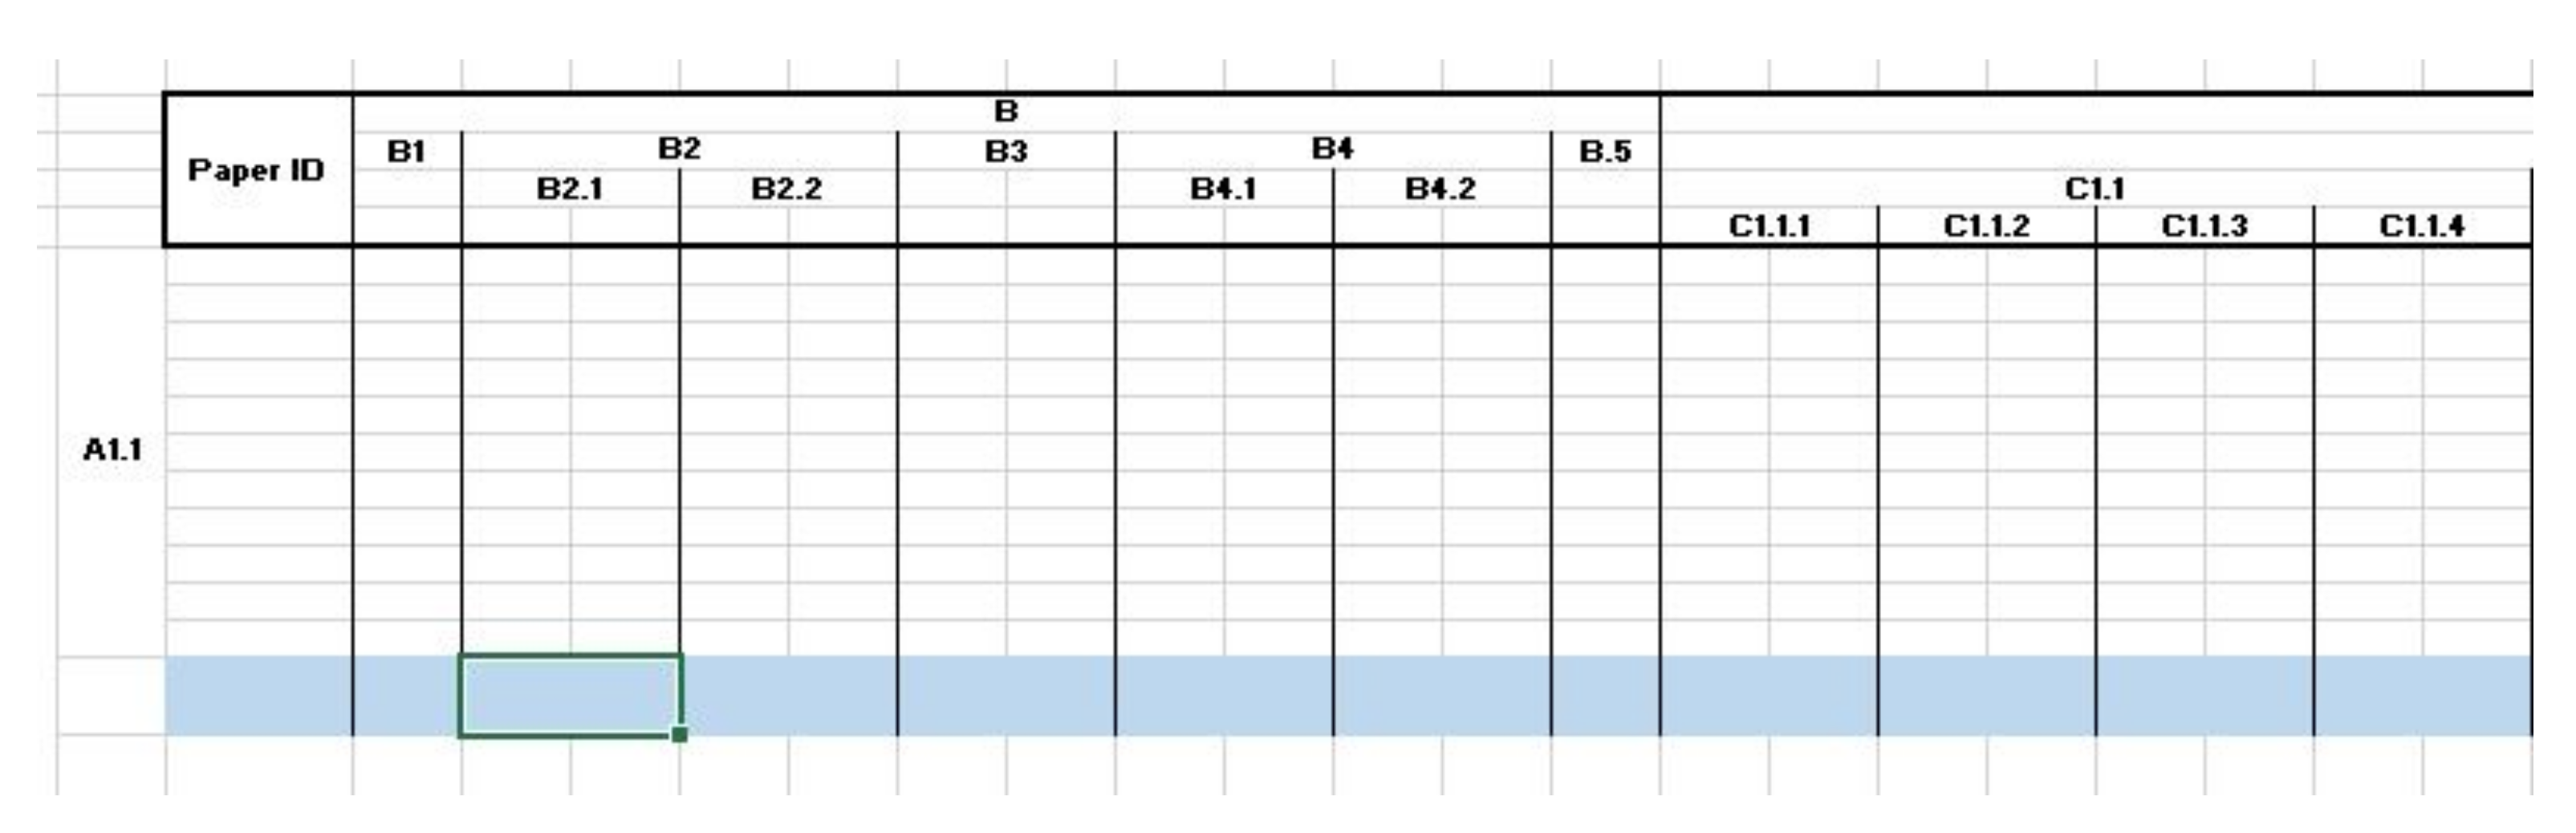
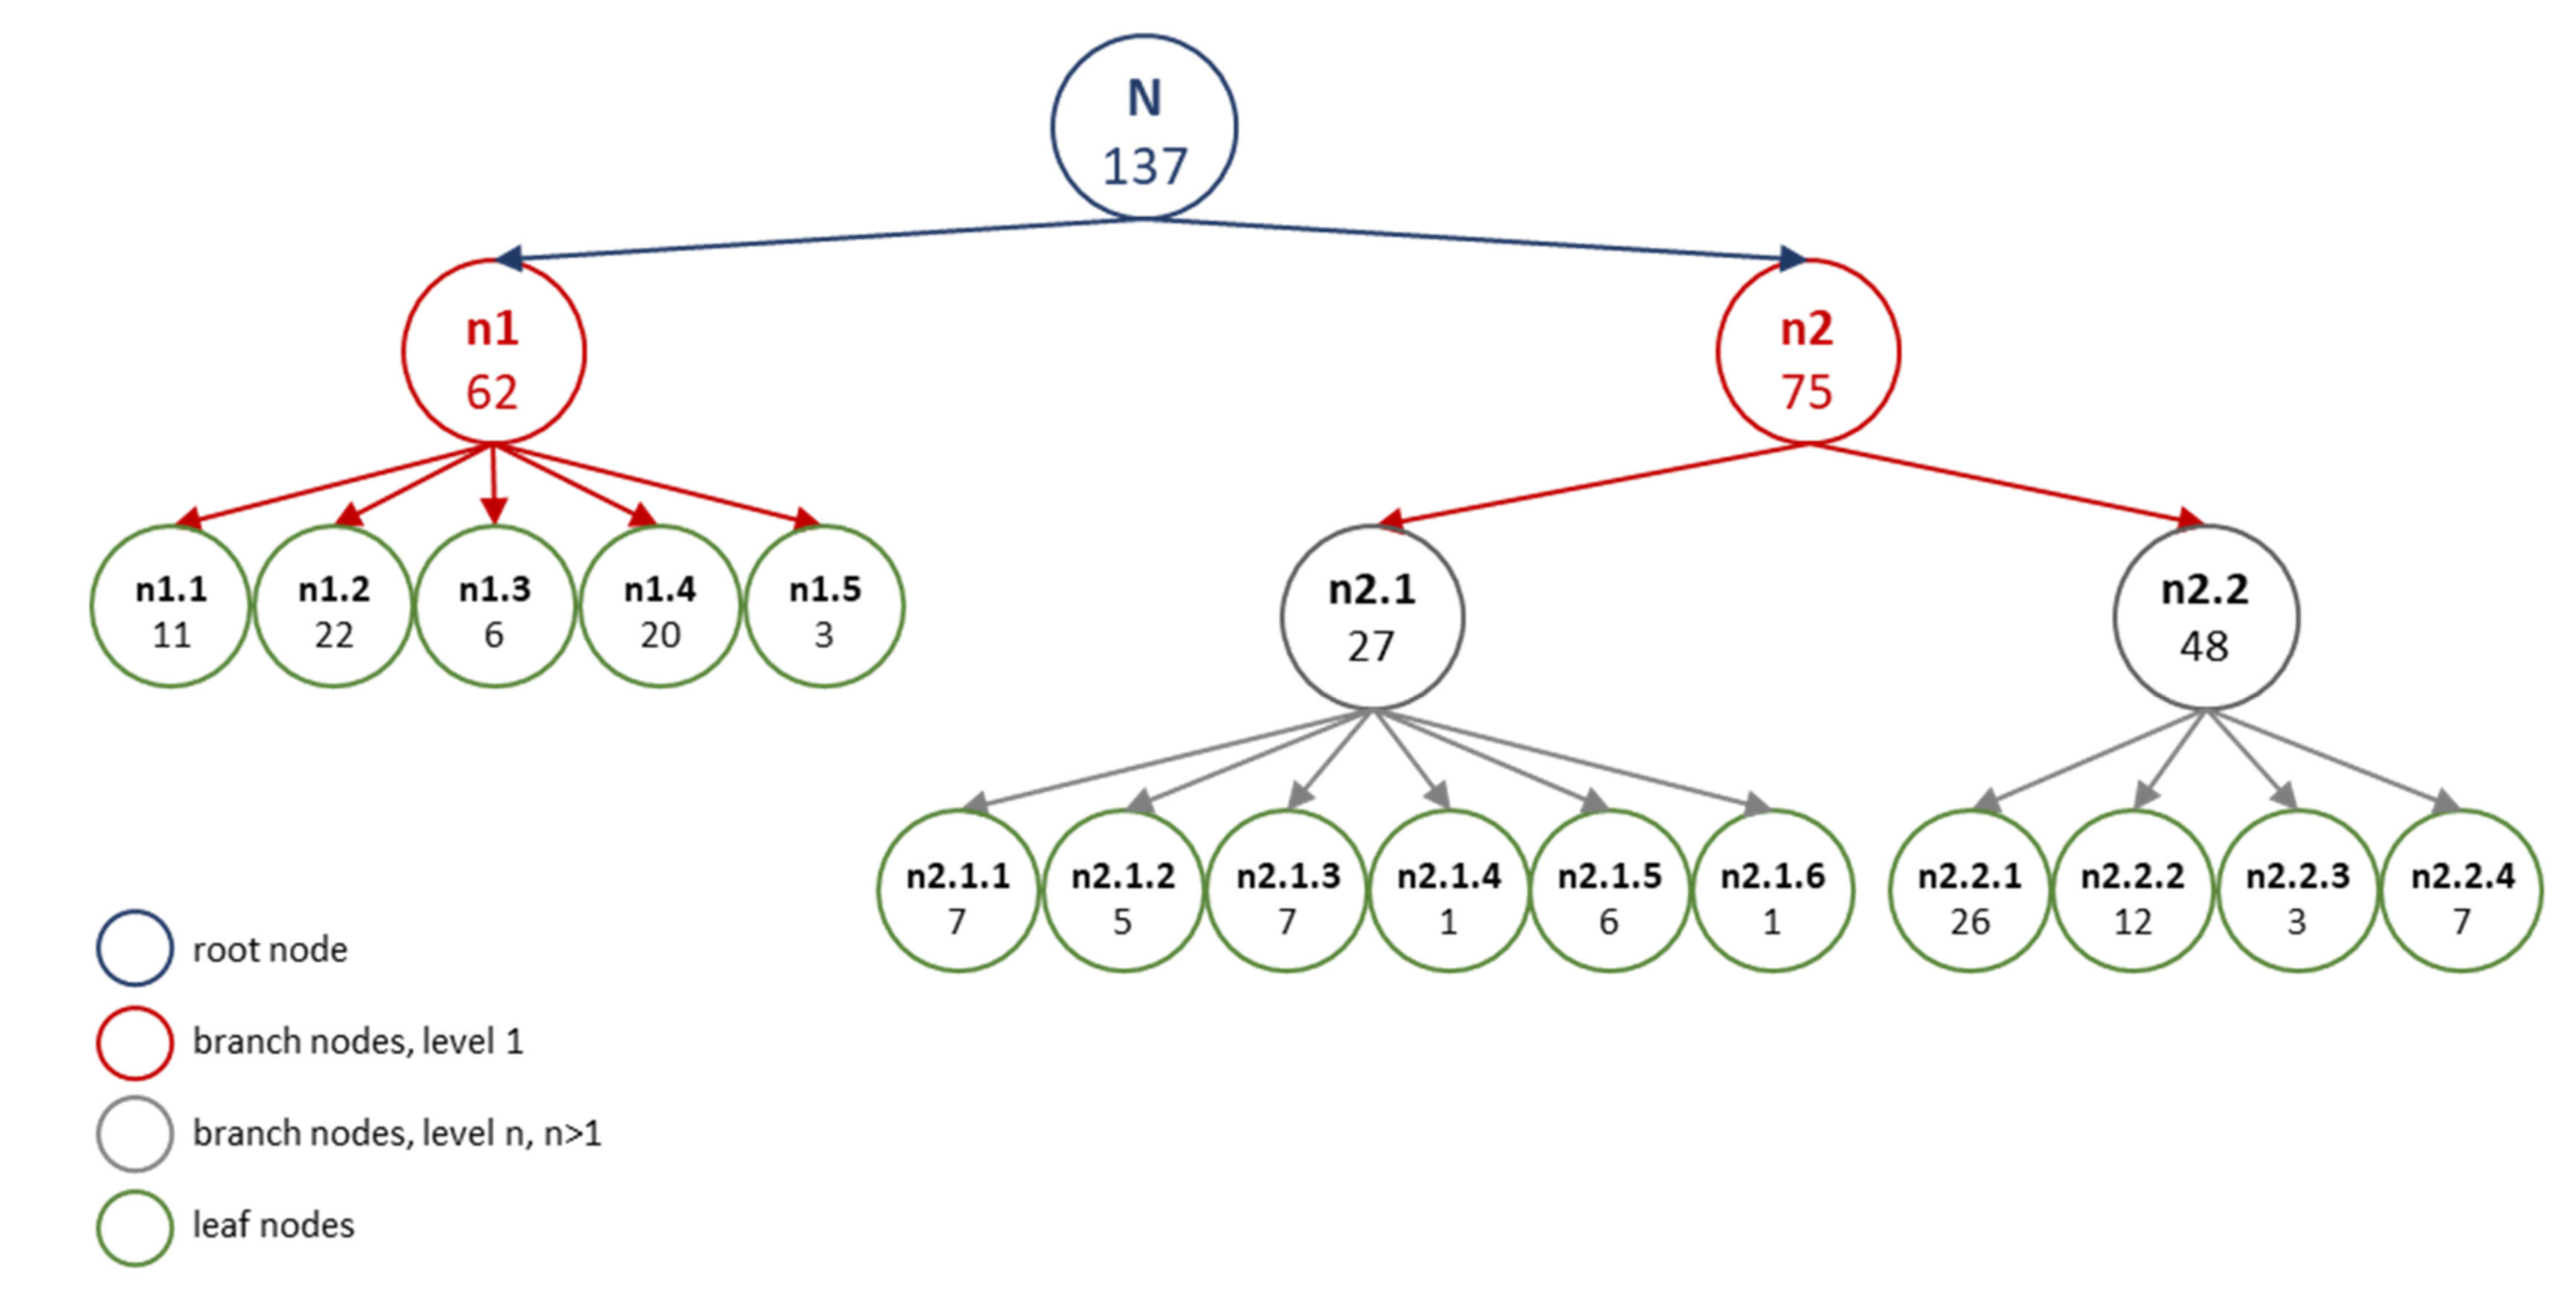
2.3. Clustering
- A: type of aggregate,
- B: mix design,
- C: tested properties,
- D: patents and availability on the market.
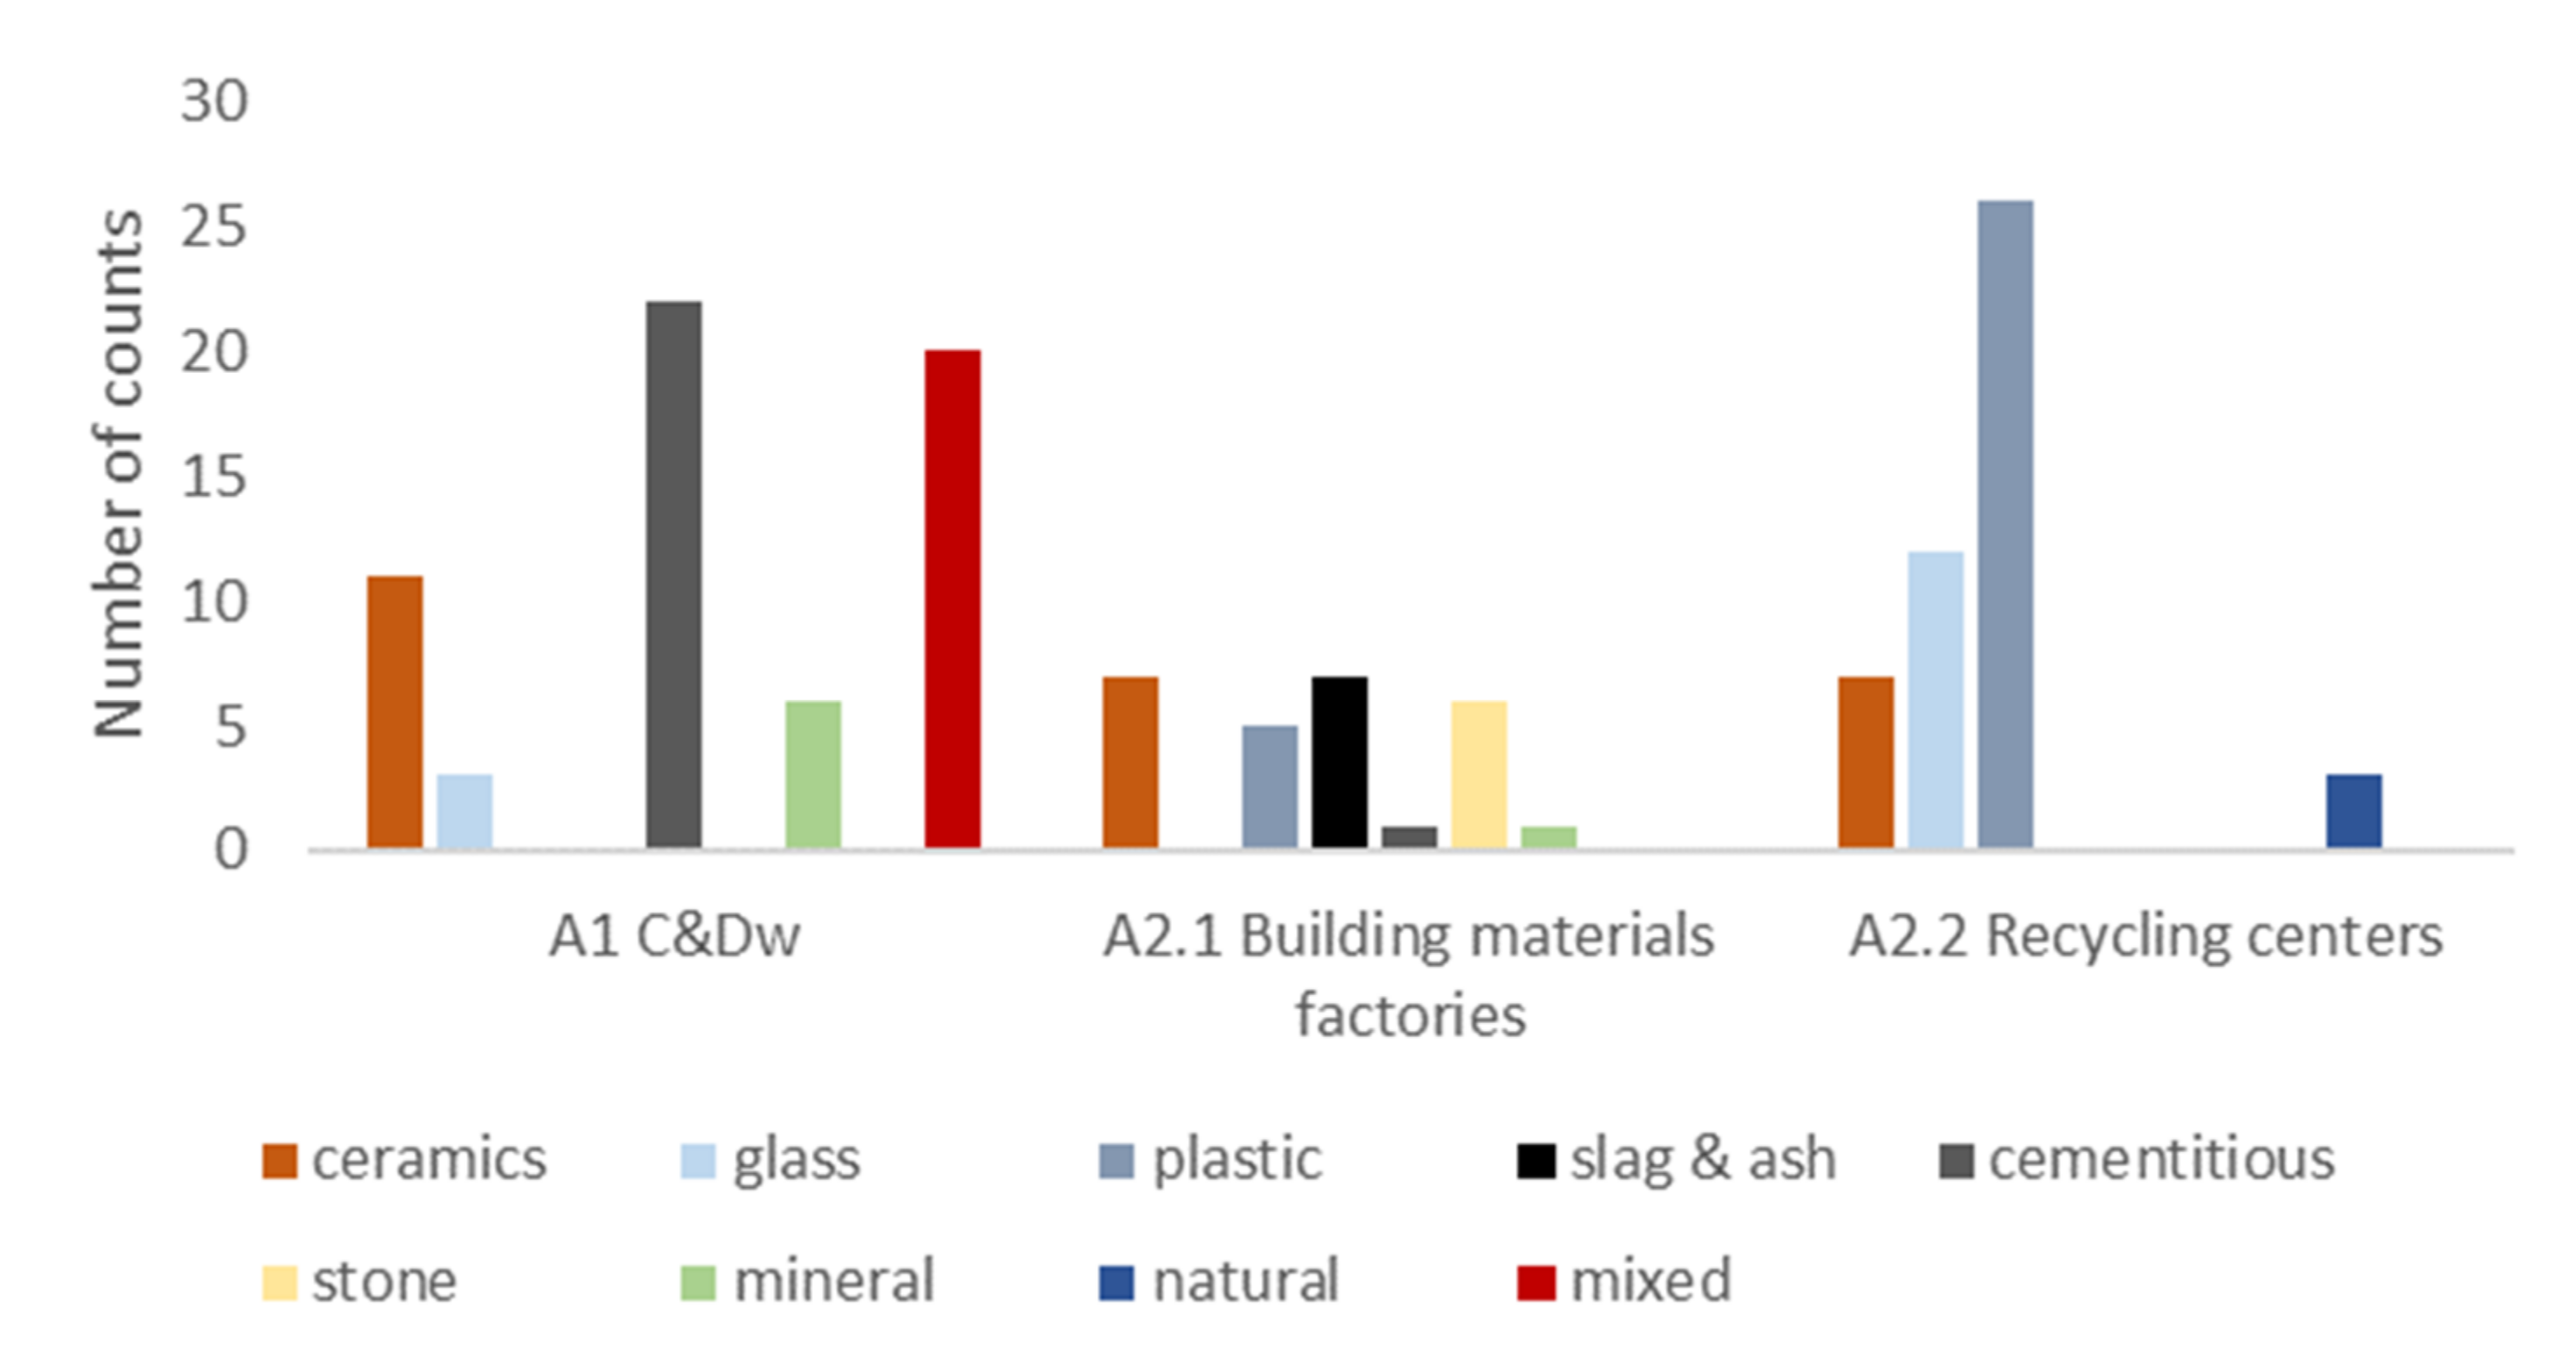
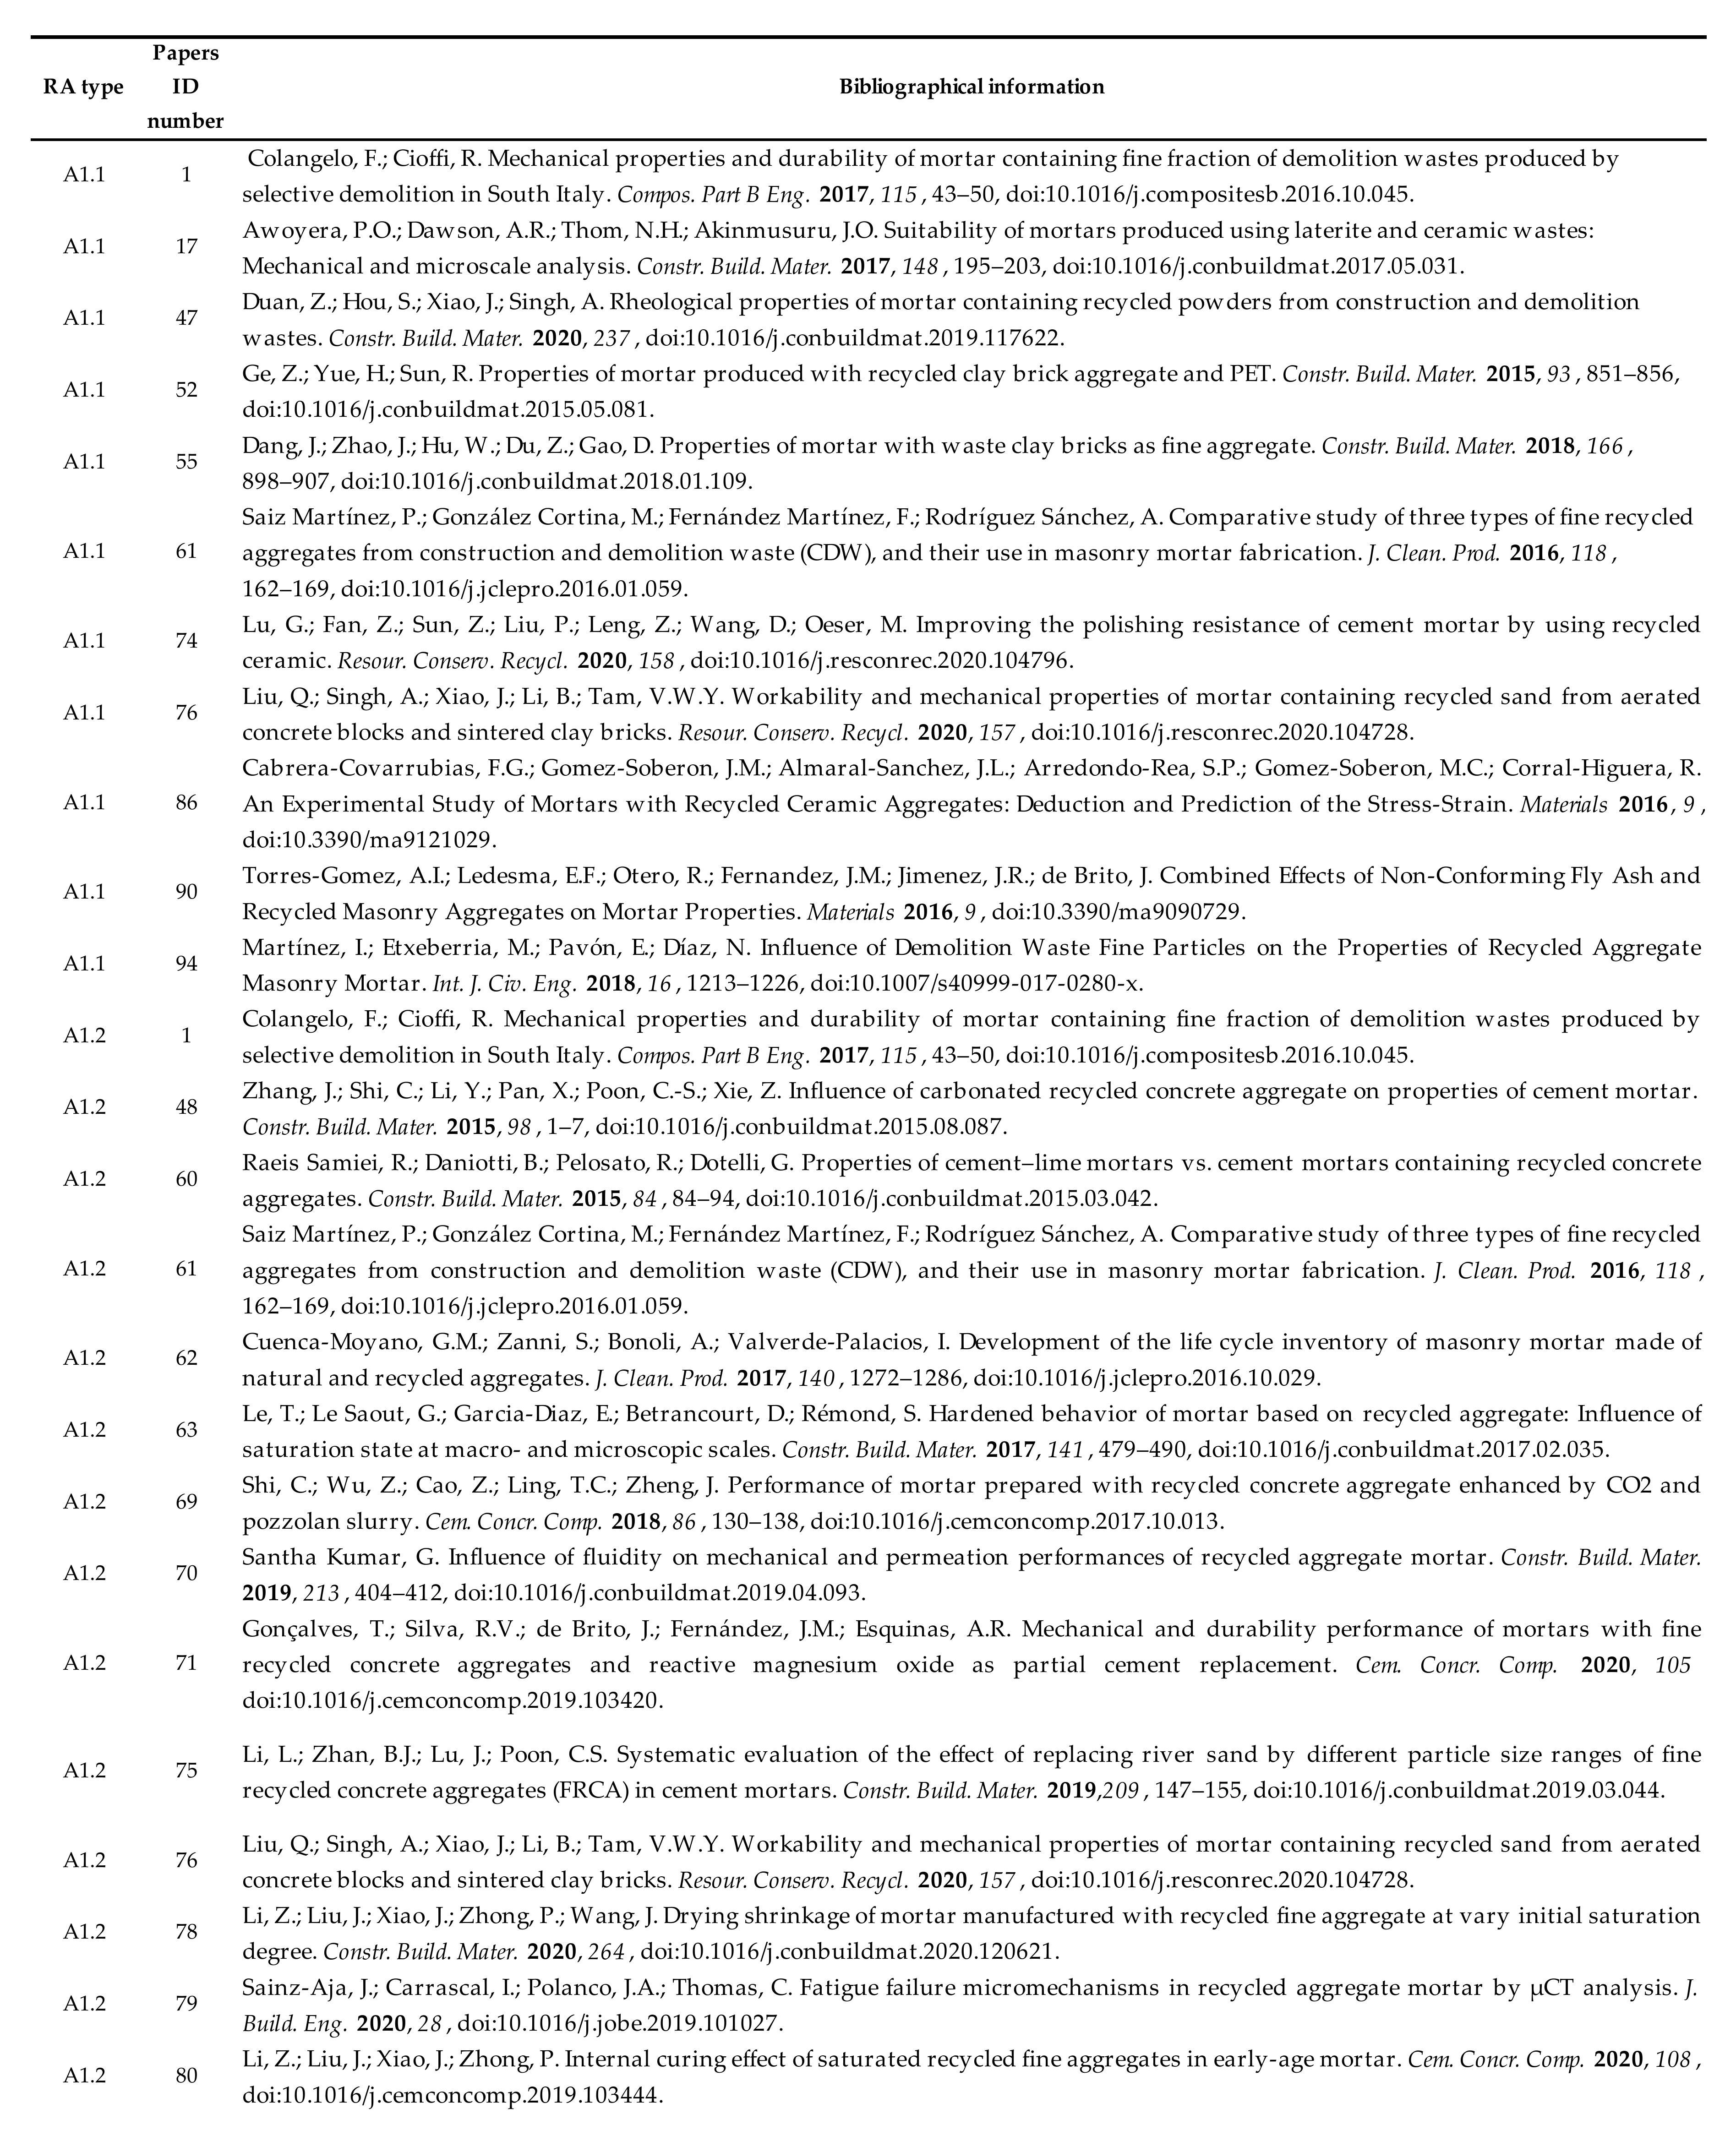
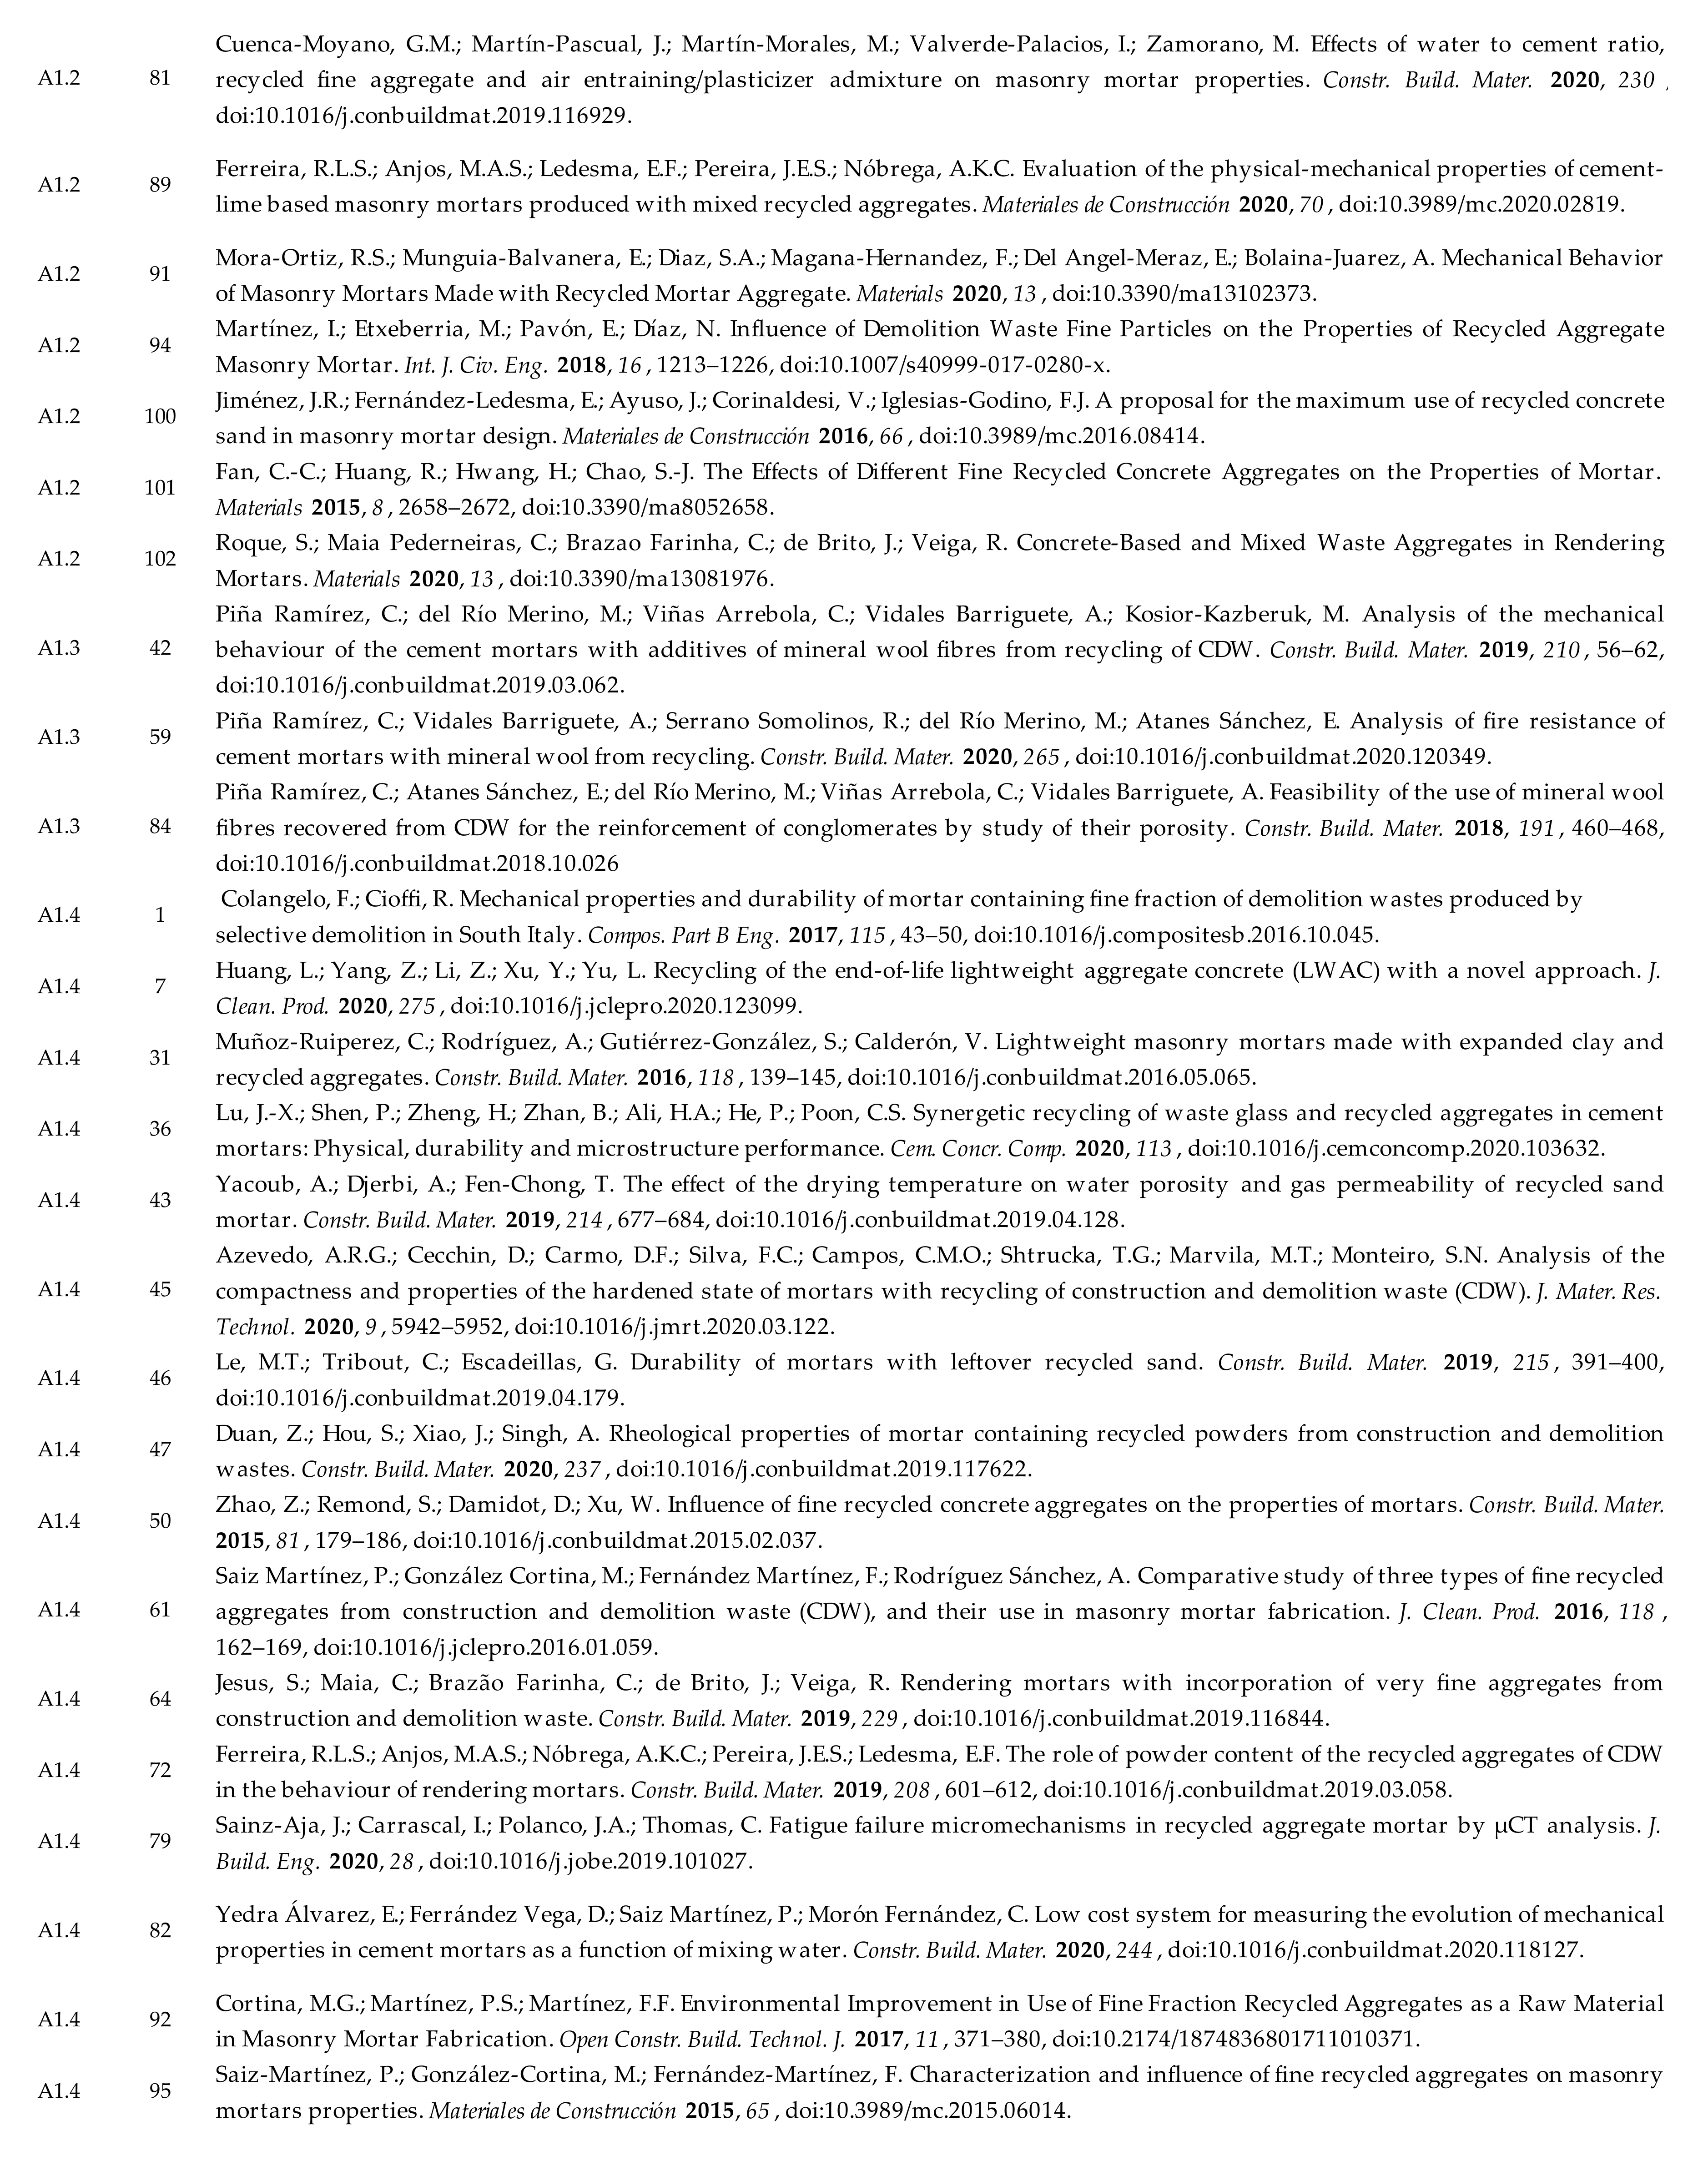
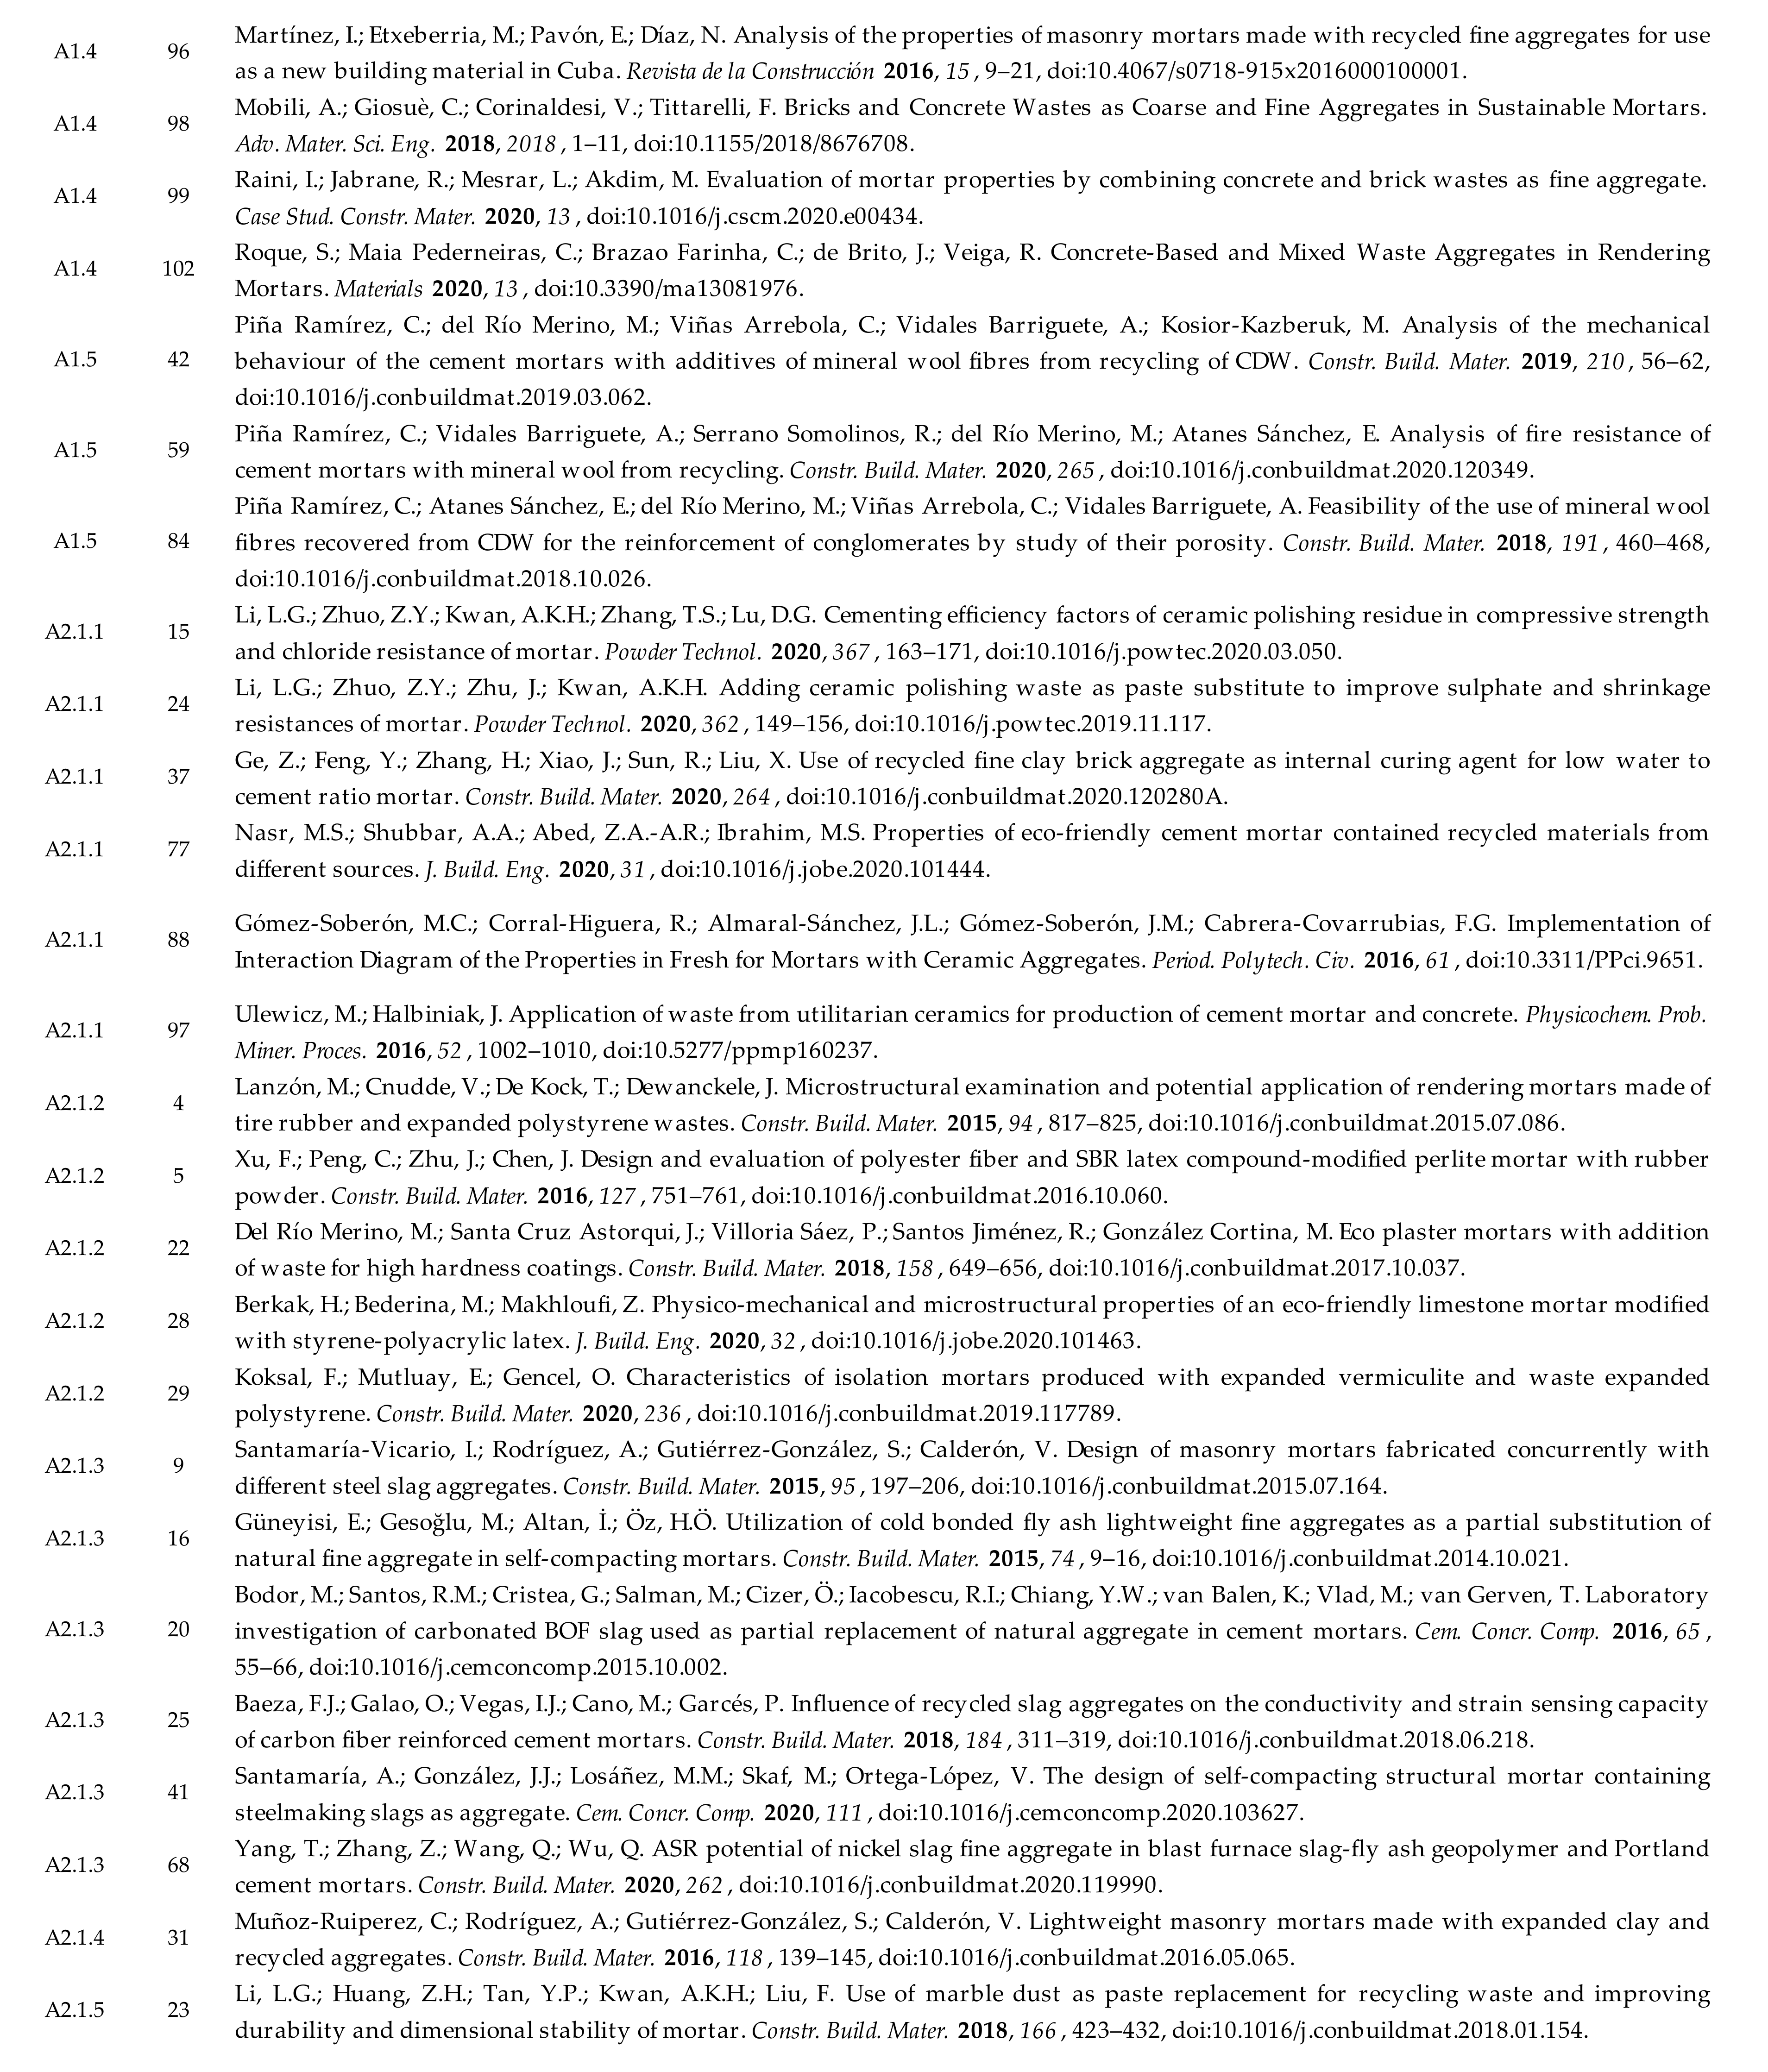
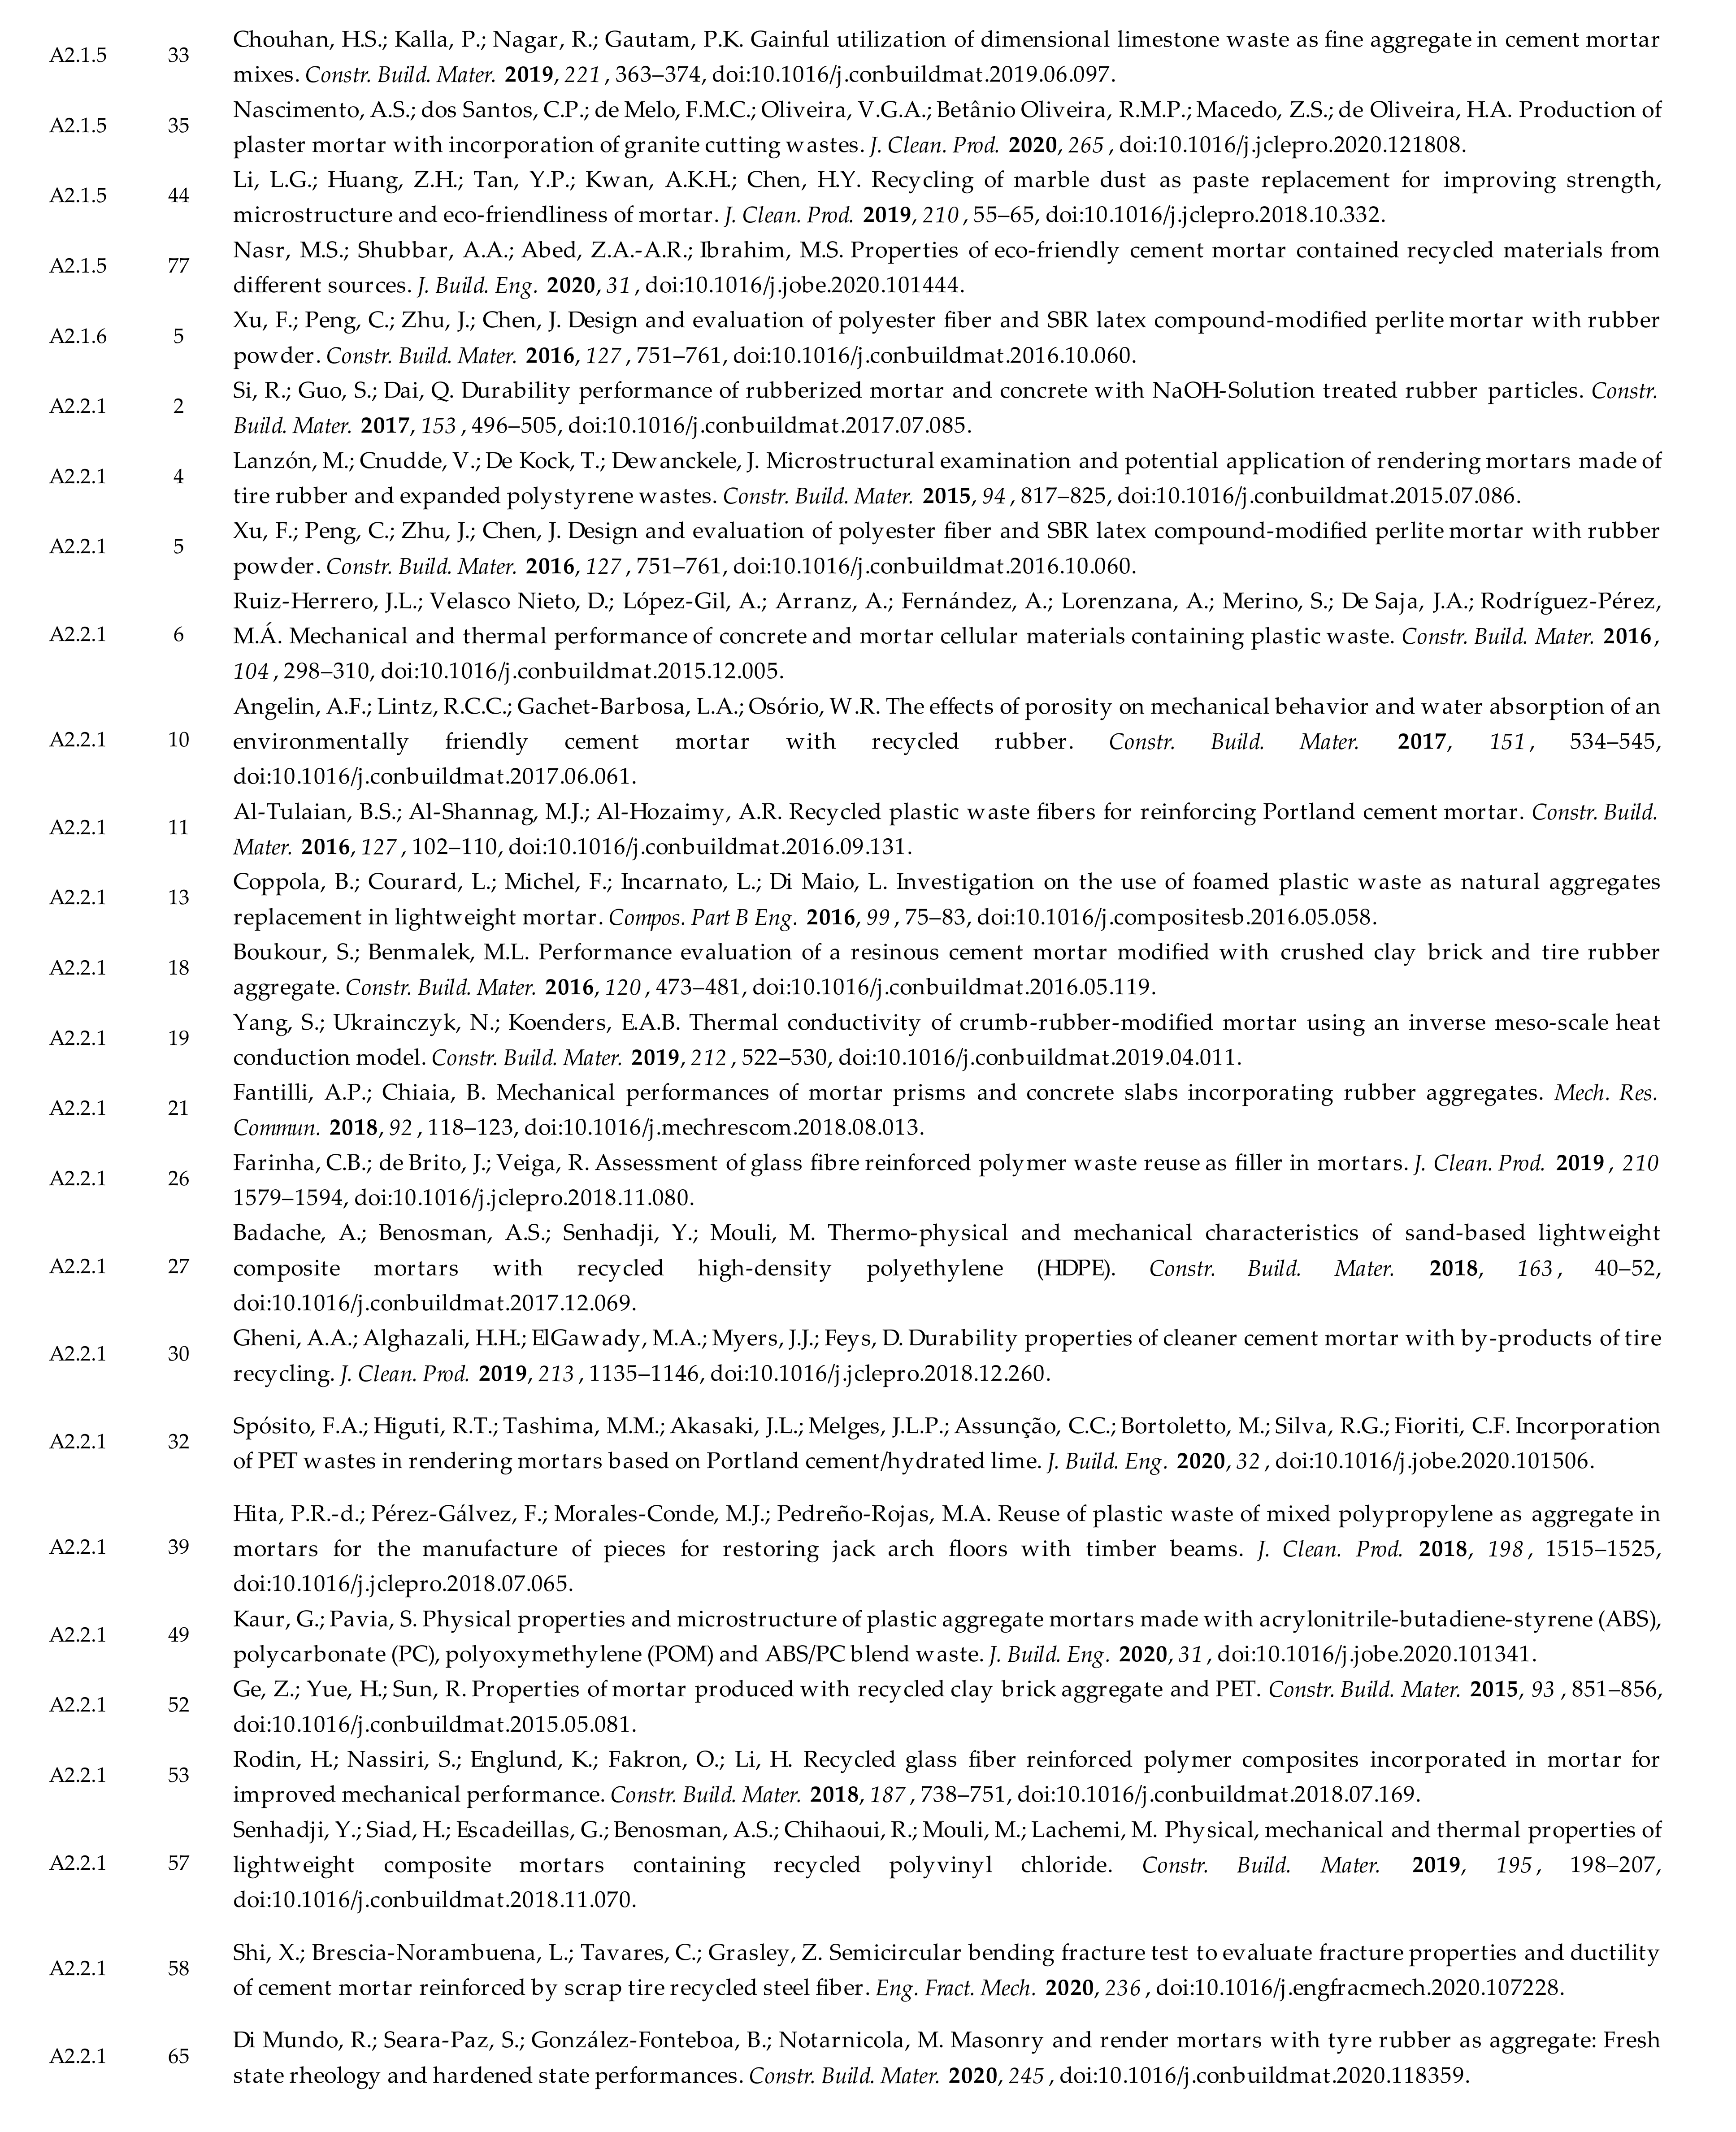
- A1: C&D,
- A2: factories and recycling centers.
- A2.1: building materials factories,
- A2.2: recycling centers.
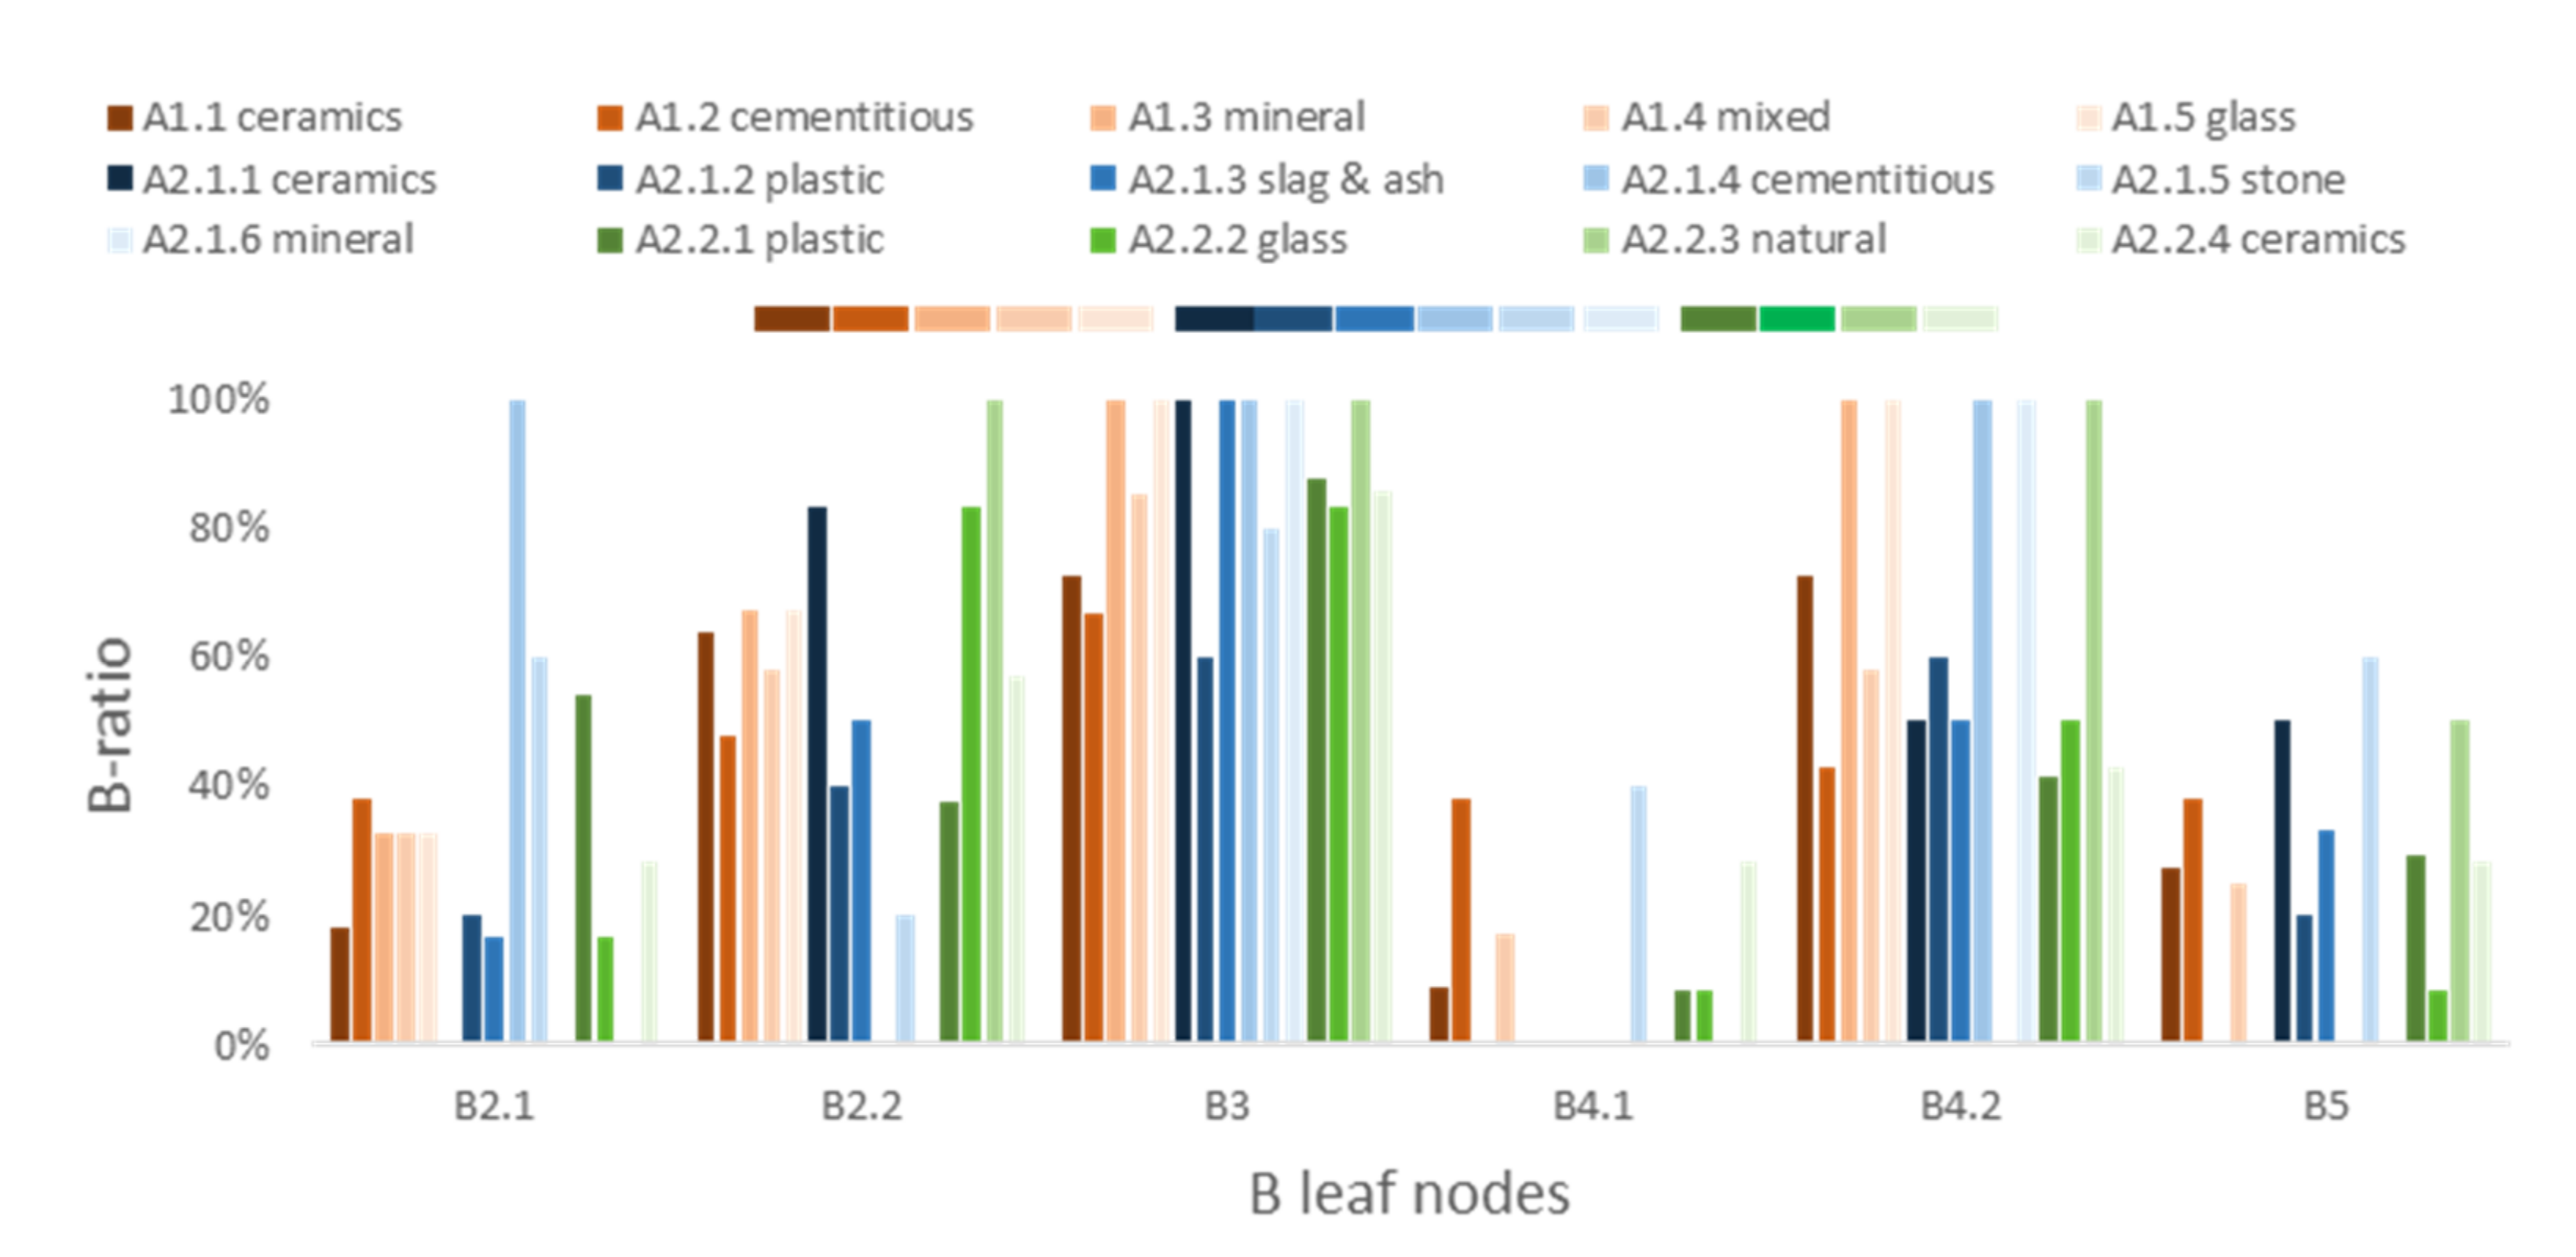
- B1: number of mixes,
- B2: recycled aggregates (RA) to natural aggregates (NA) ratio,
- B3: water to cement mass ratio,
- B4: aggregate to binder ratio,
- B5: superplasticizer or other additives.
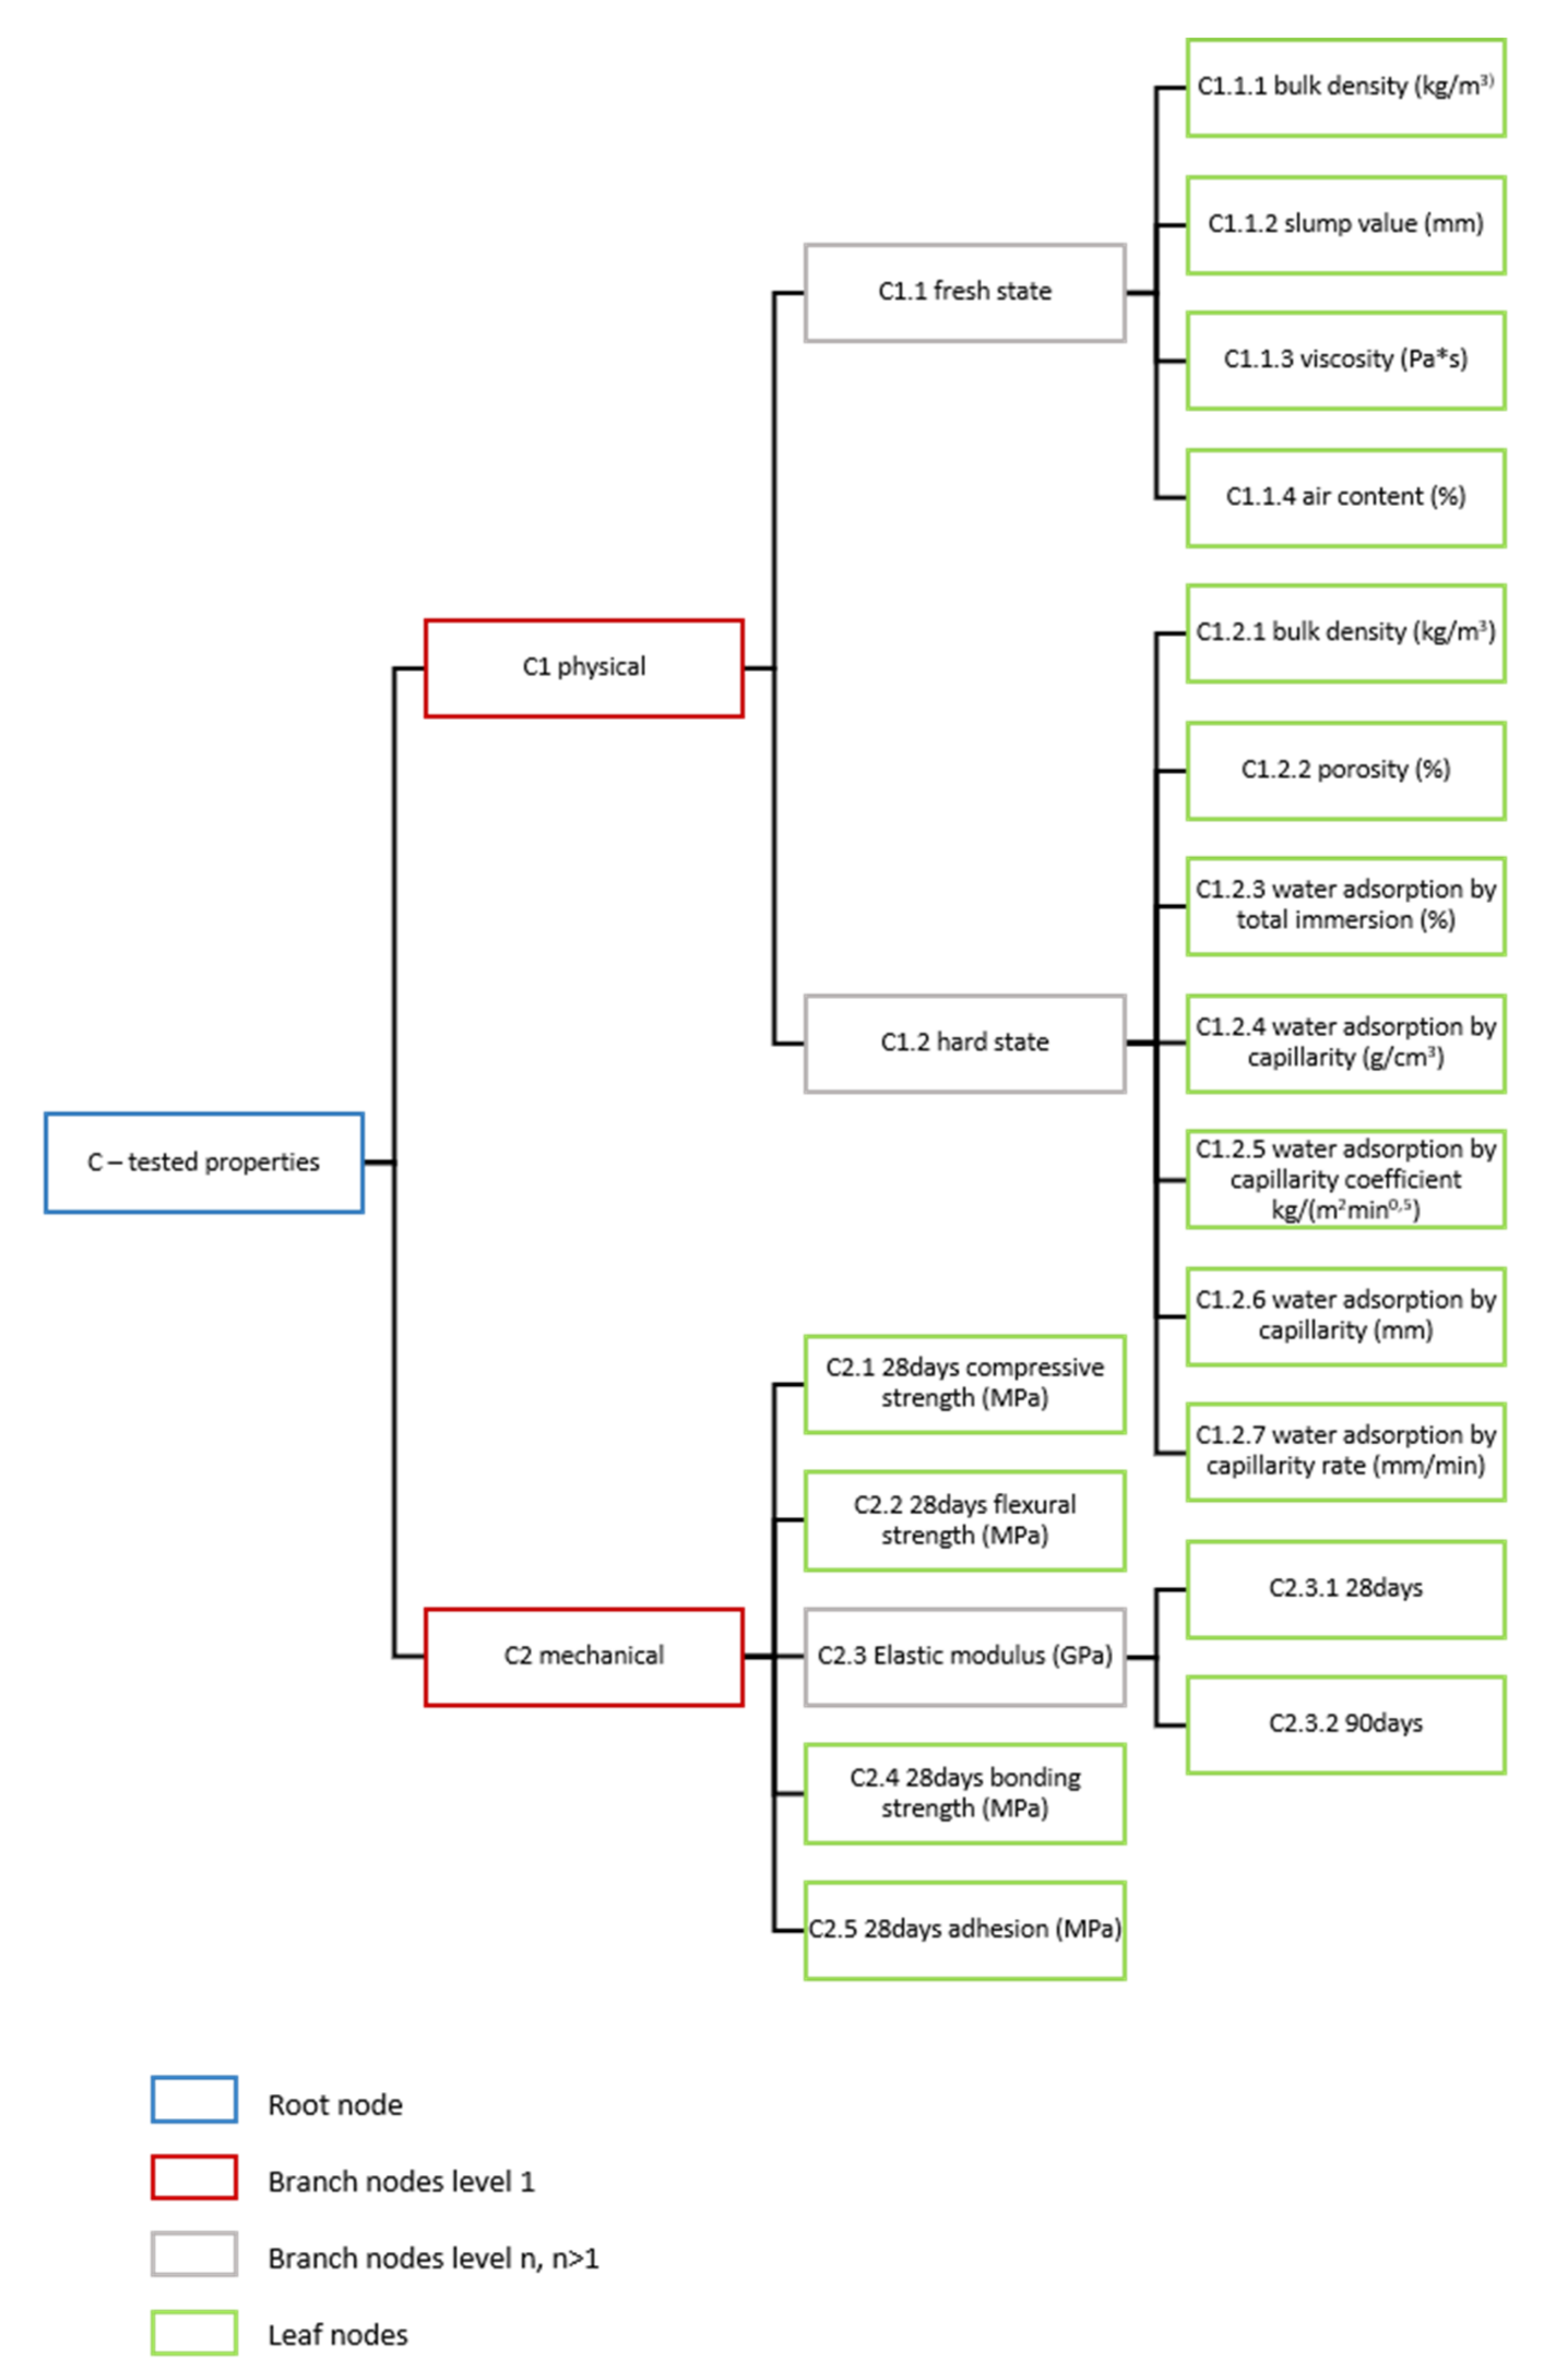
- C1: physical properties,
- C2: mechanical properties,
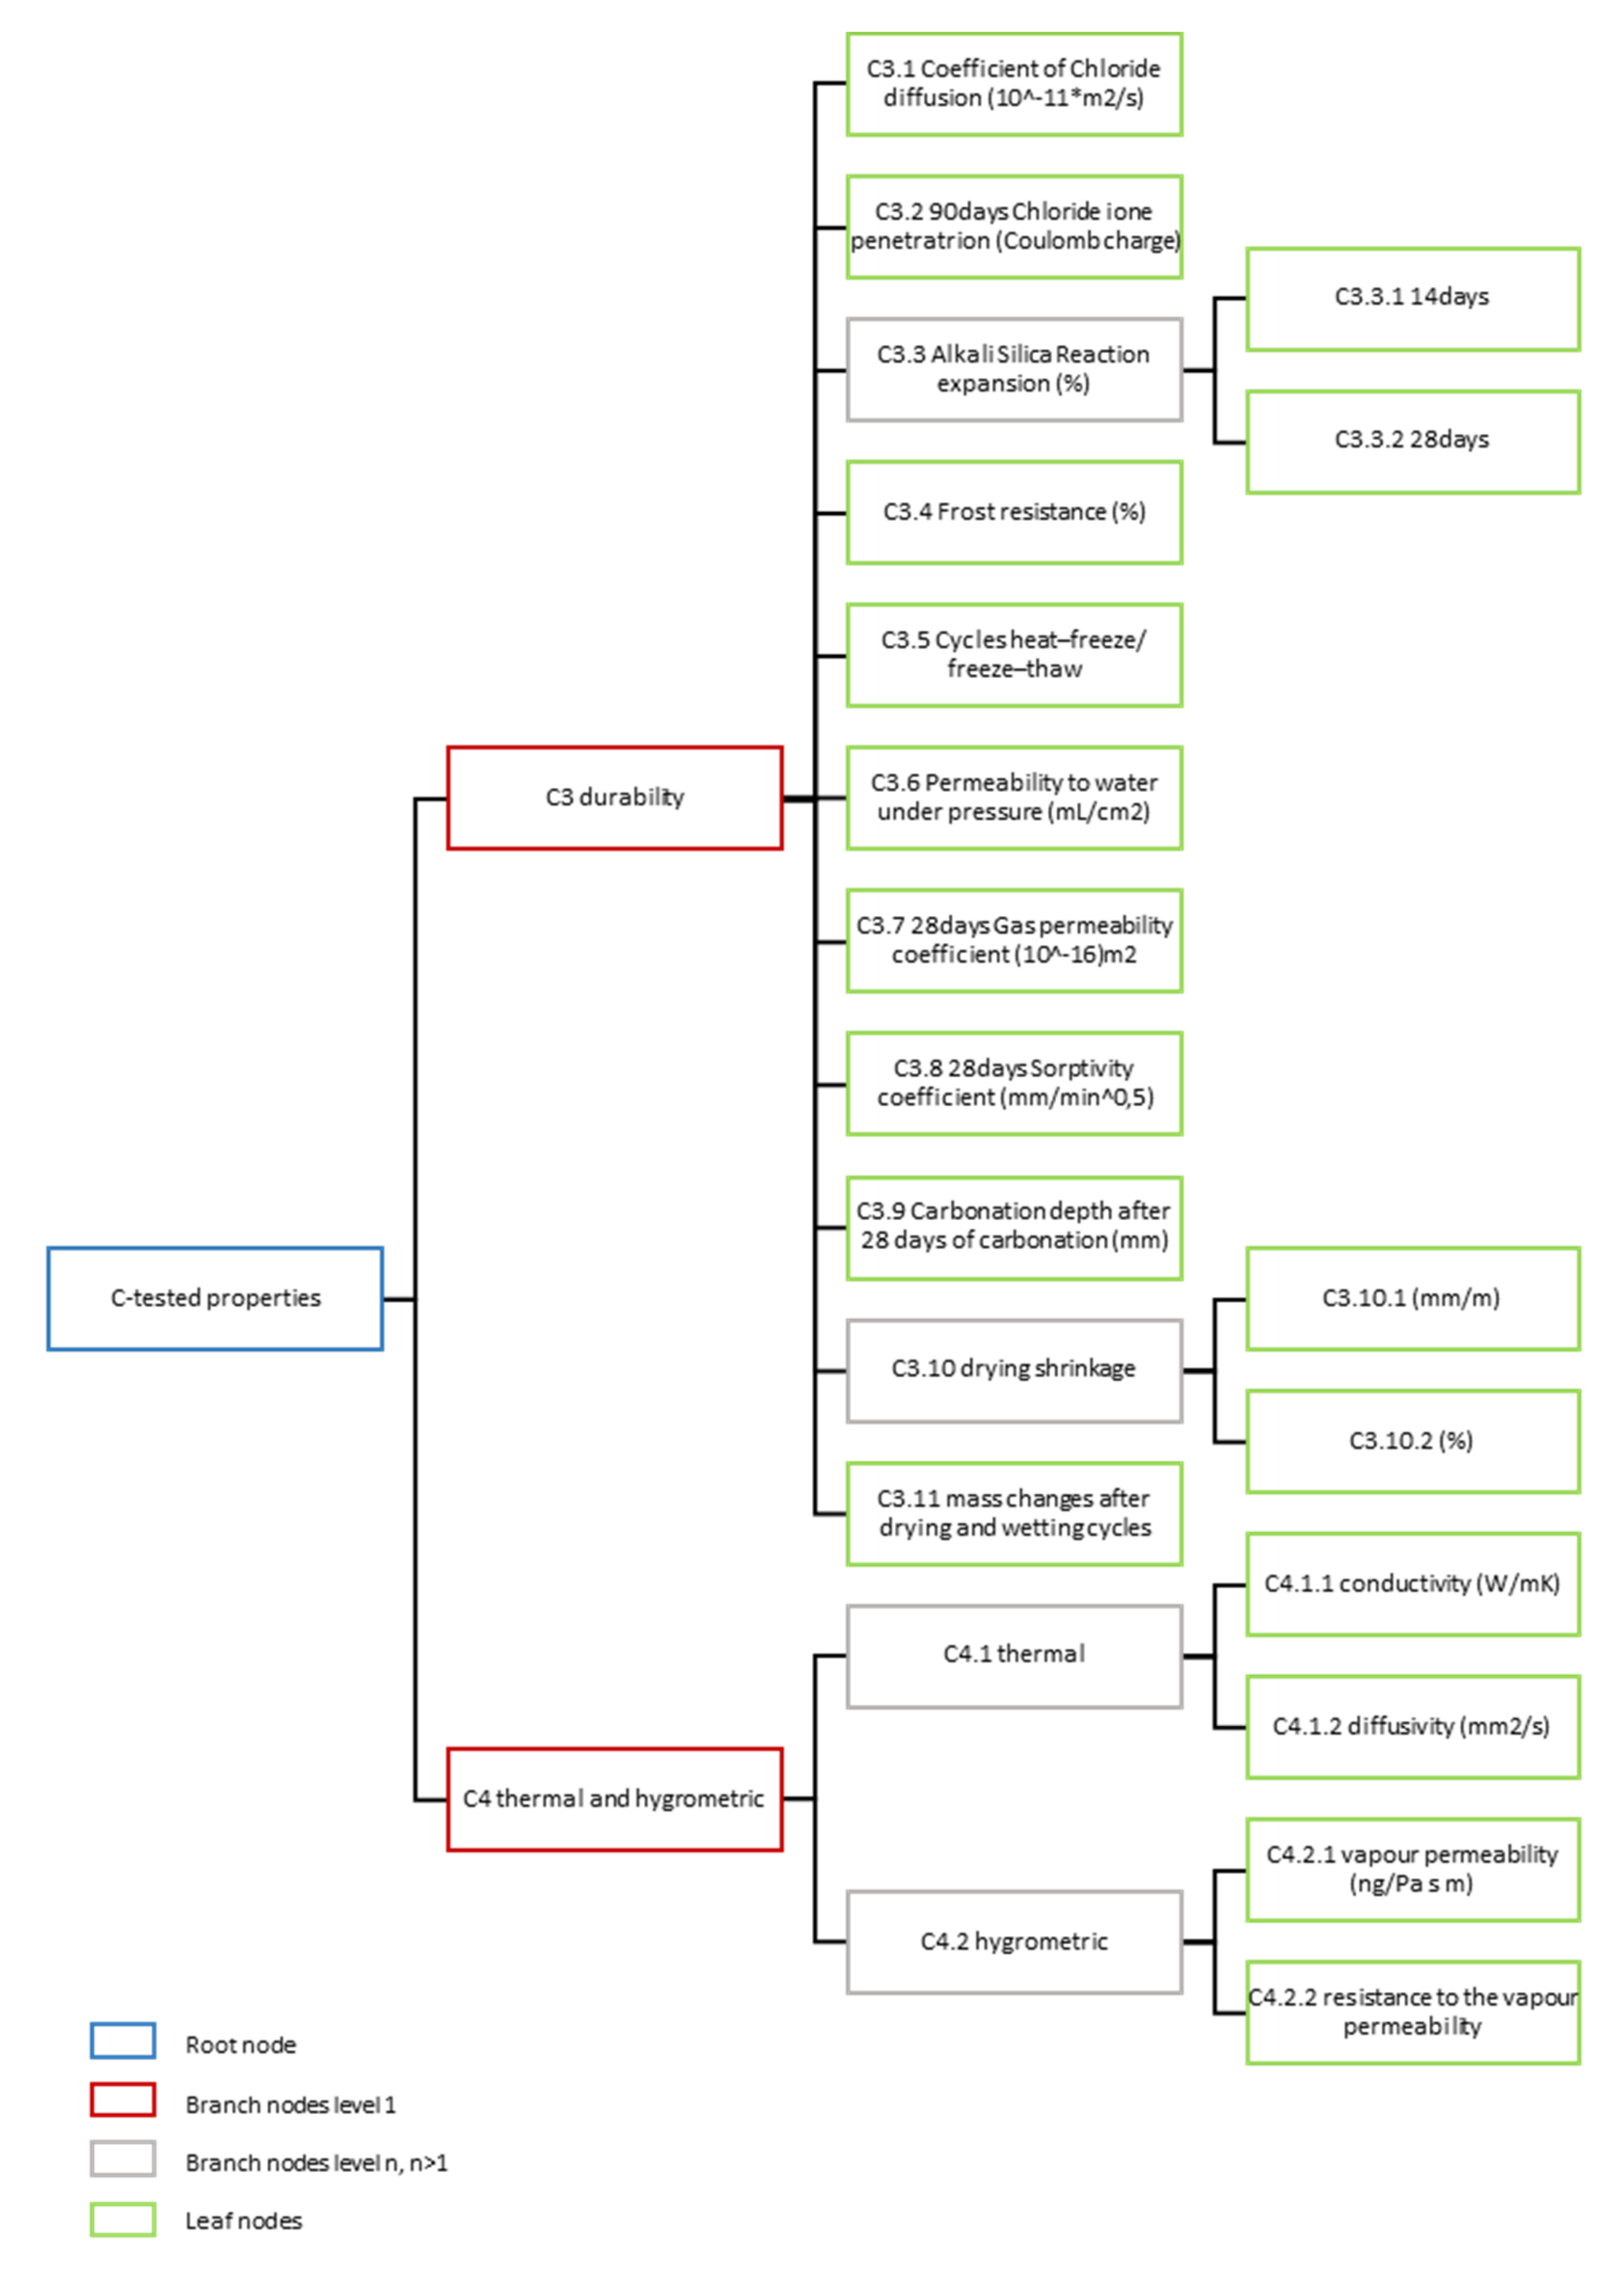
- C3: durability,
- C4: thermal and hygrometric properties,
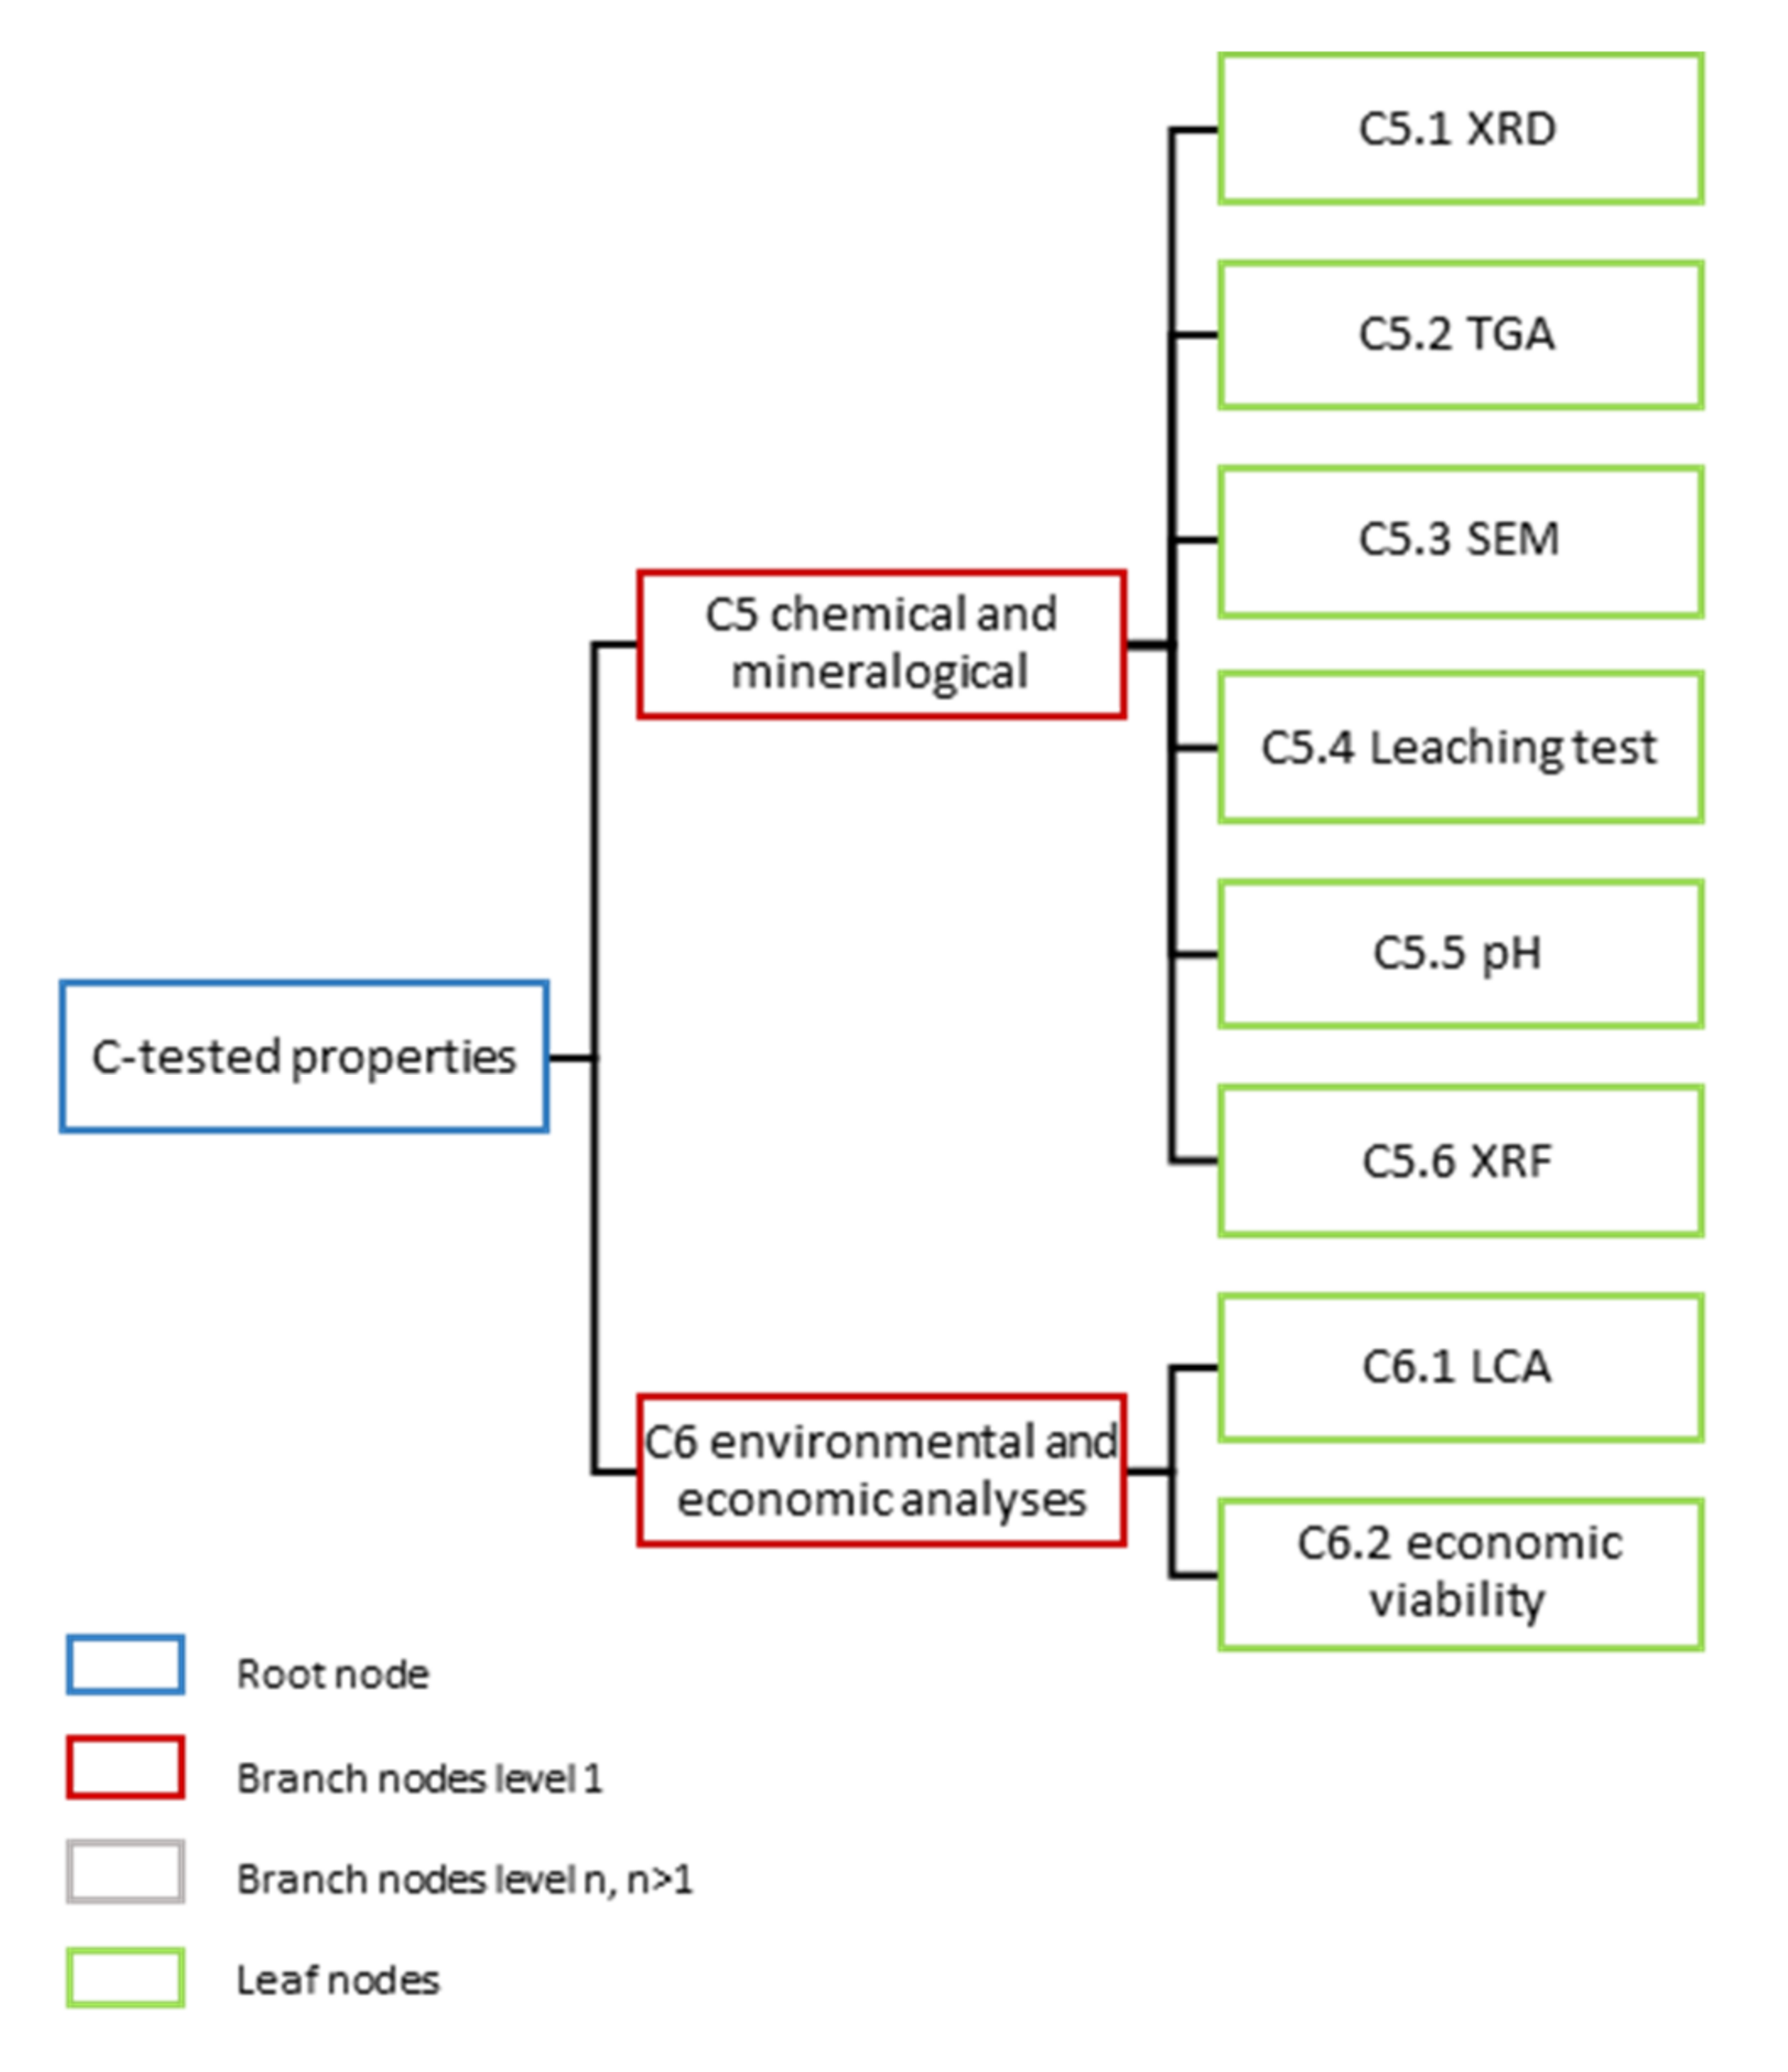
- C5: chemical and mineralogical properties,
- C6: sustainability issues including environmental and economic analyses.
- C1.1: fresh state properties,
- C1.1.1: bulk density,
- C1.1.2: slump value,
- C1.1.3: viscosity,
- C1.1.4: air content,
- C1.2: hard state properties,
- C1.2.1: bulk density,
- C1.2.2: porosity,
- C1.2.3: water adsorption by total immersion,
- C1.2.4: water adsorption by capillarity (g/cm3),
- C1.2.5: water adsorption by capillarity coefficient (kg/m2min0.5),
- C1.2.6: water adsorption by capillarity (mm),
- C1.2.7: water adsorption by capillarity rate (mm/min),
- C2.1: 28-day compressive strength,
- C2.2: 28-day flexural strength,
- C2.3: elastic modulus,
- C2.3.1: 28-day elastic modulus,
- C2.3.2: 90-day elastic modulus,
- C2.4: 28-day bonding strength,
- C2.5: 28-day adhesion,
- C3.1: coefficient of Chloride diffusion,
- C3.2: 90-day chloride ion penetration,
- C3.3: alkali silica reaction expansion,
- C3.3.1: 14-day alkali silica reaction expansion,
- C3.3.2: 28-day alkali silica reaction expansion,
- C3.4: frost resistance,
- C3.5: accelerated ageing test with heat–freeze/freeze–thaw cycles,
- C3.6: permeability to water under pressure,
- C3.7: 28-day gas permeability coefficient,
- C3.8: 28-day sorptivity coefficient,
- C3.9: carbonation depth after 28-day of carbonation,
- C3.10: drying shrinkage,
- C3.10.1: 28-day drying shrinkage (mm),
- C3.10.2: 28-day drying shrinkage (%),
- C3.11: mass changes after drying and wetting cycles,
- C4.1: thermal properties,
- C4.1.1: thermal conductivity,
- C4.1.2: thermal diffusivity,
- C4.2: hygrometric properties,
- C4.2.1: vapor permeability,
- C4.2.2: resistance to vapor permeability,
- C5.1: X-Ray Diffraction (XRD),
- C5.2: Thermo Gravimetric Analysis (TGA),
- C5.3: Scanning Electronic Microscope (SEM),
- C5.4: Leaching test,
- C5.5: measure of acidity with pH test,
- C5.6: X-Ray Fluorescence spectroscopy (XRF),
- C6.1: Life Cycle Analysis (LCA),
- C6.2: economic viability.
2.4. Summarizing
- j = 1, 2, 3, 4, 5, if i = 1
- j = 1, 2 and k = 1, 2, 3, 4, 5, 6, if i = 2
3. Results
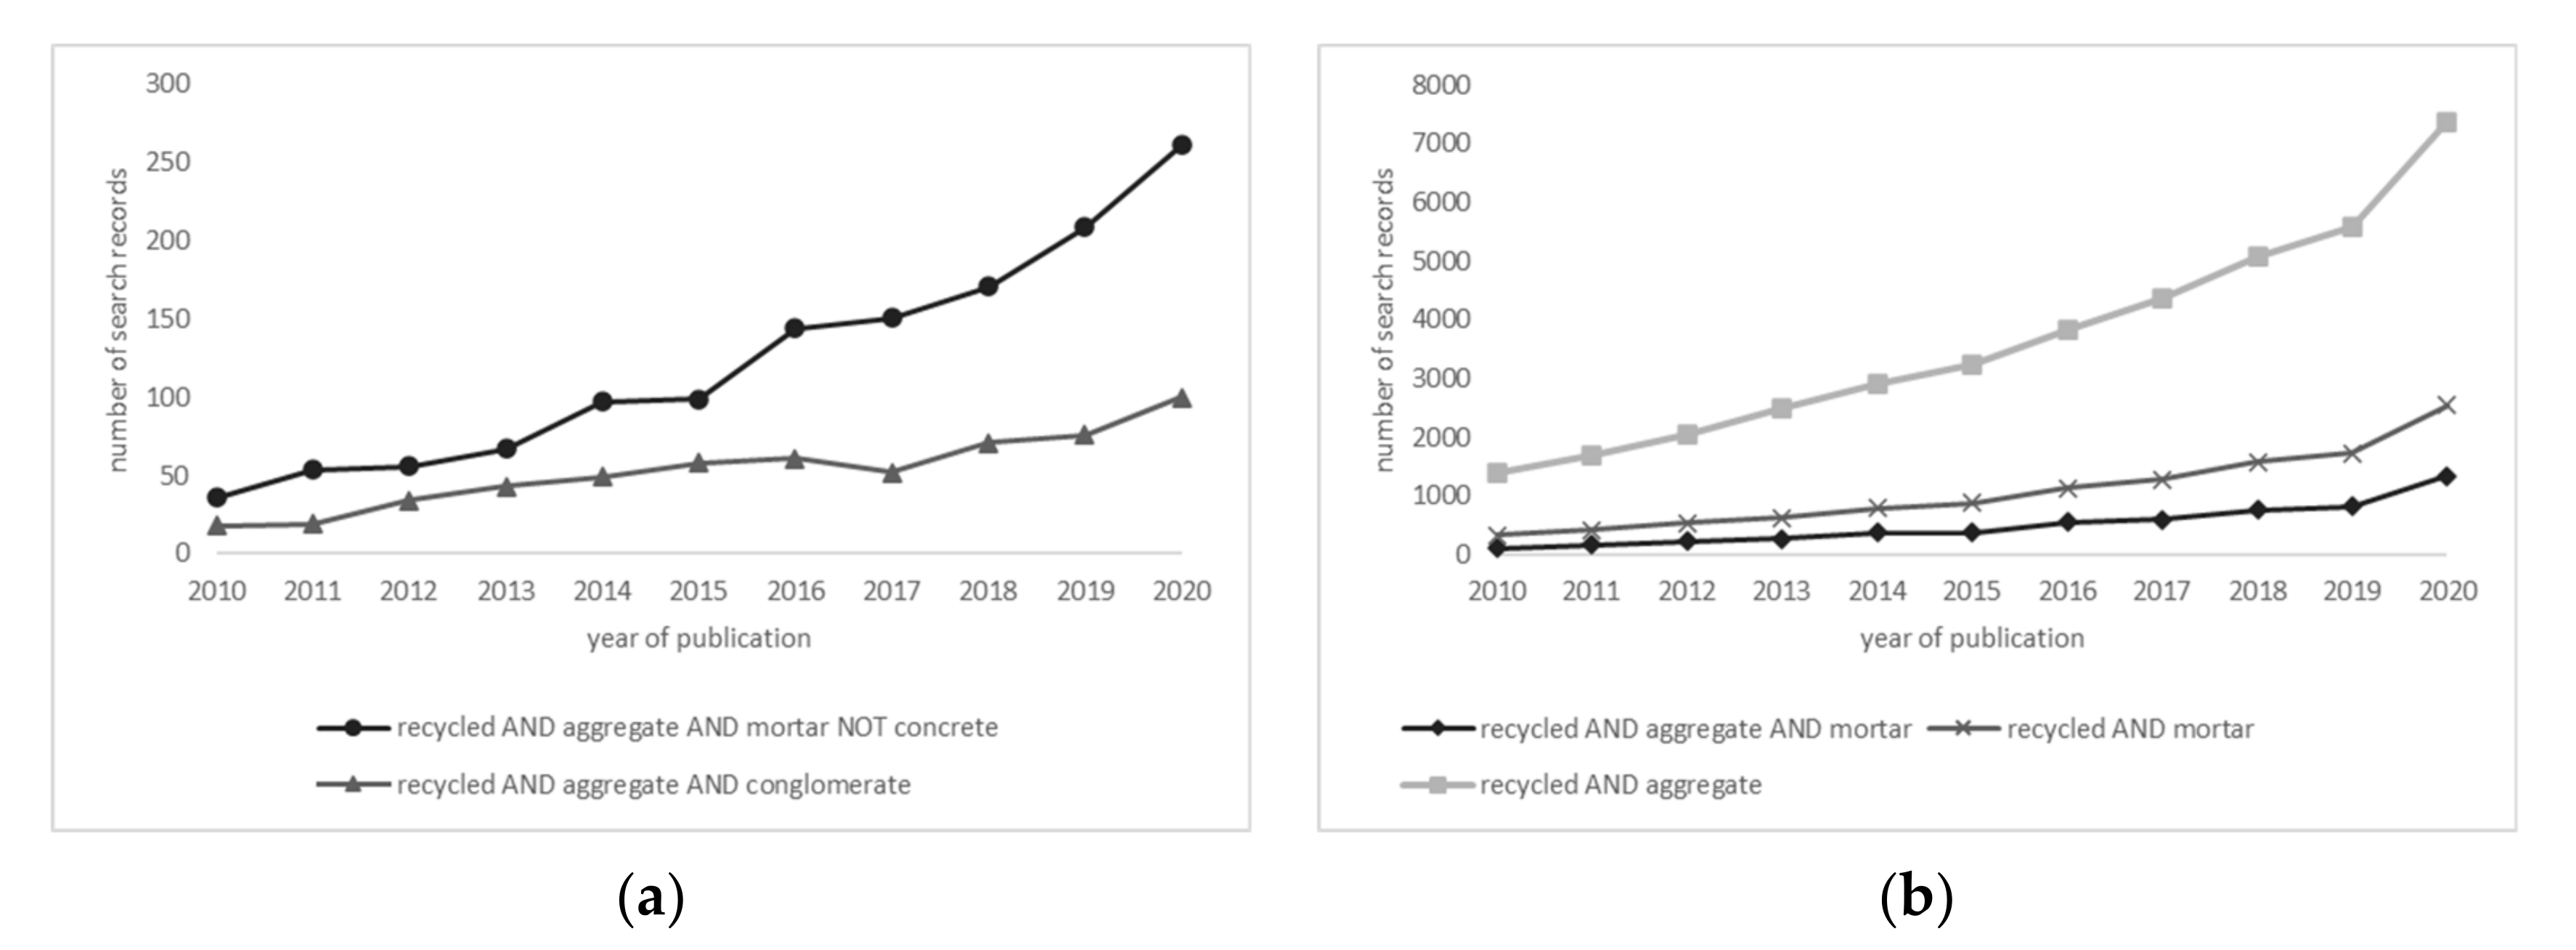
3.1. Searching
3.2. Screening
- recycled AND aggregate AND mortar AND TITLE mortar: 543 records,
- recycled AND aggregate AND rendering AND TITLE rendering: 10 records,
- recycled AND aggregate AND conglomerate: 418 records,
- recycled AND aggregate AND mortar AND TITLE mortar: 93 records,
- recycled AND aggregate AND rendering AND TITLE rendering: 3 records,
- recycled AND aggregate AND conglomerate: 8 records.
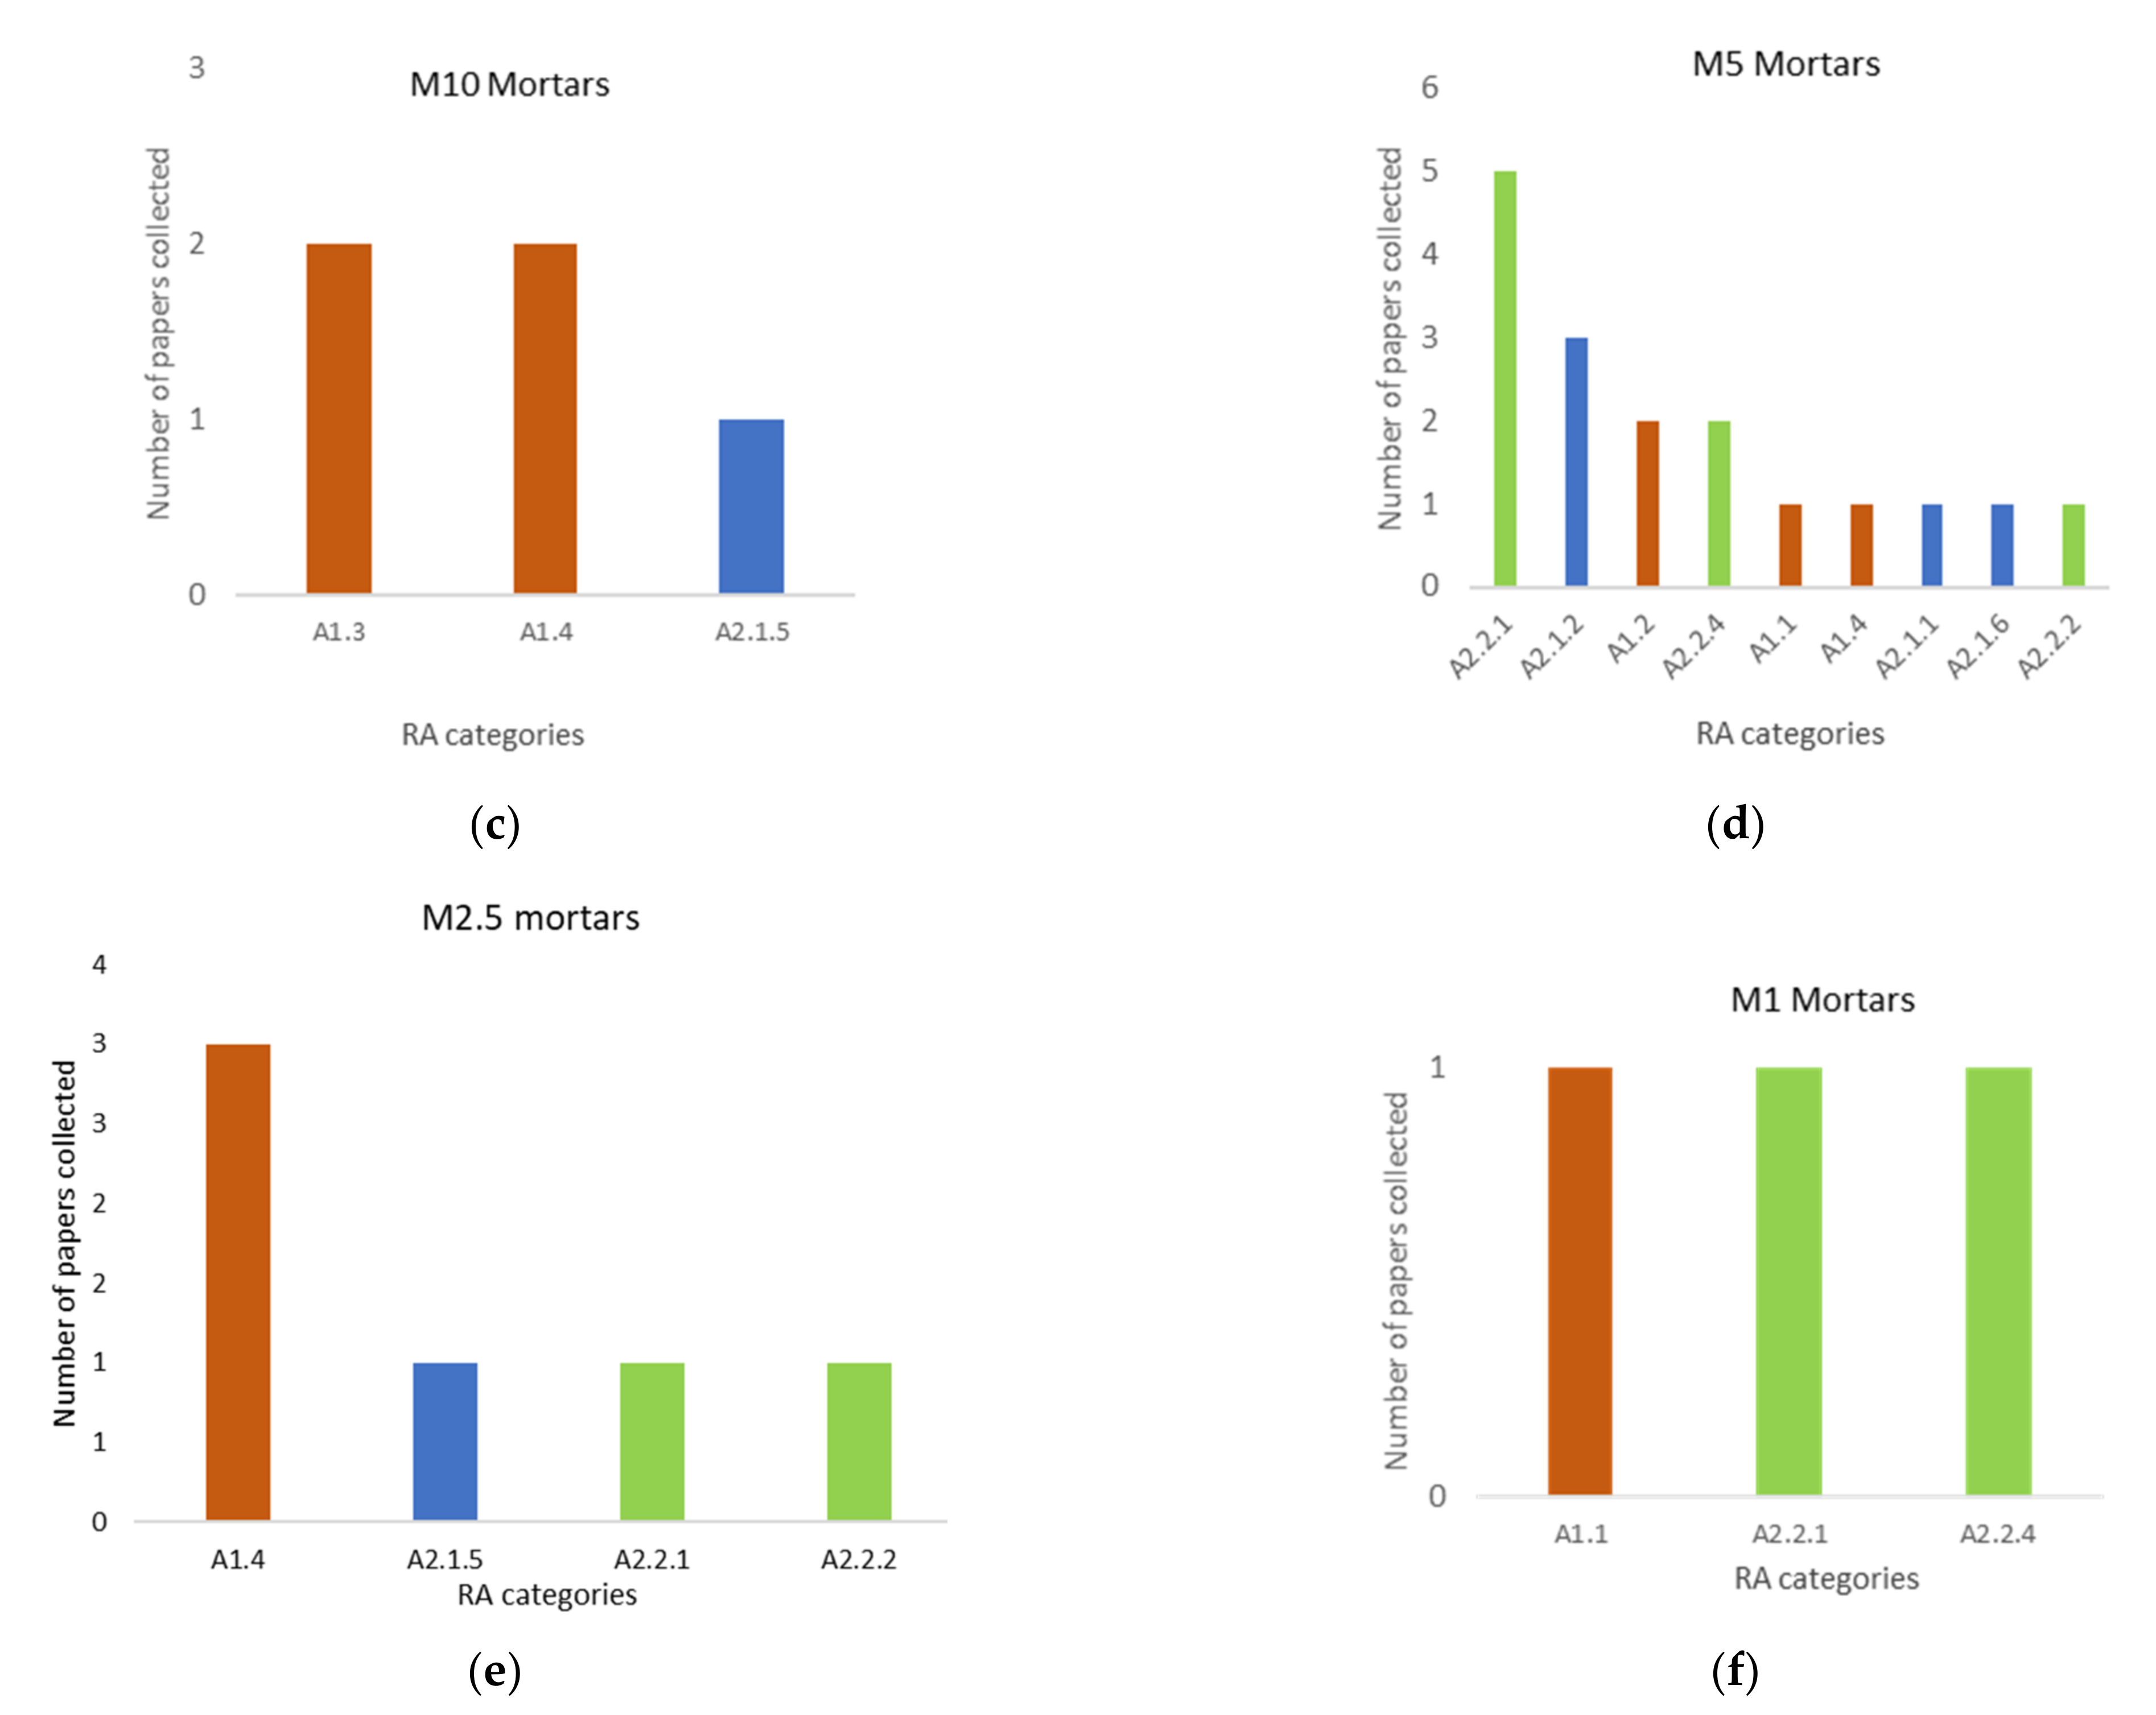
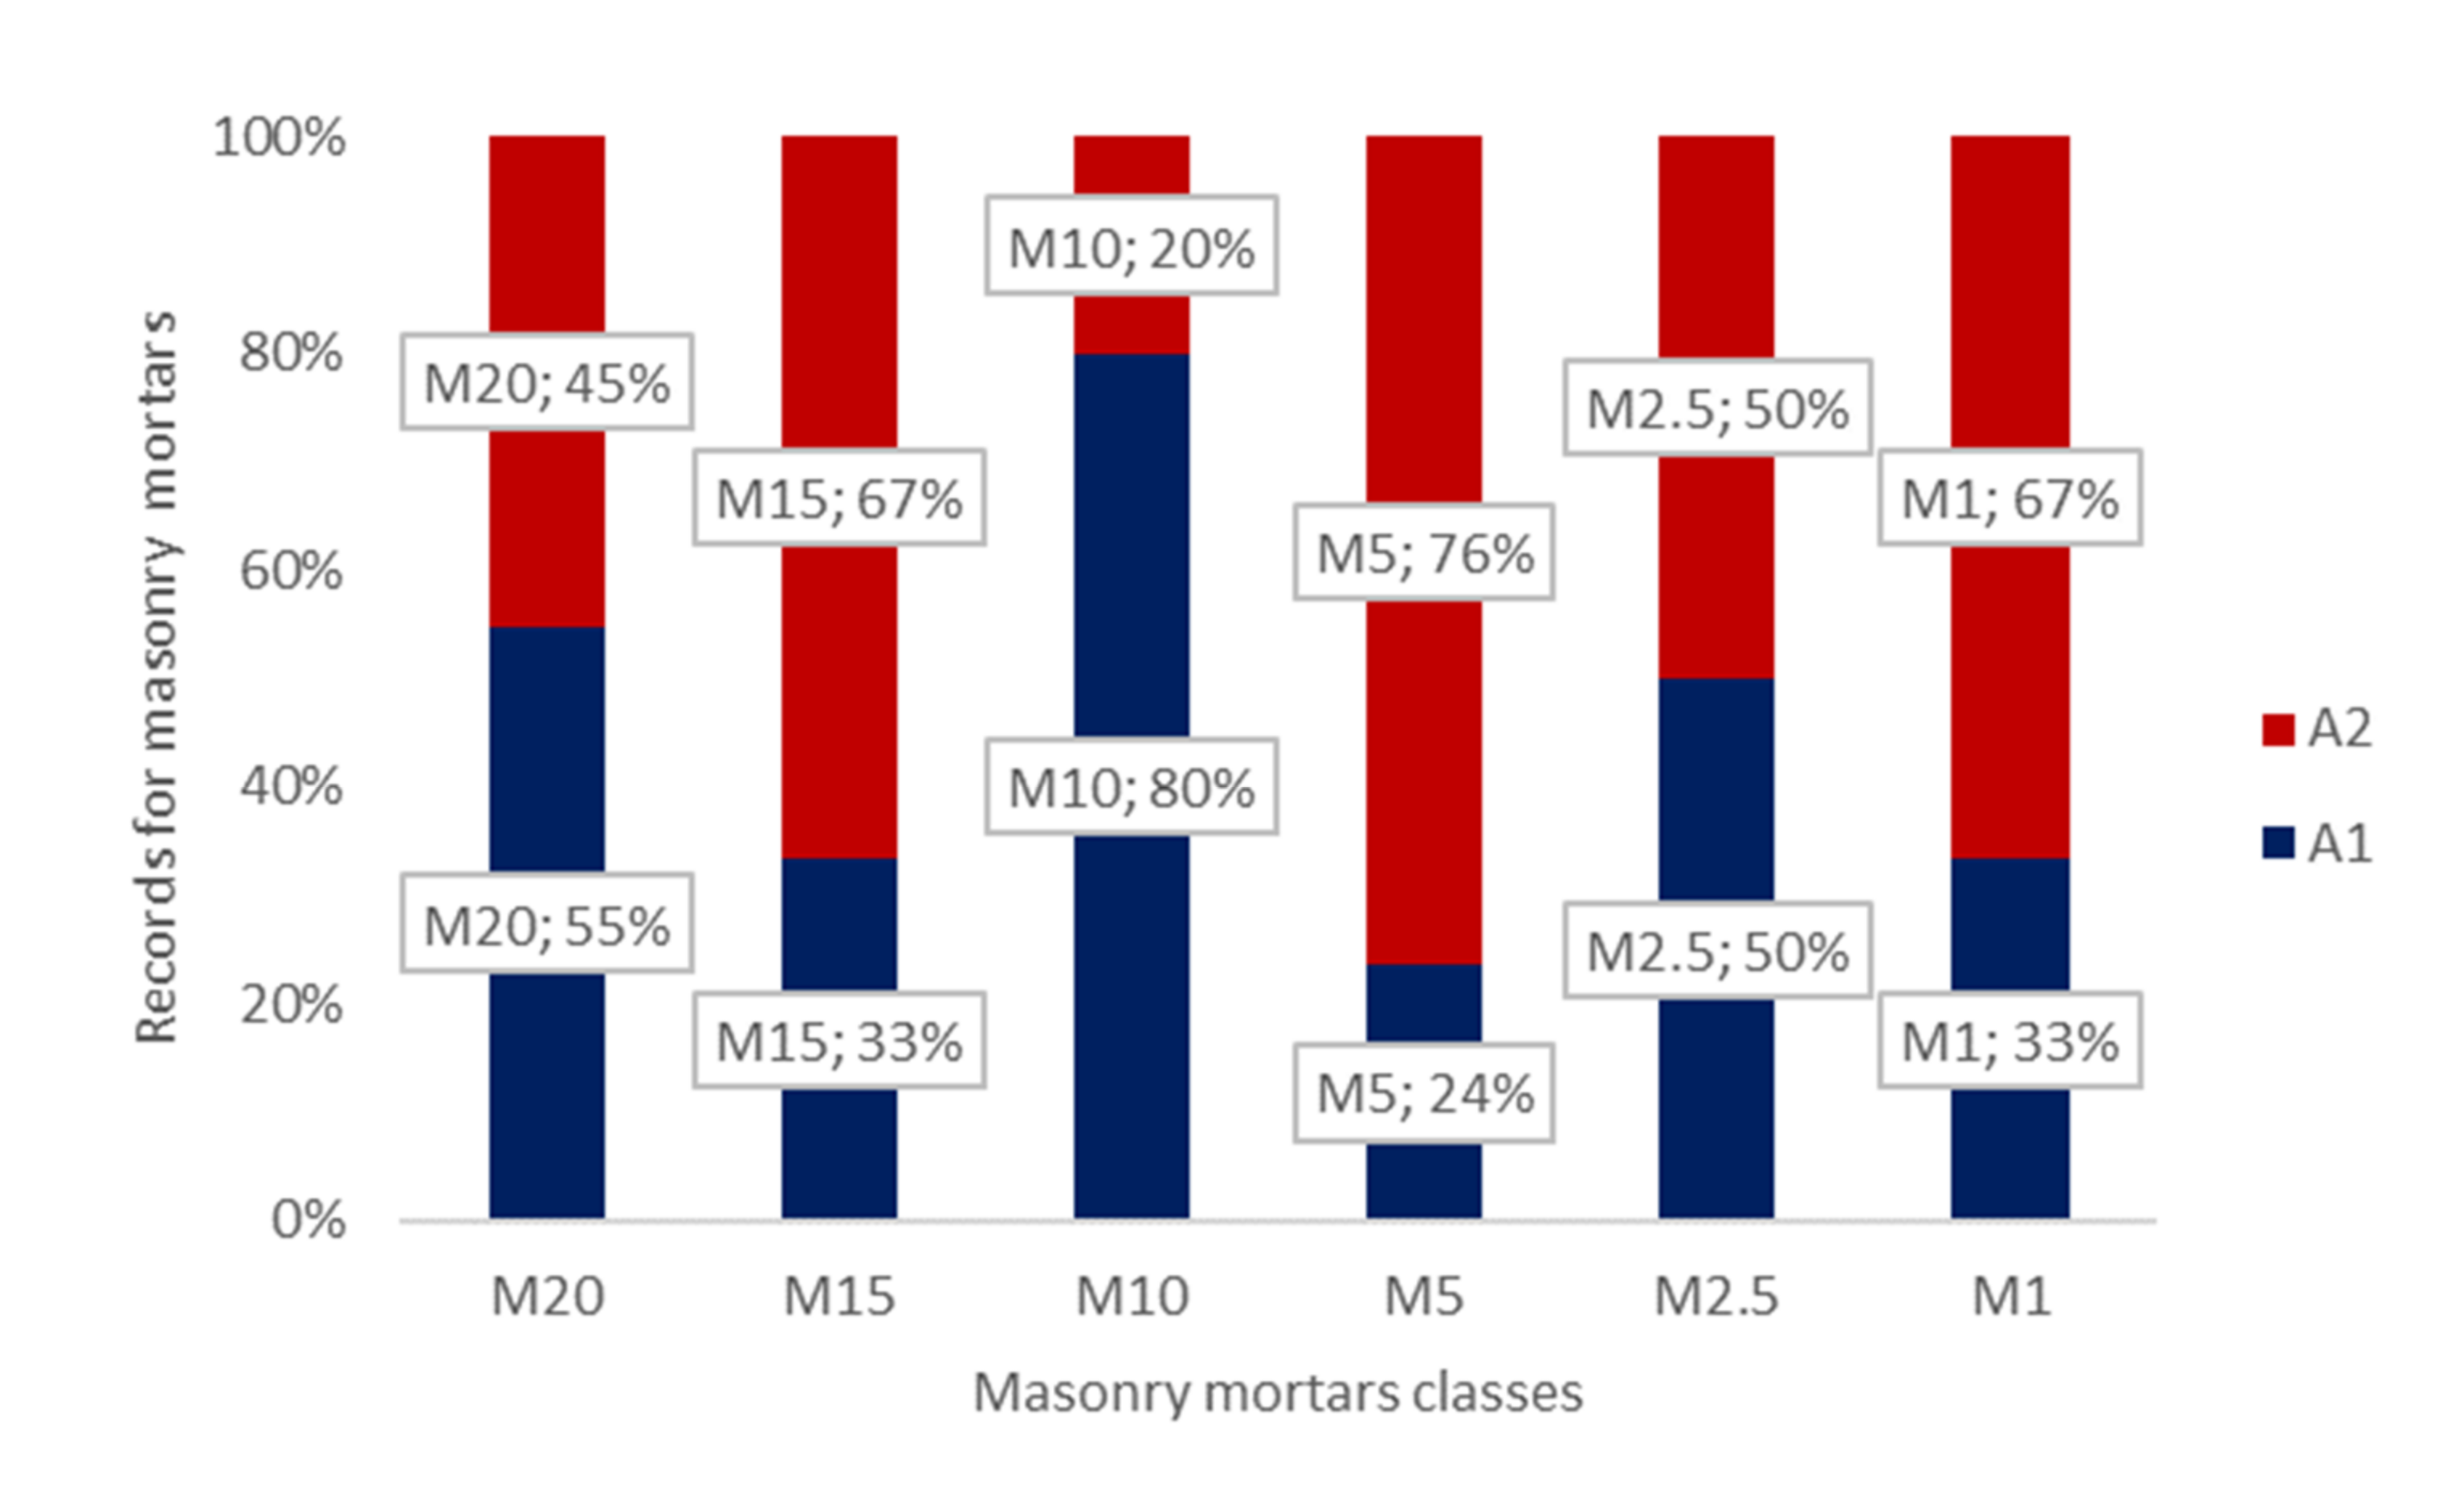
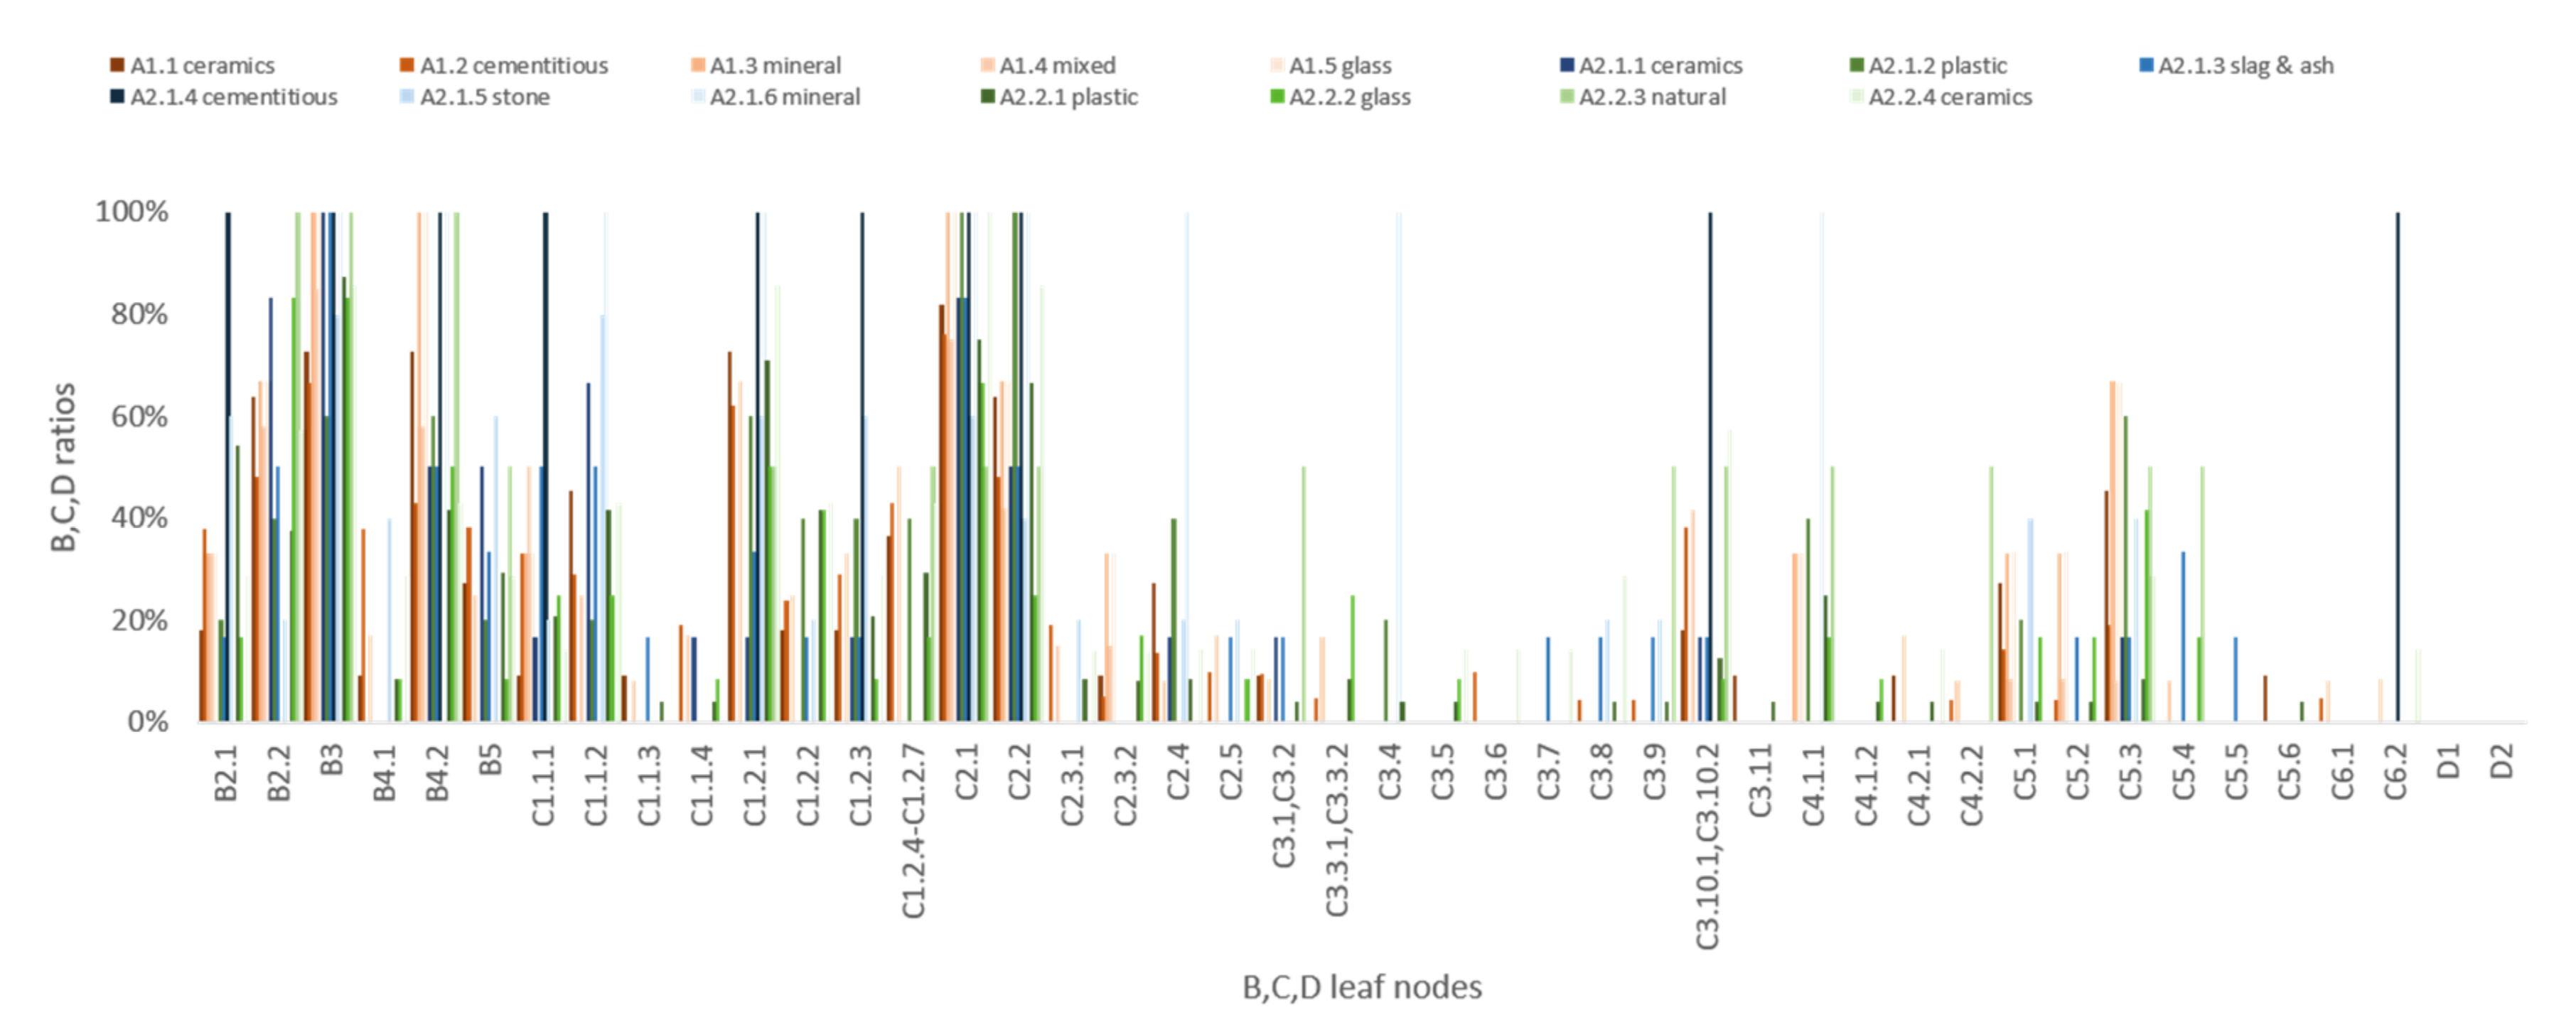
3.3. Summarizing
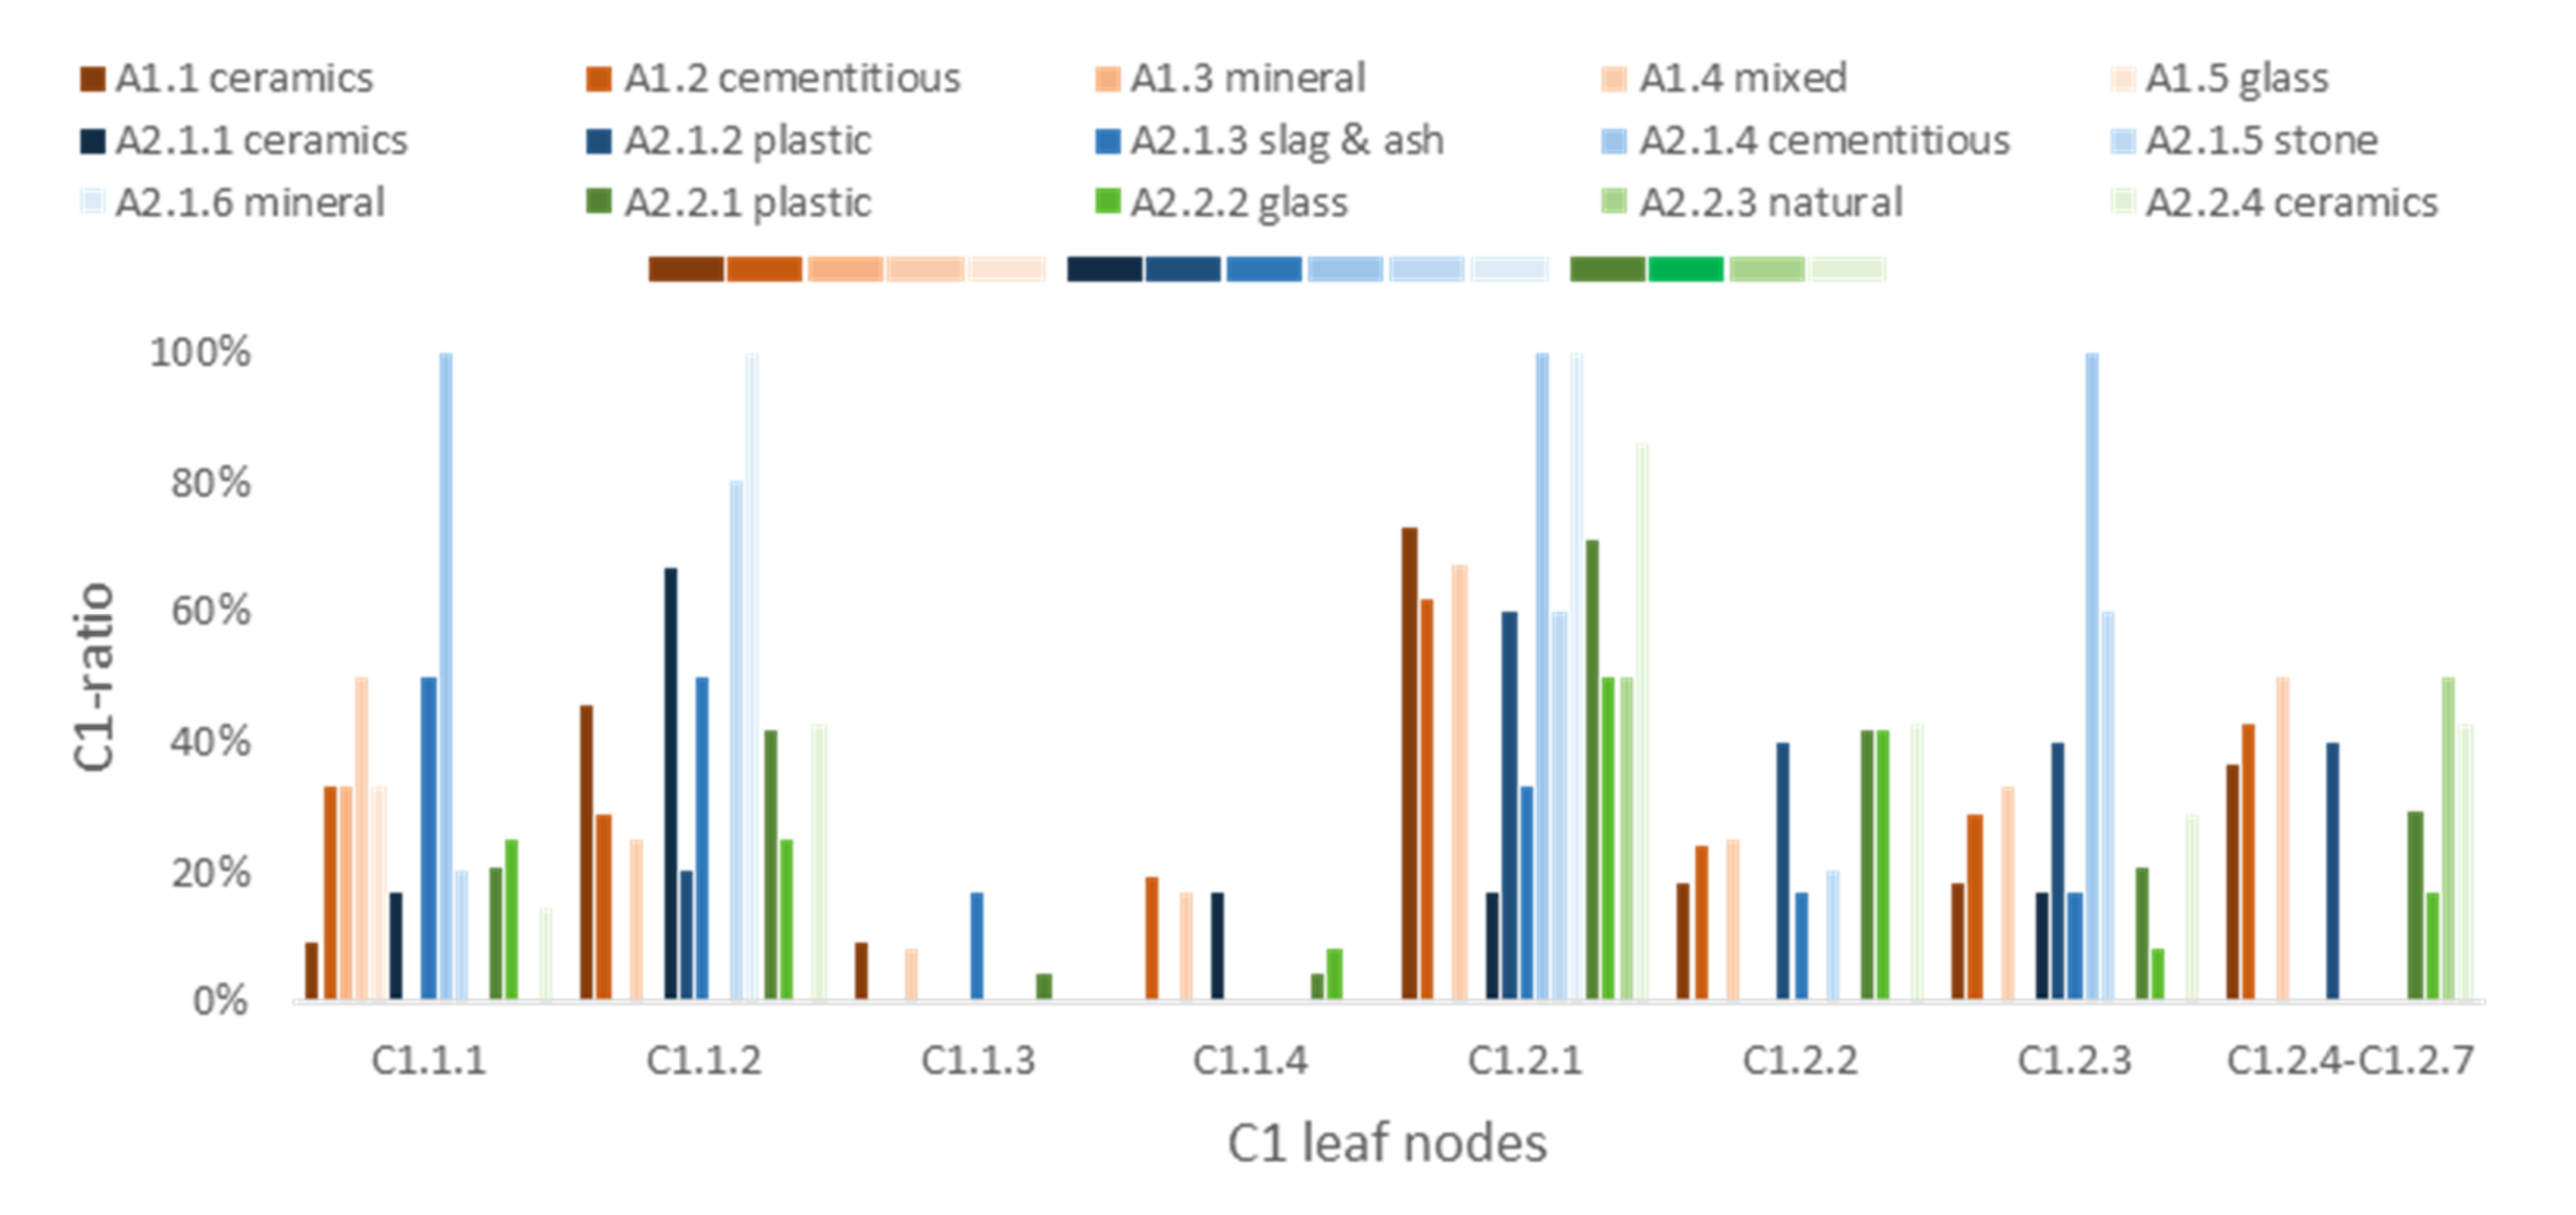
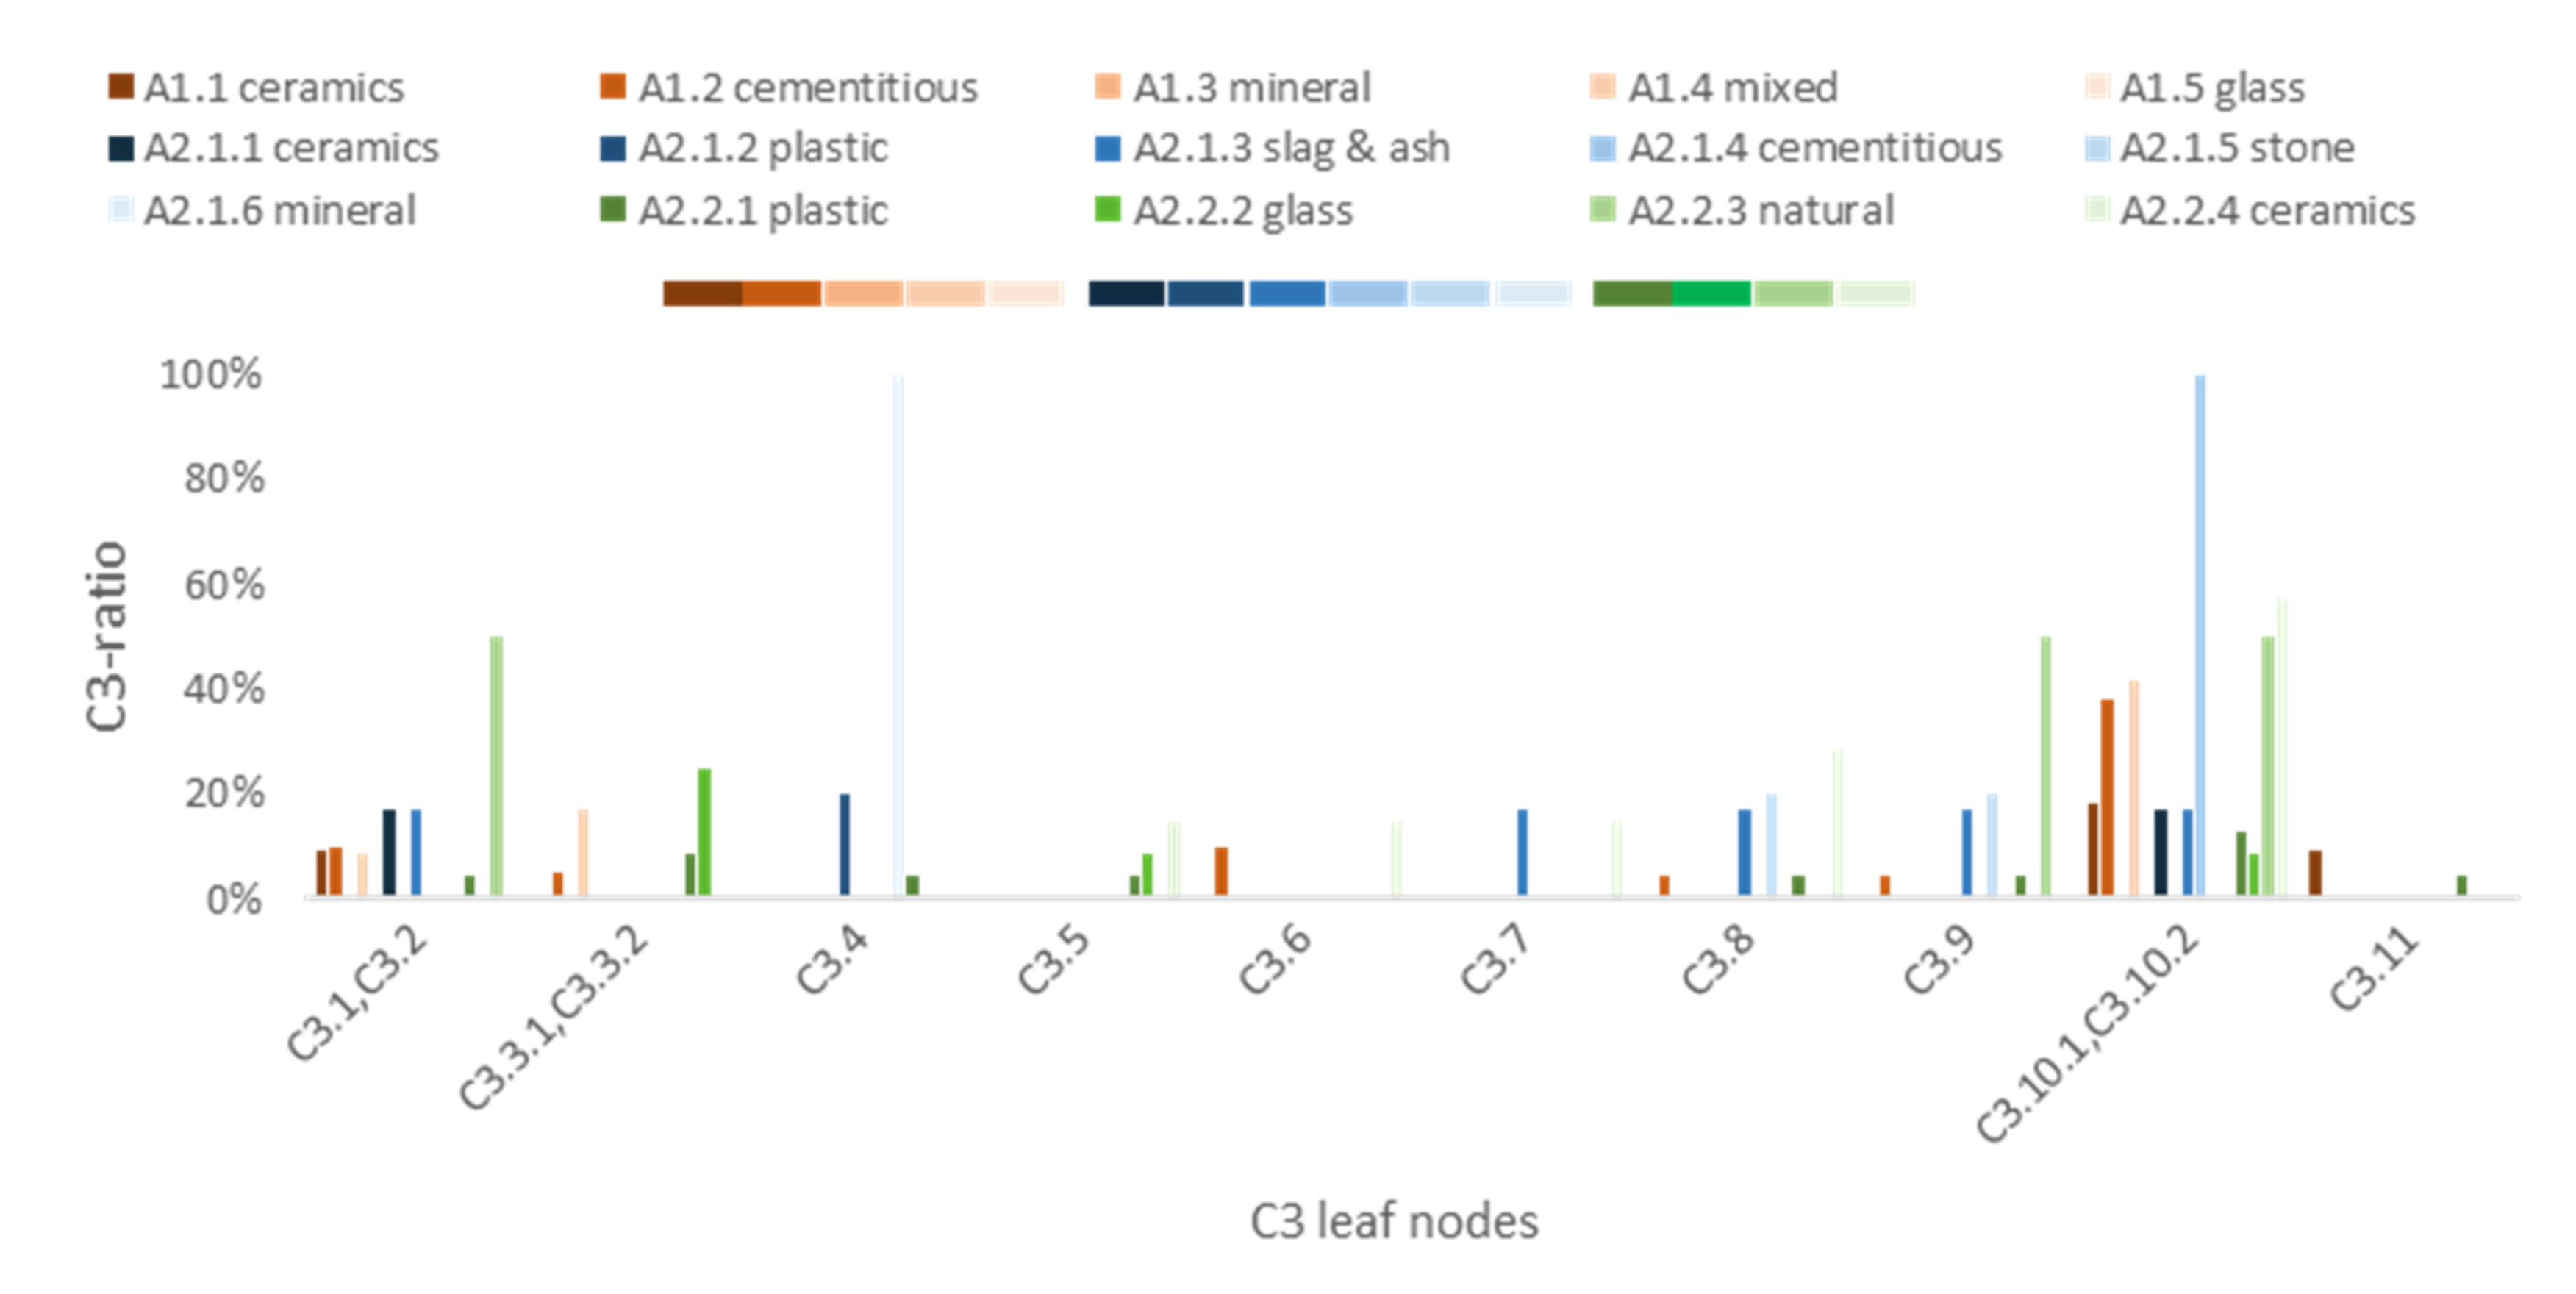
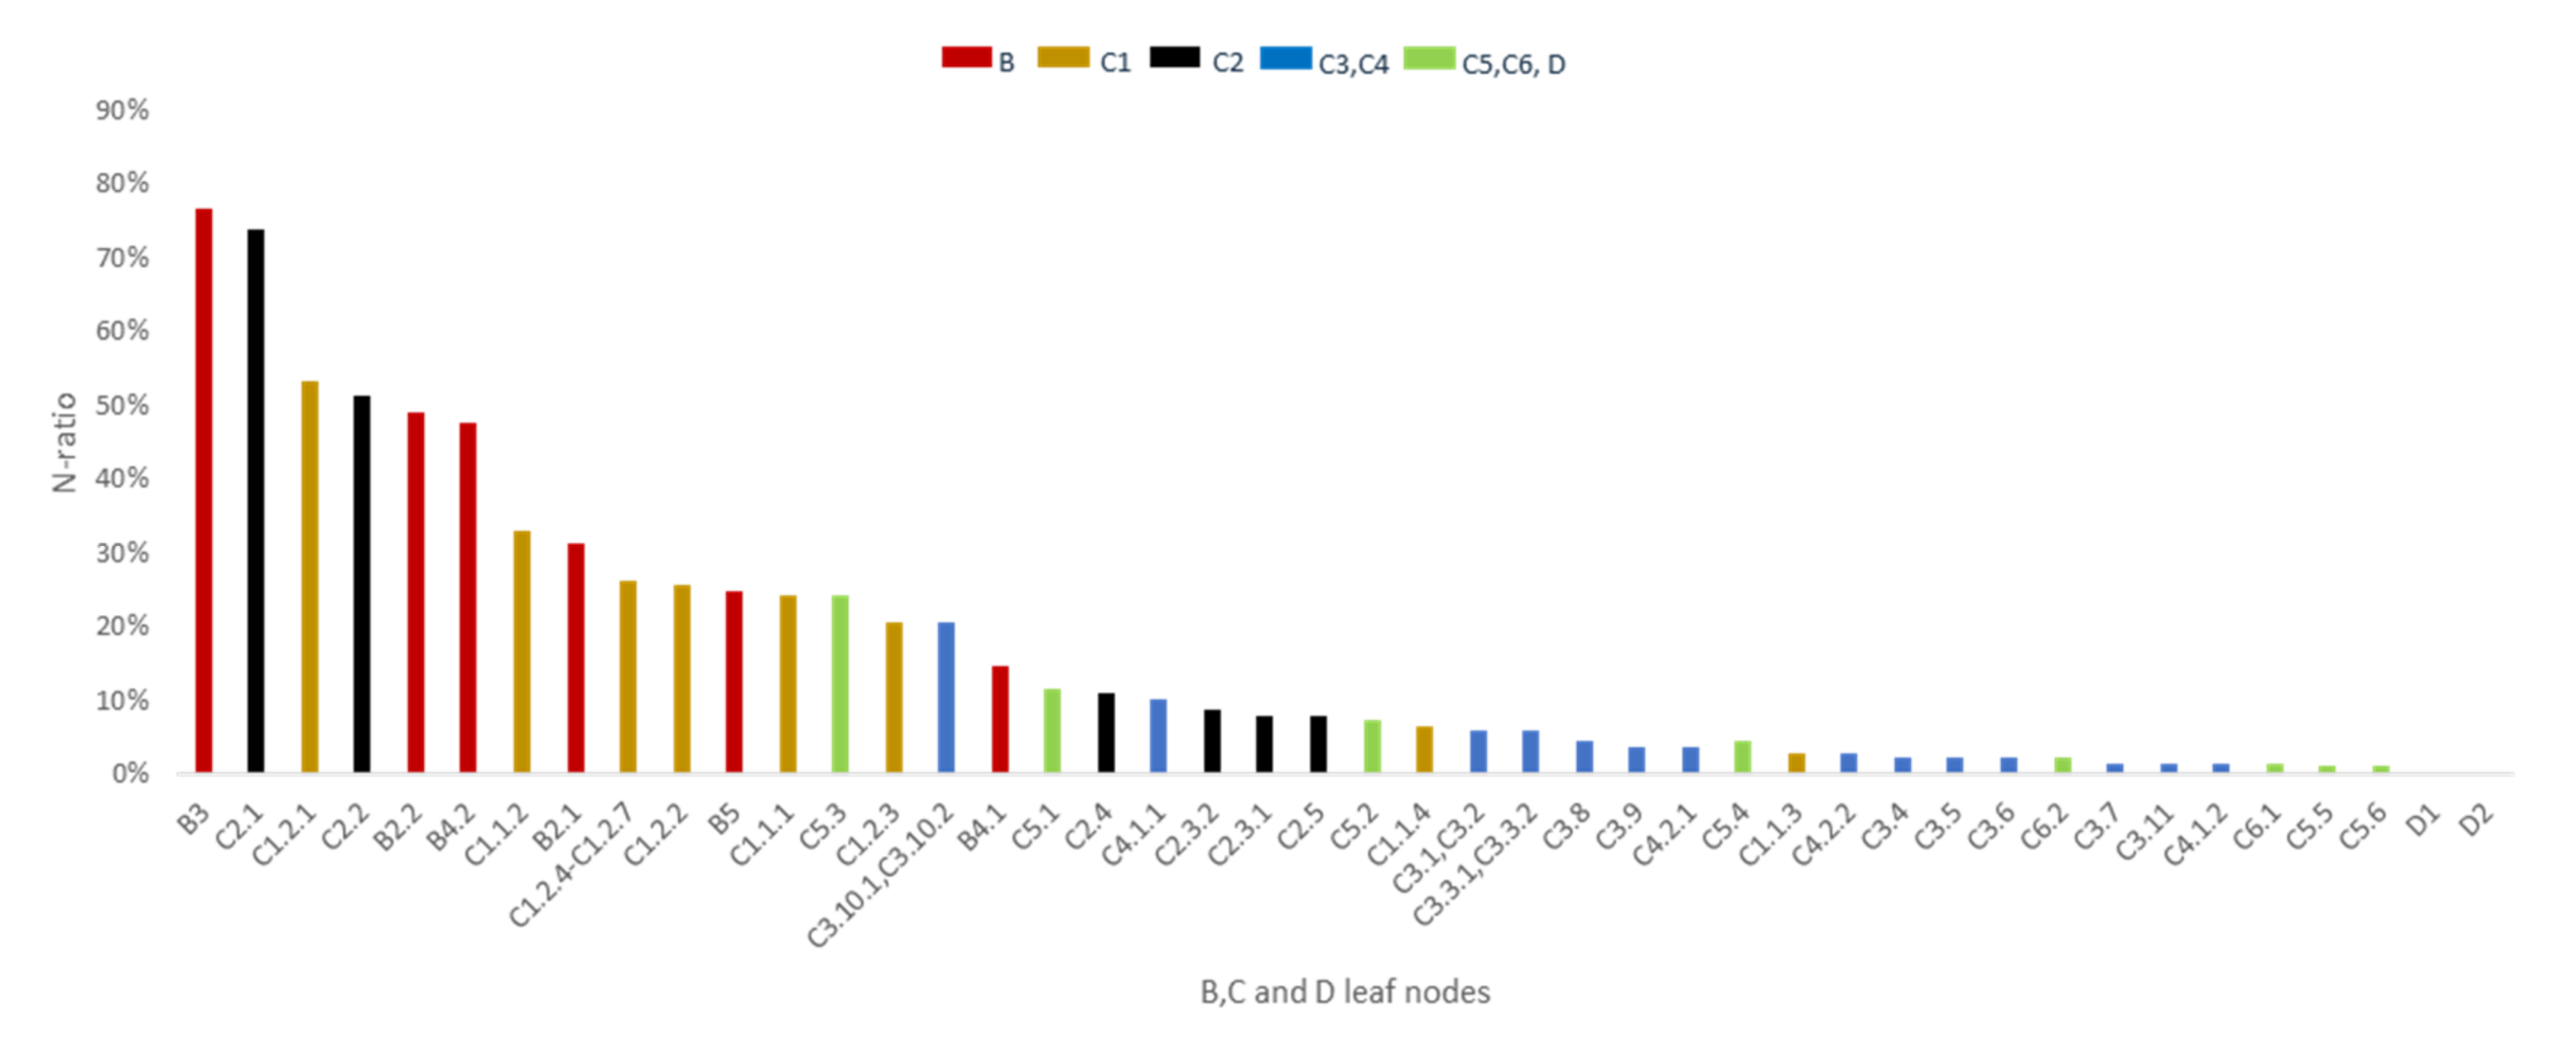
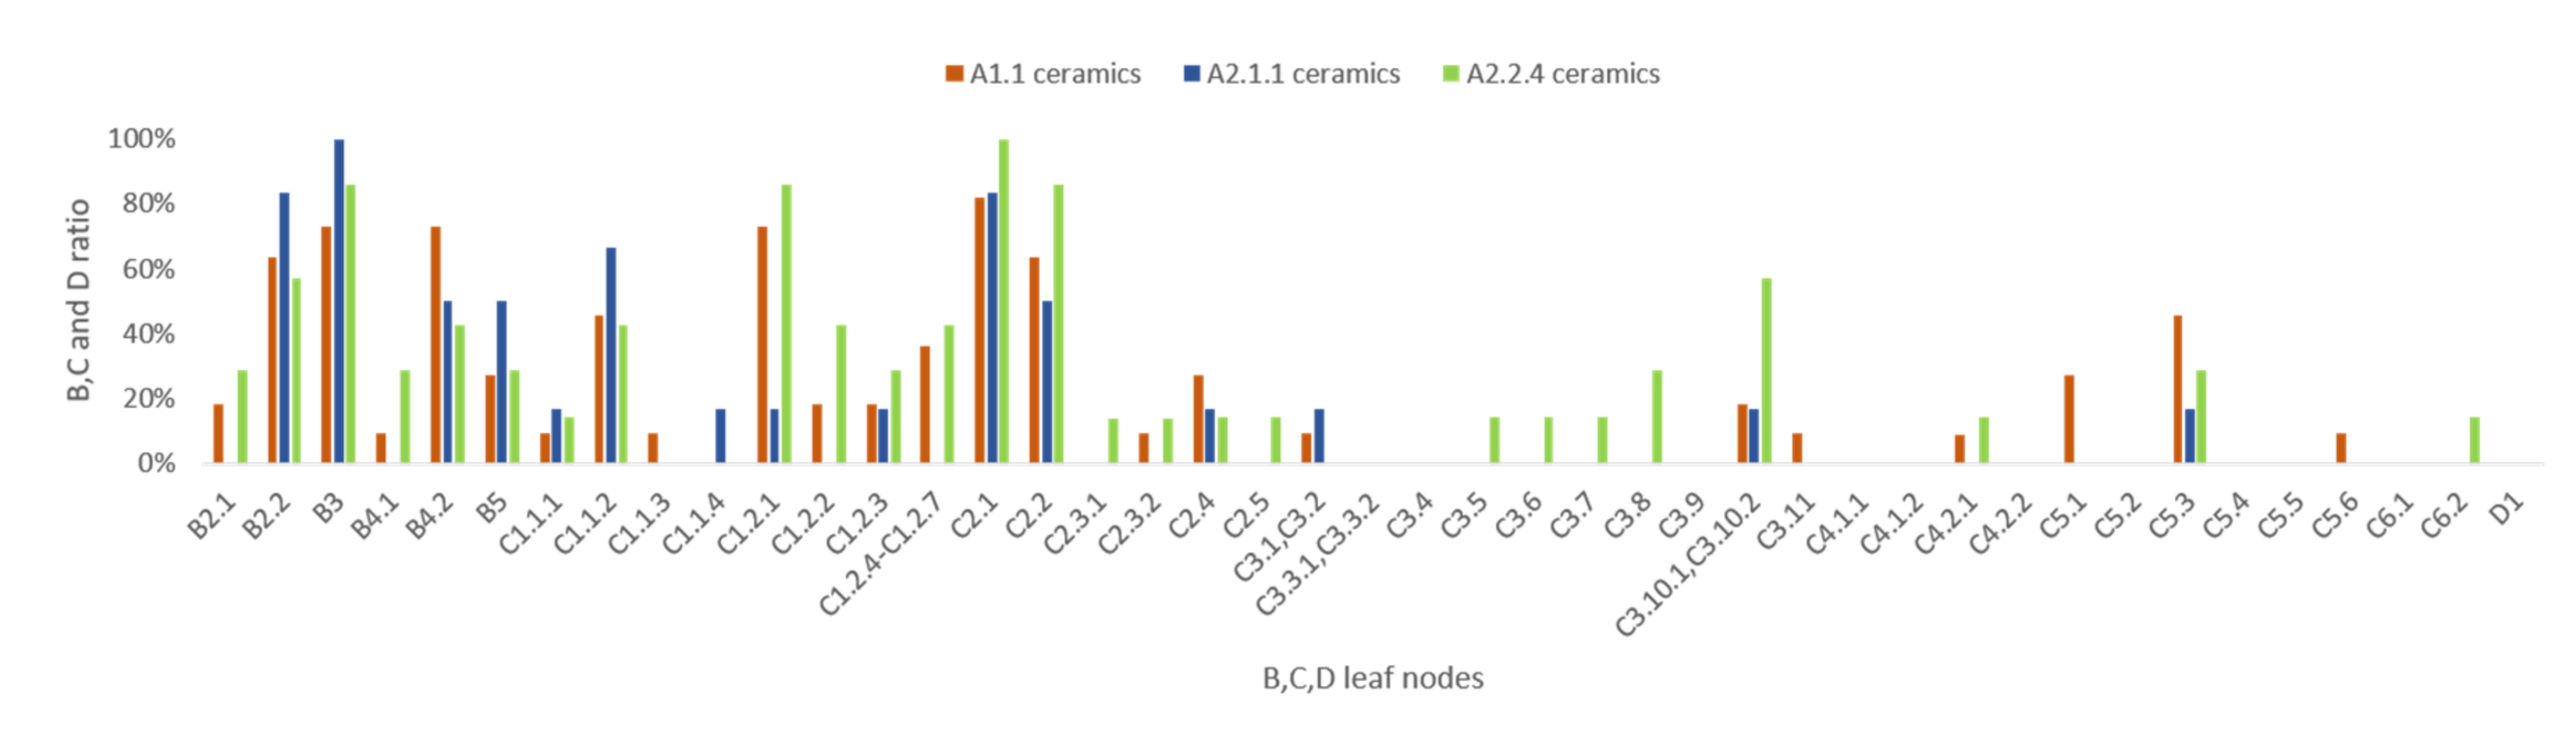
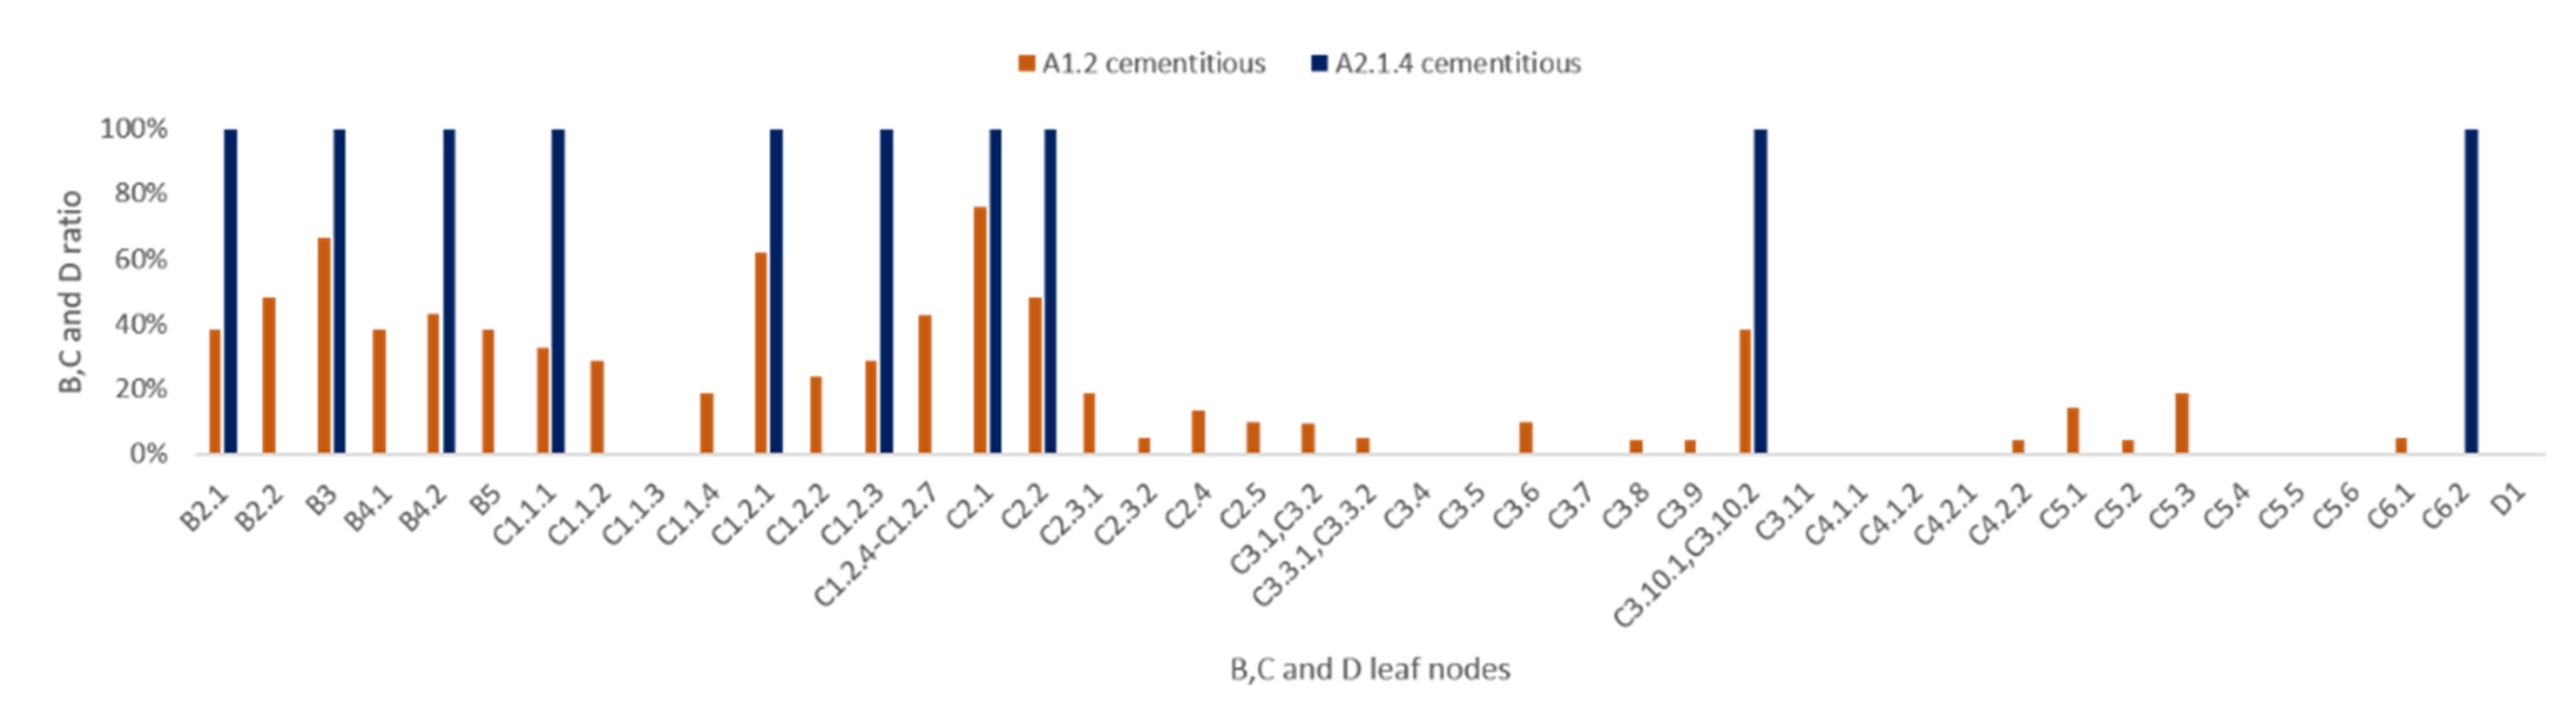
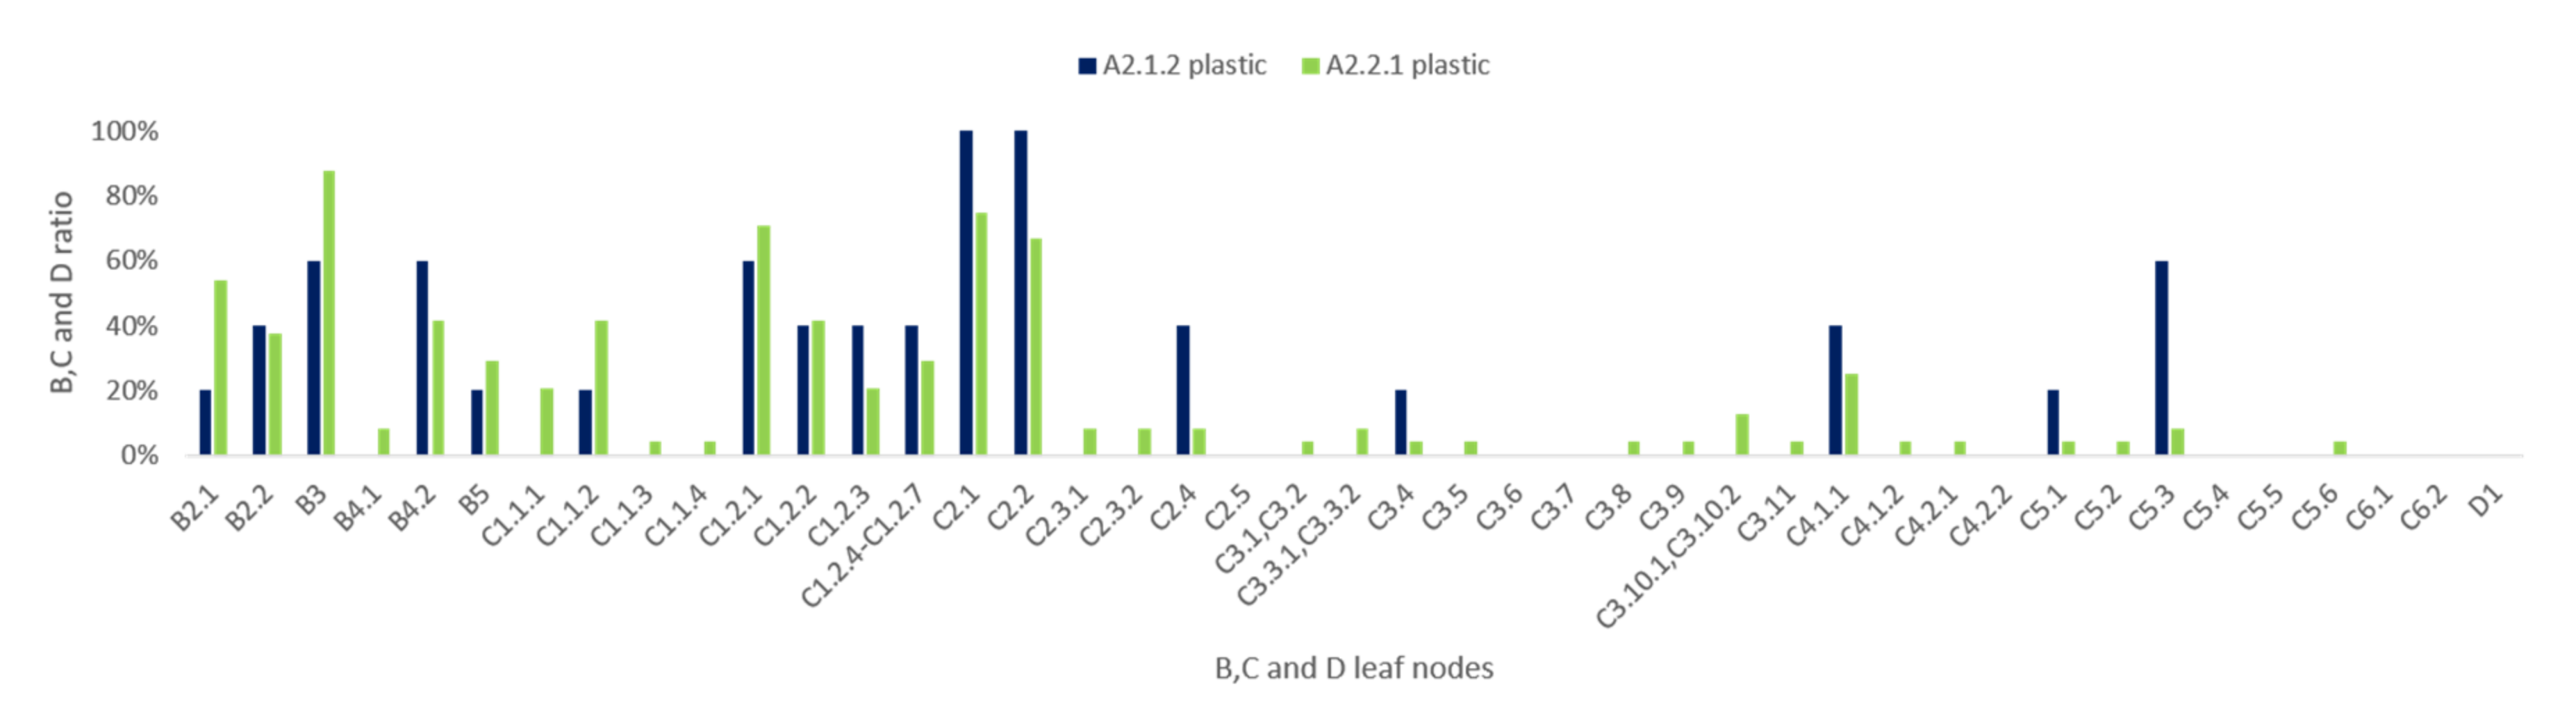
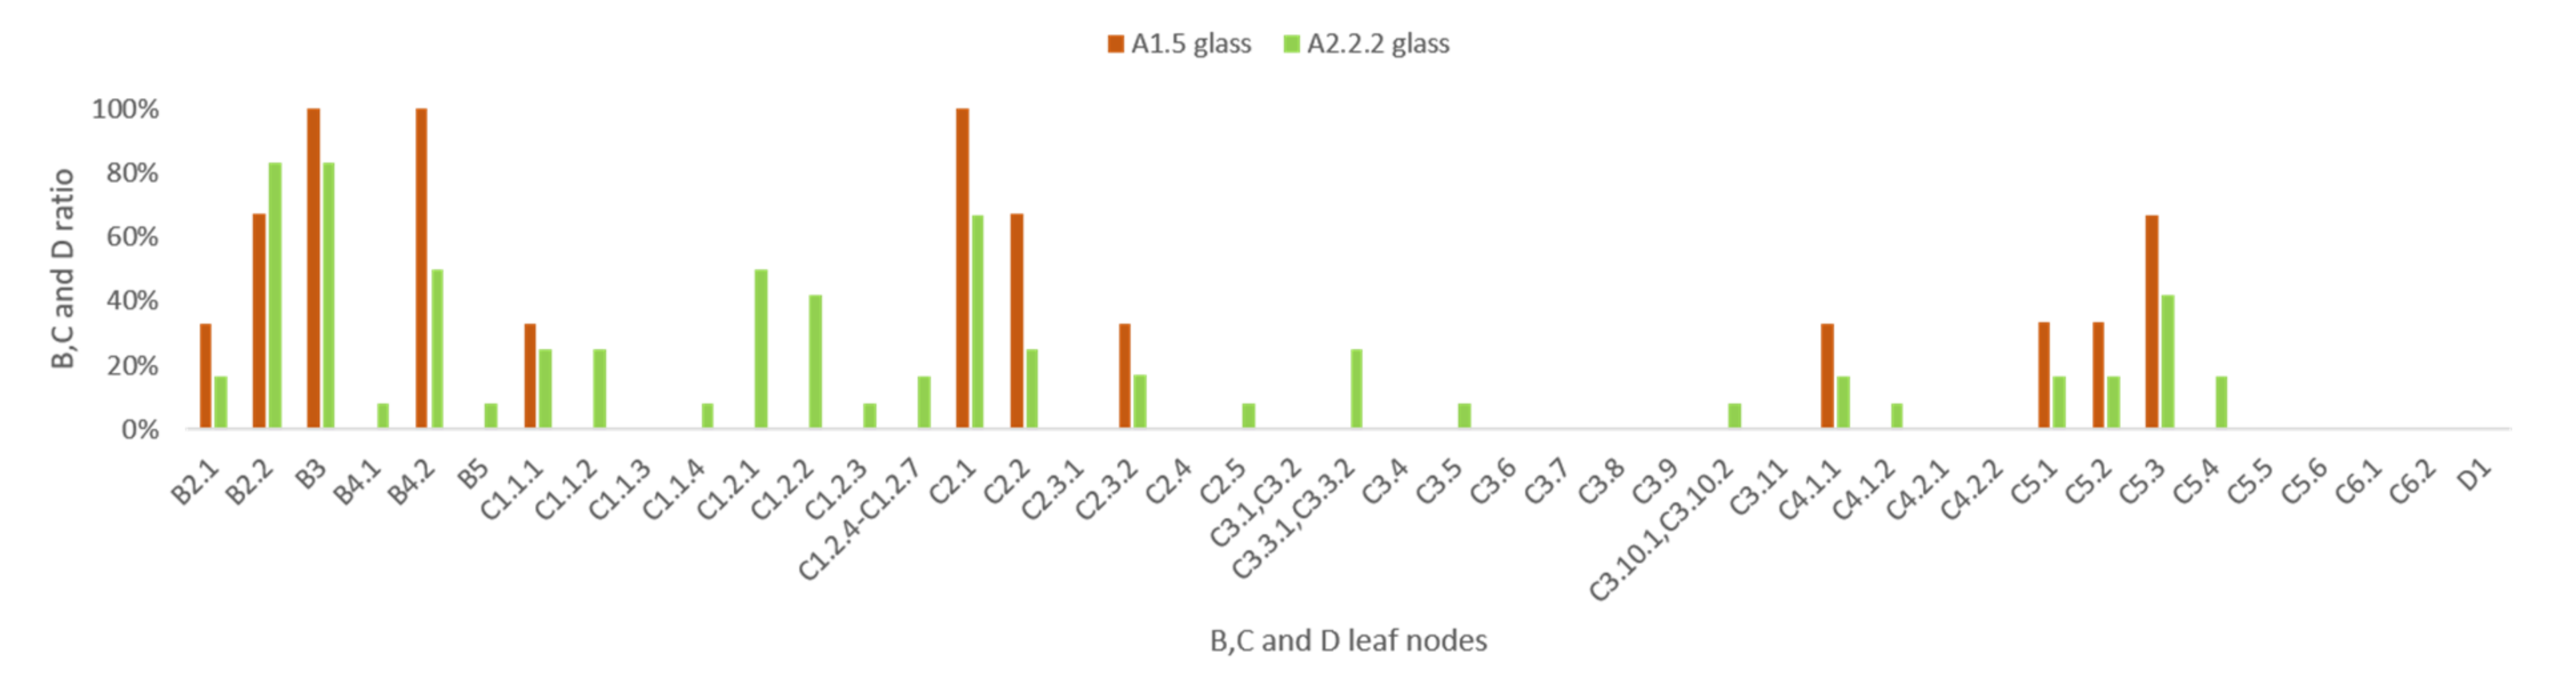
3.3.1. S1 Sequence
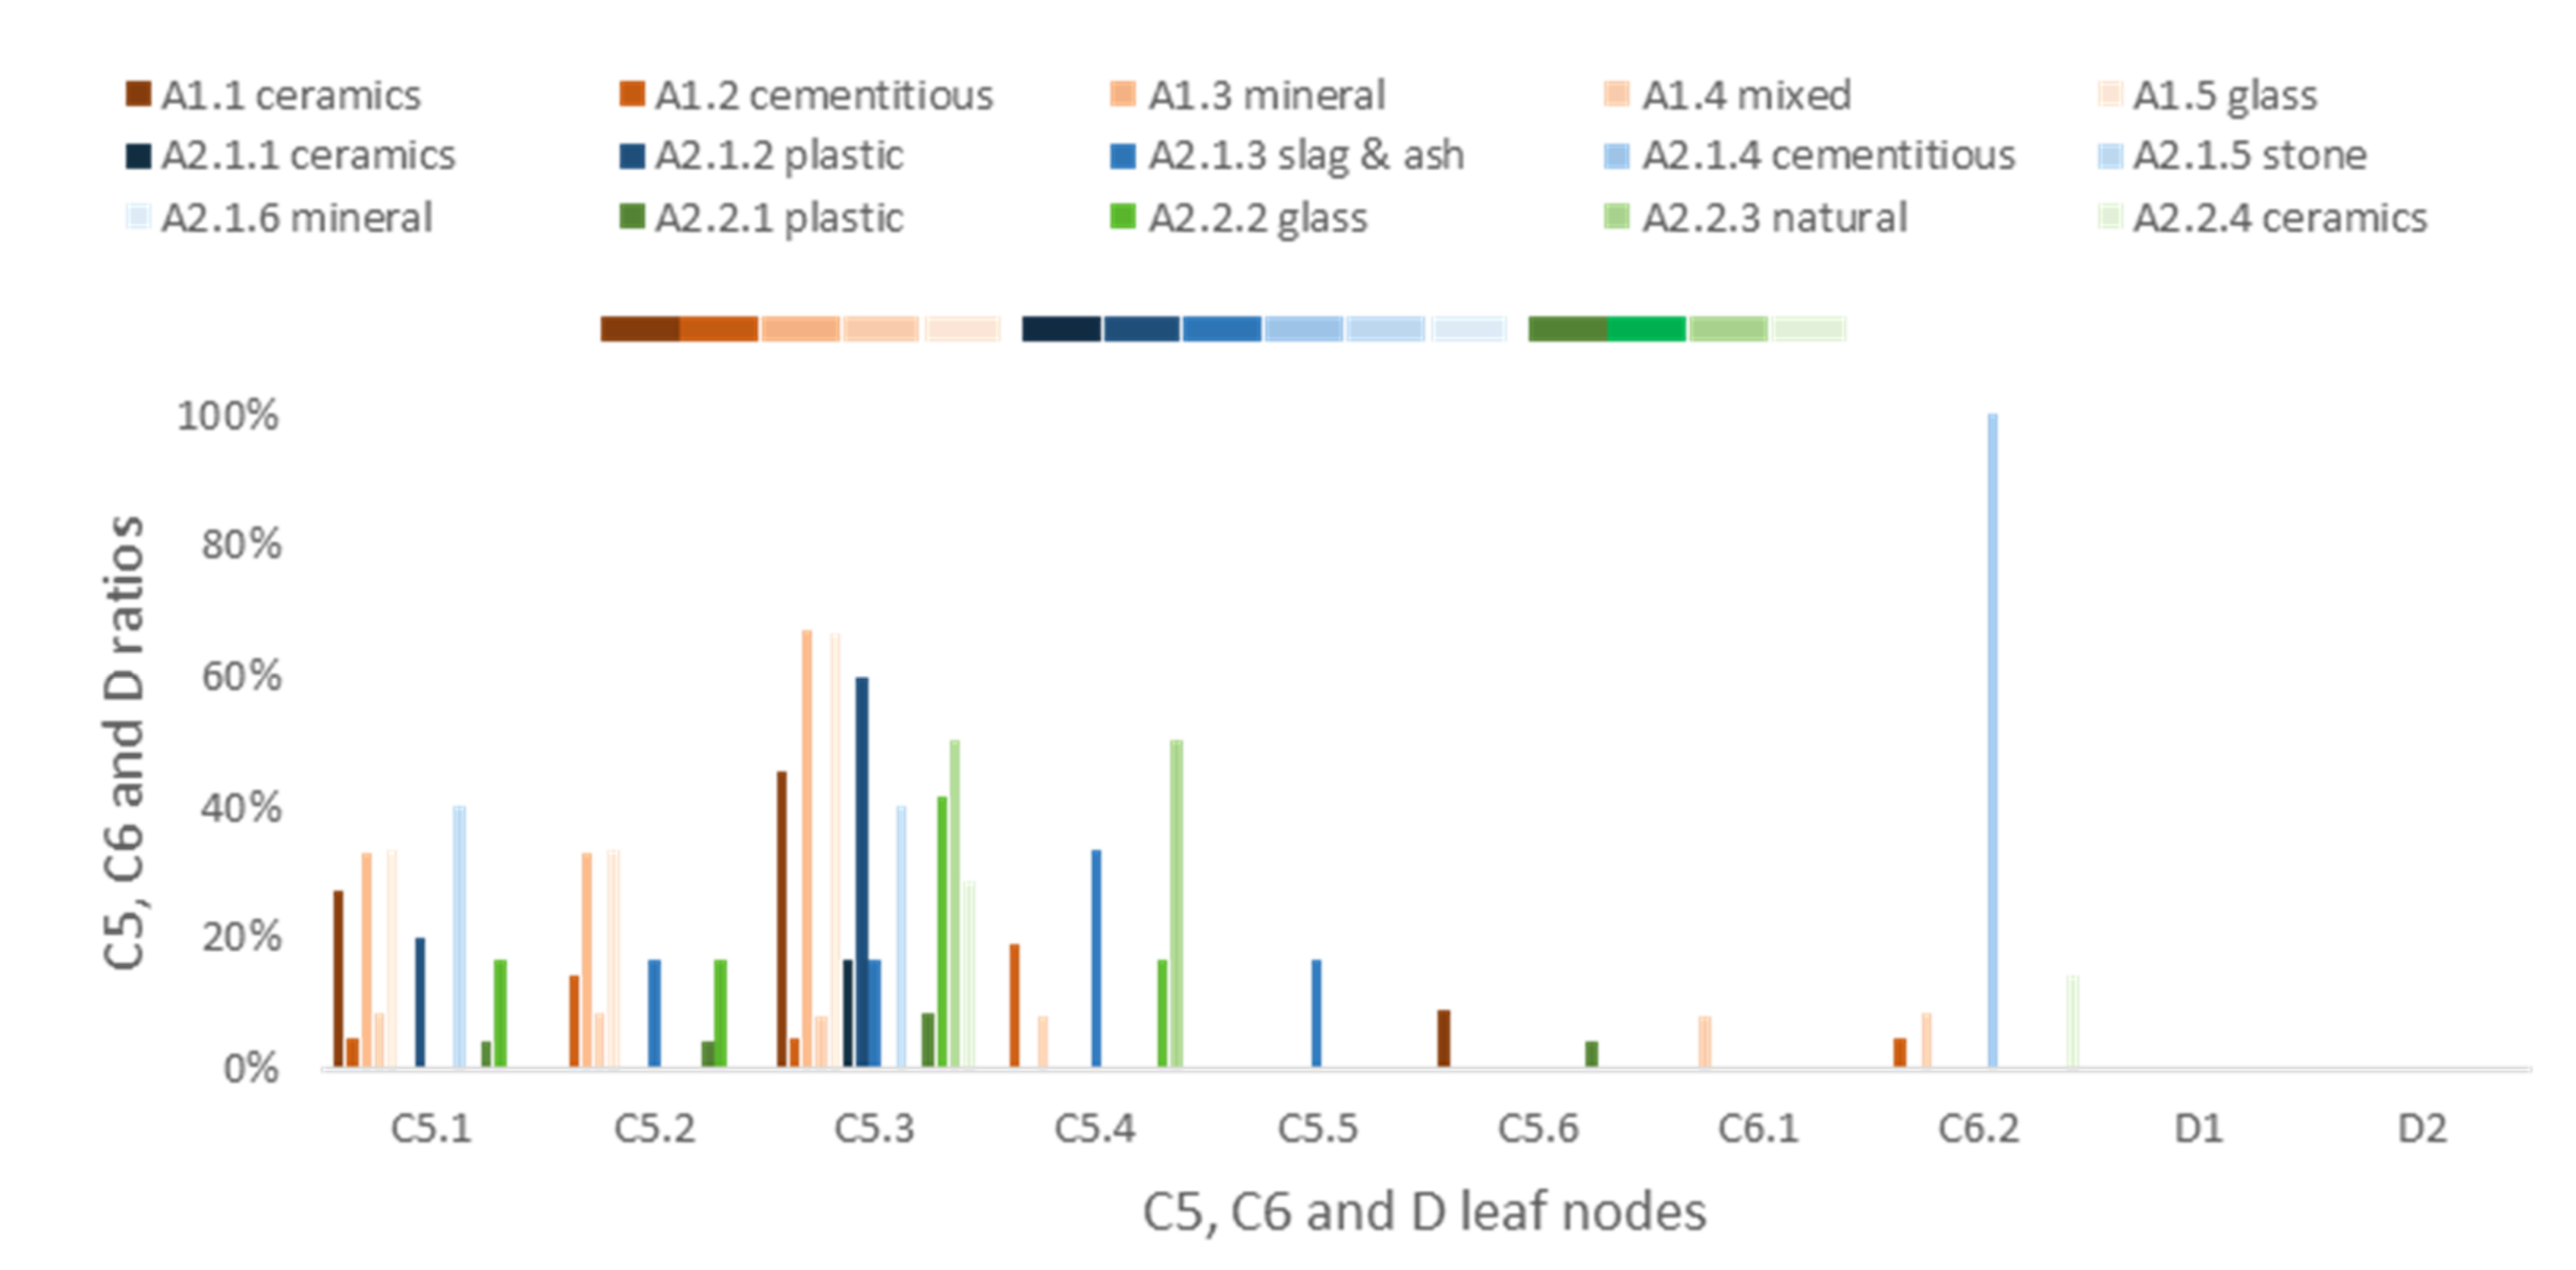
- C1.2.4, C1.2.5, C1.2.6 and C1.2.7, because they measured the capillary water adsorption.
- C3.1 and C3.2, because they measured the chloride ion penetration.
- C3.10.1 and C3.10.2, because they measured the drying shrinkage.
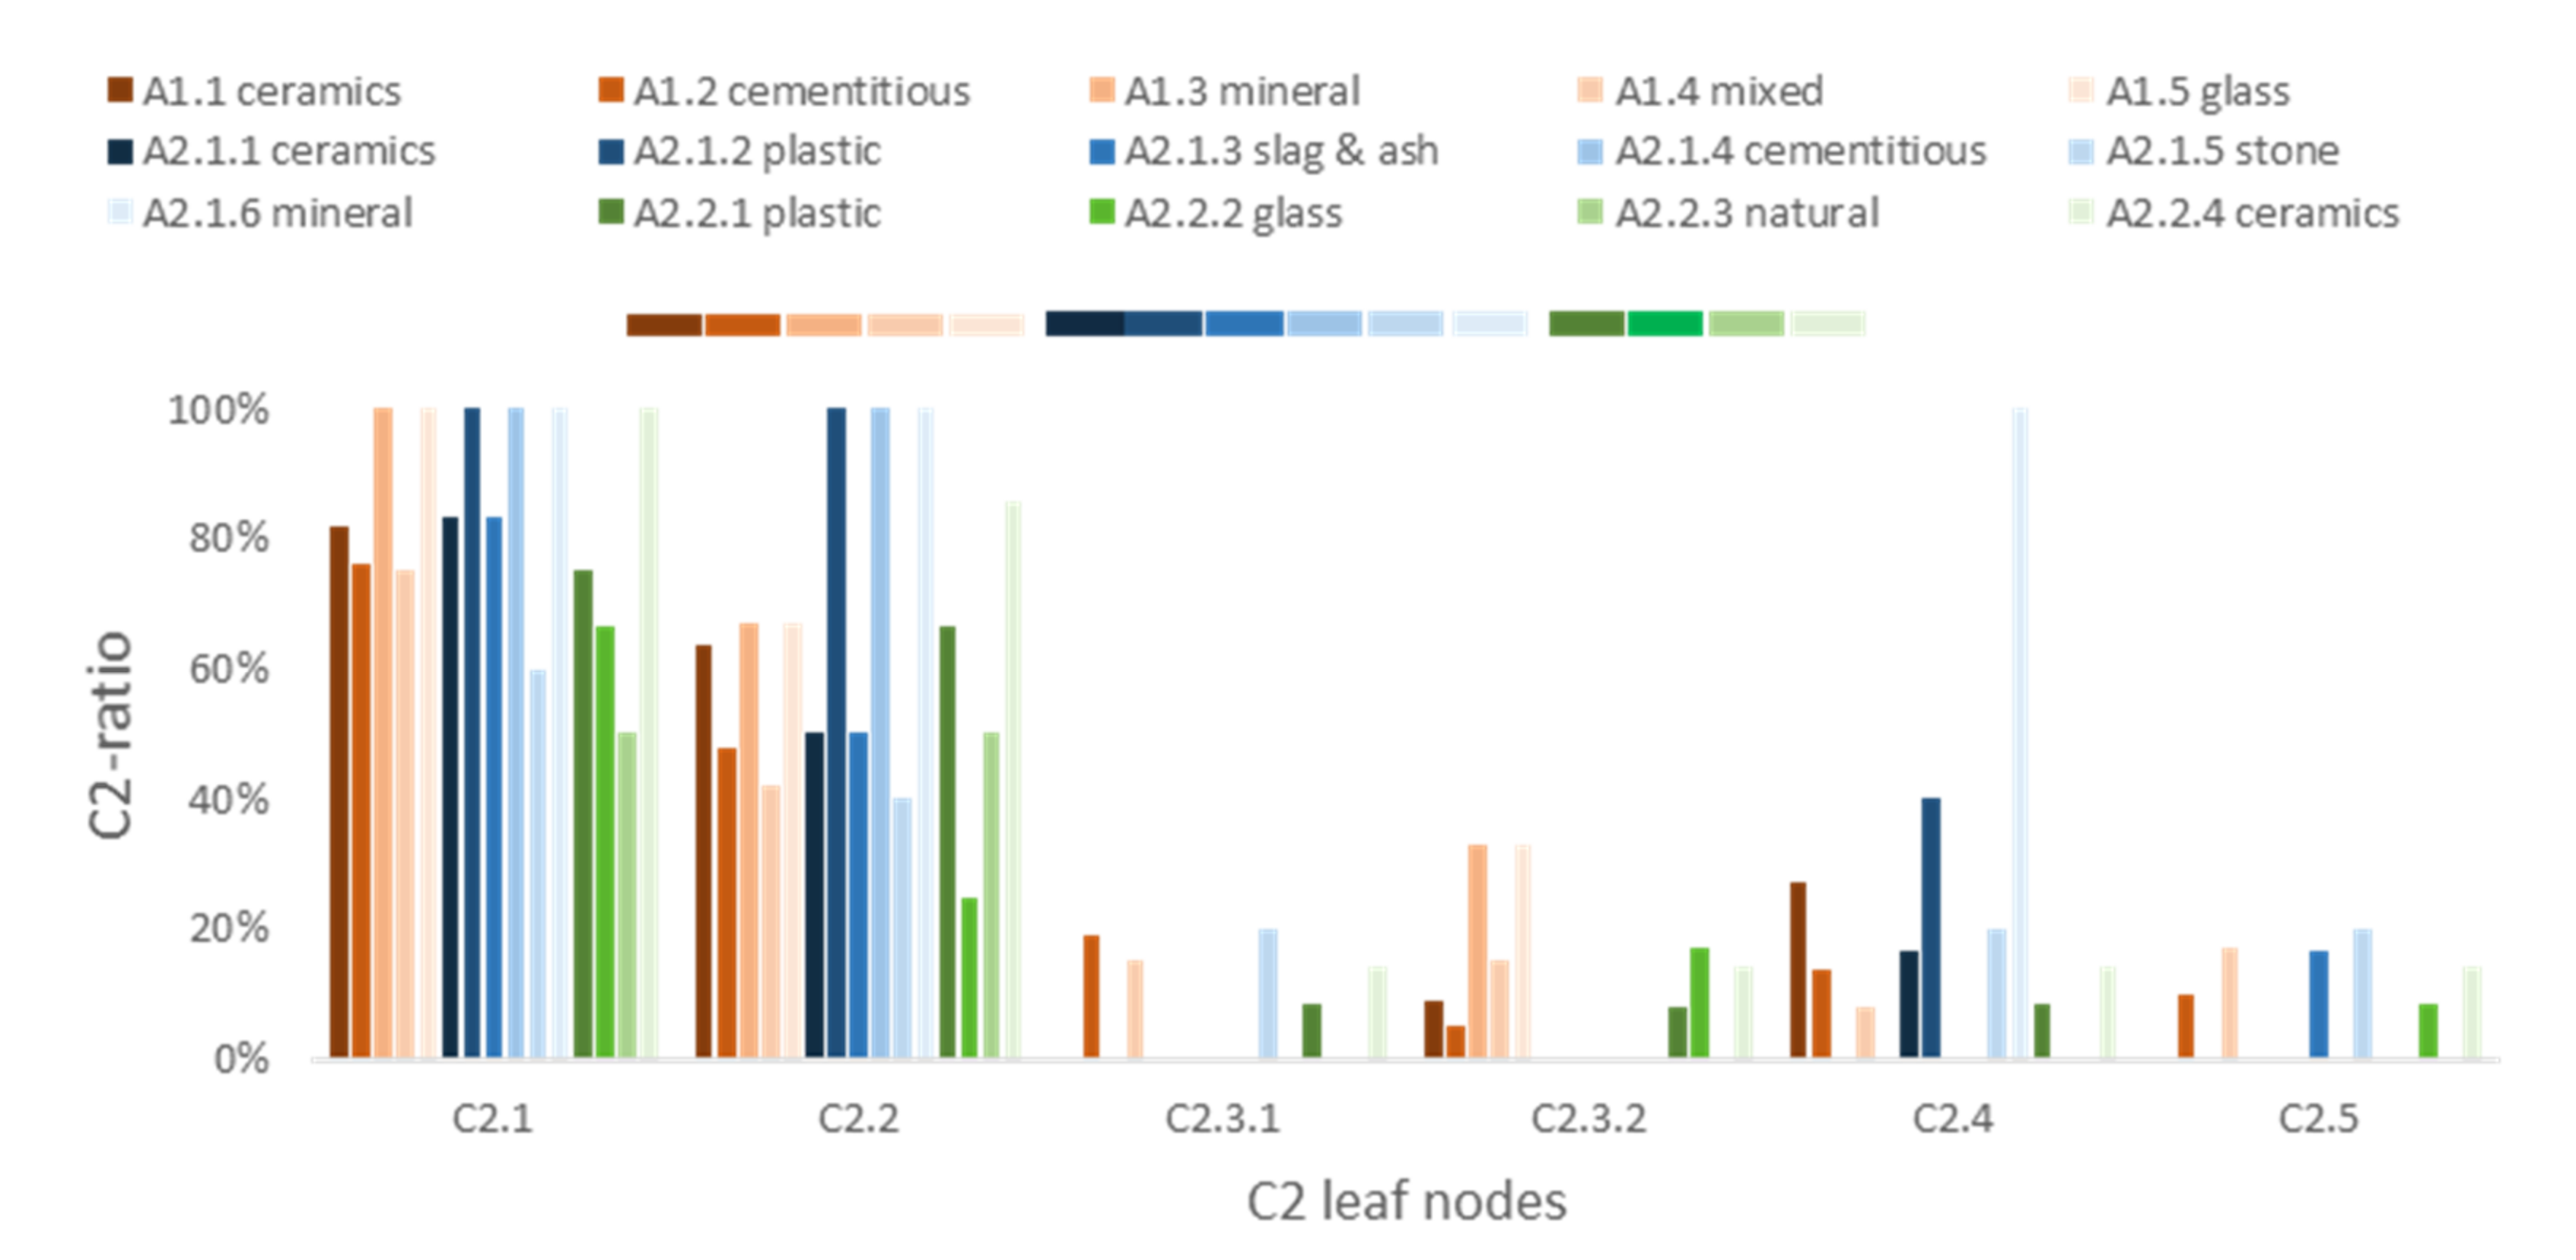
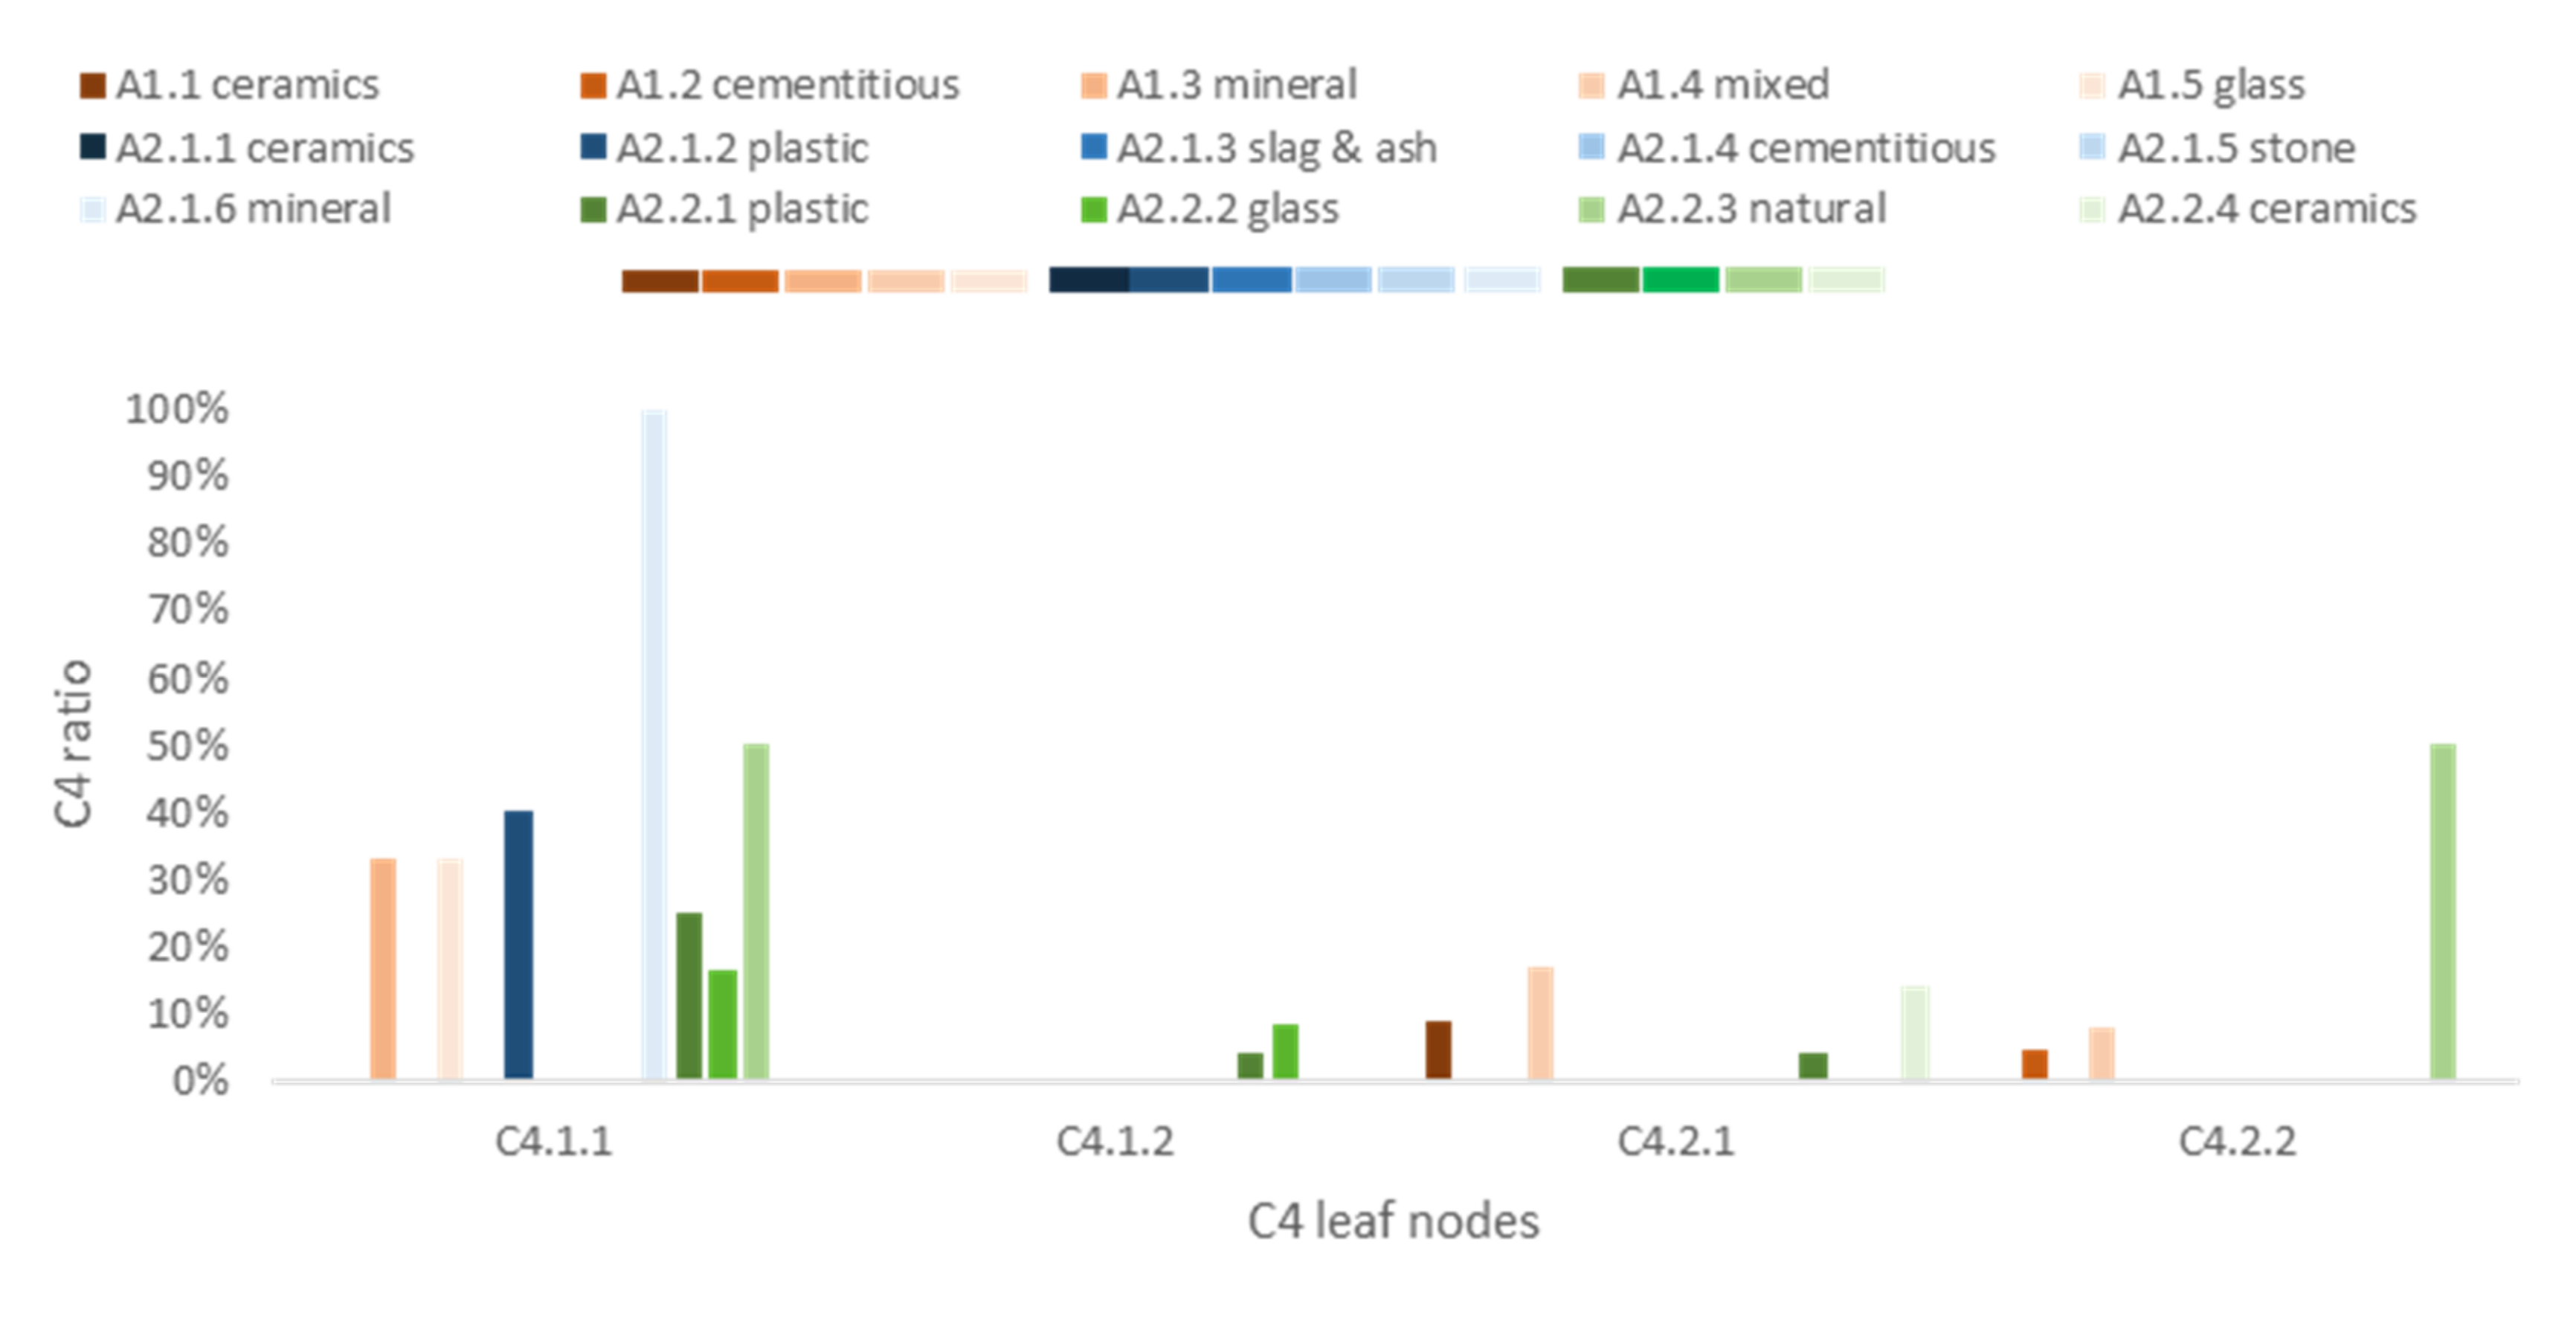
3.3.2. S2 Sequence
- 28-day compressive strength: C2.1,
- water adsorption by capillarity: C1.2.4–C1.2.7,
- dry bulk density: C1.2.1,
- permeability to water under pressure: C3.6,
- resistance to vapor permeability: C4.2.2,
- thermal conductivity: C4.1.1.
4. Discussion and Conclusions
4.1. Key Findings and Gaps
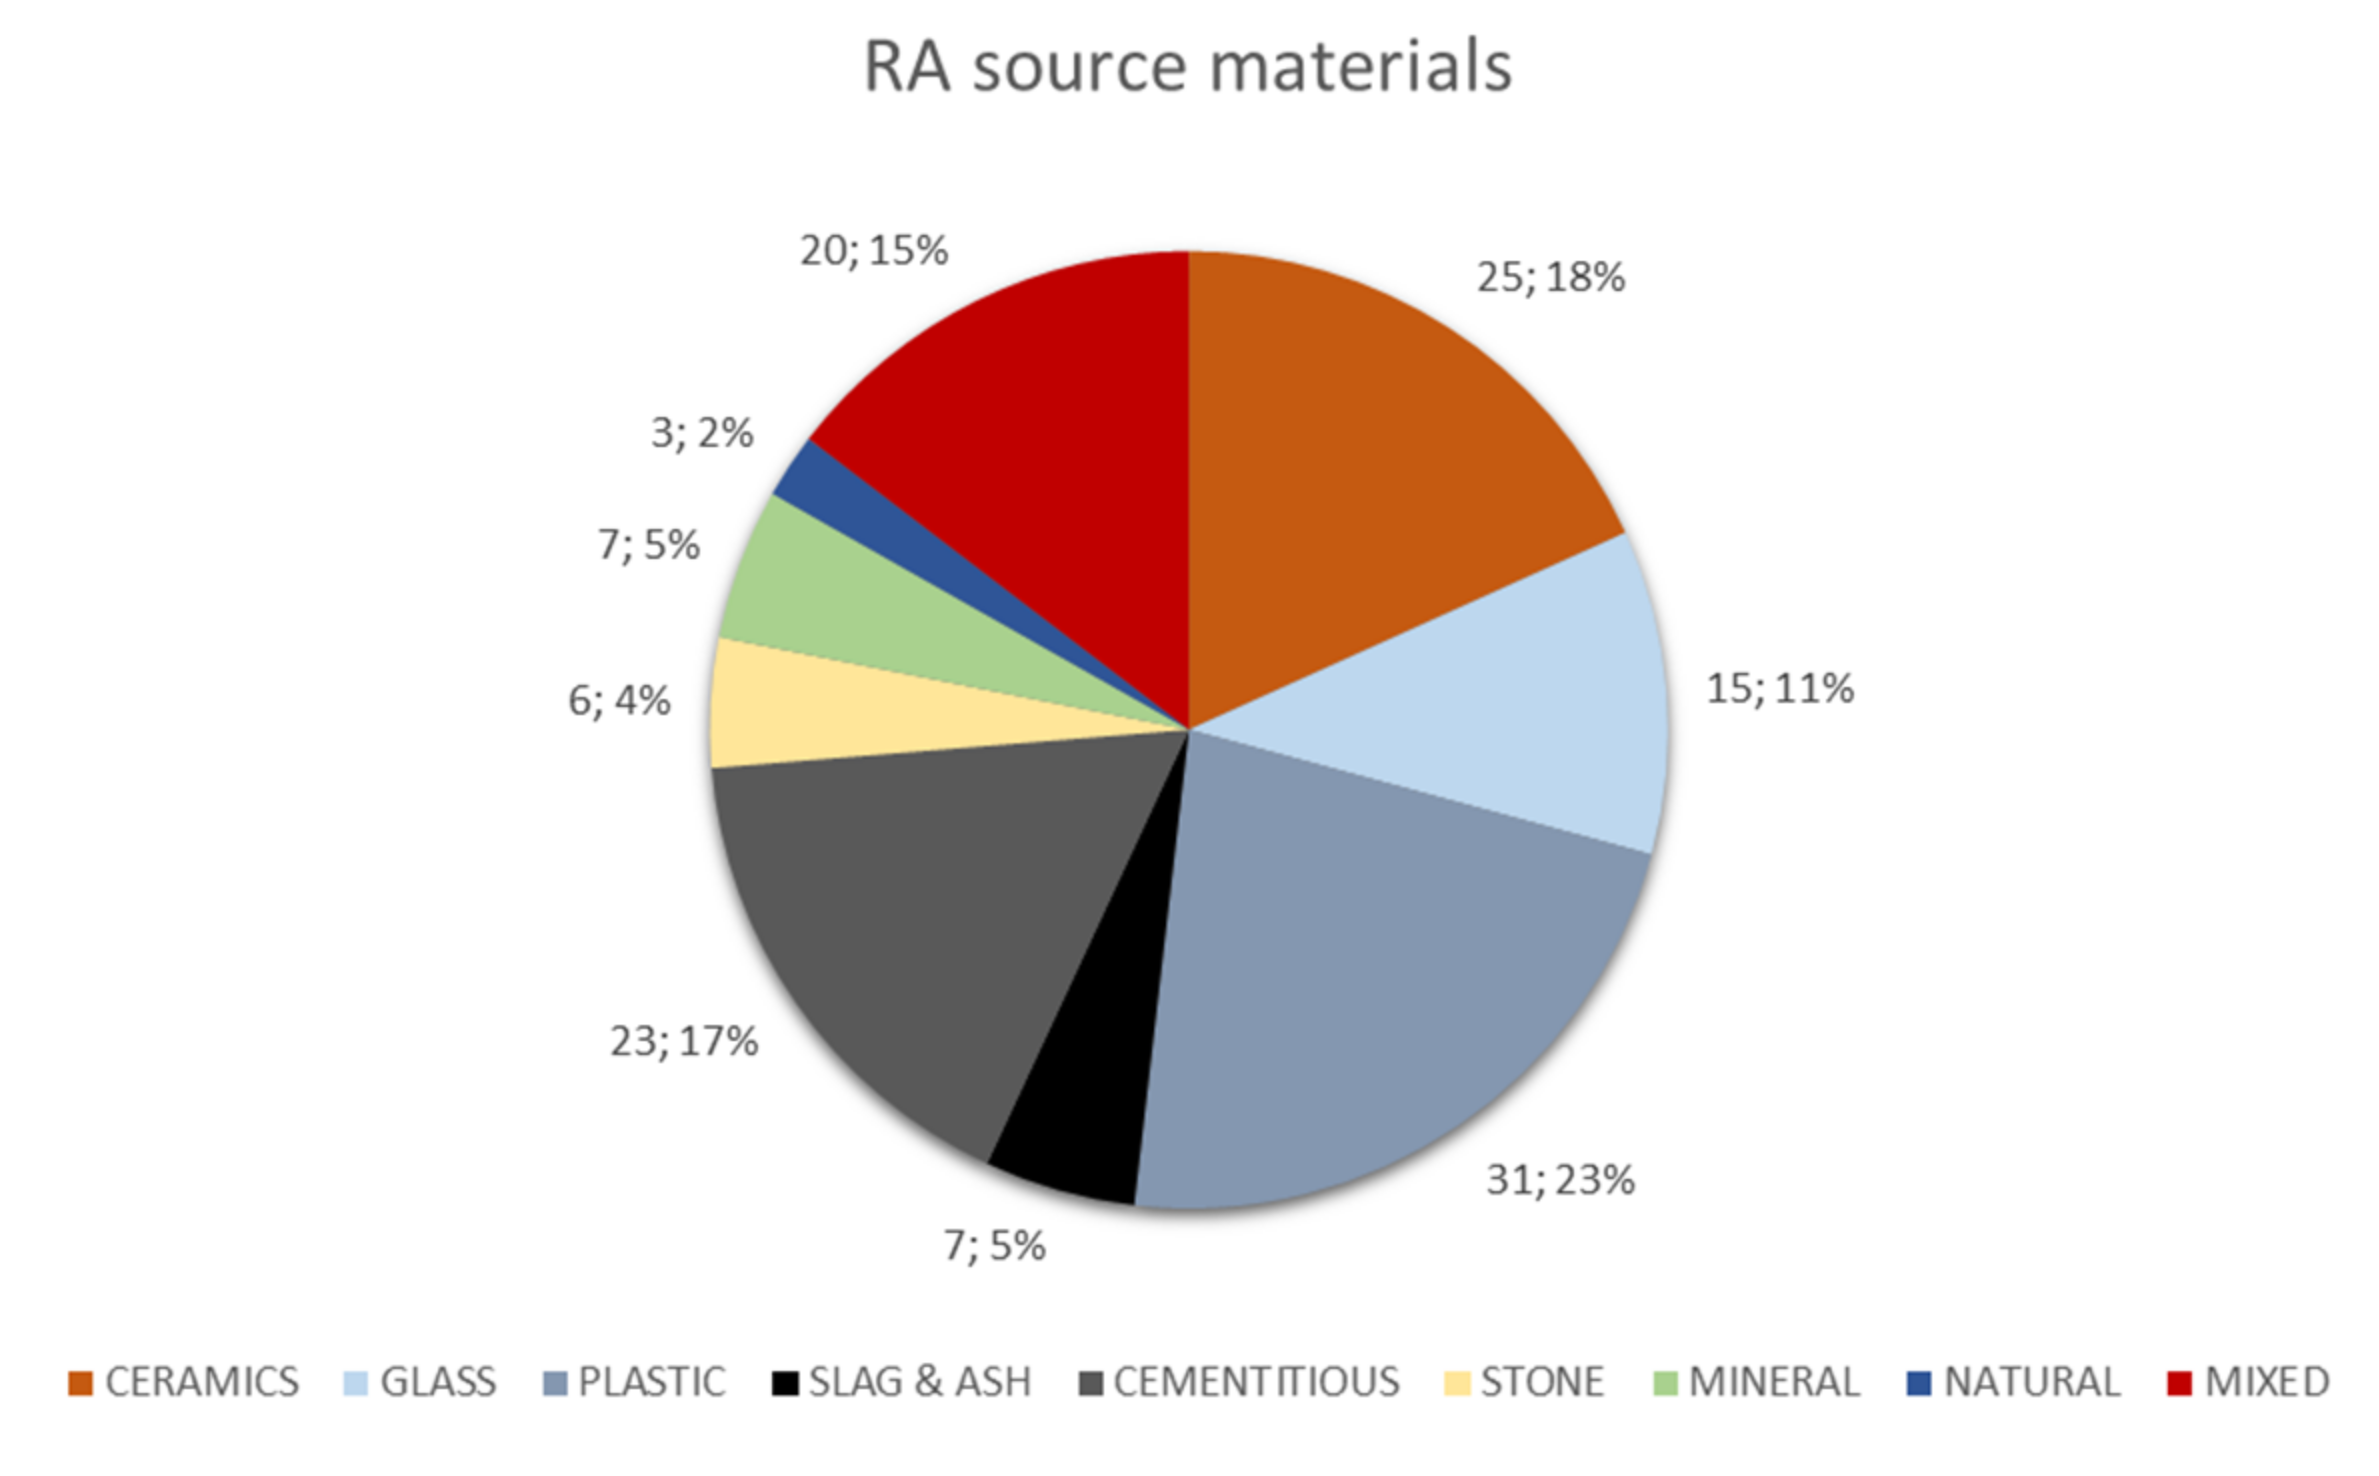
4.1.1. Types of RA
4.1.2. Tested Properties
4.1.3. Field of Use of RA Mortars
4.2. Future Research Framework and Conclusions
Author Contributions
Funding
Institutional Review Board Statement
Informed Consent Statement
Conflicts of Interest
Appendix A


References
- Silva, R.V.; de Brito, J.; Dhir, R.K. Performance of cementitious renderings and masonry mortars containing recycled aggregates from construction and demolition wastes. Constr. Build. Mater. 2016, 105, 400–415. [Google Scholar] [CrossRef]
- Chen, W.; Jin, R.; Xu, Y.; Wanatowski, D.; Li, B.; Yan, L.; Pan, Z.; Yang, Y. Adopting recycled aggregates as sustainable construction materials: A review of the scientific literature. Constr. Build. Mater. 2019, 218, 483–496. [Google Scholar] [CrossRef]
- Meek, A.H.; Elchalakani, M.; Beckett, C.T.S.; Grant, T. Alternative stabilized rammed earth materials incorporating recycled waste and industrial by-products: Life cycle assessment. Constr. Build. Mater. 2021, 267. [Google Scholar] [CrossRef]
- Nicolella, M.; Scognamillo, C.; Vitale, F. Valutazione comparativa delle prestazioni meccaniche di malte confezionate con inerti da riciclo. In New Horizons for Sustainable Architecture, 1st ed.; Cascone, S.M., Margani, G., Sapienza, V., Eds.; Edicom Edizioni: Gorizia, Italy, 2020; pp. 742–756. [Google Scholar]
- Srivastava, A.; Singh, S.K. Utilization of alternative sand for preparation of sustainable mortar: A review. J. Clean. Prod. 2020, 253. [Google Scholar] [CrossRef]
- Gálvez-Martos, J.L.; Styles, D.; Schoenberger, H.; Zeschmar-Lahl, B. Construction and demolition waste best management practice in Europe. Resour. Conserv. Recycl. 2018, 136, 166–178. [Google Scholar] [CrossRef]
- López Ruiz, L.A.; Roca Ramón, X.; Gassó Domingo, S. The circular economy in the construction and demolition waste sector—A review and an integrative model approach. J. Clean. Prod. 2020, 248, 119238. [Google Scholar] [CrossRef]
- Almeshal, I.; Tayeh, B.A.; Alyousef, R.; Alabduljabbar, H.; Mustafa Mohamed, A.; Alaskar, A. Use of recycled plastic as fine aggregate in cementitious composites: A review. Constr. Build. Mater. 2020, 253. [Google Scholar] [CrossRef]
- Silva, R.V.; de Brito, J.; Dhir, R.K. Use of recycled aggregates arising from construction and demolition waste in new construction applications. J. Clean. Prod. 2019, 236. [Google Scholar] [CrossRef]
- Bai, G.; Zhu, C.; Liu, C.; Liu, B. An evaluation of the recycled aggregate characteristics and the recycled aggregate concrete mechanical properties. Constr. Build. Mater. 2020, 240. [Google Scholar] [CrossRef]
- Dong, Q.; Wang, G.; Chen, X.; Tan, J.; Gu, X. Recycling of steel slag aggregate in Portland cement concrete: An overview. J. Clean. Prod. 2021, 282. [Google Scholar] [CrossRef]
- Silva, R.V.; de Brito, J.; Dhir, R.K. Availability and processing of recycled aggregates within the construction and demolition supply chain: A review. J. Clean. Prod. 2017, 143, 598–614. [Google Scholar] [CrossRef]
- Faraj, R.H.; Hama Ali, H.F.; Sherwani, A.F.H.; Hassan, B.R.; Karim, H. Use of recycled plastic in self-compacting concrete: A comprehensive review on fresh and mechanical properties. J. Build. Eng. 2020, 30. [Google Scholar] [CrossRef]
- Li, X.; Ling, T.-C.; Hung Mo, K. Functions and impacts of plastic/rubber wastes as eco-friendly aggregate in concrete. A review. Constr. Build. Mater. 2020, 240. [Google Scholar] [CrossRef]
- Gayarre, F.L.; González, J.S.; Pérez, C.L.C.; Serrano López, M.A.; Ros, P.S.; Martínez-Barrera, G. Shrinkage and creep in structural concrete with recycled brick aggregates. Constr. Build. Mater. 2019, 228. [Google Scholar] [CrossRef]
- Le, H.B.; Bui, Q.B. Recycled aggregate concretes. A state-of-the-art from the microstructure to the structural performance. Constr. Build. Mater. 2020, 257. [Google Scholar] [CrossRef]
- Xuan, D.X.; Schlangen, E.; Molenaar, A.A.A.; Houben, L.J.M. Influence of quality and variation of recycled masonry aggregates on failure behavior of cement treated demolition waste. Constr. Build. Mater. 2014, 71, 521–527. [Google Scholar] [CrossRef]
- Debbarma, S.; Ransinchung, G.D.; Singh, S.; Sahdeo, S.K. Utilization of industrial and agricultural wastes for productions of sustainable roller compacted concrete pavement mixes containing reclaimed asphalt pavement aggregates. Resour. Conserv. Recycl. 2020, 152. [Google Scholar] [CrossRef]
- Harrison, E.; Berenjian, A.; Seifan, M. Recycling of waste glass as aggregate in cement-based materials. Environ. Sci. Ecotechnol. 2020, 4. [Google Scholar] [CrossRef]
- Moher, D.; Liberati, A.; Tetzlaff, J.; Altman, D.G. Preferred reporting items for systematic reviews and meta-analyses: The PRISMA statement. BMJ 2009, 7716, 332–336. [Google Scholar]
- Jiménez, J.R.; Ayuso, J.; López, M.; Fernández, J.M.; de Brito, J. Use of fine recycled aggregates from ceramic waste in masonry mortar manufacturing. Constr. Build. Mater. 2013, 40, 679–690. [Google Scholar] [CrossRef]
- Afroughsabet, V.; Biolzi, L.; Ozbakkaloglu, T. Influence of double hooked-end steel fibers and slag on mechanical and durability properties of high performance recycled aggregate concrete. Compos. Struct. 2017, 181, 273–284. [Google Scholar] [CrossRef]
- Chakradhara Rao, M. Properties of recycled aggregate and recycled aggregate concrete: Effect of parent concrete. Asian J. Civ. Eng. 2018, 19, 103–110. [Google Scholar] [CrossRef]
- Kou, S.C.; Poon, C.S. Effect of the quality of parent concrete on the properties of high performance recycled aggregate concrete. Constr. Build. Mater. 2015, 77, 501–508. [Google Scholar] [CrossRef]
- Haach, V.G.; Vasconcelos, G.; Lourenço, P.B. Influence of aggregates grading and water/cement ratio in workability and hardened properties of mortars. Constr. Build. Mater. 2011, 25, 2980–2987. [Google Scholar] [CrossRef]
- Beltrán, M.G.; Agrela, F.; Barbudo, A.; Ayuso, J.; Ramírez, A. Mechanical and durability properties of concretes manufactured with biomass bottom ash and recycled coarse aggregates. Constr. Build. Mater. 2014, 72, 231–238. [Google Scholar] [CrossRef]
- Thomas, C.; Setién, J.; Polanco, J.A.; Alaejos, P.; Sánchez de Juan, M. Durability of recycled aggregate concrete. Constr. Build. Mater. 2013, 40, 1054–1065. [Google Scholar] [CrossRef]
- Olorunsogo, F.T.; Padayachee, N. Performance of recycled aggregate concrete monitored by durability indexes. Cem. Concr. Res. 2002, 32, 179–185. [Google Scholar] [CrossRef]
- McNeil, K.; Kang, T.H.K. Recycled Concrete Aggregates: A Review. Int. J. Concr. Struct. Mater. 2013, 7, 61–69. [Google Scholar] [CrossRef]
- Nicolella, M.; Pino, A.; Scognamillo, C.; Vitale, F. Feasibility Study on the Production of Sustainable Mortars Packaged with Recycled AAC Aggregates. In IOP Conference Series: Materials Science and Engineering; IOP Publishing: Bristol, UK, 2020; Volume 960. [Google Scholar]


| Mortar Class 2 | fc MPa | W kg/m2min0.5 | ddry kg/m3 | p mL/cm2 | m | l W/mK |
|---|---|---|---|---|---|---|
| GP | CSI to CSIV | W0 to W2 | ||||
| LW | CSI to CSIII | W0 to W2 | <1300 | |||
| CR | CSI to CSIV | W0 to W2 | ||||
| OC | CSI to CSIV | W1 and W2 | <1 | |||
| R | CSII | >0.3 kg/m2 after 24 h | <15 | |||
| T1 | CSI to CSII | W1 | <15 | <0.10 | ||
| T2 | CSI to CSII | W1 | <15 | <0.20 |
| Mortar Class | fc 1 MPa |
|---|---|
| M1 | 1 |
| M2.5 | 2.5 |
| M5 | 5 |
| M10 | 10 |
| M15 | 15 |
| M20 | 20 |
| GP 1 | LW 1 | CR1 | OC 1 | R 1 | T 1 |
|---|---|---|---|---|---|
| 8 | 5 | 8 | 8 | 8 | |
| 26 | 22 | 26 | 98 | ||
| 39 | 29 | 39 | |||
| 49 | 83 | 49 | |||
| 60 | 60 | ||||
| 96 | 96 |
Publisher’s Note: MDPI stays neutral with regard to jurisdictional claims in published maps and institutional affiliations. |
© 2021 by the authors. Licensee MDPI, Basel, Switzerland. This article is an open access article distributed under the terms and conditions of the Creative Commons Attribution (CC BY) license (http://creativecommons.org/licenses/by/4.0/).
Share and Cite
Vitale, F.; Nicolella, M. Mortars with Recycled Aggregates from Building-Related Processes: A ‘Four-Step’ Methodological Proposal for a Review. Sustainability 2021, 13, 2756. https://doi.org/10.3390/su13052756
Vitale F, Nicolella M. Mortars with Recycled Aggregates from Building-Related Processes: A ‘Four-Step’ Methodological Proposal for a Review. Sustainability. 2021; 13(5):2756. https://doi.org/10.3390/su13052756
Chicago/Turabian StyleVitale, Federica, and Maurizio Nicolella. 2021. "Mortars with Recycled Aggregates from Building-Related Processes: A ‘Four-Step’ Methodological Proposal for a Review" Sustainability 13, no. 5: 2756. https://doi.org/10.3390/su13052756
APA StyleVitale, F., & Nicolella, M. (2021). Mortars with Recycled Aggregates from Building-Related Processes: A ‘Four-Step’ Methodological Proposal for a Review. Sustainability, 13(5), 2756. https://doi.org/10.3390/su13052756