Article

Sustainable Strategies for Marathon Tourism in the Time of Pandemics

1
Department of Business Administration, Cheng Shiu University, No. 840, Chengcing Rd., Niaosong Dist., Kaohsiung City 83347, Taiwan
2
Department of Health Care Management, University of Kang Ning, No. 188, Sec. 5, Anchung Rd., Annan Dist., Tainan City 70970, Taiwan
3
Institute of Human Resource Management, National Sun Yat-Sen University, No. 70, Lienhai Rd., Gushan Dist., Kaohsiung City 80424, Taiwan
4
Institute of Business Administration, Cheng Shiu University, No. 840, Chengcing Rd., Niaosong Dist., Kaohsiung City 83347, Taiwan
5
North China University of Water Resources and Electric Power, Zhengzhou 450046, China
6
Center for Environmental Toxin and Emerging-Contaminant Research, Cheng Shiu University, Kaohsiung 83347, Taiwan
7
Super Micro Mass Research and Technology Center, Cheng Shiu University, Kaohsiung 83347, Taiwan
*
Authors to whom correspondence should be addressed.
Sustainability 2021, 13(5), 2758; https://doi.org/10.3390/su13052758
Submission received: 25 January 2021 / Revised: 18 February 2021 / Accepted: 24 February 2021 / Published: 4 March 2021
(This article belongs to the Special Issue Sports Tourism and Sustainability)

Abstract

:
This study established a new assessment framework to explore the mutual influences of the international marathon tourism indices. A hybrid multiple-criteria decision-making model was used to determine solutions. The surveyed expert team revealed that satisfaction with the Kaohsiung International marathon indices requires improvement, especially in the age of pandemic crisis. To make marathon tourism sustainable, we propose the following systematic improvement procedures: Decision-makers should improve the manager’s professional capabilities and ability to use a comprehensive thinking model to solve problems. Next, managers should invite tourism practitioners from neighboring areas to provide more diverse food and performances along the marathon route. Citizens should be invited to join the cheerleaders to create a lively atmosphere. In addition to the full marathon and half marathon, a completion certificate and a better gift should be provided to participants of races of other distances to increase their sense of self-worth and to encourage more runners to participate, thereby ensuring a more robust crowd of runners at the starting line.

1. Introduction

Marathons (road running events) have become a global trend, and runners from around the world participate in well-known international marathons. In addition to visiting sports venues, people visit cultural, historical, and natural attractions close to the sites of sporting events [1,2]. Marathon runners generally have a higher education level, income, and overall socioeconomic status than average people [3,4]. This is particularly true for runners participating in major domestic and international marathons [5]. The tremendous economic benefits of sports tourism extend to the food service, hotel, and transportation industries in the host city [6,7]. Marathons contribute to marketing the host city [8], and runners have increased willingness to revisit cities hosting well-known marathons [9].
The number of marathons hosted in Taiwan has been consistently increasing. In 2015, for example, a total of 740 marathon events were held in Taiwan, with an average of 14.2 events per week in different cities. Runners participating in marathons also visit local attractions, which helps tourism in the host city. Hosting marathons promotes businesses in the leisure industry and the development of local industries by attracting tourists. Accordingly, some industries have prospered following people’s increasing interest in marathons. With the monthly organization of marathons in Taiwan, this type of sports event has gained unprecedented popularity; races generally reach maximum capacity shortly after registration opens. Despite the continuance of the marathon trend in Taiwan, registration rates for some destination marathons have started to decline considerably.
Similarly, the global number of participants in marathons reached its peak in 2016 and has since exhibited a declining trend [10]. Runners’ race-related demands have changed over time [11]; therefore, formulating improvement strategies is necessary to facilitate the sustainable development of marathons. Event managers must identify runners’ needs and preferences to clarify their priorities and must execute improvement strategies using limited resources to attract runners. Event managers should not consider international marathons as merely normal sporting events; instead, they should broaden their vision to include all tourist attractions in the region of a race in their systematic planning [12,13]. Multiple-criteria decision-making (MCDM) is widely applied in various problems related to assessment and selection, and it exhibits outstanding assessment performance under many constraints. Data from expert interviews are used. A matrix is utilized to analyze various complex data, and solutions are offered for the problem, which helps decision-makers establish optimal improvement strategies [14,15]. To date, several studies have utilized MCDM to study problems related to sports, such as identifying strategies for the sustainable development of sports tourism [16], creating an assessment model for management strategies of sports centers [17], and promoting the professional development of the sports industry [18].
Few studies have investigated the interrelations and dependency of the tourism indicators of major marathons, and studies of improvement strategies are even rarer. The results of this study expand the theories on the sustainable development of marathon tourism in the literature, and it improves the understanding of the motivation of runners to revisit marathon destinations.
This study is organized as follows: Section 2 provides the literature review. In Section 3, the research methodology is introduced. Section 4 presents the results of empirical research. The discussion is provided in Section 5. Finally, Section 6 provides the conclusions and suggestions for future studies.

2. Literature Review

In this study, a theoretical framework of the sustainable development of marathon tourism was established. This section is divided into two subsections. In Section 2.1, the influencing indicators of marathon tourism are discussed, and in Section 2.2, pretests that were used to establish the framework indicators are explained.

2.1. Influencing Indicators of Marathon Races

2.1.1. Playfulness

People have fun and enjoy the entertaining atmosphere when participating in marathon races [19]. Runners’ sense of belonging to their particular group is a crucial factor that motivates them to participate in races [20,21]. Most participating runners stay near the course for a night and socialize with friends in the running community [22]. Sharing information regarding marathon activities among runners’ clubs or road running groups can promote friendship among runners [23,24]. Participating athletes wear colorful clothing or special accessories, which increases the entertainment value of sporting activities [25,26]. A large, passionate audience typically cheers along running routes, and local performances and food are provided [20]. Runners may visit tourist attractions nearby or enjoy local delicacies after the marathon; this renders the entire event enjoyable [27,28].

2.1.2. Service

Excellent professionalism and assistance from staff members or volunteers can enable hosts to maximize the results of an event [29,30]. Key aspects of service excellence are exquisite medal designs, rapid delivery (of achievement certificates, souvenirs, and meals), appropriate arrangements for supply stations, sufficient and diverse supplies of water and food, appropriate traffic control, clarity of signs (e.g., mile markers), and freedom from interference from cars and spectators [7,31]. The promotion of sporting events and the development of regional sports tourism networks are closely related [12]. Therefore, participating athletes usually receive promotional materials, such as small pamphlets, flyers, travel guides, or coupons for local attractions, accommodations, and restaurants from the event organizer [7]. Numerous athletes choose to participate in races because of the availability of convenient parking and public transportation or because of the accessibility of the racecourse [4,29].

2.1.3. Runners

Participating athletes feel proud to be able to participate in long-established or well-known sporting events and experience a tremendous sense of achievement afterward [26,32,33]. To participate in races, runners undergo training to improve their physical abilities, and such training improves both their race performance and health [4,22]. Most participating athletes visit local attractions and purchase souvenirs and gifts after races [23,24]. Runners also receive attractive souvenirs and various benefits from race participation, which makes them feel that the registration fee that they paid was reasonable. The time and money spent on tourism after a race relative to its benefits are comparable to the cost-effectiveness of a journey undertaken purely for tourism [4,25].

2.1.4. Aesthetics

Marathon organizers incorporate magnificent views including special architecture and breathtaking natural scenery into racing routes to display the tourism strengths of the host city [7,25]. The scenes visible at the event are carefully designed, and numerous auxiliary features are offered, such as food vendors, accessory booths, concerts, and raffle counters [34]. The magnificent scene of a crowd running together encourages runners to run fast [35].

2.2. Pretest of Indicators

The researchers used semi-structured questionnaires to conduct a two-part pretest of indicators. In the first part, indicator importance was rated using a 5-point rating system, ranging from 5 denoting extremely important to 1 denoting extremely unimportant. The criteria were identified from the literature. The questionnaire survey was conducted through face-to-face interviews with 14 experts. Criteria and their definitions were improved through consultation with the experts. The experts included one senior civil servant at the competent authority, one manager at a public relations agency that manages sporting activities, 10 marathon runners, and 2 university professors familiar with marathon hosting. A rating of 4 or higher indicated substantial importance; thus, we used 4 as the threshold value for relevant indicators. In our first investigation, we retained the criteria with an importance value higher than 4. A second investigation was then conducted with the experts concerning the criteria with importance values between 3 and 4 to determine whether to retain or eliminate these factors to ensure the validity of the research framework. Four dimensions and 14 criteria were ultimately included in the framework, as shown in Table 1.

3. Methodology

This study adopted expert questionnaires and conducted data analysis using a hybrid MCDM model. This section is divided into two subsections. Section 3.1 details the analysis method, and Section 3.2 presents the analysis procedure.

3.1. Analysis Method

A hybrid MCDM model is a combination of three research methods: the Decision-Making Trial and Evaluation Laboratory (DEMATEL), DEMATEL-based analytic network process (DANP), and modified VIšekriterijumsko Kompromisno Rangiranje (VIKOR; mV). In this study, the model was developed in three stages. We used DEMATEL in the first stage to develop the total influence matrix and influential network relation maps (INRM) for the dimensions and criteria. In the second stage, we used the data from the total influence matrix obtained in the first stage in DANP calculation and obtained influential weights (IW). In the third stage, we used mV to ensure the performance of indicators. Finally, a systematic review based on INRMs was conducted to identify the root cause of the problem, which enabled us to propose strategies for continual improvement.
DEMATEL was originally used to solve complex engineering problems [38,39]. In this technique, pairwise comparisons are made to evaluate the degree to which factors influence each other. We constructed an influence matrix for each expert using their opinions on the relative influence of the criteria. Subsequently, a calculation procedure that compiled the expert opinions was conducted to acquire the total influence matrix, from which the INRM was obtained [40]. The analytic network process (ANP) entails analyzing the feedback and dependency relationships of each factor in a system, enabling the resulting factor weight to more accurately reflect real-world situations [41]. Scholars have integrated DEMATEL and the ANP, simplified the algorithm and developed the DANP, which provides the weights of influencing factors [42]. Scholars have continued improving on the DANP and substantially reduced the number of items and the time required for addressing questions [43], and they have indirectly increased the quality of expert opinions. The goal of conventional VIKOR is to find the gap between each factor and the factor with optimal performance to serve as the basis for improvement [44]. Scholars have used the concept of the aspiration level to further develop mV [45]. Scholars have since integrated IWs with mV and achieved comprehensive assessment of performance [46].
A certain degree of correlation exists between factors in the real world, and a certain level of conflict exists between characteristics. The MCDM method is not limited by this assumption of independence. In this study, comprehensive and systematic improvement strategies were proposed to replace the conventional evaluation method based on the relative influence of criteria [47], thus yielding considerable contributions to the topic theoretically and practically. We adopted a hybrid MCDM model combining the DEMATEL, DANP, and mV as our research method. The MCDM model has previously been applied in sports-related fields [17,48]. Therefore, this analytical method should be effective for sports tourism.

3.2. Analysis Procedure

The hybrid MCDM model used in this study involves a new calculation method that simplifies the conventional calculation process. It employs a succinct calculation process to resolve the diverse and complex problems of the real world [43]. The calculation process is described below.

3.2.1. Step 1. Establish a Personal Direct Influence Matrix

Through paired comparison, the personal direct influence matrix of H experts (H denotes the number of experts) is obtained: D h = [ d i j h ] n × n   for   h = 1 , 2 , , H , as shown in Equation (1). The crisp values of 0, 1, 2, 3, and 4 are used as assessment levels. The scope is the linguistic variable, ranging from no influence (0) to extremely high influence (4).
D = [ d 11 d 1 j d 1 n d i 1 d i j d i n d n 1 d n j d n n ]

3.2.2. Step 2. Calculate the Average Direct Influence Matrix

Calculate the arithmetic mean of the direct influence matrix A of H experts, a i j = 1 H h = 1 H d i j h , as shown in Equation (2).
A = [ a 11 a 1 j a 1 n a i 1 a i j a i n a n 1 a n j a n n ]

3.2.3. Step 3. Run the Consistency Test

Use the consistency test to verify the degree of consensus of the experts’ opinions. A consistency value smaller than 0.05 means that the expert groups’ consensus reached 95% confidence interval [43].
c o n s i s t e n c y =   1 n ( n 1 ) i = 1 n j = 1 n ( | a i j H a i j H 1 | / a i j H )

3.2.4. Step 4. Obtain the Normalized Influence Matrix

Divide all factors in matrix A by the maximum value of the sum of each row and column to obtain the normalized influence matrix X, as shown in Equations (4) and (5).
X = A / m
m = max [ max 1 i n j = 1 n a i j , max 1 j n i = 1 n a i j ]

3.2.5. Step 5. Obtain the Total Influence Matrix

By using Equation (6), the total influence matrices T D   and   T C of dimensions and criteria are obtained. I is an identity matrix of n × n .
T = X + X 2 + X 3 + + X e = X ( I X ) 1   for   lim q X q = [ 0 ] n × n

3.2.6. Step 6. Depict INRMs

The rows and columns of the matrix T = [ t i j ] n × n are added and obtained as u i and v i , respectively, as shown in Equations (7) and (8). Set ( u i + v i ) as the X axis and ( u i v i ) as the Y axis. Each factor is depicted on a two-dimensional coordinate. The values of ( u i v i ) of two factors are compared. The factor with a larger ( u i v i ) value influences the factor with the smaller value. The projection line denotes the direction of the influence, from the factor with the larger value to the factor with the smaller value. Finally, INRMs are generated.
u = [ j = 1 n t i j ] n × 1   for   i , j = 1 ,   2 ,   , n
v = [ i = 1 n t i j ] 1 × n   for   i , j = 1 ,   2 ,   , n

3.2.7. Step 7. Normalize the Total Influence Matrix

Matrix T is normalized using Equation (9) and T α is obtained. Equation (10) is used to transpose matrix T α into matrix W .
T α = [ t i j ] n × n / u
W = ( T α ) 1 d

3.2.8. Step 8. Generate Dimensions and Criteria Weight

The factors in matrix W are defined as w i j . Because 0 < w i j < 1 , after W is multiplied by itself β times, it will converge into a stable matrix W l . The local weight W D l of a dimension and the local weight W C l of a criterion are obtained, as shown in Equation (11).
W l = lim β ( W ) β

3.2.9. Step 9. Obtain IWs

W D l is multiplied by W C l , and the global weight W g of all criteria is obtained, which is the IW, as shown in Equation (12).
W g = W D l × W C l

3.2.10. Step 10. Calculate the Aspiration Level

In conventional VIKOR, the maximum value and the minimum value are adopted. However, this study aimed to improve on this method; thus, mV was used, in which the aspiration level was used to replace the maximum value. The satisfaction scope of criteria was set to the worst being f w o r s t (1 point) and the aspiration level being f a s p i r e d (7 points). The distance between f k j , which is the satisfaction degree of factor j of plan k , and the aspiration level was normalized, yielding r k j , as shown in Equation (13).
r k j = ( | f a s p i r e d f k j | ) / ( | f a s p i r e d f w o r s t | ) = ( 7 f k j ) / ( 7 1 )

3.2.11. Step 11. Obtain the Mean Group Utility for the Gap

The product of W j g and r k j is summed and obtained as the mean group utility S k , as shown in Equation (14).
S k = j = 1 n ( W j g × r k j )

4. Empirical Case

The hybrid MCDM model was used to analyze the Kaohsiung International Marathon and to determine improvement strategies to propose to decision-makers in order to improve the development of marathon tourism. This section is divided into three subsections: Section 4.1 details the case background and problem description; Section 4.2 describes data collection; and Section 4.3 provides the results.

4.1. Case Background and Problem Description

This study was a case study of the Kaohsiung International Marathon, which has been praised by participants as “the friendliest marathon.” The Kaohsiung City Government hosts the Kaohsiung International Marathon, which attracts approximately 20,000 Taiwanese and foreign runners annually. Since the Kaohsiung International Marathon was first held in 2010, city marketing has been its main focus. In 2019, it was selected by the Sports Administration as one of the four major marathons in Taiwan. By hosting this international city marathon, the city government can conduct international exchange and visits with neighboring friendly cities, expand overseas participation channels, and cooperate to create a win–win situation. Furthermore, through this marathon, the city government has endeavored to expand its scope to become an international city. Regarding its characteristics, the marathon increases attention on the tourist spots of the city and encourages citizens to cheer for participants. Additionally, cheerleading groups characterized by certain features are arranged along the trail to cheer for participants, and cooks are invited to prepare food and supply diverse dishes. All these measures are aimed at attracting more people to register, and visitors generate tourism benefits for the city. However, the crowd often disperses once the race concludes, which prevents maximization of the benefits on the sports economy. Thus, it is critical to determine how marathons should be hosted to attract the maximum number of participants and what additional incentives should be included to motivate people to register for such an event. Moreover, integrating marathons into tourism to establish a sports tourism industry chain is a direction for event managers to pursue creatively. Therefore, this study aimed to discover the root of the problem and to establish a comprehensive improvement strategy.

4.2. Data Collection

The members of the expert group were civil servants with long-term experience in business or research related to marathon tourism, race promoters, travel agents, marathon runners, and academics. Specifically, the group consisted of 34 members, namely 2 civil servants, 2 case officers of the race, 2 travel agents who work on marathon travel-related bookings, 24 runners, and 4 professors from the department of leisure management. The questionnaire consisted of two parts. In the first part, the influencing factors were compared. This questionnaire survey was conducted face to face to enable the expert group to understand the questions and to provide correct data. Why the respondents gave particular answers was also investigated. The interview duration was approximately 1 h. The second part of the questionnaire examined the expert group’s satisfaction with the Kaohsiung International Marathon. Possible scores ranged from 1 to 7, with 1 denoting extremely dissatisfied and 7 denoting extremely satisfied.

4.3. Results

The left sides of Table 2, Table 3, Table 4, Table 5 and Table 6 depict the average influence matrix of the dimensions and criteria. The right sides of the tables indicate the total influence matrix. The consistency test values of all the average influence matrices were <0.05, showing that the expert group reached a consensus.
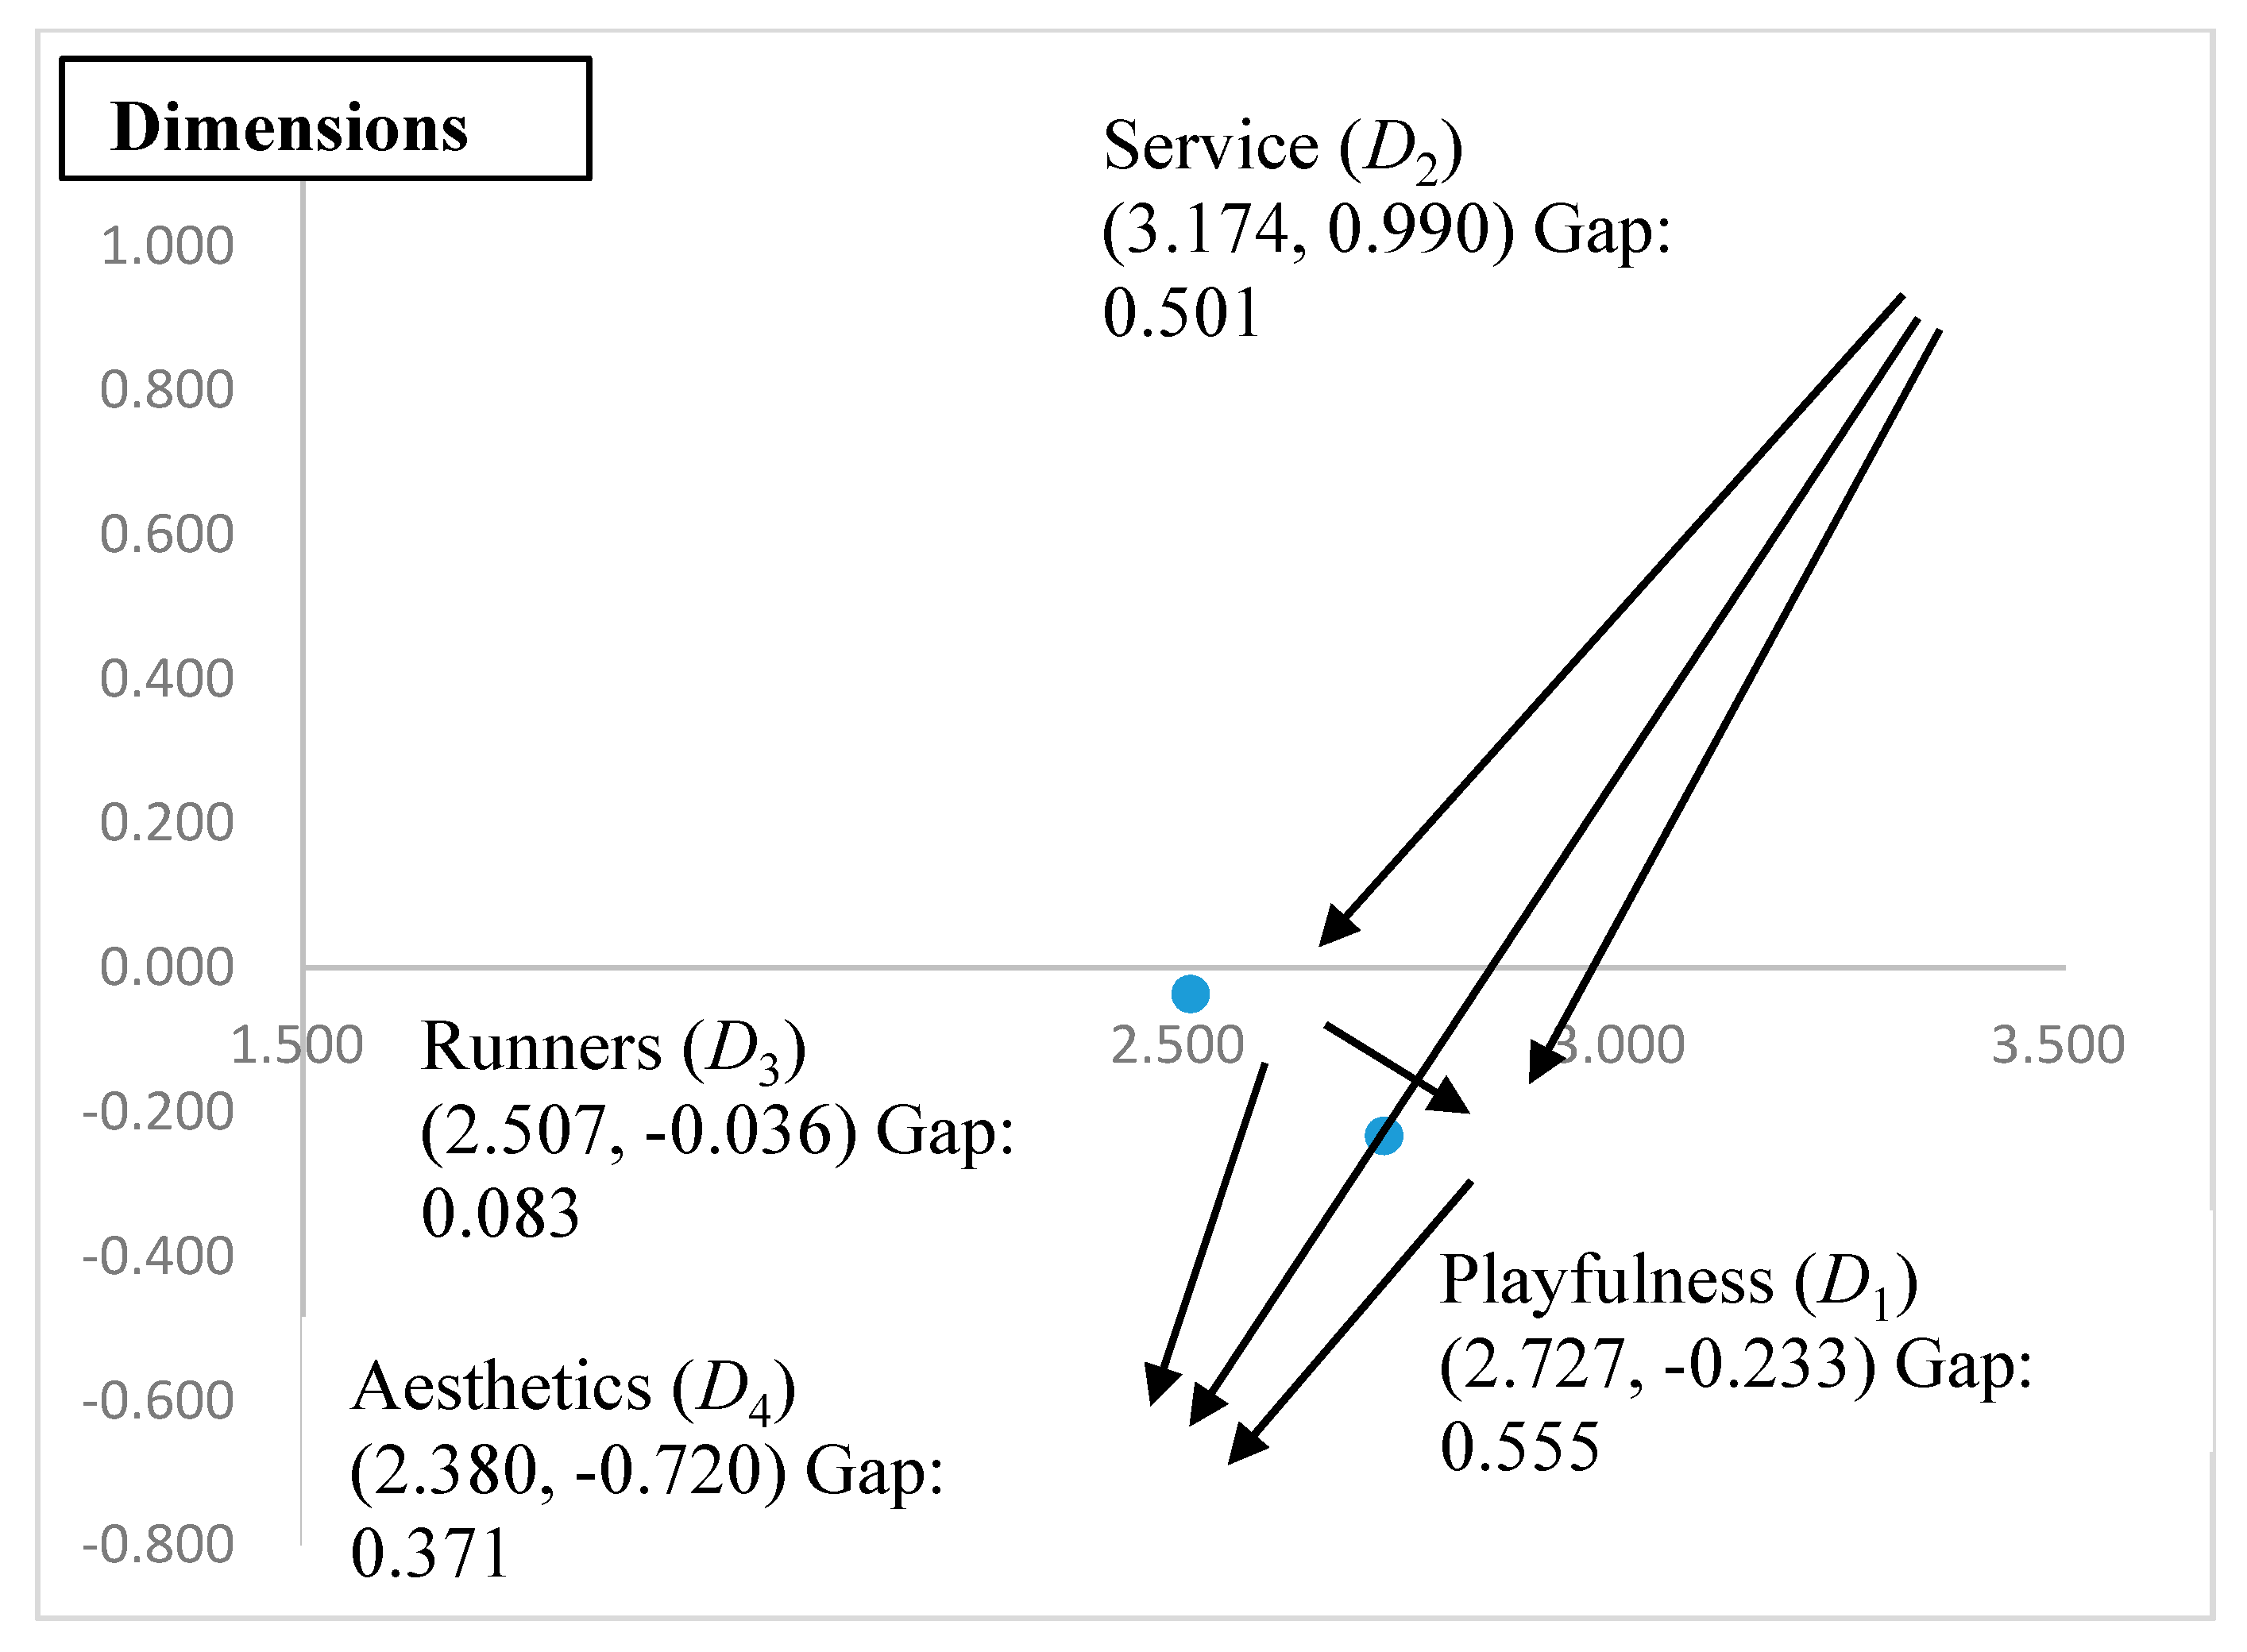
According to Table 7, INRMs were plotted (Figure 1, Figure 2, Figure 3, Figure 4 and Figure 5). According to Figure 1, for Service (D2),   ( u v ) > 0 , meaning that it affects other factors. The other three dimensions, namely Playfulness (D1), Runners (D3), and Aesthetics (D4), are the dimensions being influenced. When directly referring to the INRM of Service (D2) (Figure 3), for Event Manager (C21) and Accessibility (C24), ( u v ) > 0 , meaning that these two criteria affect other criteria, whereas for Traffic Flow Planning (C22) and Information (C23), ( u v ) < 0 , meaning that these criteria are influenced by other criteria. Therefore, if decision-makers wish to effectively improve the performance of Service (D2), they should focus on Event Manager (C21) and Accessibility (C24). In addition, because the other three dimensions (D1), (D3), and (D4) are influenced factors, not much attention should be given to them (Figure 2, Figure 3 and Figure 5).
Table 8 lists the IW and gap of each factor. The total local weight of four dimensions is 1. Under each dimension, the total local weight is 1. Therefore, the total weight of the four dimensions is 4. The total global weight of all criteria is 1. The local weights of each dimension are, in descending order, 0.272 for Playfulness (D1), 0.271 for Aesthetics (D4), 0.232 for Runners (D3), and 0.225 for Service (D2). Thus, if decision-makers wish to improve marathon runners’ participation intention, their focus should be distributed in this sequence. Total performance is 4.700 (out of 7), showing that it can still be improved. The performance of the dimensions is, in descending order, 6.505 for Runners (D3), 4.776 for Aesthetics (D4), 3.997 for Service (D2), and 3.668 for Playfulness (D1). All criteria performance values in Runners (
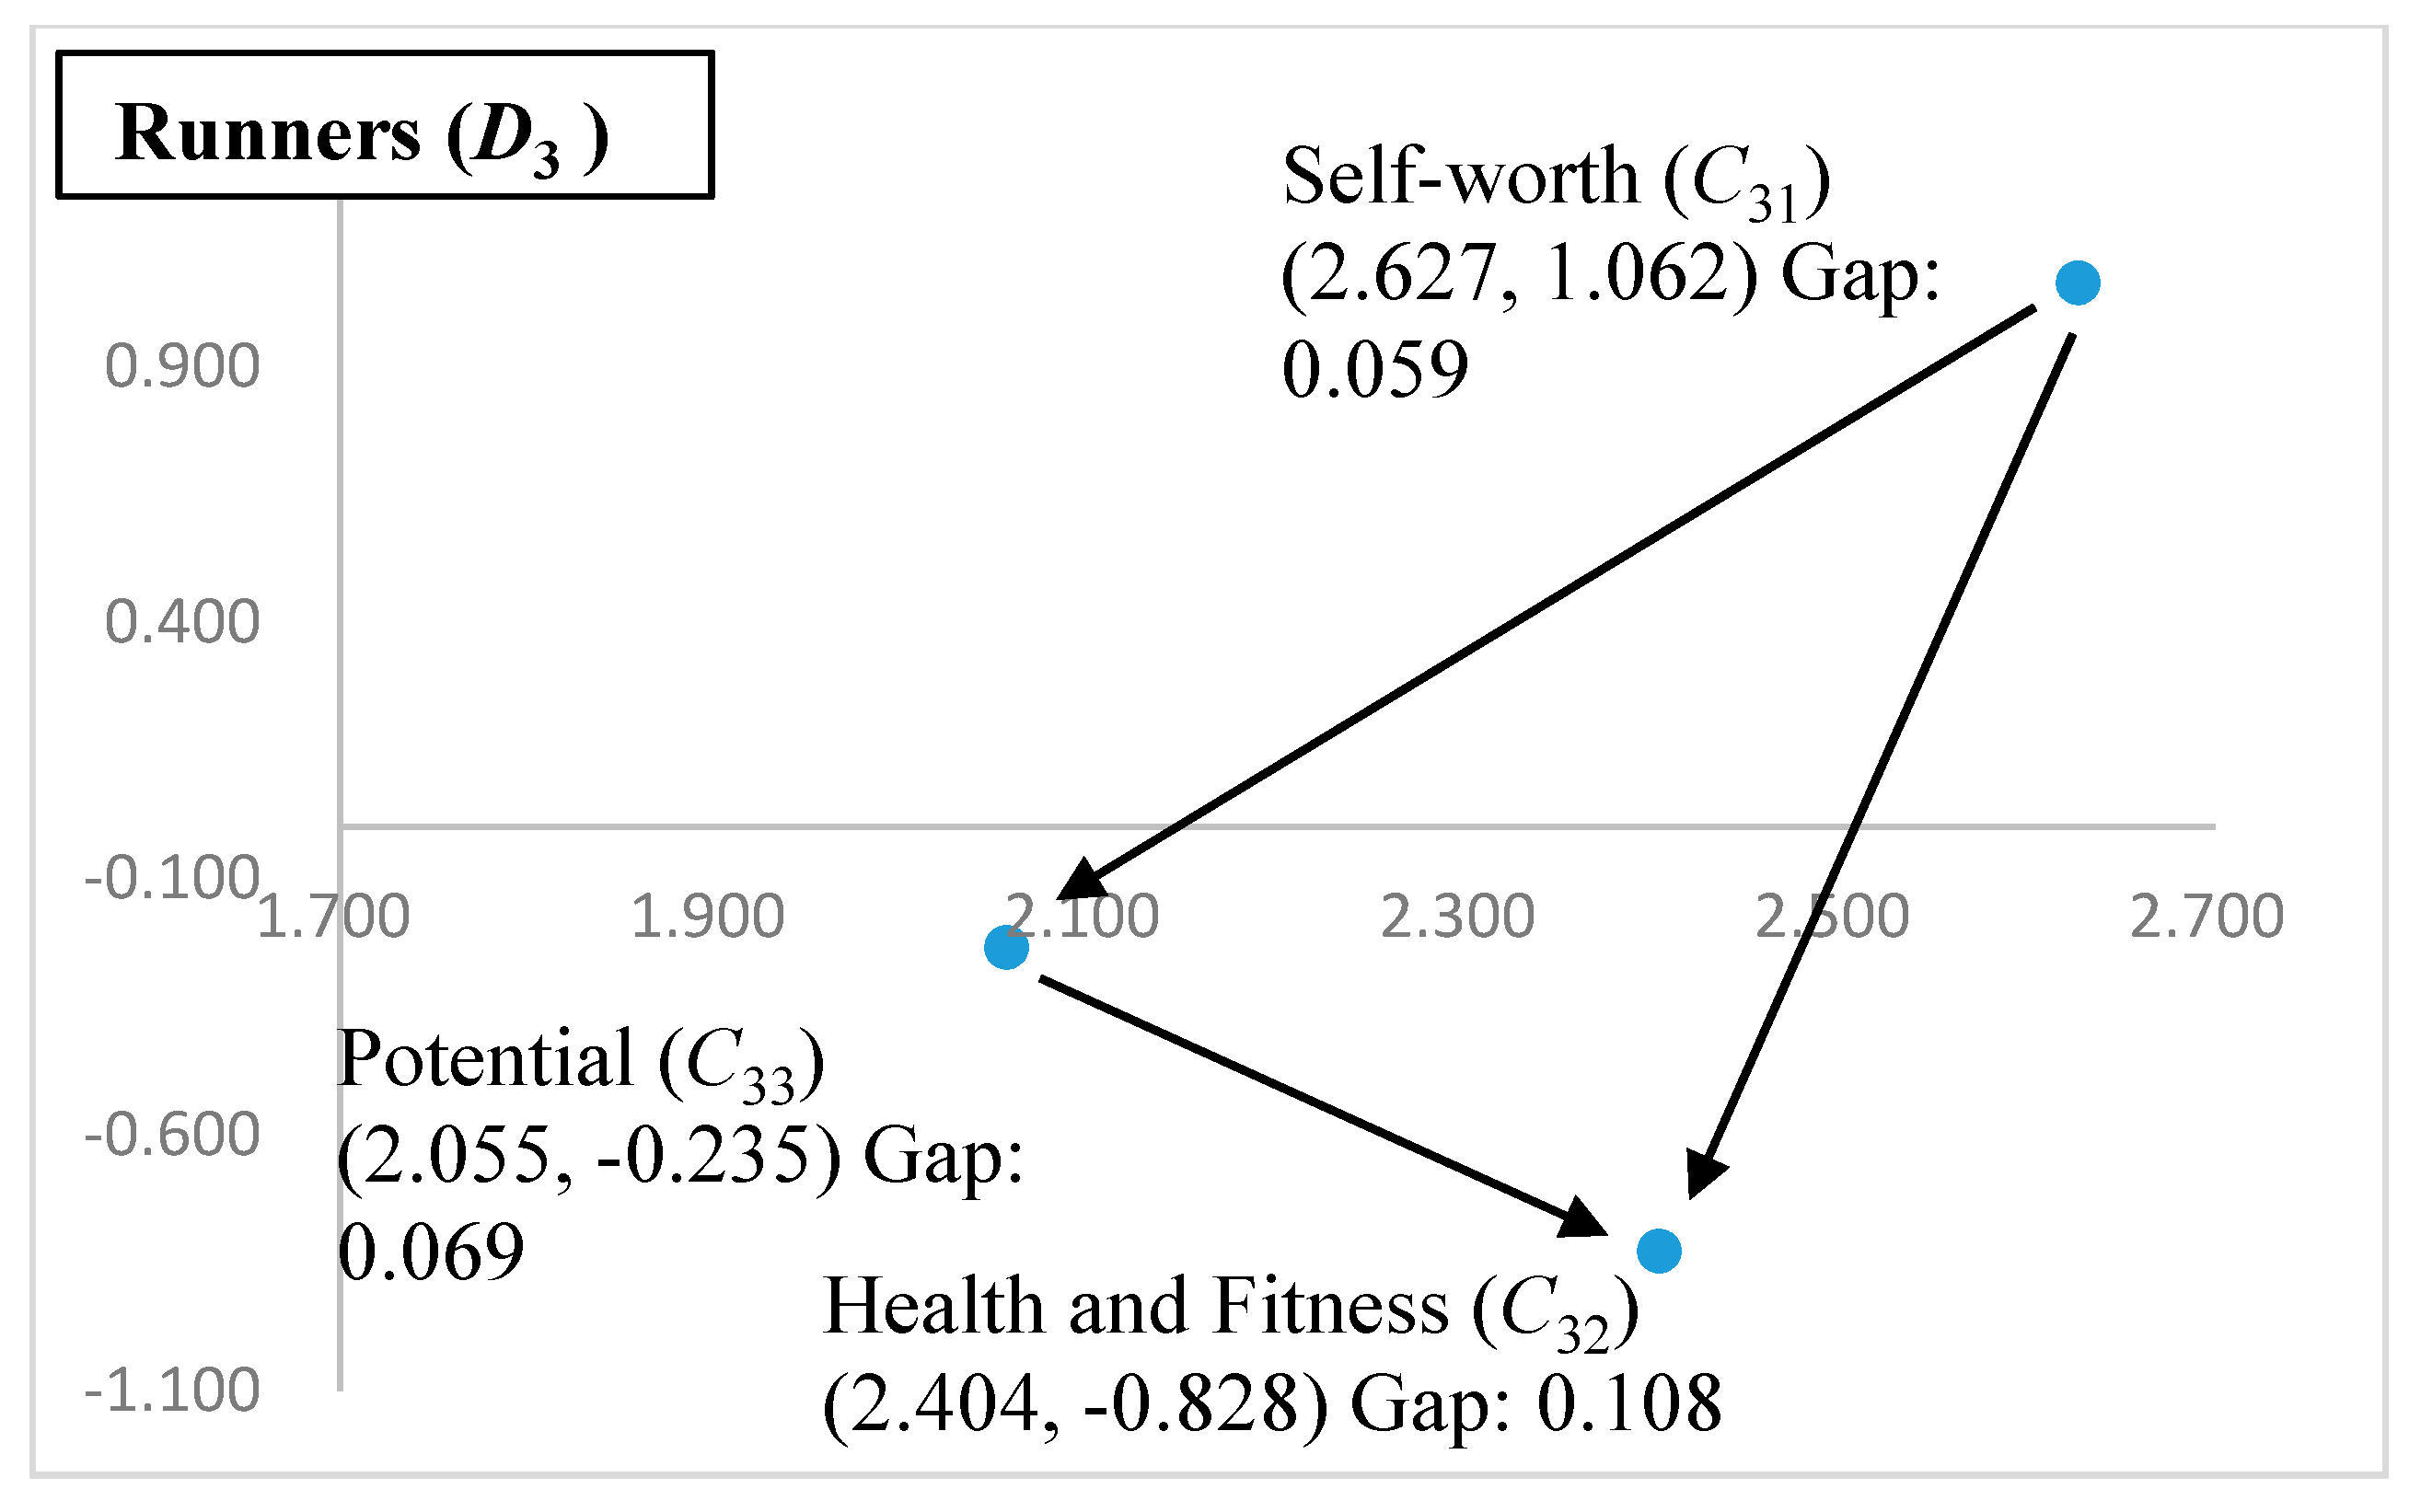
D3) are greater than 6, meaning that runners were highly satisfied with the benefits received from the marathon.
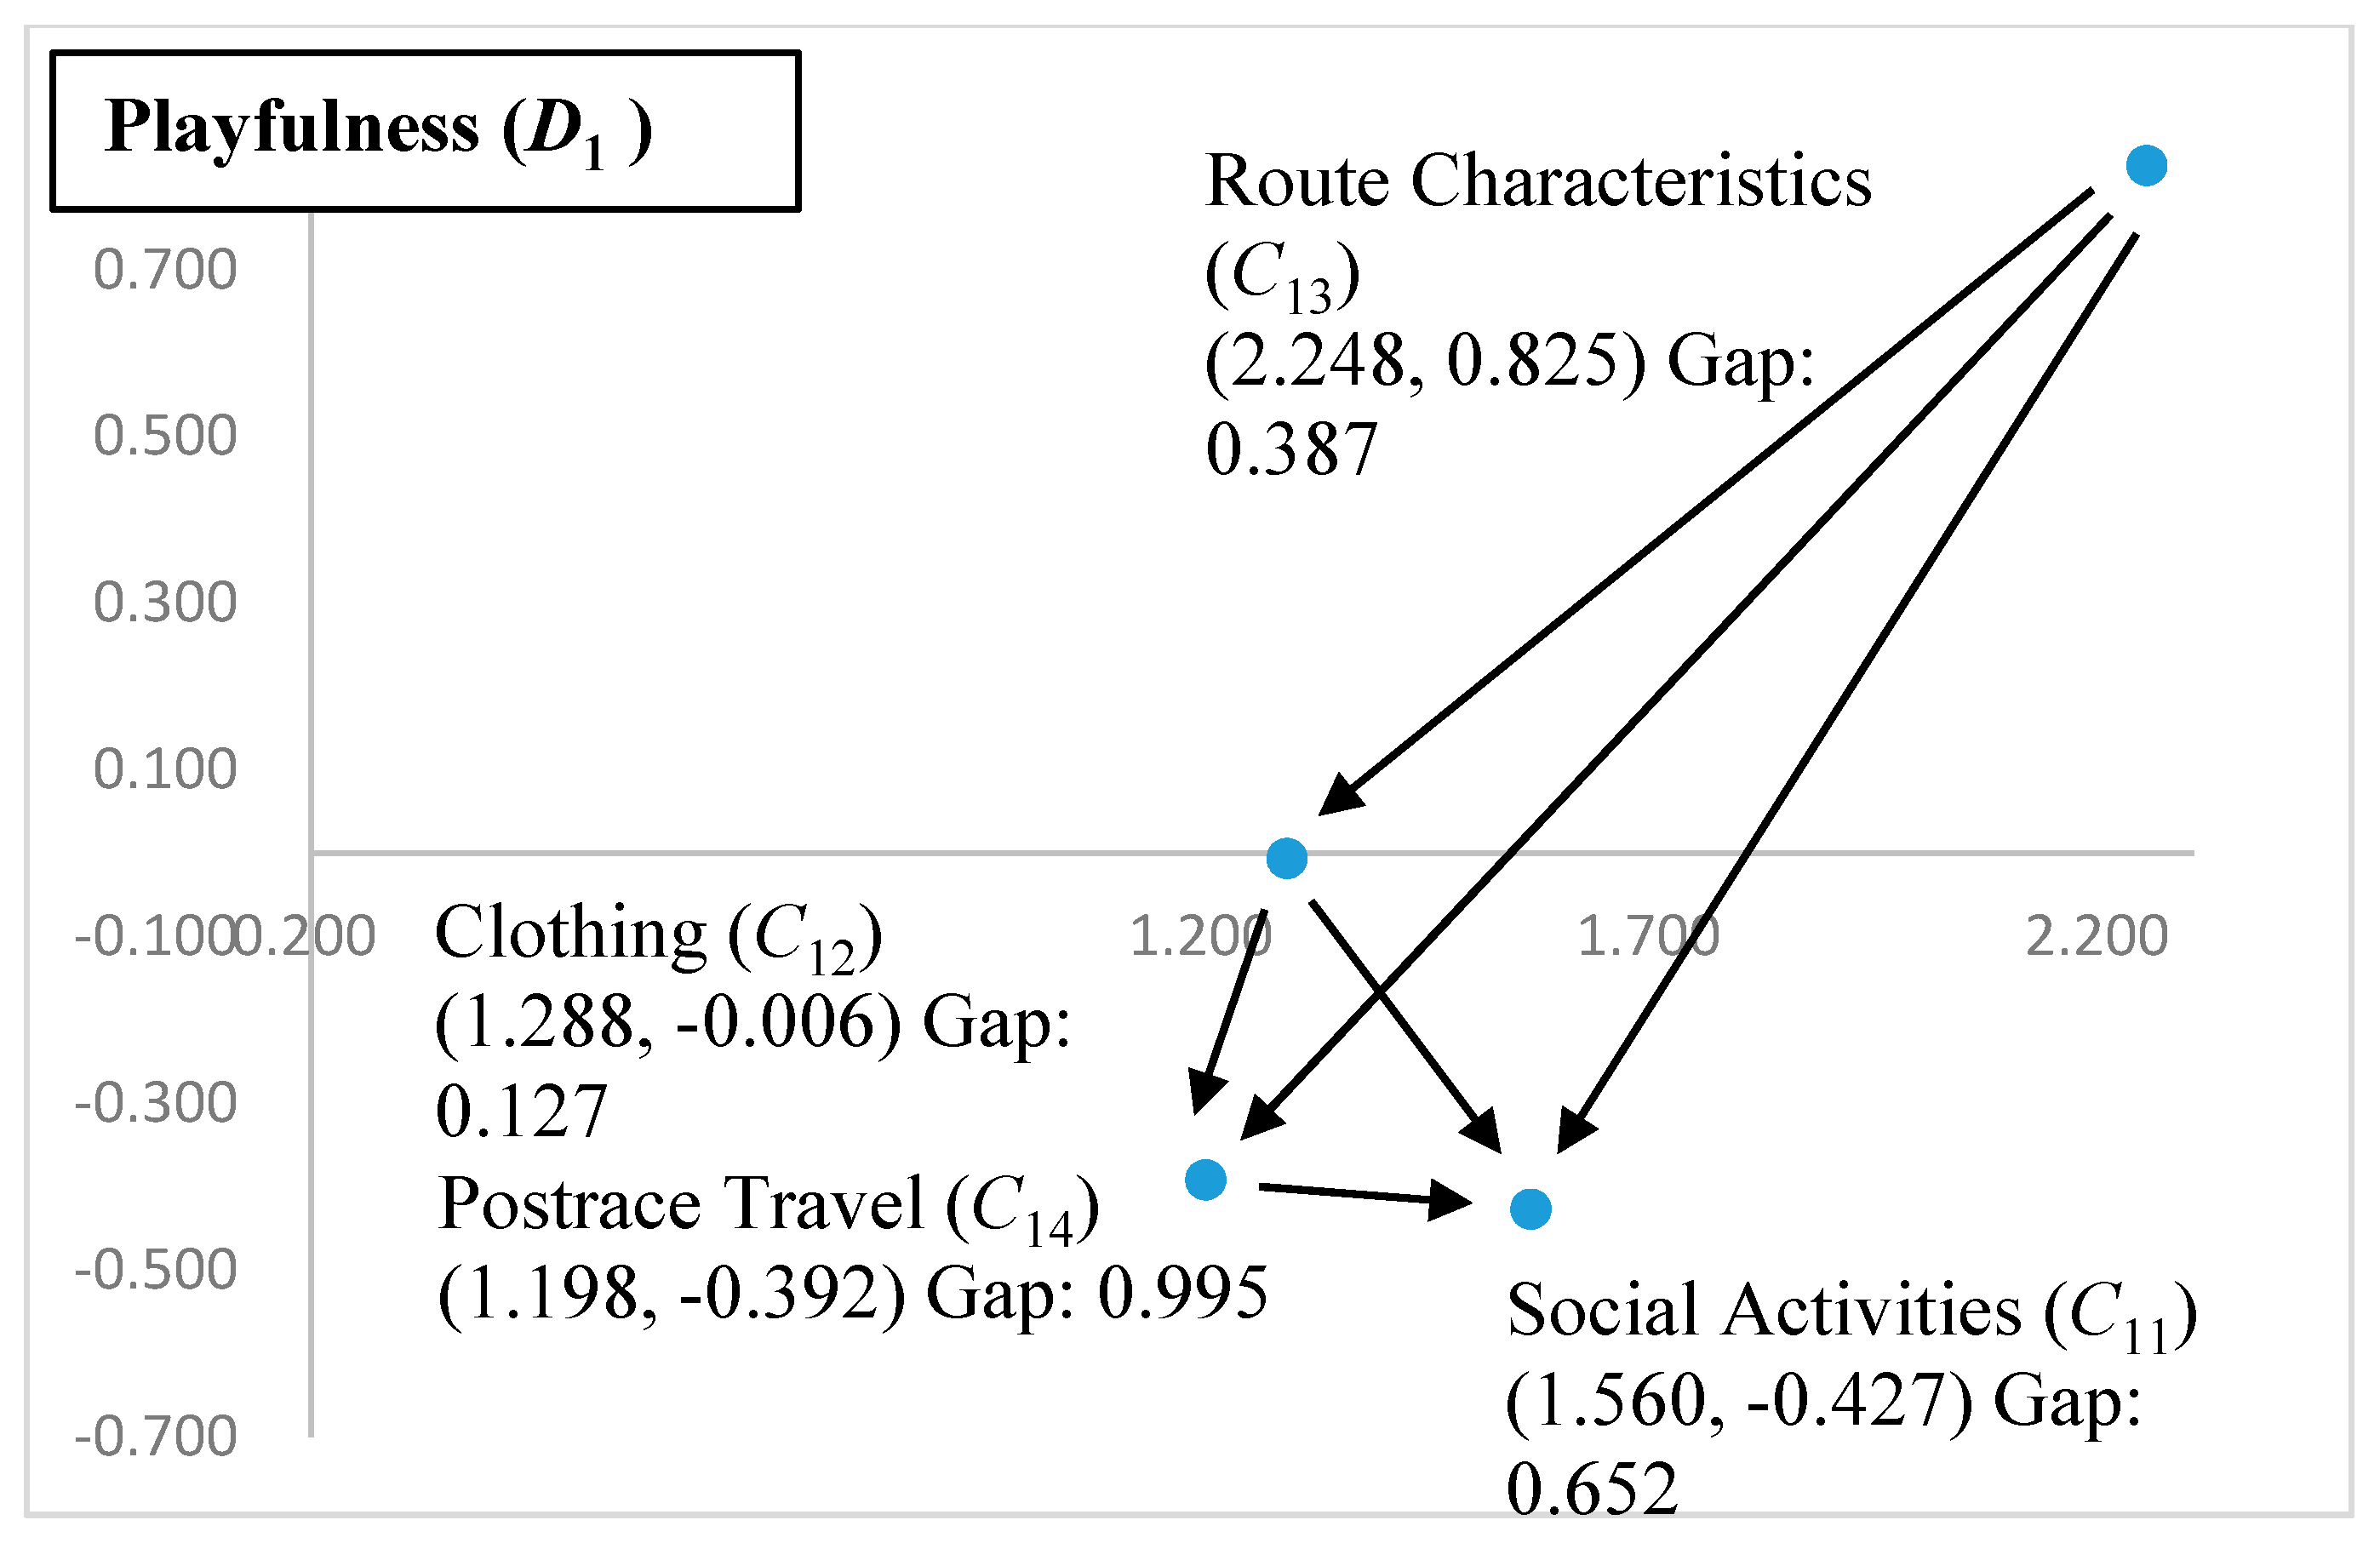
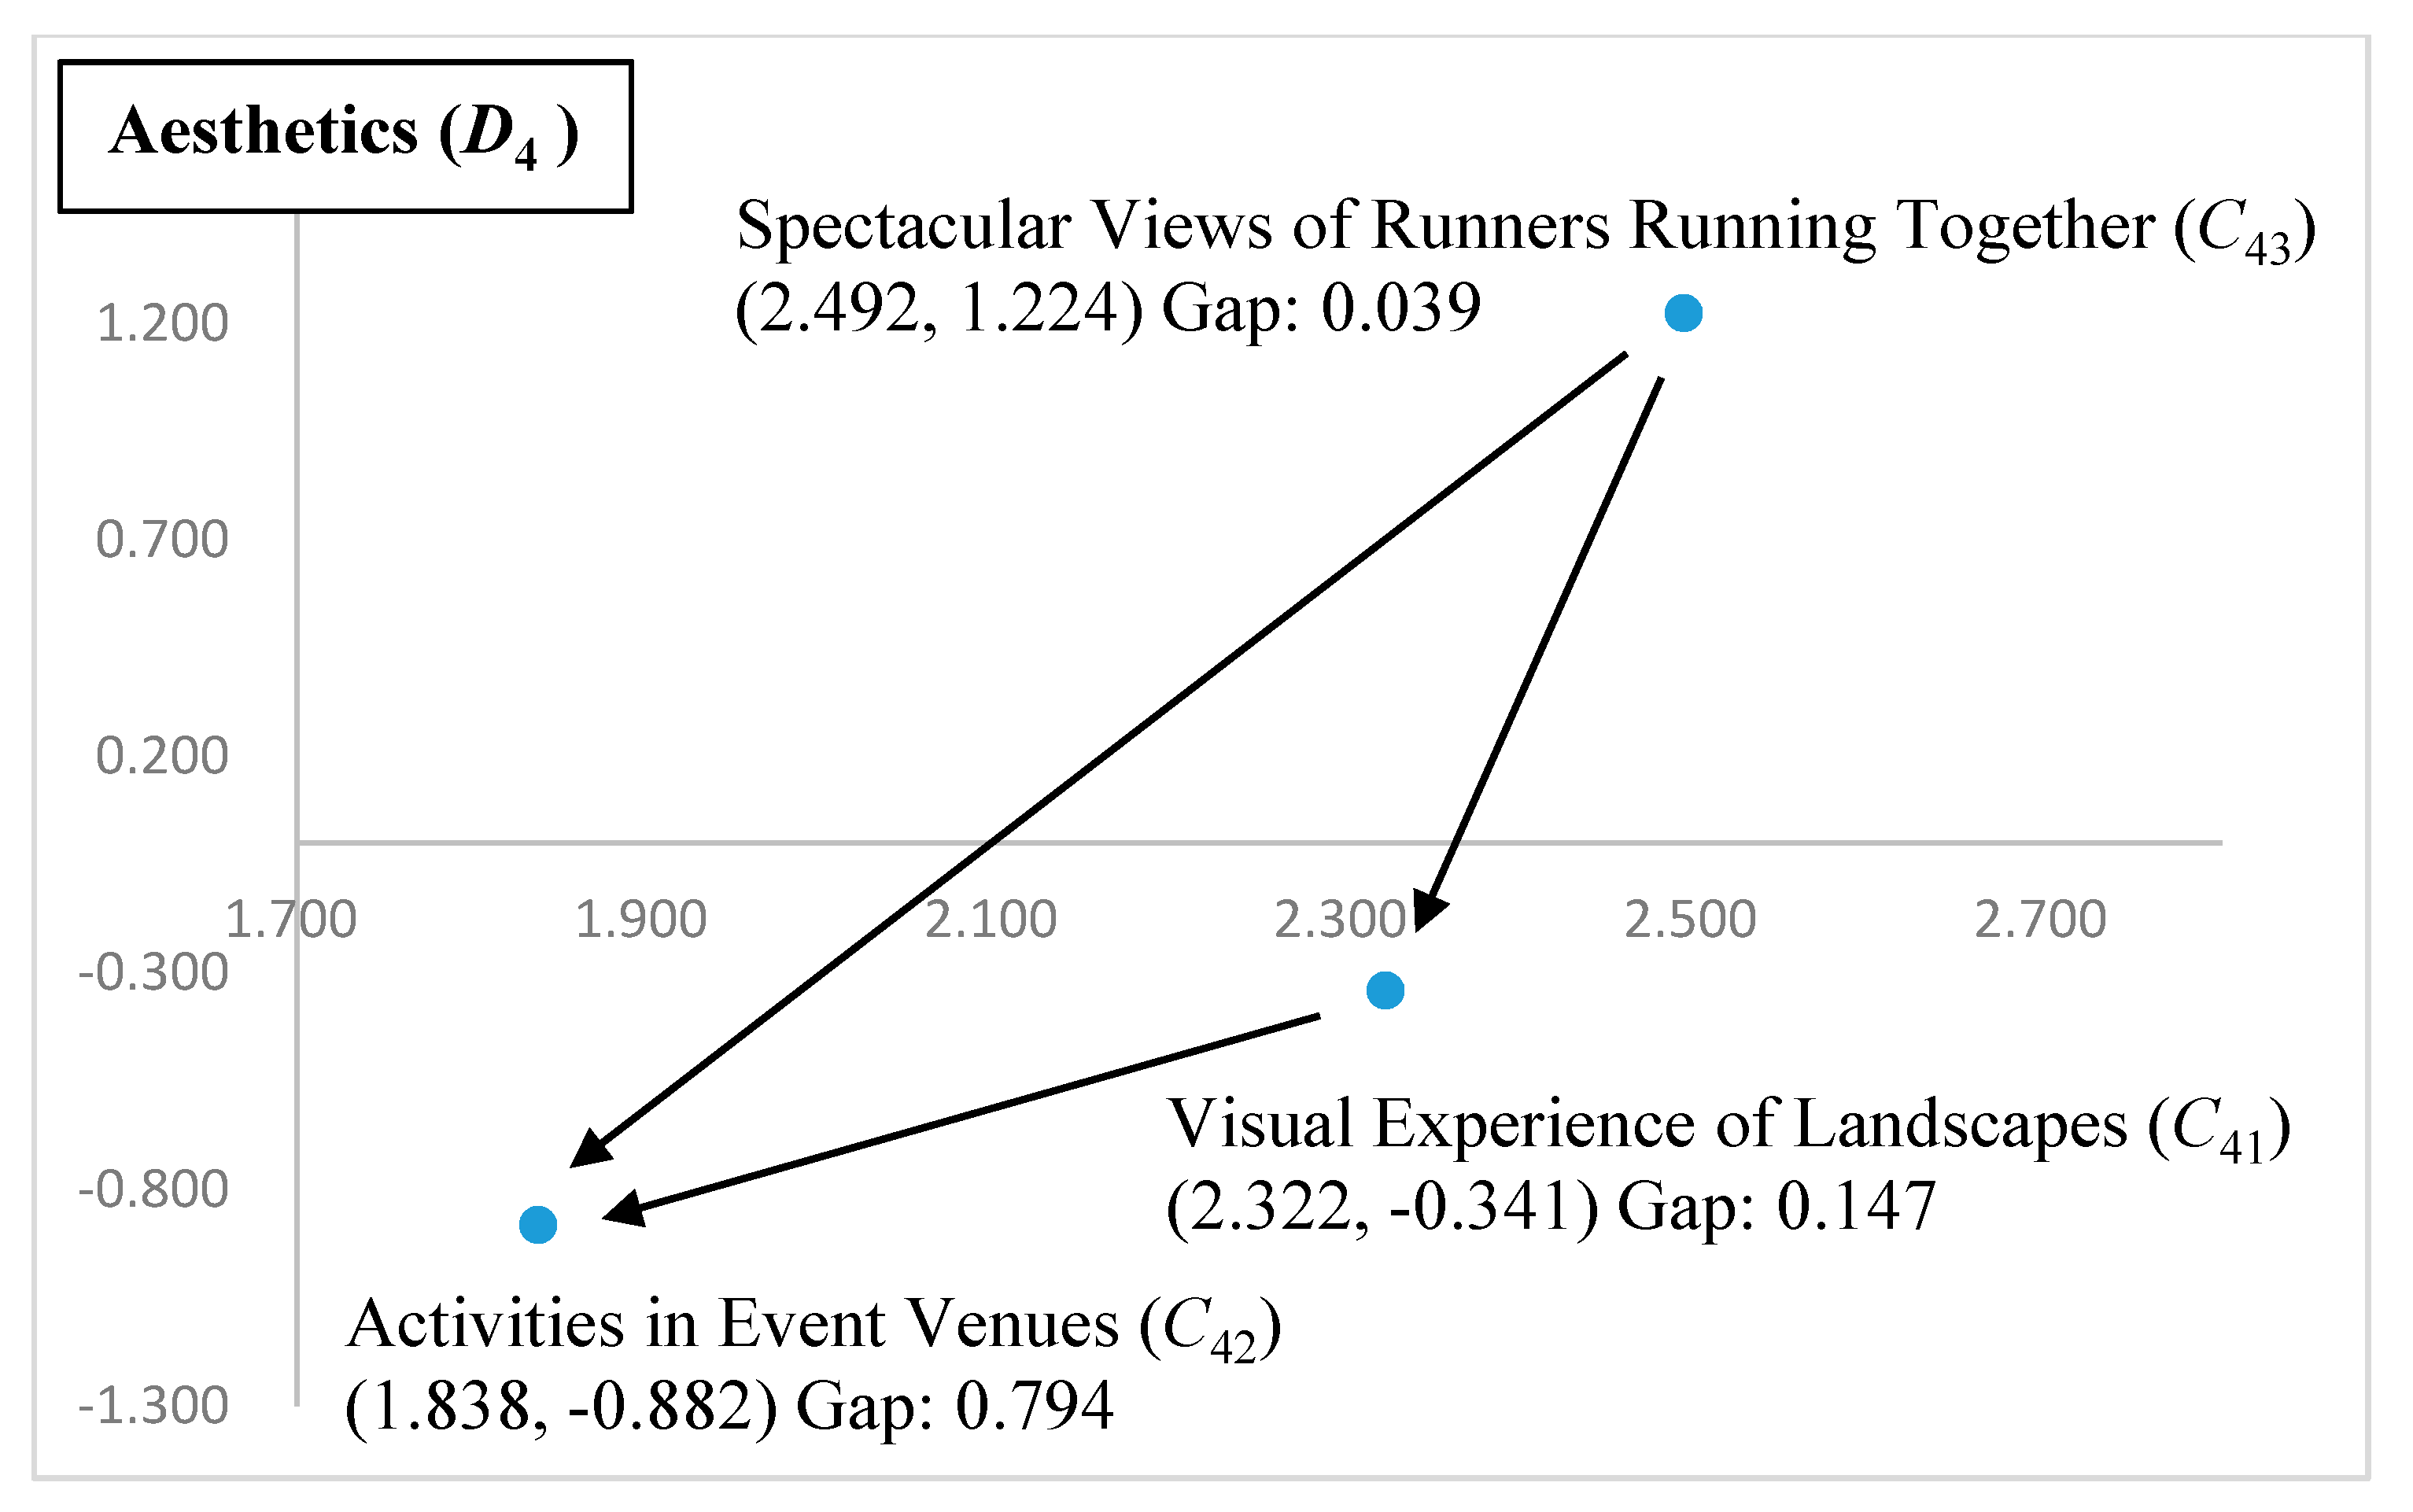
The dimension with the largest gap value (0.555) is Playfulness (D1). In D1, the greatest gap is 0.995 for Postrace Travel (C14), which also has the largest gap of all criteria. This shows that for runners, among the criteria for improving marathon tourism performance, Postrace Travel (C14) is the least impactful. The largest gap in Service (D2) is 0.711 for Information (C23). The largest gap in Runners (D3) is 0.108 for Health and Fitness (C32), and the largest gap in Aesthetics (D4) is 0.794 for Activities in Event Venues (C42).

5. Discussion

The results obtained using the hybrid MCDM model indicate that the performance of Playfulness (D1) was the worst. In D1, the level of satisfaction with Postrace Travel (C14) was the lowest because event managers consider marathons a 1-day activity. Thus, marathons are not extended or bundled into a multiday package. Without the benefits of traveling, runners’ fun does not achieve the maximum level. Such results well responded to the research finding of existing studies that the scale of the event can be a factor for the eventual effects generated by the sport tourism events [1,9]. Partially, such result can also be explained by the participation of consumers. Runners’ fun can be affected by the participating crowds (consumers). A richer event can attract more consumers to join [4,21], and thus has greater potential to increase runner-participants interactions for excitement and fun. According to conventional thinking, event managers should improve playfulness directly. However, improving playfulness does not address the fundamental problem. Problem-solving should employ holistic thinking; therefore, identifying dimensions that influence playfulness from the INRM would be helpful to solve problems. In this study, Service was the most crucial source of influence according to the INRM. As evident in Figure 2, Playfulness (D1) was affected by Service (D2) and Runner (D3). Because Runner (D3) is a factor influenced by Service (D2), it may not be considered when establishing strategies for improving marathons. Therefore, Service (D2) is the dimension of real influence. Among the four criteria in Service (D2), the ultimate source of influence is Event Manager (C21). Thus, event managers should change their thinking for problem-solving. They should adopt systematic thinking to find the source of problems and work to overcome those to improve marathon tourism.
The main reason for the ineffectiveness of the Kaohsiung International Marathon in promoting sports tourism appears to be the lack of postrace travel. However, existing studies have also revealed that the in-race contents can already be a satisfactory factor the contents are good enough [6,13,16]. Closer examination revealed that the main reason for the weak promotional effect was the lack of event managers’ professional capabilities. This suggests that if decision-makers wish to promote sports tourism through international marathons, more professional talent should be recruited to plan the event. The criteria with the worst performance in the other three dimensions were Information (C23), Health and Fitness (C32), and Activities in Event Venues (C42). Most of these are related to travel. From the study results, we can infer that runners of the Kaohsiung International Marathon are most dissatisfied with the city’s showcasing of its travel features, resulting in runners’ unwillingness to remain in the city for tourism.

6. Conclusions

We used a hybrid MCDM model to evaluate the effectiveness of the Kaohsiung International Marathon and to identify feasible improvement strategies. The main contributions of this study are as follows: First, for the sustainable management of international marathons, a literature review was conducted to reveal the main dimensions and criteria for evaluating the effectiveness of the promotion of international marathons. Moreover, DEMATEL was employed to verify the relationships between the dimensions and criteria and to construct INRMs. Subsequently, the DANP was used to generate the IWs of the dimensions and criteria, and mV was used to calculate the differences among the dimensions and criteria. We used hybrid research methods to holistically obtain key indicators to target the continual improvement of international marathons. This method helps to avoid myopic improvement suggestions that ignore the overall picture. The empirical case study verified the effectiveness of our model and method. Based on the study results, we recommend that the competent authority prioritize the professionalism of event managers as a direction for improvement.
Decision-makers should also invest more resources on the criteria with influence: Route Characteristics (C13), Self-worth (C31), and Spectacular Views of Runners Running Together (C43). Overall, runners were least satisfied with postrace travel. Therefore, event managers should invite business owners from neighboring areas to provide more diverse food and performances along the route. Moreover, citizens should be encouraged to cheer for runners to generate a lively atmosphere [25]. In addition to the full marathon and half marathon, a completion certificate and a better gift should be provided to participants of races of other distances to increase their sense of self-value and to encourage more runners to participate, thereby providing a more robust crowd of runners at the starting line.
Races should include activities that support marathon culture and promote appropriate attractions and shopping opportunities [23,24,25]. The insufficient professionalism of event managers is the fundamental reason for the weak promotional effect of the marathon under study. Sports event managers must be knowledgeable and experienced in planning sports tourism and should not view races as a 1-day event. The implication of the study results is that if a city wishes to advance an international marathon to the level of sports tourism, professional talent with experience in sports tourism should be recruited to plan and execute the event.
This study has two limitations. First, although it proposed an evaluation framework that can serve as a reference for other studies, the heterogeneity of the different areas under study should be considered. Therefore, future studies should consider differences in time and space when conducting further verification. Second, runners with various demographic characteristics may have different needs. Future studies should further analyze the differences in the demands of different groups of people.

Author Contributions

Conceptualization, K.-H.C. and J.-M.Y.; methodology, C.-C.K.; formal analysis, C.-C.K.; writing—original draft preparation, K.-H.C. and J.-M.Y.; writing—review and editing, F.-S.T.; All authors have read and agreed to the published version of the manuscript.

Funding

Partially supported by the national social science fund project “Research on Path Design and Policy Support for Rural Tourism in Ethnic Areas to Consolidate the Achievements of Poverty Alleviation” (20BSH062), the Rural Economics and Management Research Center of Southwest University “Kun Yuan Innovation Team”. Fu-Sheng Tsai acknowledges the visiting professorship from North China University of Water Resources and Electric Power.

Institutional Review Board Statement

Not applicable.

Informed Consent Statement

Not applicable.

Data Availability Statement

Data will be available by requesting from the corresponding authors.

Conflicts of Interest

The authors declare no conflict of interest.

References

  1. Caiazza, R.; Audretsch, D. Can a sport mega-event support hosting city’s economic, socio-cultural and political development? Tour. Manag. Perspect. 2015, 14, 1–2. [Google Scholar] [CrossRef]
  2. Masa’deh, R.E.; Nasseef, M.A.; Alshayeb, H.; Ojilat, J.; Alshafiee, M. The effect of sport tourism management on support for tourism development. J. Manag. Strategy 2017, 8, 20. [Google Scholar] [CrossRef] [Green Version]
  3. Funk, D.C.; Toohey, K.; Bruun, T. International sport event participation: Prior sport involvement; destination image; and travel motives. Eur. Sport Manag. Q. 2007, 7, 227–248. [Google Scholar] [CrossRef]
  4. Wicker, P.; Hallmann, K. Estimating consumer’s willingness-to-pay for participation in and traveling to Marathon events. Event Manag. 2013, 17, 271–282. [Google Scholar] [CrossRef] [Green Version]
  5. Li, Y.; Kim, A.; Liu, O.X.; Mastromartino, B.; Wang, Y.; Zhang, J.J. Impact of perceived value on behavior intention of parent-child runners in a marathon event. Sport Soc. 2020, 1–19. [Google Scholar] [CrossRef]
  6. Goodsell, T.L.; Harris, B.D.; Bailey, B.W. Family status and motivations to run: A qualitative study of marathon runners. Leis. Sci. 2013, 35, 337–352. [Google Scholar] [CrossRef]
  7. Nowak, P.; Chalimoniuk-Nowak, M. Running tourism in Poland example of tourist activity of Polish marathon runners. Br. J. Educ. Soc. Behav. Sci. 2015, 5, 416–425. [Google Scholar] [CrossRef]
  8. Go, F.M.; Chen, C.K.; Beek, R. How three Japanese city marathon brands overcame double Jeopardy. Asian Sports Manag. Rev. 2016, 31, 249–259. [Google Scholar]
  9. Zouni, G.; Markogiannaki, P.; Georgaki, I. A strategic tourism marketing framework for sports mega events: The case of Athens Classic (Authentic) Marathon. Tour. Econom. 2020. [Google Scholar] [CrossRef]
  10. Andersen, J.J. The State of Running 2019. Available online: https://runrepeat.com/state-of-running (accessed on 20 November 2020).
  11. Chen, N.; Ji, S.; Funk, D.C. An extended study on destination image decay of sport tourists over time. J. Destin. Mark. Manag. 2014, 2, 241–252. [Google Scholar] [CrossRef]
  12. Wasche, H.; Woll, A. Managing regional sports tourism networks: A network perspective. Eur. Sport Manag. Q. 2013, 13, 404–427. [Google Scholar] [CrossRef]
  13. Pouder, R.W.; Clark, J.D.; Fenich, G.G. An exploratory study of how destination marketing organizations pursue the sports tourism market. J. Destin. Mark. Manag. 2018, 9, 184–193. [Google Scholar] [CrossRef]
  14. Xiong, L.; Teng, C.L.; Zhu, B.W.; Tzeng, G.H.; Huang, S.L. Using the D-DANP-mV model to explore the continuous system improvement strategy for sustainable development of creative communities. Int. J. Environ. Res. Public Health 2017, 14, 1309. [Google Scholar] [CrossRef] [PubMed]
  15. Lin, P.J.; Shiue, Y.C.; Tzeng, G.H.; Huang, S.L. Developing a sustainable long-term ageing health care system using the DANP-mV model: Empirical case of Taiwan. Int. J. Environ. Res. Public Health 2019, 16, 1349. [Google Scholar] [CrossRef] [PubMed] [Green Version]
  16. Yang, J.J.; Chuang, Y.C.; Lo, H.W.; Lee, T.I. A two-stage MCDM model for exploring the influential relationships of sustainable sports tourism criteria in Taichung city. Int. J. Environ. Res. Public Health 2020, 17, 2319. [Google Scholar] [CrossRef] [PubMed] [Green Version]
  17. Tsai, P.H.; Lin, C.F. Creating a management strategy evaluation model for Taipei City sports centre by using hybrid MCDM models. J. Test. Eval. 2016, 45, 1820–1836. [Google Scholar] [CrossRef]
  18. Hu, L.H.; Cheng, C.F.; Wu, J.Z. Professional volleyball development in Taiwan’s sports industry. Int. J. Comput. Int. Syst. 2018, 11, 1082–1090. [Google Scholar] [CrossRef]
  19. Malchrowicz-Mośko, E.; Castañeda-Babarro, A.; Guereño, P.L. On the way to the marathon—Motivation for participating in mass running events among children and adolescents: Results of the poznan half marathon pilot study. Int. J. Environ. Res. Public Health 2020, 17, 5098. [Google Scholar] [CrossRef]
  20. Rauter, S.; Doupona Topič, M. Runners as sport tourists: The experience and travel behaviours of Ljubljana marathon participants. Colleg. Antropol. 2014, 38, 909–915. [Google Scholar]
  21. Larsen, J.; Bærenholdt, J.O. Running together: The social capitals of a tourism running event. Ann. Tour. Res. 2019, 79, 102788. [Google Scholar] [CrossRef]
  22. Stodółka, W.; Filipowski, D.; Kosa, J.; Stodółka, J. Motives of physically active adults to participate in the 5 PKO Wroclaw night half marathon. J. Educ. Health Sport 2019, 7, 517–525. [Google Scholar]
  23. Laing, J.; Wheeler, F.; Reeves, K.; Frost, W. Assessing the experiential value of heritage assets: A case study of a Chinese heritage precinct, Bendigo, Australia. Tour. Manag. 2014, 40, 180–192. [Google Scholar] [CrossRef]
  24. Tsai, C.T.S.; Wang, Y.C. Experiential value in branding food tourism. J. Destin. Mark. Manag. 2017, 6, 56–65. [Google Scholar] [CrossRef]
  25. Agrusa, J.; Kim, S.S.; Lema, J.D. Comparison of Japanese and North American runners of the ideal marathon competition destination. Asia Pac. J. Tour. Res. 2011, 16, 183–207. [Google Scholar] [CrossRef]
  26. Filo, K.; Funk, D.C.; O’Brien, D. Examining motivation for charity sport event participation: A comparison of recreation-based and charity-based motives. J. Leis. Res. 2011, 43, 491–518. [Google Scholar] [CrossRef]
  27. King, C.; Chen, N.; Funk, D.C. Exploring destination image decay: A study of sport tourists’ destination image change after event participation. J. Hosp. Tour. Res. 2017, 39, 3–31. [Google Scholar] [CrossRef]
  28. Fam, K.S.; Ting, H.; Tan, K.L.; Hussain, K.; Cheah, J.H. Does it matter where to run? Intention to participate in destination marathon. Asia Pac. J. Mark. Logist. 2020, 32, 1475–1494. [Google Scholar] [CrossRef]
  29. Wu, H.C.; Ai, C.H. Synthesizing the effects of experiential quality, excitement, equity, experiential satisfaction on experiential loyalty for the golf industry: The case of Hainan Island. J. Hosp. Tour. Manag. 2016, 29, 41–59. [Google Scholar] [CrossRef]
  30. Duan, Y.; Liu, B. Spectator satisfaction model for mass participant sport events: Antecedents and consequences. Int. J. Sports Mark. Spons. 2020. [Google Scholar] [CrossRef]
  31. Swanson, K.K.; Timothy, D.J. Souvenirs: Icons of meaning, commercialization and commoditization. Tour. Manag. 2012, 33, 489–499. [Google Scholar] [CrossRef]
  32. Kaplanidou, K.; Jordan, J.S.; Funk, D.; Ridinger, L.L. Recurring sport events and destination image perceptions: Impact on active sport tourist behavioral intentions and place attachment. J. Sport Manag. 2012, 26, 237–248. [Google Scholar] [CrossRef]
  33. Kazimierczak, M.; Dąbrowska, A.; Adamczewska, K.; Malchrowicz-Mośko, E. The impact of modern ultramarathons on shaping the social identity of runners: The case study of Karkonosze winter ultramarathon. Int. J. Environ. Res. Public Health 2020, 17, 116. [Google Scholar] [CrossRef] [Green Version]
  34. Alexandris, K.; Theodorakis, N.; Kaplanidou, K.; Papadimitriou, D. Event quality and loyalty among runners with different running involvement levels: The case of “The Alexander the Great” international marathon. Int. J. Event Fest. Manag. 2017, 8, 292–307. [Google Scholar] [CrossRef]
  35. Malchrowicz-Mośko, E.; Poczta, J.; Adamczewska, K. The potential of non-mega sporting events for the promotion of physical activity among inactive supporters at the Poznan half marathon: A case study. Int. J. Environ. Res. Public Health 2019, 16, 4193. [Google Scholar] [CrossRef]
  36. Hautbois, C.; Djaballah, M.; Desbordes, M. The social impact of participative sporting events: A cluster analysis of marathon participants based on perceived benefits. Sport Soc. 2020, 23, 335–353. [Google Scholar] [CrossRef]
  37. Dalle Carbonare, L.; Manfredi, M.; Caviglia, G.; Conte, E.; Robotti, E.; Marengo, E.; Cheri, S.; Zamboni, F.; Gabbiani, D.; Deiana, M.; et al. Can half-marathon affect overall health? The Yin-Yang of sport. J. Proteom. 2018, 170, 80–87. [Google Scholar] [CrossRef] [PubMed]
  38. Gabus, A.; Fontela, E. Perceptions of the World Problematique: Communication Procedure, Communicating with Those Bearing Collective Responsibility; Battelle Geneva Research Centre: Geneva, Switzerland, 1973. [Google Scholar]
  39. Fontela, E.; Gabus, A. The DEMATEL Observer; Battelle Geneva Research Centre: Geneva, Switzerland, 1976. [Google Scholar]
  40. Bouzon, M.; Govindan, K.; Rodriguez, C.M.T. Evaluating barriers for reverse logistics implementation under a multiple stakeholders’ perspective analysis using grey decision making approach. Resour. Conserv. Recycl. 2018, 128, 315–335. [Google Scholar] [CrossRef]
  41. Saaty, T.L. (Ed.) Decision Making with Dependence and Feedback: Analytic Network Process; RWS Publications: Pittsburgh, PA, USA, 1996. [Google Scholar]
  42. Ou Yang, Y.P.; Shieh, H.M.; Leu, J.D.; Tzeng, G.H. A novel hybrid MCDM model combined with DEMATEL and ANP with applications. Int. J. Operat. Res. 2008, 5, 160–168. [Google Scholar]
  43. Qu, G.B.; Zhao, T.Y.; Zhu, B.W.; Tzeng, G.H.; Huang, S.L. Use of a modified DANP-mV model to improve quality of life in rural residents: The empirical case of Xingshisi Village, China. Int. J. Environ. Res. Public Health 2019, 16, 153. [Google Scholar] [CrossRef] [Green Version]
  44. Opricovic, S. Multicriteria Optimization of Civil Engineering Systems. Ph.D. Thesis, Faculty of Civil Engineering, Belgrade, Serbia, 1998. [Google Scholar]
  45. Liou, J.J.; Tsai, C.Y.; Lin, R.H.; Tzeng, G.H. A modified VIKOR multiple-criteria decision method for improving domestic airlines service quality. J. Air Transp. Manag. 2011, 17, 57–61. [Google Scholar] [CrossRef]
  46. Lu, M.T.; Lin, S.W.; Tzeng, G.H. Improving RFID adoption in Taiwan’s healthcare industry based on a DEMATEL technique with a hybrid MCDM model. Decis. Support Syst. 2013, 56, 259–269. [Google Scholar] [CrossRef]
  47. Liu, Y.; Chen, Y.; Tzeng, G.H. Identification of key factors in consumers’ adoption behavior of intelligent medical terminals based on a hybrid modified MADM model for product improvement. Int. J. Med. Inform. 2017, 105, 68–82. [Google Scholar] [CrossRef] [PubMed]
  48. Hu, K.H.; Chen, F.H.; Tzeng, G.H. Evaluating the improvement of sustainability of sports industry policy based on MADM. Sustainability 2016, 8, 606. [Google Scholar] [CrossRef] [Green Version]
Figure 1. INRM of dimensions.
Sustainability 13 02758 g001
Figure 2. INRM of playfulness (D1).
Sustainability 13 02758 g002
Figure 3. INRM of service (D2).
Sustainability 13 02758 g003
Figure 4. INRM of runners (D3).
Sustainability 13 02758 g004
Figure 5. INRM of aesthetics (D4).
Sustainability 13 02758 g005
Table 1. Evaluation dimensions and criteria of experiential value for marathon runners.
Dimensions/CriteriaDescriptionReferences
Playfulness (D1)
Social Activities (C11)Information is shared through runners’ clubs to encourage joint participation of runners and to promote friendship.[19,21]
Clothing (C12)Runners wear colorful clothing and unique accessories.
Route Characteristics (C13)Enthusiastic audience cheer alongside the route, and local food and performances are provided.[36]
Postrace Travel (C14)Tourist attractions and local delicacies are near the race site.[28]
Service (D2)
Event Manager (C21)Excellent professionalism and execution capabilities of staff members.[29,30]
Traffic Flow Planning (C22)Information on the official website is complete, registration is smooth, and appropriate traffic control and appropriate arrangement of supply station locations are ensured.[7]
Information (C23)Information on tourist attractions, accommodation, food, and transportation is provided.[7]
Accessibility (C24)The venues are easily accessible, and parking is sufficient.[4,29]
Runners (D3)
Self-worth (C31)Sense of achievement after completing the race and recognition from society.[32,33]
Health and Fitness (C32)Training to prepare for the race improves performance and health.[22,37]
Potential (C33)Realize one’s potential. [33]
Aesthetics (D4)
Visual Experience of Landscapes (C41)Beautiful landscapes alongside the racing routes provide wonderful visual experiences.[7,25]
Activities in Event Venues (C42)The decorations in event venues are carefully designed, and numerous activities are held inside the venues.[34]
Spectacular Views of Runners Running Together (C43)The race offers the spectacular view of many runners advancing together.[35]
Table 2. Average influence matrix and total influence matrix of each dimension.
AD1D2D3D4TD1D2D3D4
D101.029 1.294 1.235 D10.2190.2960.3490.383
D22.029 02.059 2.588 D20.5960.2700.5460.670
D31.588 1.029 00.824 D30.4130.2950.1900.337
D40.794 0.941 0.382 0D40.2530.2310.1870.159
Consistency value = 0.019 < 0.05.
Table 3. Average influence matrix and total influence matrix of criteria in D1.
AC11C12C13C14TC11C12C13C14
C1100.088 1.618 0.500 C110.106 0.089 0.228 0.144
C121.588 00.853 0.676 C120.260 0.063 0.167 0.151
C133.235 2.676 02.824 C130.523 0.392 0.180 0.442
C140.294 0.500 0.882 0C140.105 0.103 0.136 0.058
Consistency value = 0.024 < 0.05.
Table 4. Average influence matrix and total influence matrix of criteria in D2.
AC21C22C23C24TC21C22C23C24
C2103.882 3.618 2.147 C210.131 0.522 0.580 0.358
C220.882 01.118 0.588 C220.127 0.074 0.204 0.120
C231.029 0.382 01.235 C230.141 0.123 0.116 0.182
C240.588 1.176 2.559 0C240.122 0.195 0.356 0.085
Consistency value = 0.022 < 0.05.
Table 5. Average influence matrix and total influence matrix of criteria in D3.
AC31C32C33TC31C32C33
C3103.235 2.794 C310.262 0.890 0.693
C321.176 00.735 C320.276 0.234 0.278
C330.765 1.853 0C330.245 0.492 0.173
Consistency value = 0.013 < 0.05.
Table 6. Average influence matrix and total influence matrix of criteria in D4.
AC41C42C43TC41C42C43
C4101.8820.647C410.2050.5470.239
C420.23500.618C420.1850.1190.173
C433.4711.2060C430.9420.6940.222
Consistency value = 0.019 < 0.05.
Table 7. Sum of influences given and received for constructing the INRMs.
Dimensions/Criteriauvu + vuv
Playfulness (D1)1.247 1.480 2.727 −0.233
Social activities (C11)0.567 0.994 1.560 −0.427
Clothing (C12)0.641 0.647 1.288 −0.006
Route characteristics (C13)1.537 0.711 2.248 0.825
Postrace travel (C14)0.403 0.795 1.198 −0.392
Service (D2)2.082 1.092 3.174 0.990
Event manager (C21)1.591 0.522 2.113 1.069
Traffic flow planning (C22)0.525 0.915 1.440 −0.390
Information (C23)0.562 1.255 1.817 −0.693
Accessibility (C24)0.758 0.744 1.503 0.014
Runners (D3)1.235 1.272 2.507 −0.036
Self-worth (C31)1.845 0.782 2.627 1.062
Health and fitness (C32)0.788 1.616 2.404 −0.828
Potential (C33)0.910 1.145 2.055 −0.235
Aesthetics (D4)0.830 1.550 2.380 −0.720
Visual experience of landscapes (C41)0.990 1.332 2.322 −0.341
Activities in event venues (C42)0.478 1.360 1.838 −0.882
Spectacular views of runners running together (C43)1.858 0.634 2.492 1.224
Table 8. Performance evaluation of the empirical case using mV.
Dimensions or CriteriaLocal WeightsGlobal WeightsPerformanceGap
Playfulness (D1)0.272 3.6680.555
Social activities (C11)0.290 0.079 3.088 0.652
Clothing (C12)0.196 0.053 6.235 0.127
Route characteristics (C13)0.280 0.076 4.676 0.387
Postrace travel (C14)0.234 0.064 1.029 0.995
Service (D2)0.225 3.9970.501
Event manager (C21)0.195 0.044 3.294 0.618
Traffic flow planning (C22)0.231 0.052 6.147 0.142
Information (C23)0.340 0.076 2.735 0.711
Accessibility (C24)0.233 0.052 4.294 0.451
Runner (D3)0.232 6.5050.083
Self-worth (C31)0.269 0.062 6.647 0.059
Health and fitness (C32)0.422 0.098 6.353 0.108
Potential (C33)0.309 0.072 6.588 0.069
Aesthetics (D4)0.271 4.7760.371
Visual experience of landscapes (C41)0.3540.096 6.118 0.147
Activities in event venues (C42)0.389 0.105 2.235 0.794
Spectacular views of runners running together (C43)0.257 0.070 6.765 0.039
Total weights1.0001.000
Total performance4.000 4.700
Total gap 0.383
Publisher’s Note: MDPI stays neutral with regard to jurisdictional claims in published maps and institutional affiliations.

