Abstract
Manual transplanting, a pre-dominant practice in almost all the paddy growing areas in India, is laborious, burdensome, and has many expenses on raising, settling, and transplanting nursery. The transplanting process’s limitations motivated the replacement of conventional paddy transplanting methods. The study was divided into two phases. The first phase included laboratory testing of three levels of metering mechanisms, namely cell type (M1) with 10 cells grooved around a circular plate having a 13 cm diameter, inclined plate (M2) containing 24 U shaped cells provided on an 18 cm diameter plate, and fluted roller (M3) with 10 flutes on a 5 cm diameter shaft. The testing matrix included a missing index, multiple index, and seed damage with forward speeds (2.5, 3.0, and 3.5 km/h), and pre-germination levels of 24 h soaked (P1), 24 h pre-germinated (P2), and 36 h pre-germinated paddy seeds (P3)). The second phase included selecting the best combination obtained from the laboratory study and developing a new efficient planter for the puddled field. The inclined plate metering mechanism operating at 2.5 km/h for 24 h pre-germinated seeds was reported most efficient from the first phase. Therefore, a self-propelled 8-row planter equipped with an inclined plate metering mechanism having a row-to-row spacing of 22.5 cm was developed, fabricated, and evaluated in the puddled field. The designed planter was assessed on two different soils: sandy loom (ST1) and clay loom (ST2) and at two different hopper fill levels as ½ filled hopper (F1) and ¾ filled hopper (F2). The number of plants per square meter and hill-to-hill spacing was measured. The on-field evaluation revealed that the number of plants per square meter was non-significantly affected by the type of soil but was significantly affected by hopper fill.
1. Introduction
Paddy is the most prominent crop in India and is the staple food fulfilling 43 percent of the majority of the Indian population’s caloric requirement. India is the second-largest producer of paddy in the world, the first being the republic of China. In India, paddy has occupied 43.99 million hectares and has 109.7 million tonnes and a yield of 2494 kg/ha. Whereas in Punjab, the area occupied by paddy was 3.0 million hectares (6.6 percent of all India), production was 11.59 million tonnes (10.56 percent of all India), and a yield of 3998 kg/ha during the year 2016–17 [1].
Various sowing paddy methods are direct seeding of dry seeds manually or with a seed drill, broadcasting or line sowing of dry seed/ pre-germinated seed, and manual transplanting of 3–4 weeks old nursery seedlings in puddled soil. In India, manual transplanting of 3–4 weeks old nursery seedlings is the most commonly used conventional rice cultivation practice. Though manual transplanting is a pre-dominant practice in almost all the paddy growing areas, it has very high labor demands. During the transplanting season, the labor requirement for transplanting, including nursery raising, varies from 50–1000 man-h per ha in different country regions [1]. The shortage of labor during the peak season of transplanting creates uncertainty and delays in the operation, ultimately reducing crop yields.
Nevertheless, Paddy cultivation is too laborious, burdensome, and has many expenses on raising, settling, and transplanting nursery. Additionally, transplanting has other disadvantages, such as stress on seedlings when pulled out from nursery and the time taken and the laborious process of raising nurseries [2]. The transplanting method deteriorates soil’s physical properties, adversely affects the performance of succeeding upland crops, and contributes to methane emissions [3]. These problems have compelled engineers, researchers, farmers, and scientists to replace conventional paddy transplanting methods.
Several studies have been conducted in many countries on the direct seeding of rice as an alternative to rice transplanting. Most field experiments and on-farm researches have established that direct-seeded rice can yield as high as transplanted rice if adequately managed. Some studies found that direct paddy seeding is the best alternate cropping technique, which requires less water and labor than the transplanted rice [4]. In the direct seeding method of paddy cultivation, the pulling, transporting, and transplanting of seedlings are avoided, so plants are not exposed to strains like being dragged from the field and then re-establishing seedlings. A study conducted by [5] on direct seeding reduced the cost of cultivation by Rs. 9166 per ha by avoiding nursery and transplanting costs. The grain yield of dry direct-seeded rice was identical to the transplanted-flooded rice. However, dry direct-seeded rice increased nitrogen use efficiency by 20.3 percent [6]. The direct sown paddy saves about 25 percent of irrigation water as it avoids puddling and enhanced irrigation intervals. There was a net saving of Rs. 13,000/ha in crop establishment due to direct-sown paddy as against the conventional puddled transplanted rice.
The work of [7] studied the high water requirements in paddy cultivation and growing costs of labor and recommended that a substitute technique for increased water productivity in paddy cultivation be found. Therefore, in this study, a matrix was calculated to evaluate metering mechanisms’ interaction with the vehicle’s forward speed and pre-germinated seeding stage. The output from matrix evaluation would provide different characteristics to develop, fabricate, and test a self-propelled paddy vehicle for direct seeding of pre-germinated seeds on the puddled field.
2. Materials and Methods
The study was conducted between May 2017 and June 2018 to develop and evaluate a direct paddy seeder in the puddled field. The underlying objectives of the proposed research were divided into two phases. In the first phase, the different mechanical metering mechanisms with the fixed count of soaked and variable stages of pre-germinated seeds at varying speeds during the farm operation was evaluated for the most efficient interaction using a matrix that included: missing index, multiple indexes, and seed damage. In the second phase, performance evaluation of a self-propelled eight-row direct paddy seeder with optimum parameters: (i) suitable roller, (ii) pre-germination level (from phase 1) carried out under actual field conditions. The first phase of the study was conducted in the Testing Laboratory of the Department of Farm Machinery and Power Engineering, PAU, Ludhiana, Punjab, India. The second phase of the study was conducted in the Research Farm, Department of Farm Machinery and Power Engineering, PAU, Ludhiana, Punjab, India.
The study included different variables. The interaction of independent variables (different metering mechanisms, forward speeds, and pre-germination levels) was evaluated using a matrix that constituted the missing index (%), multiple index (%), and seed damage (%). Different variables and levels used in phase one of the study are shown in Table 1.

Table 1.
Different variables.
where,
Missing Index (%)
The recommended spacing for direct seeding of paddy is 15 cm. If the actual distance between two consecutive hills is more than 1.5 times the theoretical (recommended) spacing, it is considered a missing hill. The data was recorded for all the treatments, and each treatment was replicated thrice. The missing index (in%) was calculated using Equation (1).
where,
Nm = Number of missing hills
Nt = Total number of hills
Multiple Index (%)
For determining multiple index, the total number of hills and the number of multiple hills on the sticky belt were counted. The data was recorded for all the treatments, and each treatment was replicated thrice. If the actual distance between two consecutive hills were less than 0.5 times the theoretical spacing (standardspacingof15cmfordirectseededrice), this would be considered multiple hills. The multiple index (in%) was calculated as shown in Equation (2)
where,
Nm∗ = Number of multiple hills
Nt = Total number of hills
Seed Damage (%)
The seed is considered damaged when a small part of the seed is broken or separated from the whole grain. Seed damage was calculated by counting the total number of seeds, and damaged seeds dropped on the sticky belt. The data was recorded for all the treatments, and each treatment was replicated thrice. The extent of seed damage (in%) due to mechanical metering by metering mechanisms was calculated using Equation (3).
where,
Nd = Total number of damaged seeds
Nt∗ = Total number of seeds
2.1. Development of the Test Rig
The test rig (Figure 1) consisted of a variable frequency drive provided to vary the operation speed. The power to operate the metering mechanisms was transmitted through a gearbox, variable drive, and pulleys set. The speed of the metering mechanism was adjusted with the speed of the sticky belt. The test rig’s moving belt’s speed was simulated with a direct paddy seeder’s ground speed.
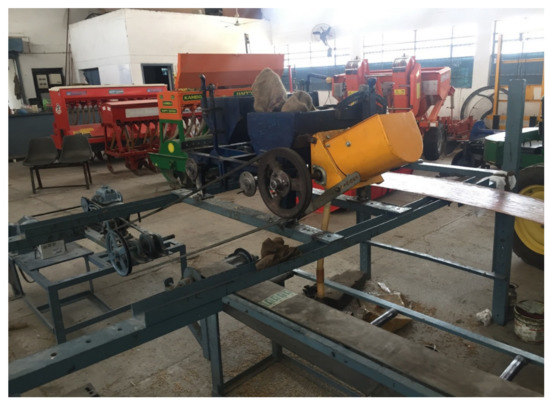
Figure 1.
The test rig layout was used during the study to find the interaction between dependent and independent variables. The interaction of independent variables (different metering mechanisms, forward speeds, and pre-germination levels) was evaluated using a matrix that constituted the missing index (%), multiple index (%), and seed damage (%).
Laboratory Testing
Laboratory experiments were conducted to study the various dependent and independent variables and their interaction to select the optimum metering mechanism and seed treatments in paddy variety PR- 121. The developed metering mechanism assembly was evaluated on the testing rig in the Testing Center, Department of Farm Machinery and Power Engineering PAU, Ludhiana Punjab India. The sticky belt was used to assess the missing index, multiple indexes, and seed damage. The test rig was fitted onto the belt, and forward belt speed was adjusted equal to speeds selected for laboratory study, i.e., 2.5, 3.0, and 3.5 kmph. The seed was filled in the hopper, and a layer of grease was applied up to 10 m length of the belt. The belt was operated at a pre-determined speed. Simultaneously, the test rig’s metering roller was operated, and missing index, multiple index, and seed damage were recorded. Similar observations were recorded for all the three metering mechanisms in three seed treatments of paddy variety. The data were statistically analyzed for the determination of missing index, multiple index, and seed damage.
2.2. Crop Variety
The paddy seed of the identified variety of paddy for the Punjab region, namely PR-121, was used in all the study experiments.
2.3. Seed Treatments
Paddy seed was used in three different conditions. They were 24 h soaked, 24 h pre-germinated, and 36 h pre-germinated. The pre-germination of seeds has been carried out as per Punjab Agricultural University Ludhiana, Punjab, India. Three-levels of pre-germination including 24 h soaked (P1), 24 h pre-germinated (P2), and 36 h pre-germinated (P3) were selected for the study. The seeds were soaked in water in a bucket for 24 h (P1) for the first level. For the following two levels, seeds were soaked in a water bucket for 8–10 h. Afterward, water was drained, and seeds were kept between moist gunny bags in hot and humid environmental conditions for 24 h (P2) and 36 h (P3). The gunny bags were kept moist by spraying water at regular intervals. Before being used for testing, the seeds were kept open in the shaded area for one hour.
2.4. Seed Metering Mechanism
The seed metering mechanism is the most vital rice seeder component, which must meter the required quantity of seed accurately and uniformly with minimum seed damage. The uniformity of the plant stand in the field will depend upon the metering quality of the seed rollers. Accordingly, three different mechanisms were selected. These were cell type (M1) containing 10 cells grooved around a circular plate having a 13 cm diameter. M2, the inclined plate with 24 U-shaped cells provided on an 18 cm diameter plate, and a fluted roller (M3) containing ten flutes on a 5 cm diameter shaft. They were fabricated from cast iron to be easily fitted in the seed hoppers of the test rig.
The performance evaluation of three different metering mechanisms under laboratory conditions was carried out on a test rig specifically developed and fabricated. The rollers were tested for all the treatments, i.e., 24 h soaked, 24 h pre-germinated, and 36 h pre-germinated at three different speeds (2.5, 3.0, and 3.5 kmph). The speed of the metering mechanisms was varied by using the different combinations of pulley sizes. The uniformity of seed metering in terms of the missing index (%), multiple index (%), and seed damage (%) were compared for each metering mechanism. Based on their performance data, the metering mechanism that metered the seed uniformly with minor seed damage was selected for the field testing of the direct paddy seeder. Simultaneously, the pre-germination level (24 h soaked, 24 h pre-germinated, and 36 h pre-germinated) was also determined based on metering characteristics of the metering mechanisms and further used for field study.
2.5. Speed of Seed Metering Mechanism
The peripheral speed of the metering mechanism has a considerable effect on the uniformity of seed metering. For each seed metering mechanism, there is an optimum speed at which the seed’s uniformity is optimal and seed damage is minimum. Therefore, for performance evaluation of different metering mechanisms for metering various seeds, three different speeds (S1, S2, and S3) were selected based on a different combination of pulley sizes. The speeds were obtained by changing the different sets of the pulley in the test rig. The optimum peripheral speed was selected for the development of a direct paddy seeder.
2.6. Development of Direct Paddy Seeder
Based on the laboratory study results, a self-propelled direct paddy seeder prototype (Figure 2.) was developed and fabricated with the recommended row to row (22.5 cm) and hill to hill spacing (15 cm). The direct paddy seeder was equipped with eight seed hoppers having an inclined plate metering mechanism with 180 cm total width.
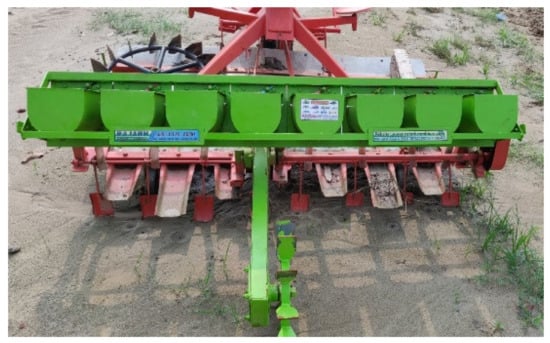
Figure 2.
A self-propelled direct paddy seeder prototype with the recommended row to row (22.5 cm) and hill to hill spacing (15 cm).
2.7. Power Transmission System
The power transmission was delivered from the ground wheel using a sprocket and chain system for the seed metering mechanism. A 24 teeth sprocket was used at the ground wheel to transmit power to a 26 teeth sprocket on the main shaft. A 14 teeth sprocket was attached to the main shaft, which rotated at the same rpm as the 26 teeth sprockets. Further, the 14 teeth sprocket provided transmission to a 19 teeth sprocket attached to a shaft that provided rotation to the metering mechanism.
2.8. Performance Evaluation of Direct Paddy Seeder I on a Puddled Field
The direct paddy seeder’s developed prototype was evaluated in puddled field conditions at the Research Farm, Department of Farm Machinery and Power Engineering, PAU Ludhiana, Punjab, India, in two distinct soil types: Sandy loom (ST1) and clay loom (ST2). The field location was 30.9010° N, 75.8573° E. The direct paddy seeder was evaluated for the number of plants per square meter, hill to hill spacing, and seed germination at two different hopper fill levels as ½ filled hoppers (F1) and ¾ filled hoppers (F2). Before sowing, the field was well prepared for the puddled conditions. After puddling was completed, excess water was drained from the field up to a specific level.
2.8.1. Number of Plants Per Square Meter
A meter square frame was used to measure the number of plants. The meter square frame was dropped randomly in the field, and then the plants inscribed within the frame were counted.
2.8.2. Hill to Hill Spacing
The meter square frame was dropped randomly in the field, and then the hill-to-hill spacing was measured for plants inscribed within the frame with multiple replications.
2.9. Statistical Analysis
The statistical tests were designed to determine the effect of independent parameters on dependent parameters. Factors in a Completely Randomized Design (CRD) were laid out to conduct the experiments and to analyze the impact of study variables. Analysis of variance (ANOVA) was performed to test the significance of independent variables and their interactions on the dependent variables at a 5% level of critical difference using IBM SPSS statistics software 20.0 version. Dependent variables in terms of their respective general means were compared based on the test. There were three levels of metering mechanisms (M1, M2, and M3), three levels of seed treatment level (P1, P2, and P3), and three levels of forward speed (S1, S2, and S3) as independent parameters. Therefore, the 27 treatments were replicated three times to reduce the bias.
3. Results
3.1. Laboratory Evaluation of Metering Mechanisms
Laboratory experiments were conducted to study the various dependent and independent variables and their interaction to select optimum metering mechanism and seed treatments in paddy variety PR- 121. The performance evaluation of three different metering mechanisms was carried out on the test rig. The seed metering characteristics were compared in terms of missing index, multiple index, and seed damage. Simultaneously, the optimum seed treatment was selected based on these metering mechanisms’ metering characteristics, and the optimum speed of operation was identified.
3.1.1. Missing Index
The effect of forwarding speed and accuracy of seed metered by three different metering mechanisms (M1, M2, and M3) on the missing index in paddy variety PR- 121 (Table 2) showed that the missing index was significantly affected by the metering mechanism, pre-germination level of seed, and forward speed. Analysis of variance is shown in Table 3 and Table 4 shows Tukey’s analysis on the metering mechanism, forward speed, and pre-germination level for missing index. The missing index was increasing with an increase in the level of pre-germination and increased forward speed.
Table 2.
Effect of metering mechanism, forward speed, and pre-germination level on the missing index.
Table 3.
Analysis of variance for effect of metering mechanism, forward speed, and pre-germination level on the missing index.
Table 4.
Tukey’s (b) analysis on the metering mechanism, forward speed, and pre-germination level for missing index.
Analysis of variance indicates that the missing index was significantly affected by the metering mechanism, seed treatment level, and forward speed. The first order interaction of seed treatment level and metering mechanism (P * M) and interaction of metering mechanism and forward speed (M * S) was non-significant at a 5% level of significance. Comparison of the mean missing index within the metering mechanism was analyzed by Tukey’s (b) method at a 5% level of significance and found no significant difference in missing index M1 and M3 (Table 4. The missing index for M2 was significantly less than M1 and M3. Table 2 shows that in metering mechanism M2, a minimum quantity of seed missing was observed in all three treatments and was highly significant over M1 and M3. The average missing index of 26.02%, followed by 33.94%, and 34.78% was observed in the inclined plate type metering mechanism (M2), cell type metering mechanism (M1), and fluted roller type metering mechanism (M3).
Further perusal of Table 2 shows the effect of metering mechanism, forward speed, and pre-germination level on the missing index at different treatments. It was observed that the maximum missing index with combination M3P3S3 (52.73%) followed by M2P3S3 (47.43%) and M1P3S3 (42.42%), respectively. Further perusal indicated that the minimum missing index was observed in combination with M2P1S1 (7.00%) followed by M3P2S1 (20.12%) and M1P1S1 (22.78%). Analysis of variance (Table 3) indicated that the missing index was significantly affected by the metering mechanism. The first order interaction of P * M and M * S was found non-significant at a 5% level of significance. Comparison of the mean missing index within the metering mechanism was done by Tukey’s (b) method at a 5% level of significance. It was found that there was no significant difference in missing index be-tween M1 and M3. The missing index was significantly less in M2 as compared to M1 and M3.
A maximum missing index of 39.00% was observed in the 36 h pre-germinated seed treatment level (P3). A missing index of 30.02% was observed in 24 h pre-germinated seed treatment level (P2). It was found that there was no significant difference in missing index between P1 and P2, but there was a significantly higher seed missing index in P3 as compared to P1 and P2.
The seed treatment level was significant because sprouted seeds may get entangled, and seed size also increases, causing cells to remain unfilled to increase. Maximum missing index observed at different seed treatment levels was found P3M3S3 (52.73%) followed by P2M3S3 (45.55%) and P1S3M1 (40.04%), respectively. The minimum missing index observed at different seed treatments was P1M2S1 (7.00%), followed byP2S1M3 (20.12%) and P3S1M2 (22.22%), respectively. Analysis of variance (Table 3) indicated that the missing index was significantly affected by the seed’s pre-germination level. The first order interaction of P * M and P * S was found non-significant at a 5% level of significance. Comparison of the mean missing index within three different seed treatment levels was done by Tukey’s (b) method (Table 4) at a 5% level of significance. It was found that there was no significant difference in missing index between P1 and P2, but there was significantly more missing index in P3 as compared to P1 and P2.
A minimum missing index of 22.96% was observed at the speed of 2.5 kmph (S1), and the maximum missing index of 39.41% was observed at the speed of 3.5 kmph (S3). A missing index of 32.37% was observed at the speed of 3.0 kmph (S2). It was found that there was no significant difference in missing index between S2 and S3, but there was significantly less missing index in S1 as compared to S2 and S3. The effect of forwarding speed was found significant because at a higher speed, the ground wheel rotated faster, which resulted in a higher rpm of the metering mechanism; therefore, cell filling was reduced, which affected the missing index. The maximum missing index observed at different treatments for 2.5 kmph, 3.0 kmph, and 3.5 kmph forward speed was S3M3P3 (52.73%), followed by S2M3P3 (48.53%) and S1M3P3 (31.91%), respectively. The minimum missing index observed at different speeds was S1M2P1 (7.00%), S2M2P1 (15.07%), and S3M2P2 (27.05%), respectively. Analysis of variance (Table 3) indicated that the missing index was significantly affected by the forward speed. The first order interaction of S * M and S * P was found non-significant at a 5% level of significance.
Additionally, it was found that there was no significant difference in missing index between S2 and S3, but there was significantly less missing index in S1 as compared to S2 and S3. The effect of the forward speed was found significant because at higher speed, the ground wheel rotated faster, which resulted in a higher rpm of the metering mechanism; therefore, the cell fill reduced, which affected the missing index.
3.1.2. Multiple Index
The effect of independent parameters, metering mechanism, seed treatment level, and forward speed on multiple indexes is shown in Table 5. The multiple index was significantly affected by the metering mechanism, pre-germination level of seed, and non-significantly affected by the forward speed. Analysis of variance is shown in Table 6, and Table 7 shows Tukey’s analysis on the metering mechanism, forward speed, and pre-germination level for multiple index. Multiple index was found to be decreasing with an increase in the level of pre-germination and forward speed.
Table 5.
Effect of metering mechanism, forward speed, and pre-germination level on multiple index.
Table 6.
Analysis of variance for effect of metering mechanism, forward speed, and pre-germination level on multiple index.
Table 7.
Tukey’s (b) analysis on the metering mechanism, forward speed, and pre-germination level for multiple index.
The analysis showed that the multiple index was significantly affected by the metering mechanism and seed treatment levels of seed, and the effect of the forward speed was found non-significant. A minimum multiple index of 4.17% was observed in the inclined plate type metering mechanism (M2), and the maximum multiple indexes of 70.42% were observed in the fluted roller type metering mechanism (M3). A multiple index of 18.45% was observed in the cell type metering mechanism (M1). It was found that there was a significant difference in multiple index between M1, M2, and M3. Maximum multiple index observed at different treatments for inclined plate type, cell type, and fluted roller type metering mechanism was M3P2S2 (86.62%) followed by M1P1S1 (32.02%) and M2P1S1 (7.21%), respectively.
The minimum multiple percent observed at different treatments for cell type, inclined plate type, and fluted roller type metering mechanism was M1P3S3 (5.55%), M2P3S3 (0.32%), and M3P2S1 (56.06%), respectively. Analysis of variance of the first-order interaction of P * M was found to be significant, and M * S was found non-significant at a 5% level of significance. Comparison of mean multiple index within the metering mechanism was done by Tukey’s (b) method at a 5% level of significance. It was found that there was a significant difference in multiple index between M1, M2, and M3. The multiple index was significantly less in M2 as compared to M1.
Table 10 revealed that a minimum multiple index of 25.71% was observed in 36 h pre-germinated seed (P3), and a maximum multiple index of 36.55% was observed in the 24 h soaked (P1). Multiple index of 30.79% was observed in 24 h pre-germinated (P2). It was found that there was a significant difference in multiple index between P1, P2, and P3. Maximum multiple index observed at different treatments for 24 h soaked, 24 h pre-germinated, and 36 h pre-germinated seed treatment level was P2M3S2 (86.62%) followed by P1M3S3 (84.18%), and P3S1M3 (66.48%), respectively. The minimum multiple index observed at different treatments for 24 h soaked, 24 h pre-germinated, and 36 h pre-germinated was P3S3M2 (0.32%) followed by P2M2S3 (3.25%) and P1S3M2 (4.27%), respectively. Analysis of variance indicated that the multiple index was significantly affected by the seed’s pre-germination level. The first order interaction of P * M and P * S was found non-significant at a 5% level of significance. Comparison of mean multiple index within three different pre-germination levels was done by Tukey’s (b) method at a 5% level of significance. It was found that there was a significant difference in multiple index between P1, P2, and P3. There was significantly less percent of damage in P3 as compared to P1 and P2. It was found that there was no significant difference in multiple index between S1, S2, andS3 (Table 10). Analysis of variance (Table 9) indicated that the multiple index was non-significantly affected by the forward speed. Comparison of mean multiple index within three different forward speeds was done by Tukey’s (b) method (Table 10) at a 5% level of significance. It was found that there was no significant difference in multiple index between S1, S2, and S3.
3.1.3. Seed Damage
The effect of independent parameters, namely metering mechanism, seed treatment level, and forward speed on seed damage, are presented in Table 8. The seed damage percentage was significantly affected by the metering mechanism, pre- germination level of seed, and forward speed. Analysis of variance is shown in Table 9 and Table 10 which shows Tukey’s analysis on the metering mechanism, forward speed, and pre-germination level for seed damage. Seed damage percentage was found to be increasing with an increase in the level of pre-germination and forward speed.
Table 8.
Effect of metering mechanism, forward speed, and pre-germination level of seed on seed damage.
Table 9.
Analysis of variance for effect of metering mechanism, forward speed, and pre-germination level of seed on seed damage
Table 10.
Tukey’s (b) analysis on the metering mechanism, forward speed, and pre-germination level on seed damage.
From the analysis of variance, it was found that the seed damage was significantly affected by the metering mechanism, seed treatment level, and forward speed. Minimum seed damage of 3.65% was observed in the inclined plate type metering mechanism (M2), and maximum damage of 25.42% was observed in the fluted roller type metering mechanism (M3). Seed damage of 14.22% was observed in the cell type metering mechanism (M1). Maximum seed damage observed at different treatments for inclined plate type, cell type, and fluted roller type metering mechanism was M3P3S2 (46.56%) followed by M1P3S3 (38.10%) and M2P3S3 (11.98%), respectively. Minimum seed damage percent observed at different treatments for cell type, inclined plate type, and fluted roller type metering mechanism was M1P1S1 (0.32%), M2P1S1 (0.36%), and M3P1S1 (2.62%), respectively. Analysis of variance indicated that the damage percentage was significantly affected by the metering mechanism. The first order interaction of P * M and M * S was significant at a 5% level of significance. Tukey’s (b) method compared mean damage within the metering mechanism at a 5% level of significance. It was found that there was a significant difference in damage between M1, M2, and M3. The damage was significantly less in M2 as compared to M1 and M3.
Minimum seed damage of 2.69% was observed in the 24 h soaked (P1), and maximum damage of 30.07% was observed in the 36 h pre-germinated seed (P3). Seed damage of 5.64%was observed in the 24 h pre-germinated seed (P2). It was found that there was a significant difference in damage percentage between P1, P2, and P3. There was significantly more damage percentage in P3 as compared to P1 and P2. The minimum seed damage of 9.88% was observed at the speed of 2.5 kmph (S1), and the maximum damage of 15.12% was observed at the speed of 3.5 kmph (S3). Seed damage of 13.41% was observed at the speed of 3.0 kmph (S2). It was found that there was no significant difference in seed damage percentage between S2 and S3, but there was significantly less seed damage percentage in S1 as compared to S2 and S3. Analysis of variance indicated that the seed damage percent was significantly affected by the forward speed. The first order interaction of S * M was found non-significant, and S * P was found significant at a 5% level of significance.
Comparison of mean damage percentage within three different forward speeds was done by Tukey’s (b) method at a 5% level of significance. It was found that there was no significant difference in damage percentage between S2 and S3.
3.2. Field Evaluation of Direct Paddy Seeder
Based on the laboratory study, and considering the combined effect of the missing index, multiple index, and seed damage, forward speed of 2.5 kmph (S1), inclined plate metering mechanism (M2), and 24 h pre-germinated seed (P2) were significant parameters for the evaluation of the direct paddy seeder in the puddled field conditions.
Based on in-house lab outcomes, a prototype of an 8-row direct paddy seeder was developed and evaluated in a puddled field at the Research Farm, Department of Farm Machinery, Power Engineering, PAU Ludhiana, Punjab, India. The prototype was evaluated at a forward speed of 2.5 kmph (S1), inclined plate metering mechanism (M2), and 24 h pre-germinated seed (P2). Firstly, the field was laser-leveled. The rotavator, in continuation of the puddler, was used for puddling. After achieving the puddled condition, excess water was drained from the field up to a specific level. After preparing the field, paddy seed with treatment level 24 h pre-germinated was sown with the direct paddy seeder in the puddled field.
3.2.1. Number of Plants Per Square Meter
The data was measured for two soil types: ST1 and ST2, and two hoppers fill: ½ filled hopper and ¾ filled hopper, and the whole experiment was replicated thrice. Analysis of variance (Table 11) indicated that the number of plants per square meter was significantly affected by hopper fill and non-significantly affected by the soil type.
Table 11.
ANOVA table for the effect of soil type and hopper fill on the number of plants/ m2.
The number of plants per square meter (Table 12) for both soil types was found similar, and having a value of 109.5 plants per square meter. The number of plants per square meter for ½ filled hopper fill (F1) and ¾ filled hopper fill (F2) was found to be 100.33 and 118.67, respectively.
Table 12.
Effect of soil type and hopper fill on the number of plants per square meter
3.2.2. Hill to Hill Spacing
Analysis of variance (Table 13) indicated that hill-to-hill spacing was non-significantly affected by the type of soil and hopper fill.
Table 13.
ANOVA table for the effect of soil type and hopper fill on the hill to hill spacing.
Table 14 represents the effect of soil type and hopper fill on the hill to hill spacing at different combinations. The hill to hill spacing for soil type 1 (ST1) and soil type 2 (ST2) was found at 12.98 and13.93 cm, respectively. The hill to hill spacing for ½ filled hopper fill (F1) and ¾ filled hopper fill (F2) was found at 13.04 cm and13.88 cm, respectively.
Table 14.
Effect of soil type and hopper fill on plants to plant spacing.
4. Conclusions
In this study, a matrix was calculated to evaluate metering mechanisms’ interaction with the vehicle’s forward speed and pre-germinated seeding stage to improve the paddy sowing operation. The best combination for paddy sowing from the laboratory study was an inclined plate metering mechanism operating at 2.5 kmph using 24 h pre-germinated seeds. The output from the matrix evaluation provided different characteristics for developing, fabricating, and testing a self-propelled paddy vehicle for direct seeding of pre-germinated seeds on the puddled field as an alternative without compromising the establishment operation and reducing the intensive labor demand and other limitations. It was found that the minimum missing index for each independent parameter separately was observed as 26.02% (inclined plate metering mechanism M2), 25.54% (24 h soaked seed P1), and 22.96% (2.5 kmph S1). The maximum missing index for each independent parameter separately was observed as 34.78% (fluted roller metering mechanism M3), 39.00% (36 h pre-germinated seed P3), and 39.41% (3.5 kmph, S3). The minimum multiple index for each independent parameter separately was observed as 4.17% (inclined plate metering mechanism, M2), 25.70% (36 h pre-germinated seed, P3), and 28.88% (3.5 kmph, S3). The maximum multiple index for each independent parameter separately was observed as 70.42% (fluted roller metering mechanism M3), 36.55% (24 h soaked seed P1), and 33.20% (3.0 kmph, S2). Besides, the minimum seed damage percentage for each independent parameter separately was observed as 3.88% (inclined plate metering mechanism M2), 2.69% (24 h soaked seed P1), and 9.89% (2.5 kmph S1). Maximum seed damage percentage for each independent parameter separately was observed as 20.32% (fluted roller metering mechanism M3), 30.07% (36 h pre-germinated seed P3), and 45.35% (3.5 kmph S3). Additionally, the number of plants per square meter was non-significantly affected by the type of soil and was significantly affected by hopper fill. The number of plants per square meter for both soil types was found similar, and having a value of 109.5 plants per square meter. The number of plants per square meter for ½ filled hopper fill (F1) and for ¾ filled hopper fill (F2) were found at 100.33 and118.67, respectively. Additionally, the hill to hill spacing was non-significantly affected by the type of soil and hopper fill. The hill to hill spacing for soil type 1 and soil type 2 was 12.98 cm and 13.93 cm, respectively. The hill to hill spacing for ½ filled hopper fill (F1) and ¾ filled hopper fill (F2) was found at 13.04 cm and 13.88 cm.
Author Contributions
M.K.: Conceptualization; Data curation, Formal Analysis, Investigation, Methodology, Validation, Visualization, Writing original draft; R.D.: Conceptualization, Project administration, Resources, Supervision, Writing, review & editing; M.N.: Resources, Supervision, Writing, review & editing; M.S.: Resources, Supervision Writing, reviewing & editing; S.M.: Data curation, Formal Analysis, Supervision, Writing, review & editing. All authors have read and agreed to the published version of the manuscript.
Funding
This research received no external funding.
Data Availability Statement
The data supporting reported results can be asked upon request to the corresponding author.
Acknowledgments
Authors are grateful to administrative staff and technical support at the Department of Farm, Machinery, and Power Engineering.
Conflicts of Interest
The authors declare no conflict of interest.
References
- Anonymous. Rice–Rice Production Manual; Rice UCPA 7 IRRI: Los Banos, Philippines, 1971; pp. 31–41. [Google Scholar]
- Ratnayake, R.M.C.; Chinthaka, B.M.; Balasooriya, P. Sustainable paddy production: A case study on performance evaluation of a seeder. Manag. Prod. Eng. Rev. 2011, 2, 50–56. [Google Scholar]
- Joshi, E.; Kumar, D.; Lal, B.; Nepalia, V.; Gautam, P.; Vyas, A.K. Management of direct-seeded rice for enhanced resource-use efficiency. Plant Knowl. J. 2013, 2, 119–134. [Google Scholar]
- Kumar, V.; Ladha, J.K. Direct seeding of rice. Adv. Agron. 2011, 111, 297–413. [Google Scholar]
- Pradhan, S.N. Drilling pre-germinated paddy on puddled land saves labor and yield. Indian Farming 1973, 19, 71–74. [Google Scholar]
- Liu, H.; Hussain, S.; Zheng, M.; Peng, S.; Huang, J.; Cui, K.; Nie, L. Dry direct-seeded rice as an alternative to transplanted-flooded rice in Central China. Agron. Sustain. Dev. 2015, 35, 285–294. [Google Scholar] [CrossRef]
- Dixit, A.; Mahal, J.S.; Manes, G.S.; Singh, A.; Singla, C.; Dhaliwal, H.S.; Mahajan, G. Evaluation of direct-seeded rice drill against Japanese manual transplanter for higher productivity in rice. Indian J. Agric. Sci. 2010, 80, 884–887. [Google Scholar]


Publisher’s Note: MDPI stays neutral with regard to jurisdictional claims in published maps and institutional affiliations. |
© 2021 by the authors. Licensee MDPI, Basel, Switzerland. This article is an open access article distributed under the terms and conditions of the Creative Commons Attribution (CC BY) license (http://creativecommons.org/licenses/by/4.0/).