
Compatibility of Automated Vehicles in Street Spaces: Considerations for a Sustainable Implementation


Abstract
:1. Introduction
2. Related Works
3. Method
3.1. Data: Street Network and Street Segmentation
3.2. Scenarios of AVs Modeled in MATSim
- In the first step, the plans, i.e., activities and connecting trips during a day, of all agents are simulated simultaneously based on input data of a synthetic population. A queue-simulation model is used which moves vehicles from link to link in the network. When the capacity limit of a link is reached, traffic slows down and congestion builds up on the upstream link. This way, the choices from the agents’ plans directly affect the simulation travel times. Since this may introduce delays, the outcome of a plan is different than its initial version [44,45].
- Therefore, the second step of the iteration is the scoring, i.e., comparing how well an initial plan worked out. The observed plan is translated into a utility value (score) based on a predefined utility function (e.g., performing an activity is increasing utility while driving a car or having to wait for a bus is decreasing utility). This utility function accounts for both the travel and the activities (Equation (1)). The final score is assigned to the selected plan of the agent. Over time, agents can collect such plans in their memory which has a predefined size of N past plans [23,45].of travel for ith trip in a day; i = 1, 2, 3, …, q trips; ttravel; i = Travel time for ith trip; Uactivity; j = Utility of performing the jth activity in a day; j = 1, 2, 3, …, q + 1 activities; and tactivity; i = Duration of jth activity [23,35]
- The last stage of the iterative process is re-planning: For each agent, a re-planning strategy is chosen. This may be a selection strategy (i.e., selecting from an agent’s memory a plan based on its utility) or an innovation strategy, where a certain plan of an agent is duplicated and modified in a specific way (e.g., choosing a different departure time for a trip). Finally, if this leads to a state where an agent has more than N plans in memory, a removal procedure is applied, that chooses a plan to be deleted from the memory. In the next iteration, the selected/modified plans will be executed, scored, re-planned, and so on, until a dynamic user equilibrium is reached, i.e., no agent can further improve their mobility behavior by modifying their plan [23,35,45].
- The request can be satisfied within the service hours of the SAVs, i.e., between 04:00 and 24:00 h, and the vehicle time window and capacity of vehicles consisting of 10 seats is not exceeded.
- The overall time spent on traveling (waiting, boarding and riding) must not exceed the empirically derived time tr with tr = αtrdirect + β, where trdirect is the direct time between the origin and destination of the request, while α and β are used to model the maximum amount of time loss due to waiting, boarding, i.e., pick-up and drop-off, and possible detours). Time for boarding was assumed to be 45 s.
3.3. Measuring the Compatibility of AVs in Street Spaces
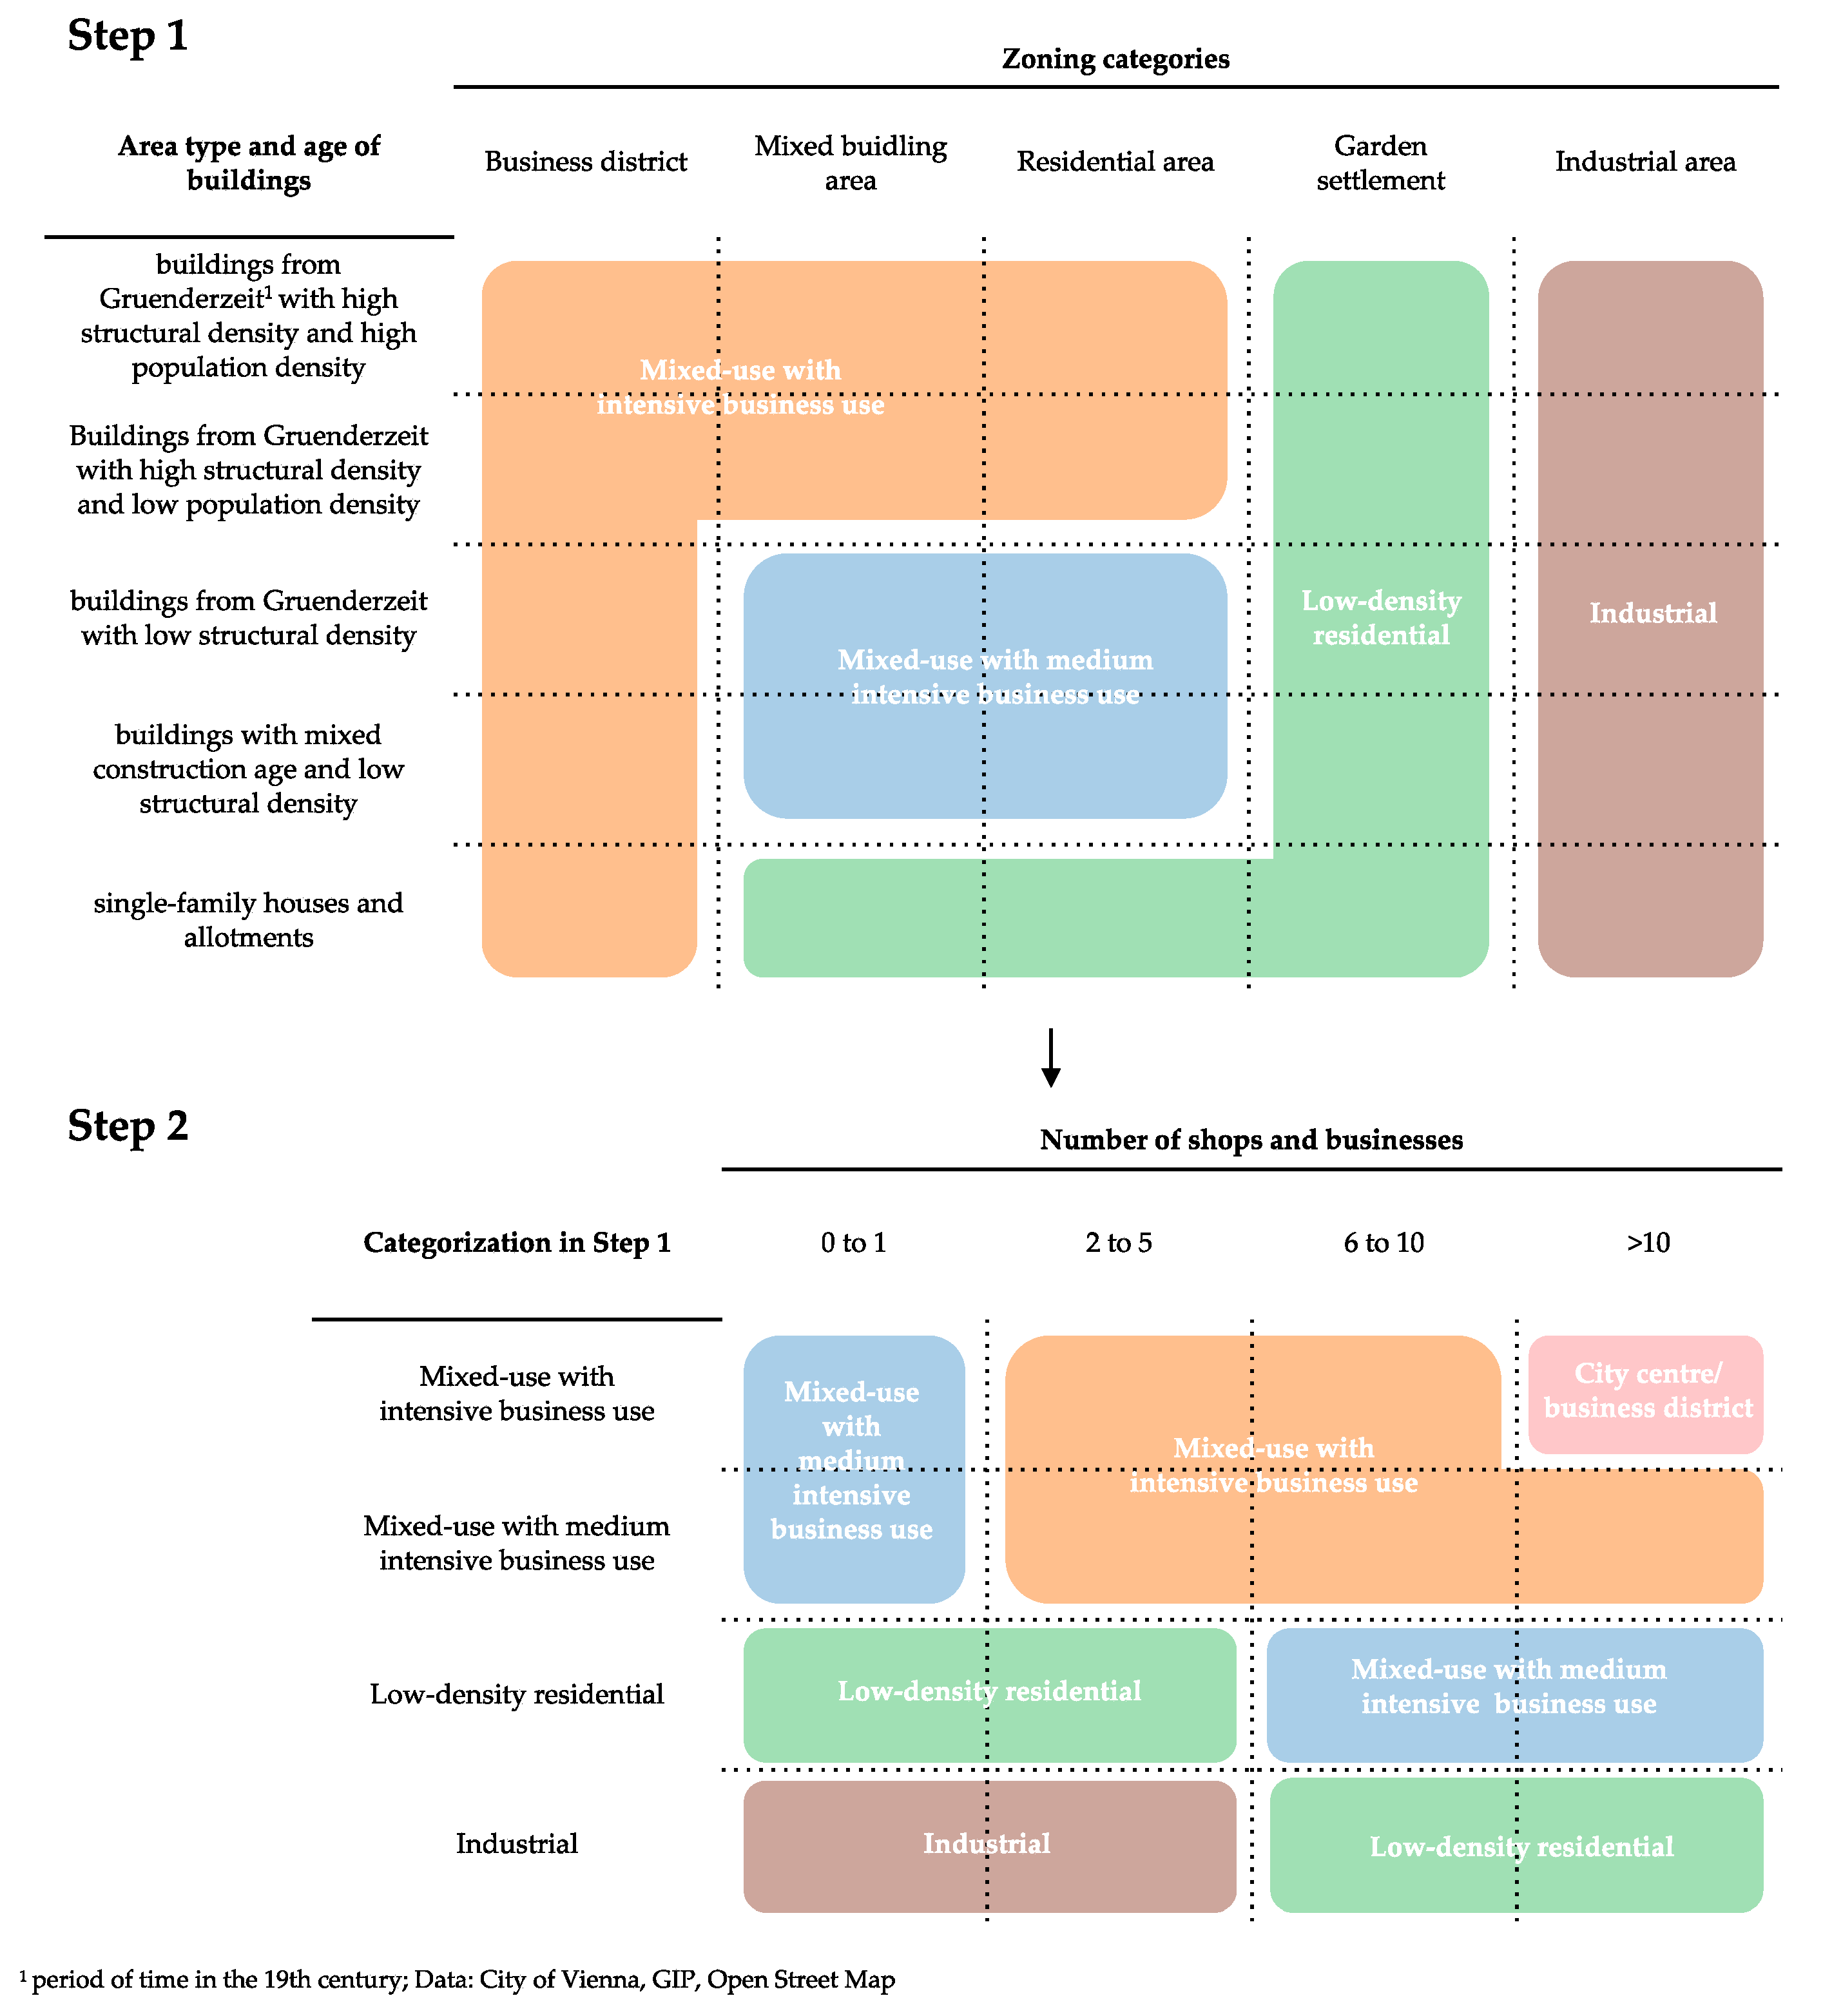
3.3.1. Determining the Maximum Compatible Traffic Volume
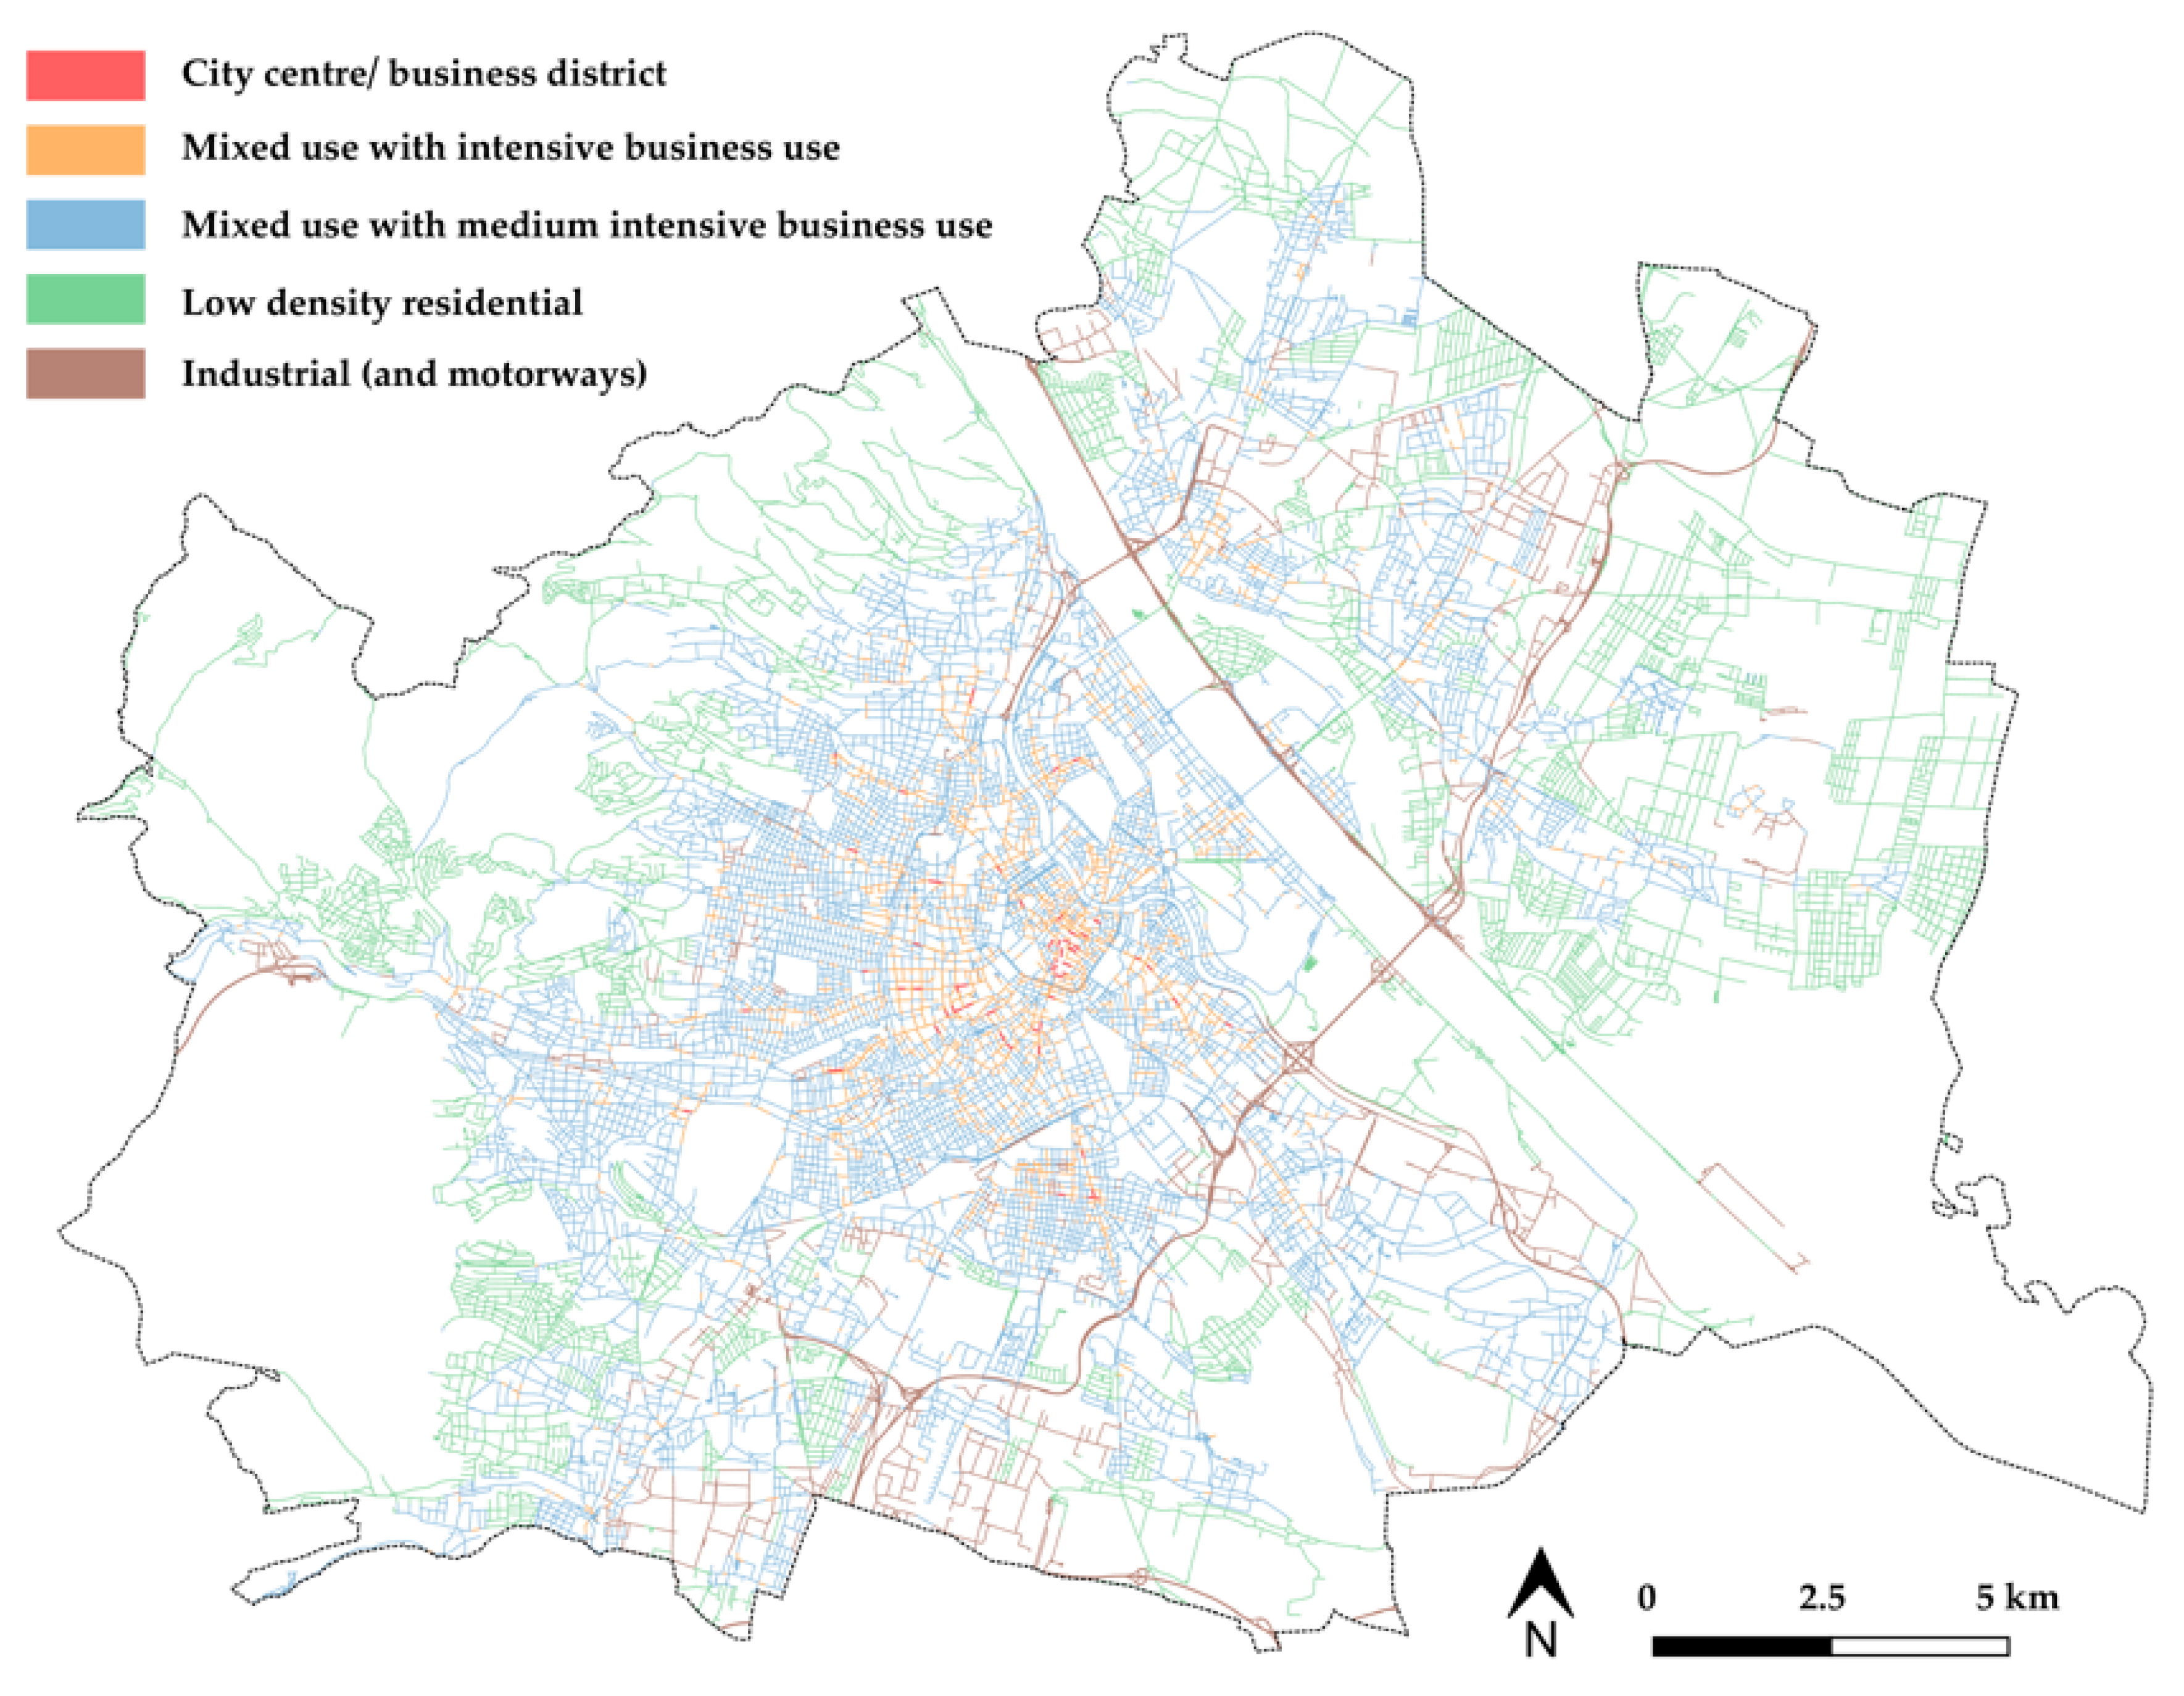
- City center/business district: predominant close block development with more than four floors and intensive business use and shops
- Mixed-use with intensive business use: predominant close block development with more than four floors and medium to intensive business use and shops
- Mixed-use with medium intensive business use: predominant close block development with more than four floors or half-open buildings with two to four floors and medium intensive business use and shops
- Low-density residential: predominant detached and semidetached buildings and allotments with only occasional shops or other public-intensive uses
- Industrial: predominant industrial uses with low demands of residents and no public-intensive uses, such as residential or shopping
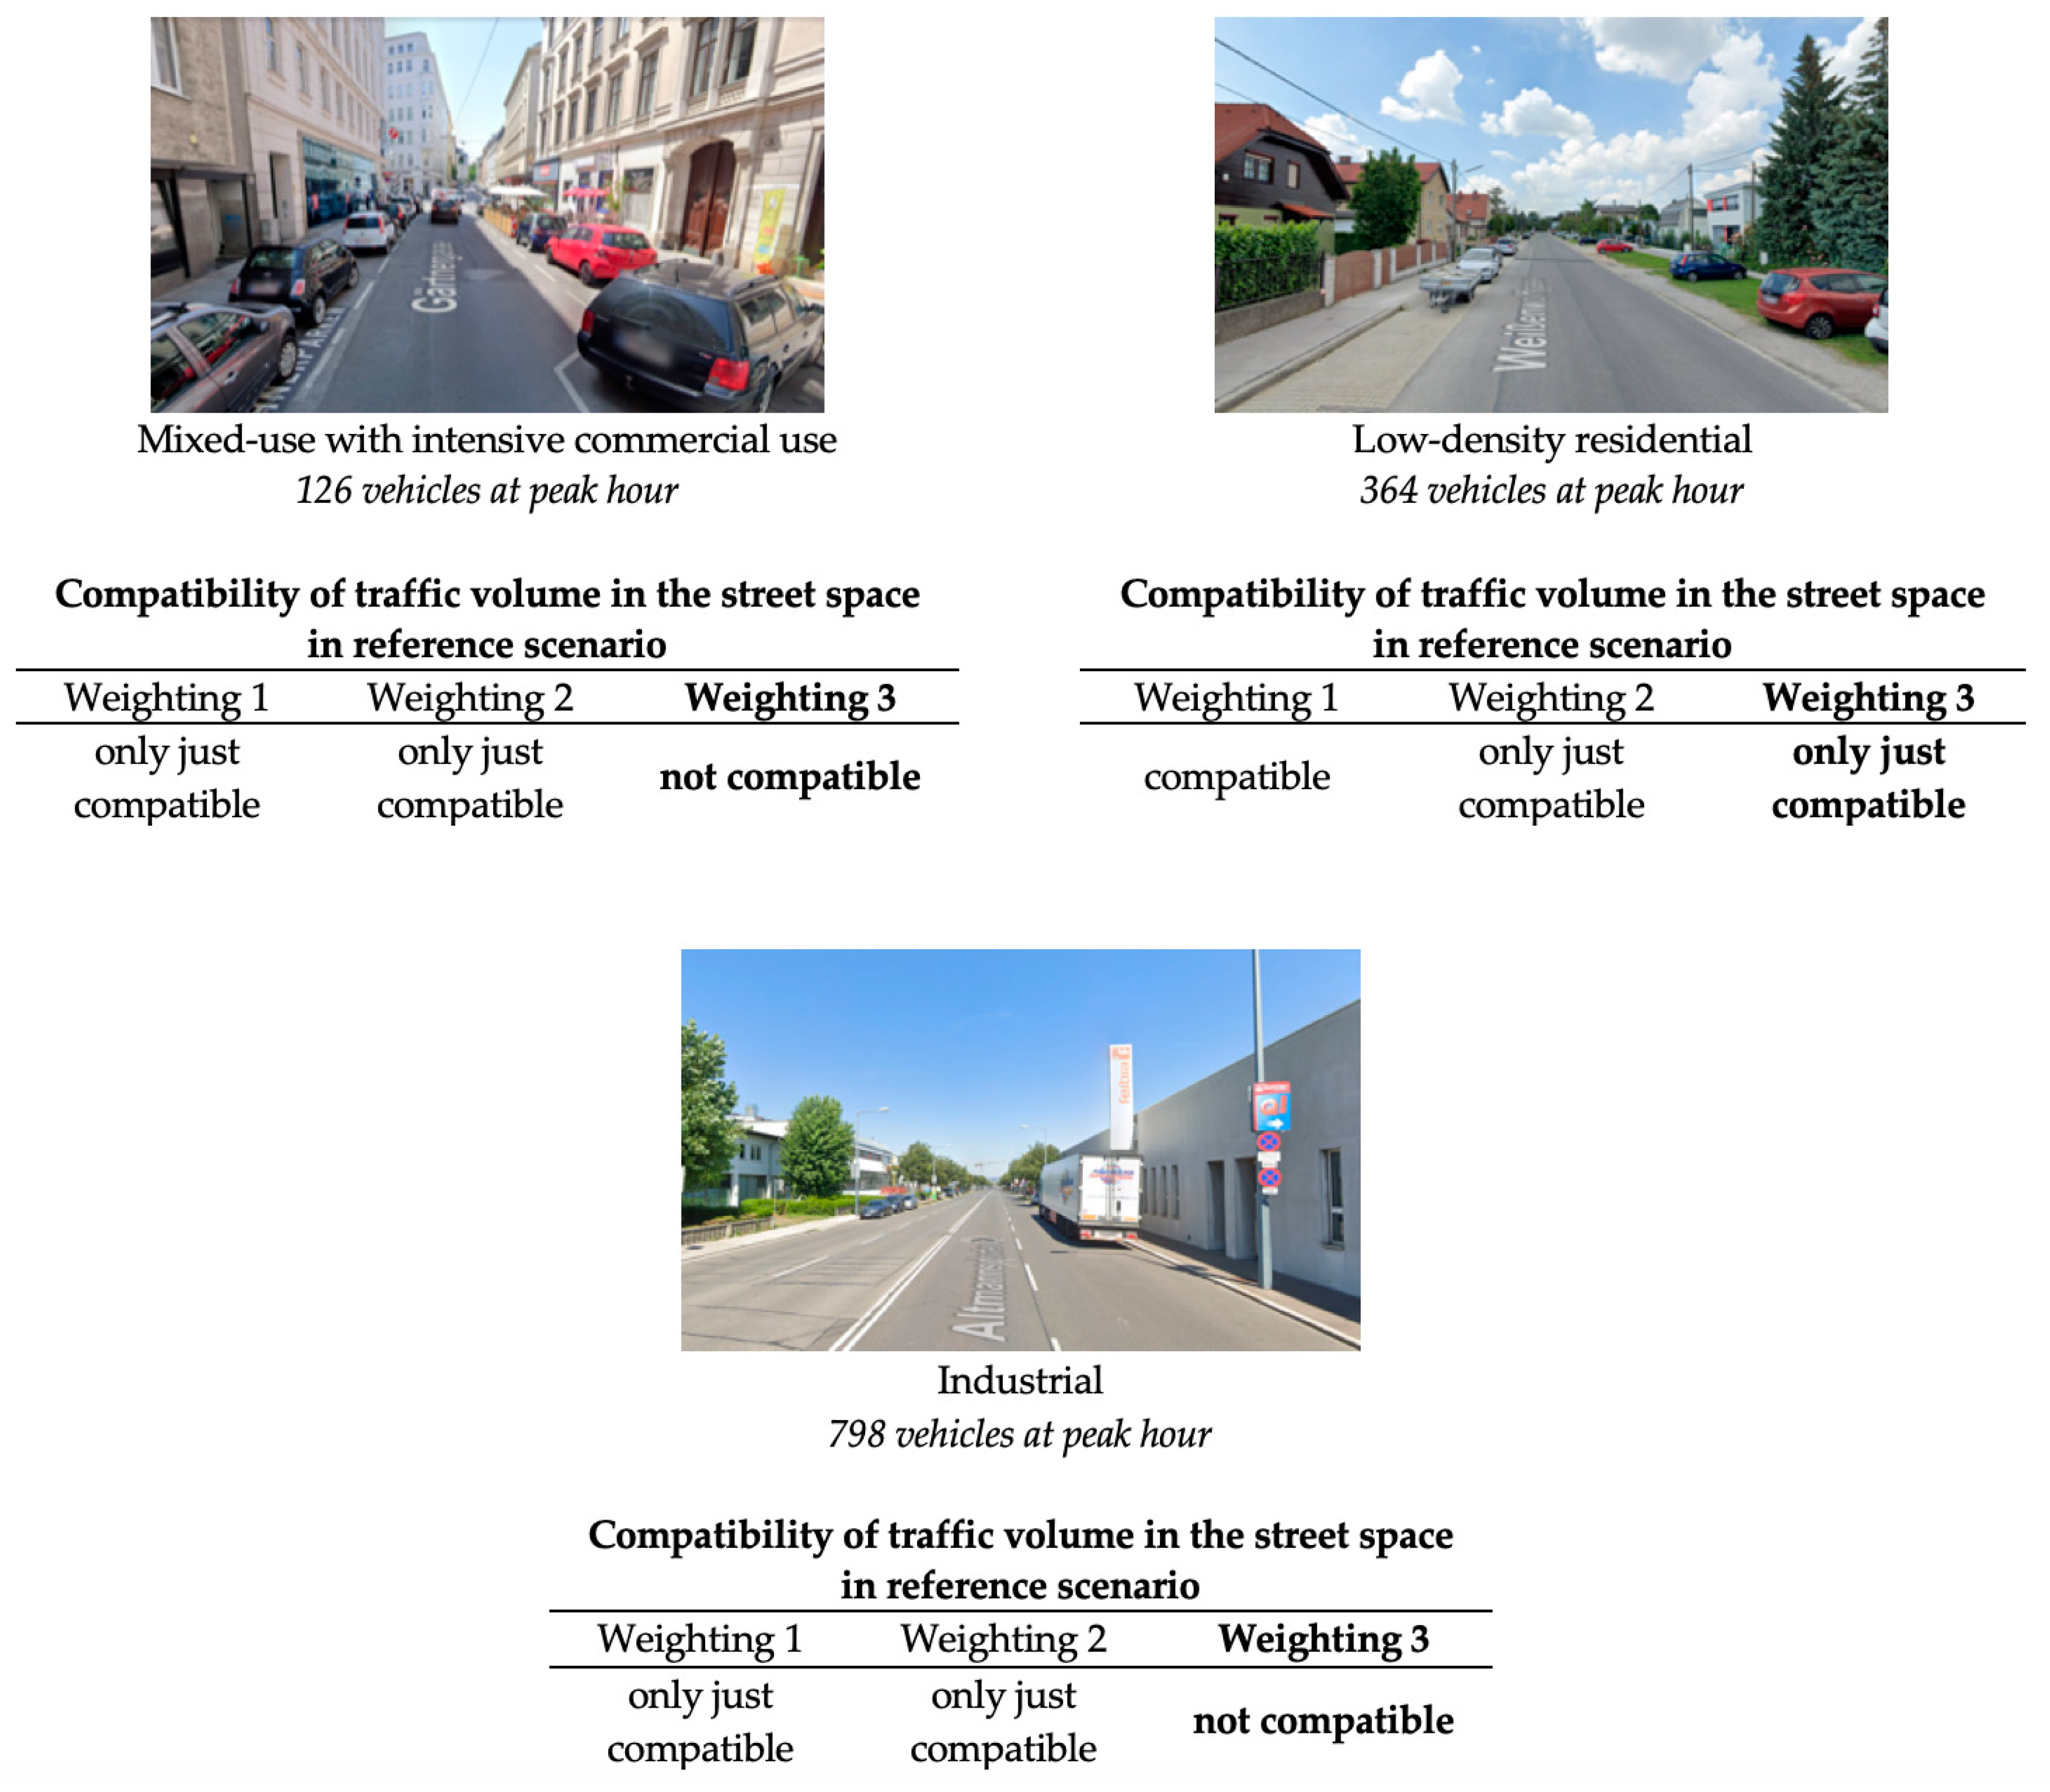
3.3.2. Adapting the Maximum Compatible Traffic Volume Based on Further Characteristics
Assessment of Criteria
Weighting of Criteria
3.3.3. Comparison between Actual Traffic Volume and Adapted Maximum Compatible Traffic Volume
4. Results
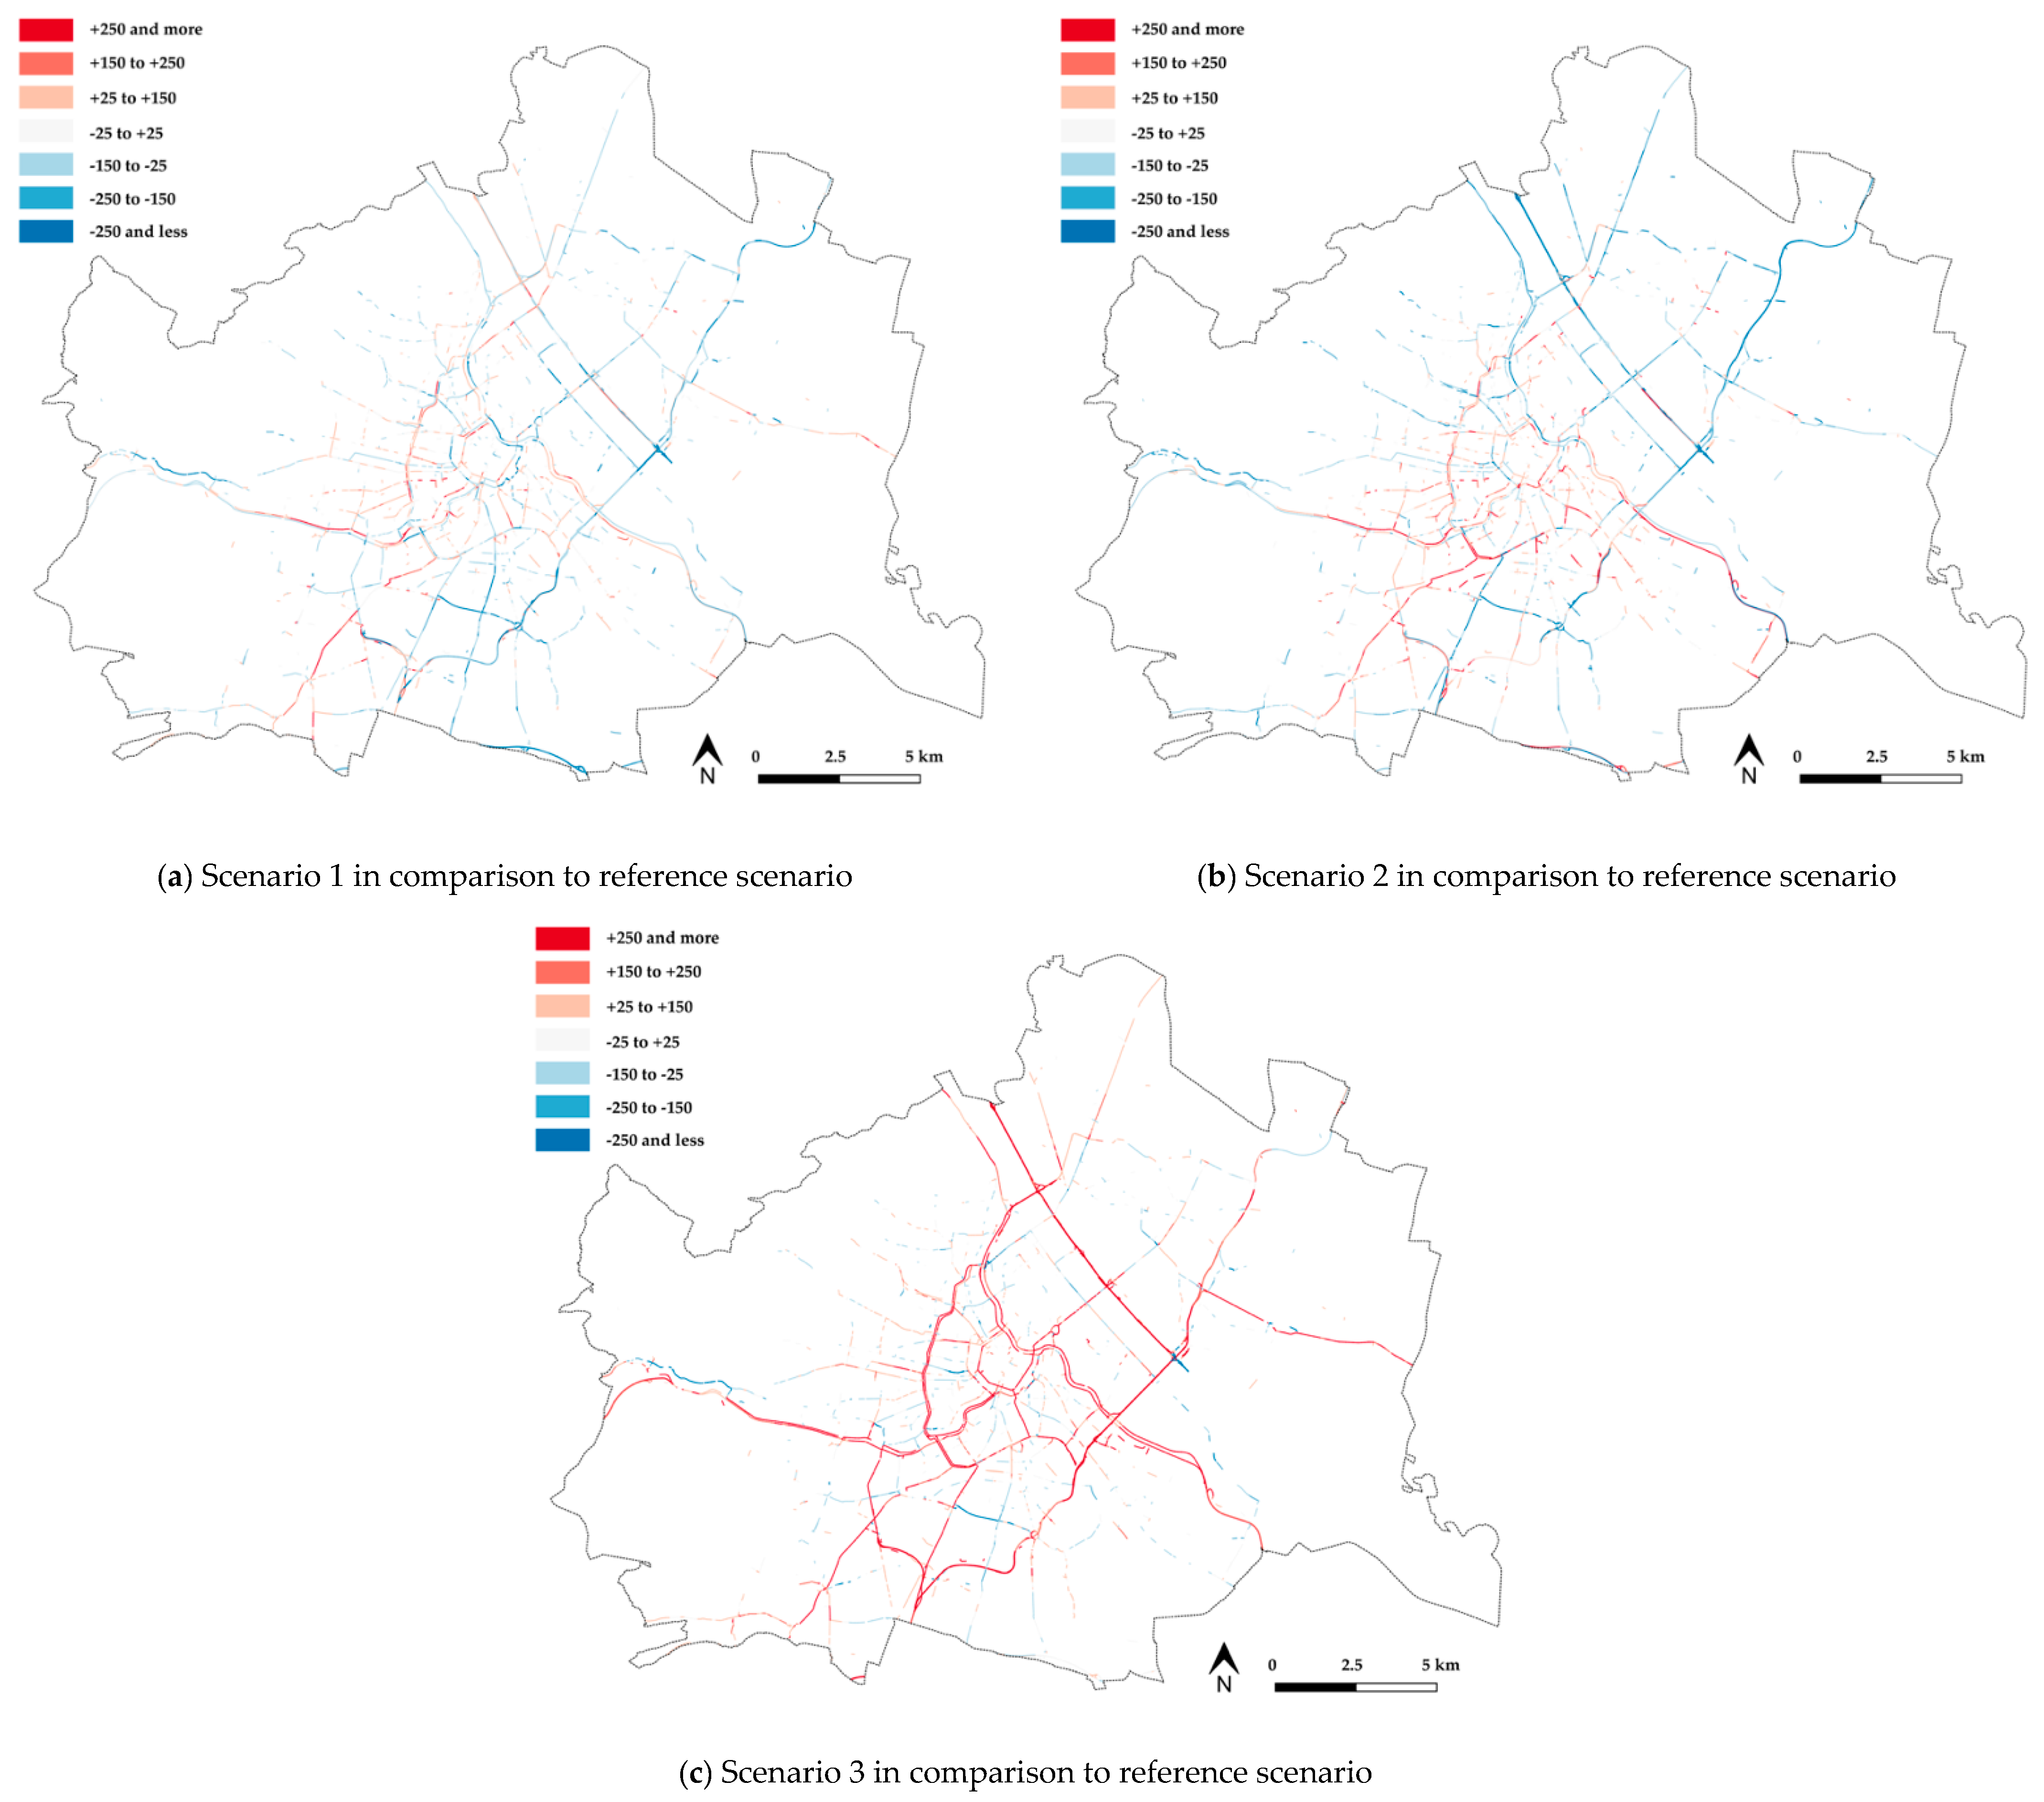
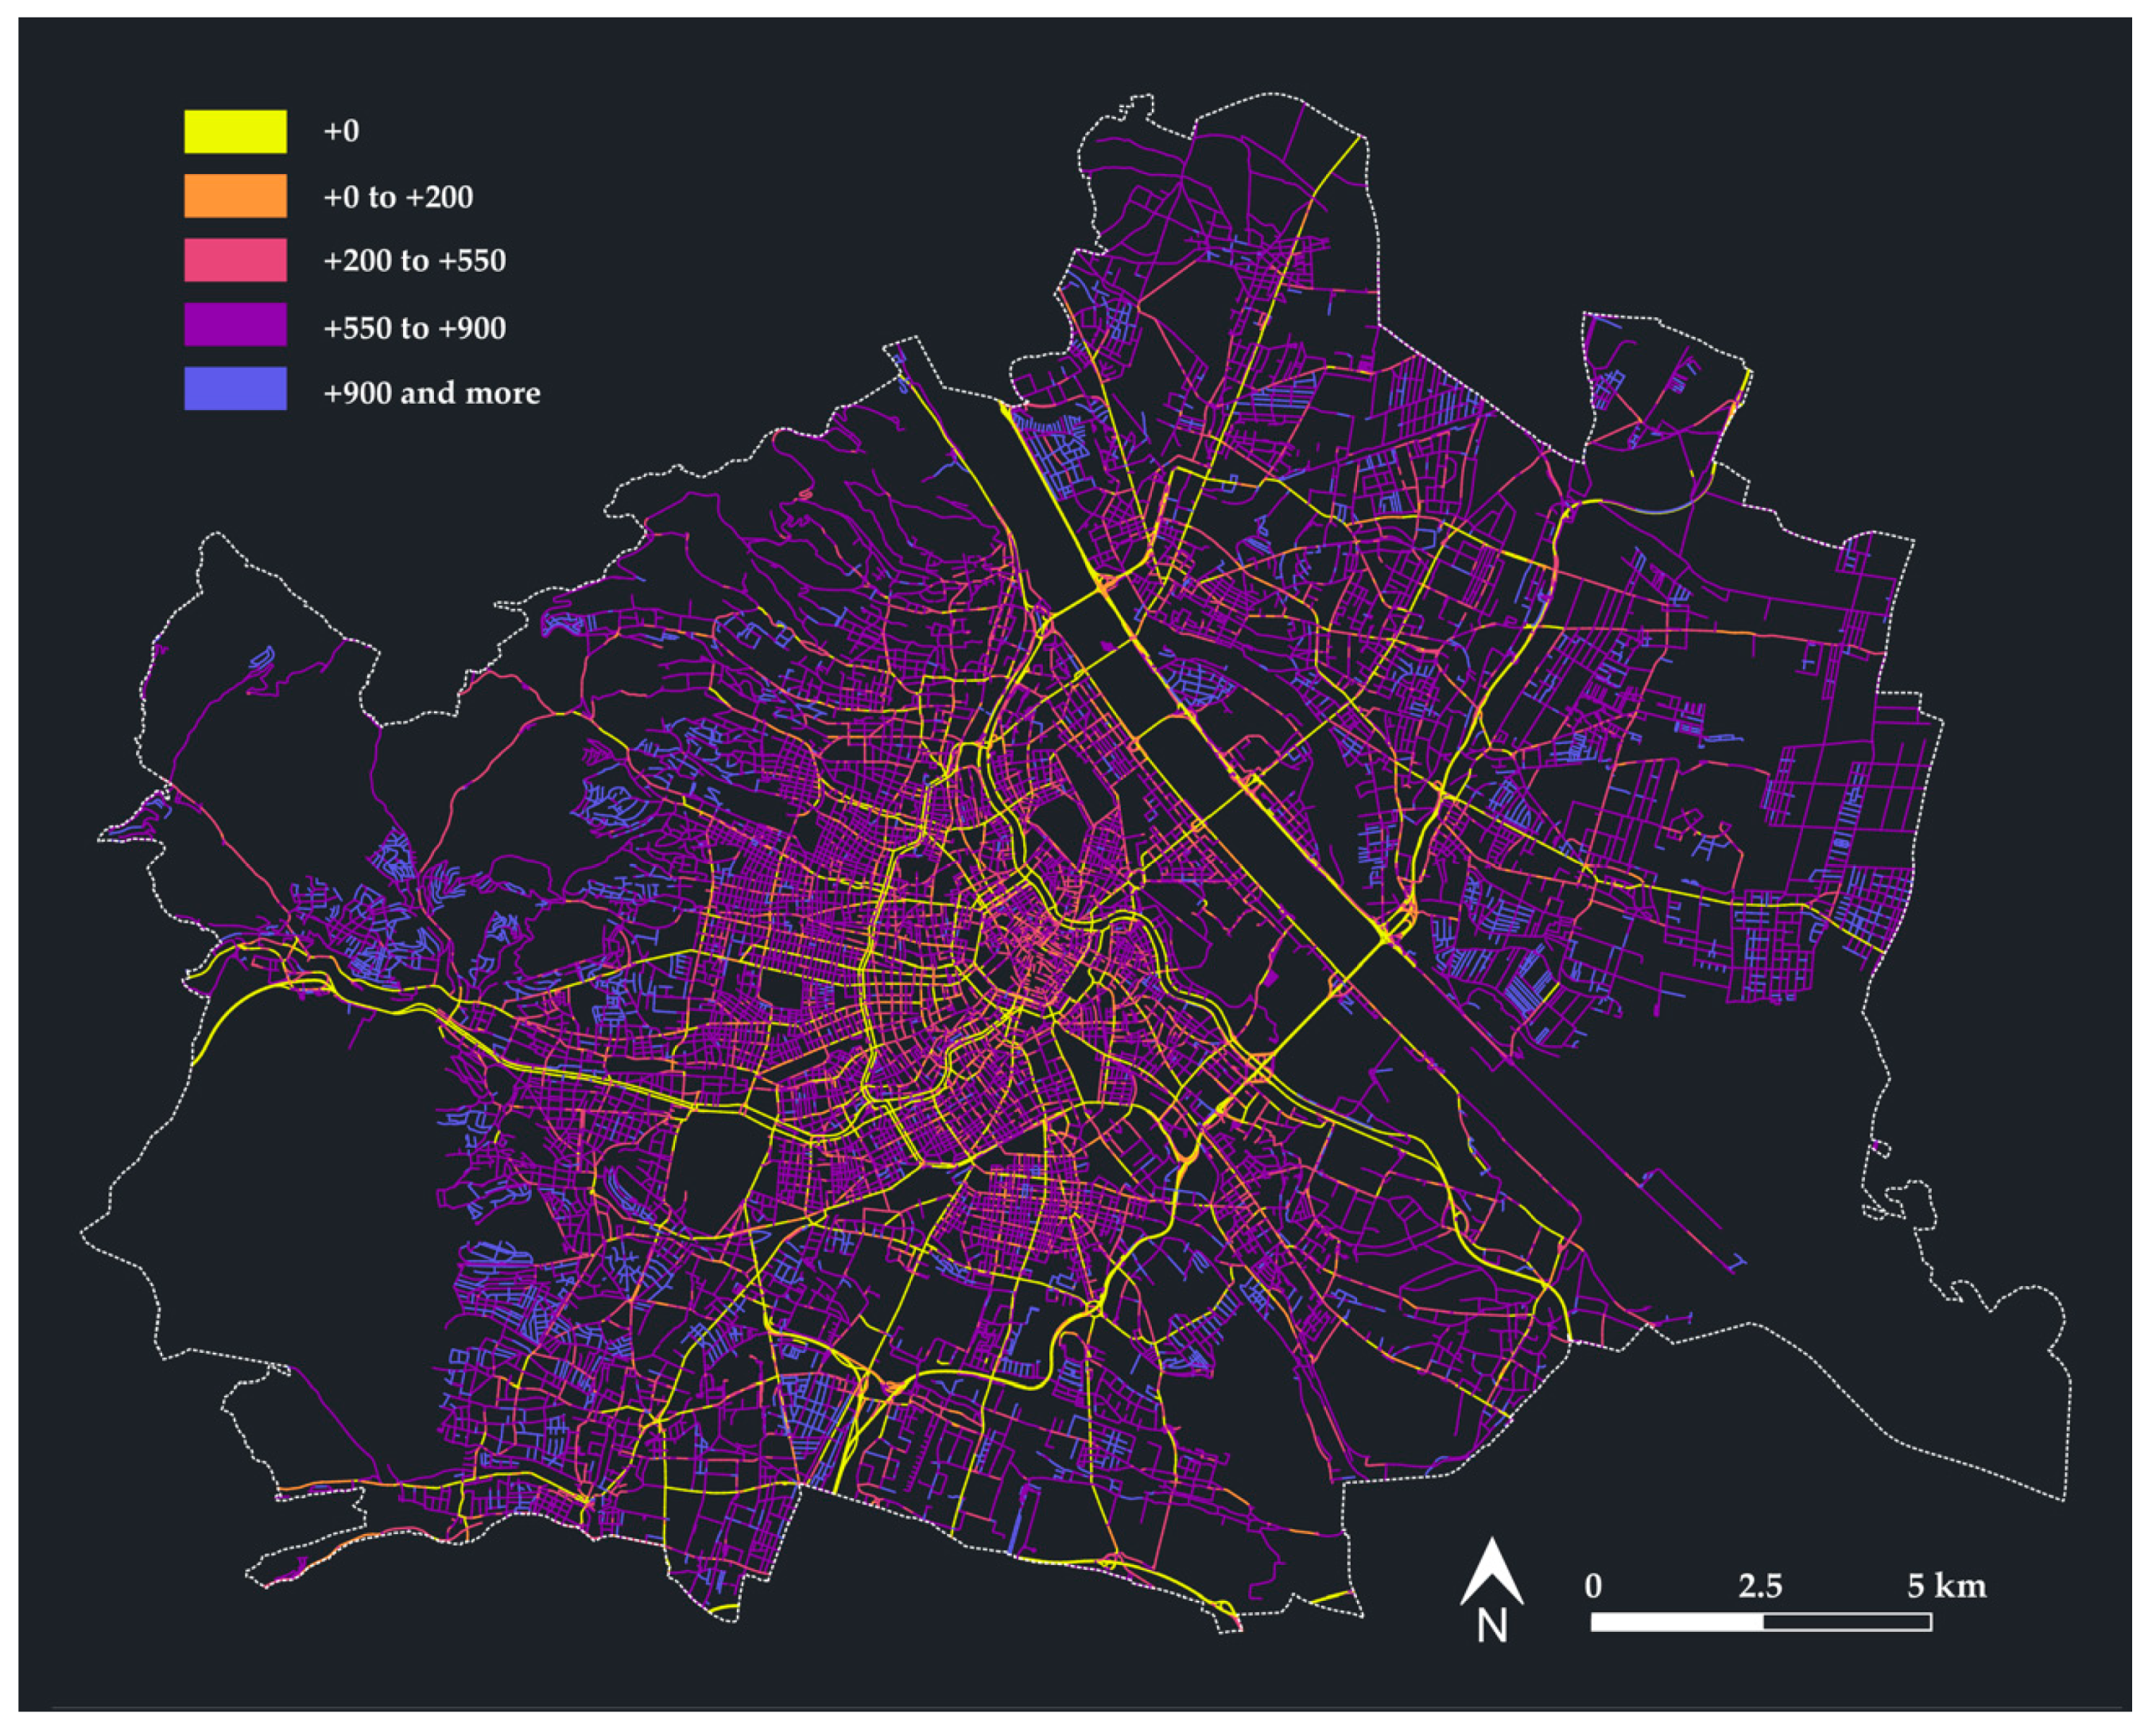
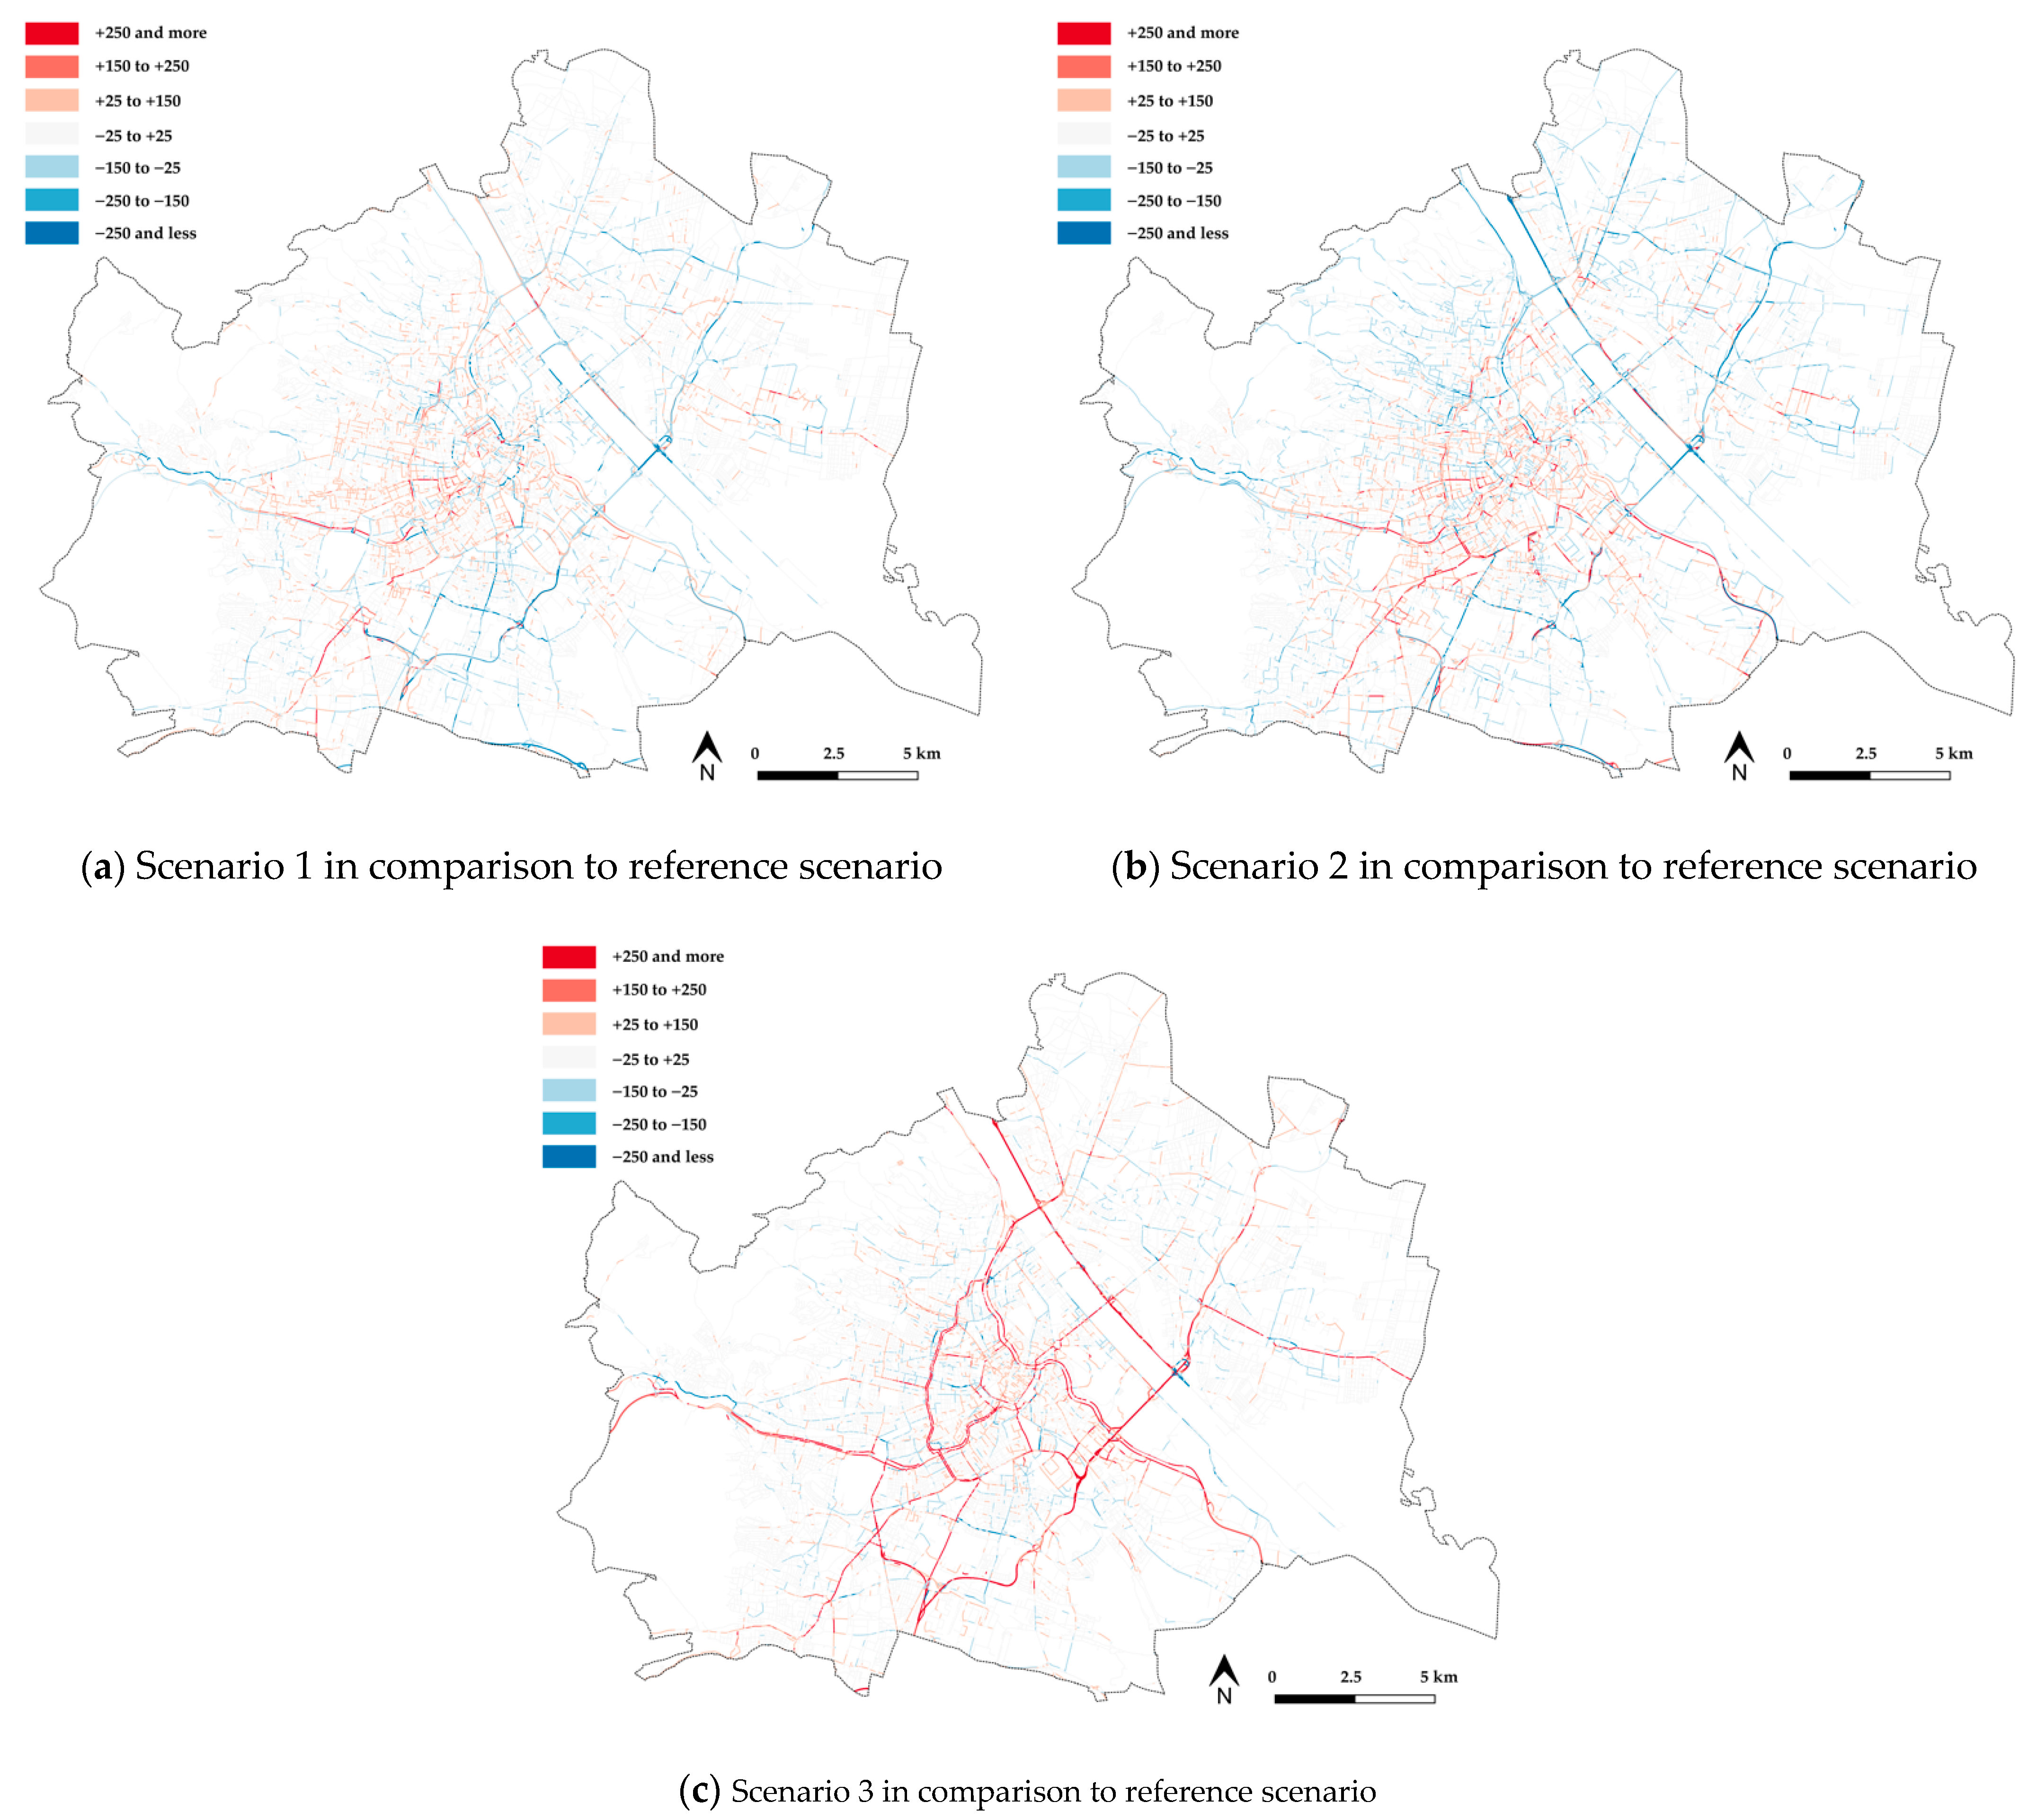
4.1. Street-Level Changes in Traffic Volume at Peak Hour
4.2. Assessment of the Compatibility of Street Spaces
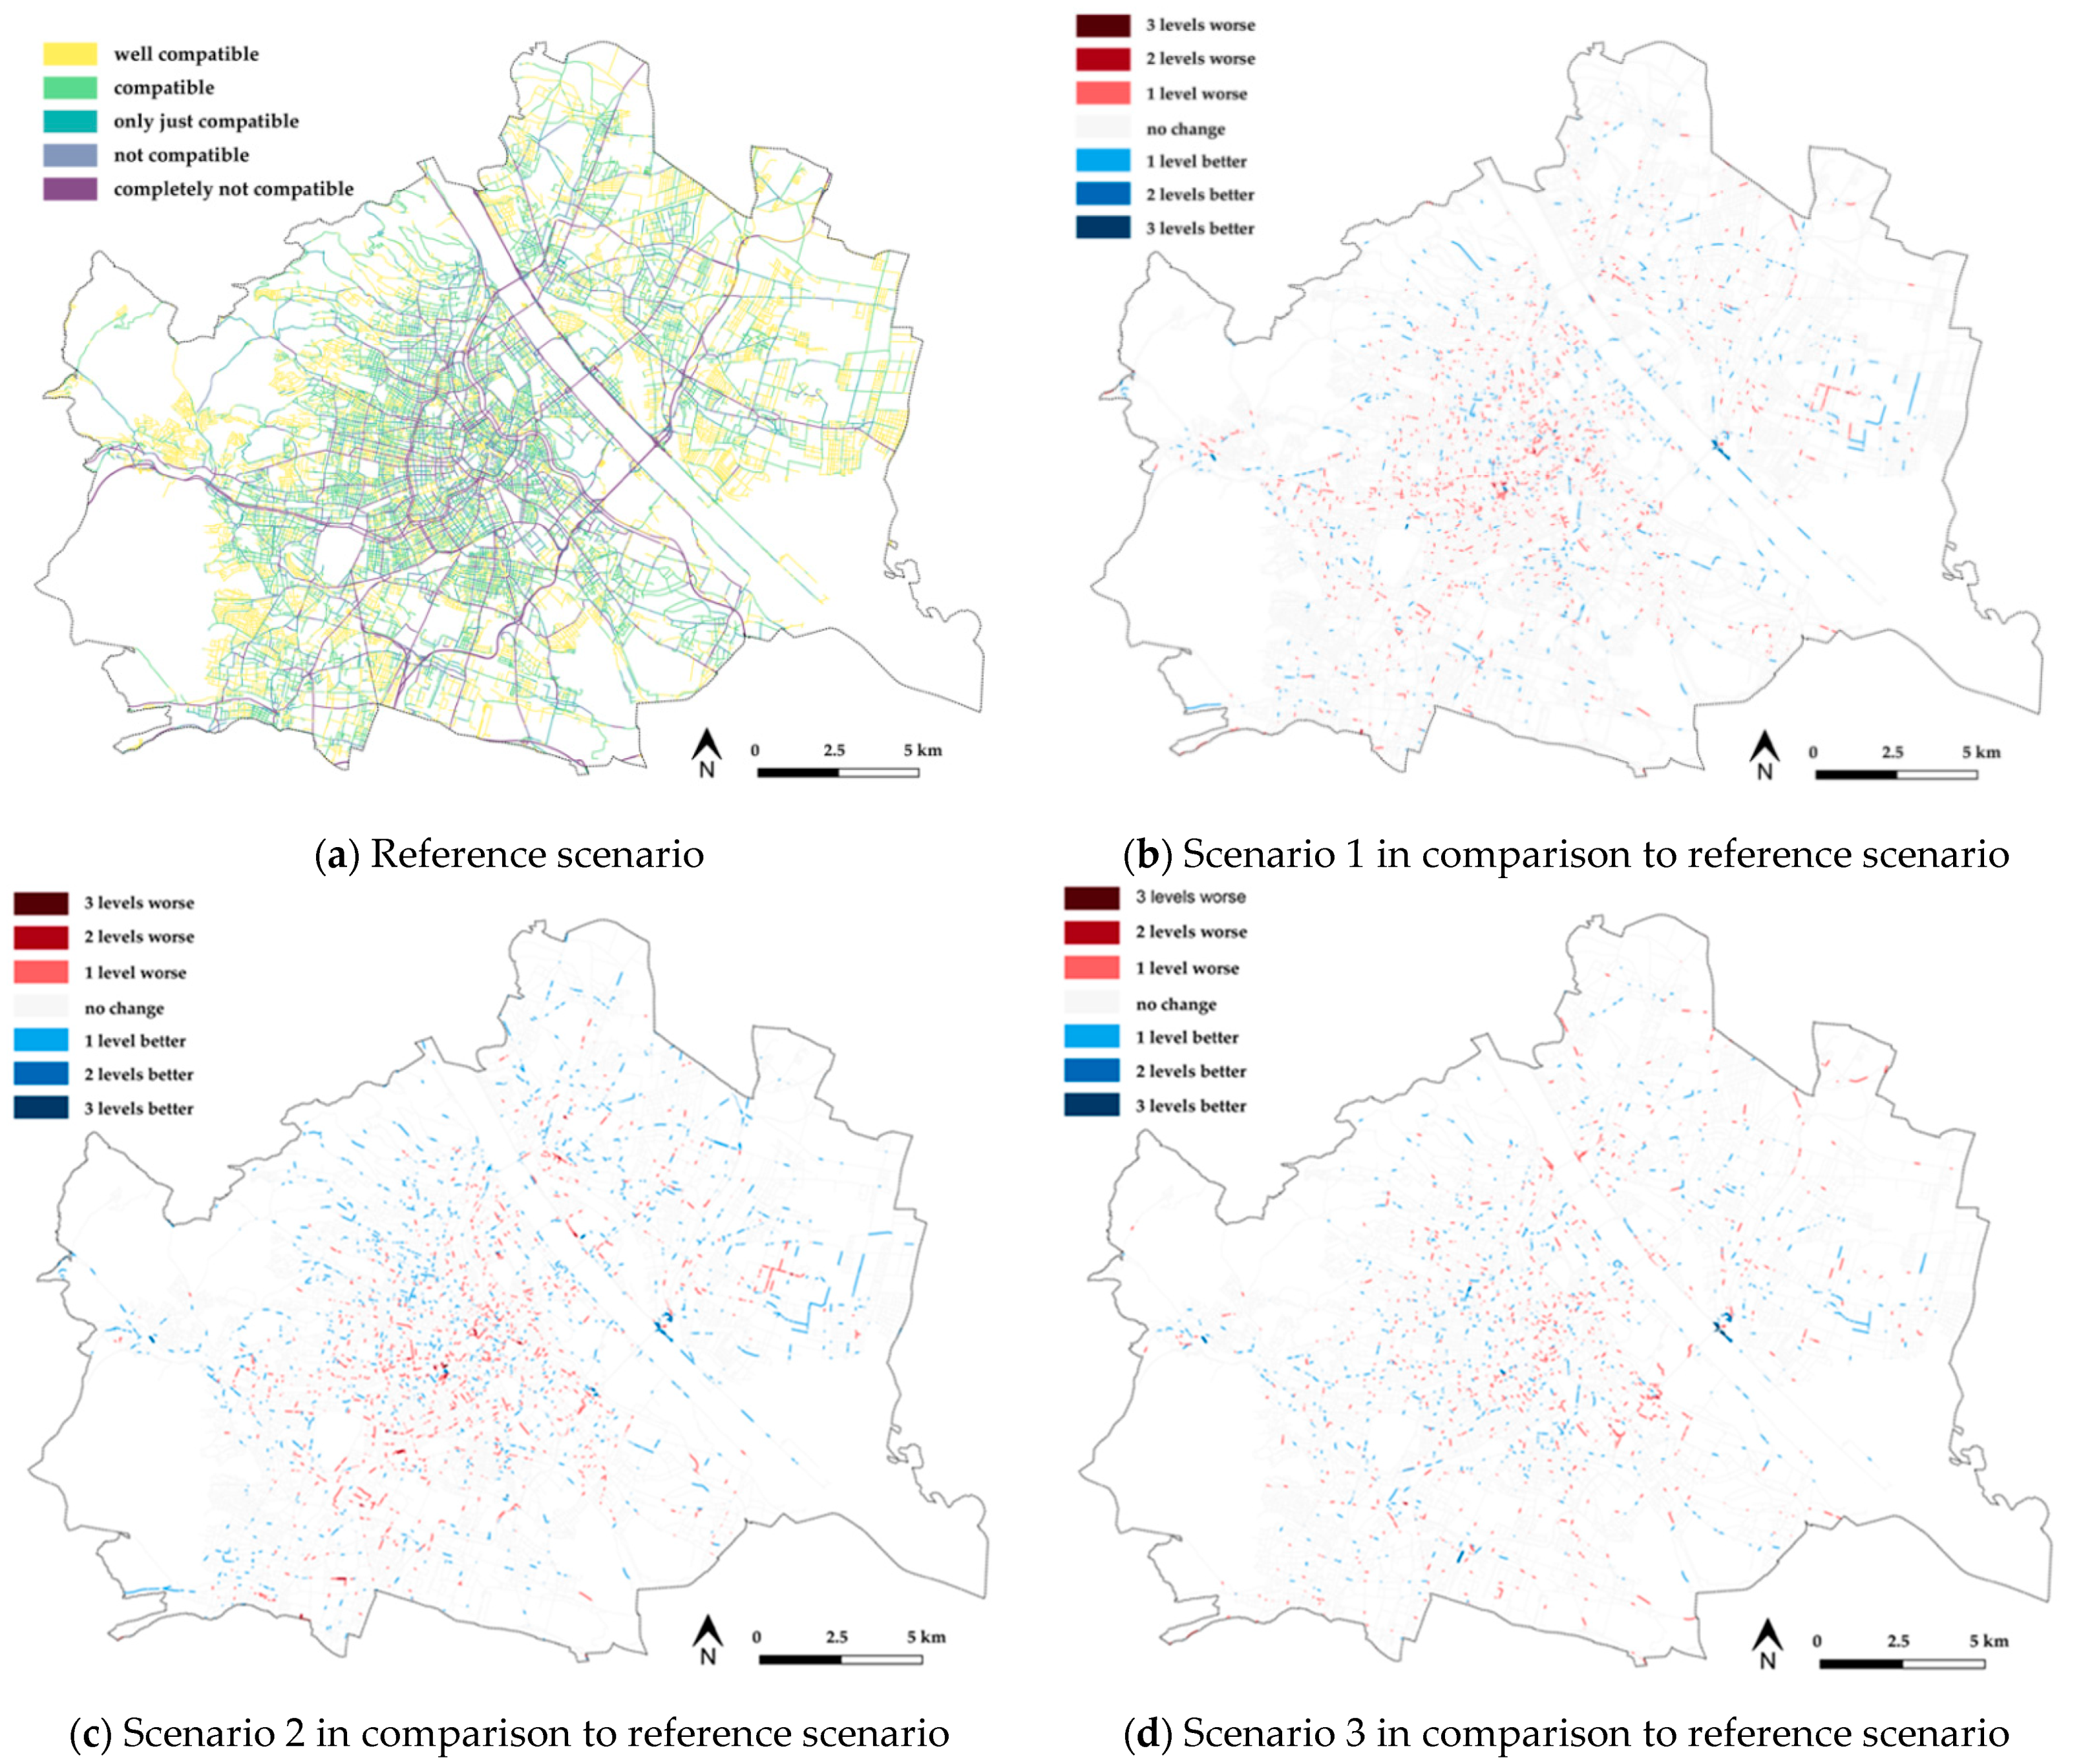
4.3. Sensitivity Analysis
- For Scenario 1 (SAVs with door-to-door service), the share of street spaces with well compatible and compatible traffic volumes decreases in comparison to the reference scenario, while the share of street spaces with only just compatible traffic volumes increases, indicating a shift from street spaces with well compatible and compatible traffic volumes to such with only just compatible traffic. However, on the other hand, the share of street spaces with completely not compatible traffic volumes also decreases in comparison to the reference scenario, indicating likewise an improvement in compatibility.
- Similarly, for Scenario 2 (SAVs with a stop-based service) also mixed effects are shown: On the one hand, an increase in the share of street sections with well compatible traffic volumes, in comparison to the reference scenario, is shown, indicating an improvement in compatibility. On the other hand, a decrease in the share of street spaces with compatible and only just compatible traffic volumes is shown, while the share of street spaces with not compatible traffic volumes increases and the share of street spaces with completely not compatible traffic volumes mainly remains the same, indicating also a deterioration of compatibility for some street sections.
- For Scenario 3 (private AVs), however, the share of street spaces with well compatible traffic volumes decreases (and the share of street spaces with (only just) compatible traffic increases), while also the share of street spaces with completely not compatible traffic volumes increases (and the share of street spaces with not compatible traffic decreases)—indicating both a shift of street spaces with well compatible traffic volumes to street spaces with compatible traffic and a shift from street spaces with not compatible traffic volumes to street spaces with completely not compatible traffic, i.e., an overall decrease in compatibility.
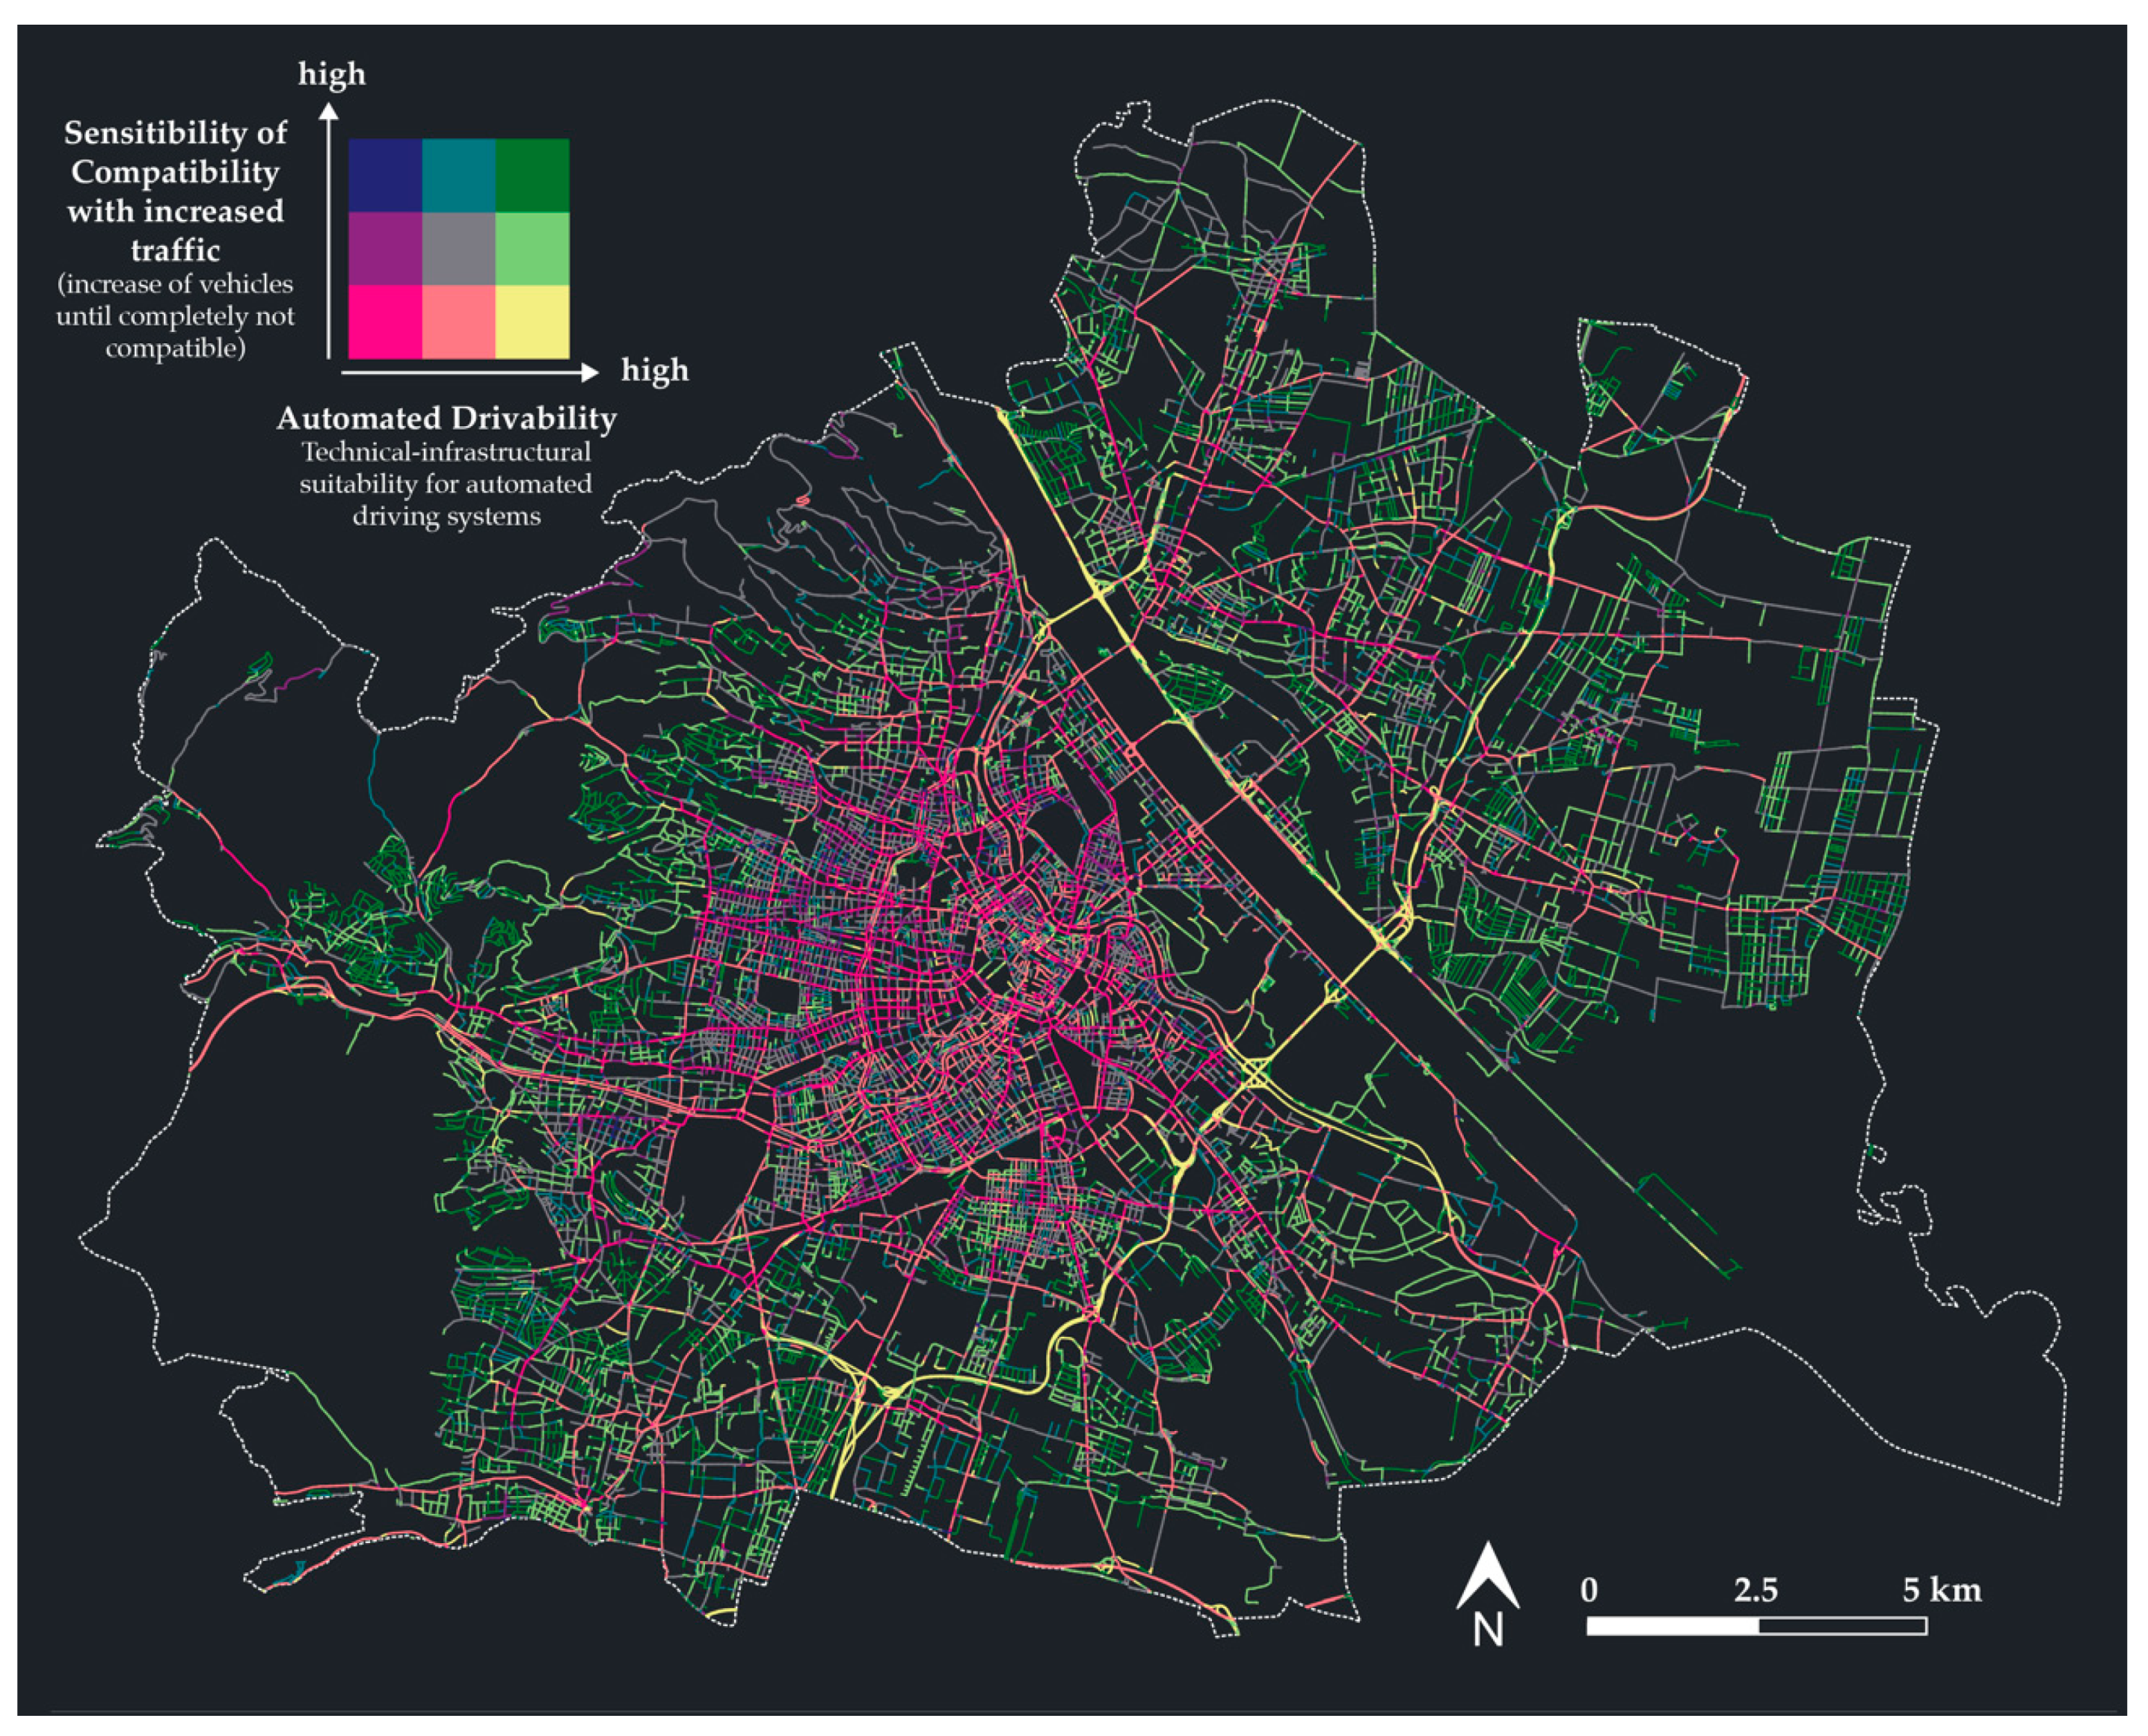
4.4. Sensibility of the Compatibility with Increased Traffic in Street Spaces and Interlinking with the Technical–Infrastructural Suitability of Street Spaces for AVs
5. Discussion
6. Conclusions and Recommendations for Further Research
Author Contributions
Funding
Institutional Review Board Statement
Informed Consent Statement
Data Availability Statement
Acknowledgments
Conflicts of Interest
Appendix A. Categorization of Areas for the Maximum Compatible Traffic Volume
Appendix B. Criteria for Adapting the Maximum Compatible Traffic Volume

References
- González-González, E.; Nogués, S.; Stead, D. Automated vehicles and the city of tomorrow: A backcasting approach. Cities 2019, 94, 153–160. [Google Scholar] [CrossRef] [Green Version]
- Gavanas, N. Autonomous Road Vehicles: Challenges for Urban Planning in European Cities. Urban Sci. 2019, 3, 61. [Google Scholar] [CrossRef] [Green Version]
- Staricco, L.; Rappazzo, V.; Scudellari, J.; Brovarone, E.V. Toward Policies to Manage the Impacts of Autonomous Vehicles on the City: A Visioning Exercise. Sustainability 2019, 11, 5222. [Google Scholar] [CrossRef] [Green Version]
- Pernestål, A.; Engholm, A.; Kristoffersson, I.; Hammes, J.J. The impacts of automated vehicles on the transport system and how to create policies that target sustainable development goals. In Shaping Smart Mobility Futures: Governance and Policy Instruments in Times of Sustainability Transitions; Paulsson, A., Sørensen, C.H., Eds.; Emerald: Bingled, UK, 2020; pp. 37–53. [Google Scholar]
- Milakis, D.; van Arem, B.; van Wee, B. Policy and society related implications of automated driving: A review of literature and directions for future research. J. Intell. Transp. Syst. 2017, 21, 324–348. [Google Scholar] [CrossRef]
- Soteropoulos, A.; Berger, M.; Ciari, F. Impacts of automated vehicles on travel behaviour and land use: An international review of modelling studies. Transp. Rev. 2019, 39, 29–49. [Google Scholar] [CrossRef]
- Hörl, S.; Becker, F.; Dubernet, T.; Axhausen, K.W. Induzierter Verkehr Durch Autonome Fahrzeuge: Eine Abschätzung; Bundesamt für Strassen: Bern, Switzerland, 2019. [Google Scholar]
- Gehl Architects, Downtown Seattle: Public Spaces & Public Life. City of Seattle. 2009. Available online: www.seattle.gov/Documents/Departments/SDCI/Codes/PublicSpacesLifeIntro.pdf (accessed on 4 January 2021).
- Bertolini, L. From “streets for traffic” to “streets for people”: Can street experiments transform urban mobility? Transp. Rev. 2020, 40, 734–753. [Google Scholar] [CrossRef]
- FGSV—Forschungsgesellschaft für Straßen- und Verkehrswesen. Directives for the Design of Urban Roads; RASt 06 2012; FGSV—Forschungsgesellschaft für Straßen- und Verkehrswesen: Cologne, Germany, 2012. [Google Scholar]
- Bühlmann, F.; Laube, M. Verträglichkeit Straßenraum; Methodik und Ergebnisse: Zurich, Switzerland, 2013. [Google Scholar]
- Häfliger, R.; Bubenhofer, J.; Hagedorn, C.; Zweibrücken, K.; Condrau, S.; Baier, R. Verträglichkeitskriterien für Straßenraum innerorts; Bundesamt für Strassen: Bern, Switzerland, 2015. [Google Scholar]
- Jensen, S.U. Pedestrian and Bicyclist Level of Service on Roadway Segments. Transp. Res. Rec. 2007, 2031, 43–51. [Google Scholar] [CrossRef] [Green Version]
- Parkin, J.; Clark, B.; Clayton, W.; Ricci, M.; Parkhurst, G. Understanding Interactions between Autonomous Vehicles and Other Road Users. A Literature Review. Project Report. University of the West of England, Bristol. Available online: http://eprints.uwe.ac.uk/29153 (accessed on 15 January 2021).
- Anciaes, P.R.; Jones, P.; Mindell, J.S. Community Severance: Where Is It Found and at What Cost? Transp. Rev. 2016, 36, 293–317. [Google Scholar] [CrossRef]
- Abegg, C.; Girod, C.; Fischer, K.; Pahud, N.; Raymann, L.; Perret, F. Einsatz Automatisierter Fahrzeuge im Alltag—Denkbare Anwendungen und Effekte in der Schweiz. Schlussbericht Modul 3d Städte und Agglomerationen. 2018. Available online: www.ebp.ch/sites/default/files/proj-ect/uploads/2018-08-30%20aFn_3d%20St%C3%A4dte-Agglomerationen%20Schlussbericht_1.pdf (accessed on 1 October 2020).
- Heinrichs, D. Autonomous driving and urban land use. In Autonomous Driving; Maurer, M., Gerdes, C.J., Lenz, B., Winner, H., Eds.; Springer: Heidelberg, Germany, 2016; pp. 213–231. [Google Scholar]
- Curtis, C.; McLeod, S.; Hultén, J.; Pettersson-Lofstedt, F.; Paulsson, A.; Hedegaard Sørensen, C. Knowledge for policy-making in times of uncertainty: The case of autonomous vehicle model results. Transp. Rev. 2020, 1–21. [Google Scholar] [CrossRef]
- Zhao, Y.; Kockelman, K.M. Anticipating the regional impacts of connected and automated vehicle travel in Austin, Texas. J. Urban Plan. Dev. 2018, 144, 04018032. [Google Scholar] [CrossRef]
- Childress, S.; Nichols, B.; Charlton, B.; Coe, S. Using an activity-based model to explore the potential impacts of automated vehicles. Transp. Res. Rec. 2015, 2493, 99–106. [Google Scholar] [CrossRef]
- Zhang, W.; Guhathakurta, S.; Khalil, E.B. The impact of private autonomous vehicles on vehicle ownership and unoccupied VMT generation. Transp. Res. Part C 2018, 90, 156–165. [Google Scholar] [CrossRef] [Green Version]
- International Transport Forum. Urban Mobility System Upgrade-How Shared Self-Driving Cars Could Change City Traffic; International Transport Forum: Paris, France, 2015. [Google Scholar]
- Liu, J.; Kockelman, K.M.; Boesch, P.M.; Ciari, F. Tracking a system of shared autonomous vehicles across the Austin, Texas network using agent-based simulation. Transportation 2017, 44, 1261–1278. [Google Scholar] [CrossRef]
- Boesch, P.M.; Ciari, F.; Axhausen, K.W. Transport policy optimization with autonomous vehicles. Transp. Res. Rec. 2018, 2672, 698–707. [Google Scholar] [CrossRef] [Green Version]
- Oh, S.; Seshadri, R.; Azevedo, C.L.; Kumar, N.; Basak, K.; Ben-Akiva, M. Assessing the impacts of automated mobility-on-demand through agent-based simulation: A study of Singapore. Transp. Res. Part A 2020, 138, 367–388. [Google Scholar]
- Fagnant, D.J.; Kockelman, K.M.; Bansal, P. Operations of shared autonomous vehicle fleet for Austin, Texas, market. Transp. Res. Rec. 2015, 2563, 98–106. [Google Scholar] [CrossRef] [Green Version]
- Friedrich, M.; Hartl, M. MEGAFON-Modellergebnisse geteilter autonomer Fahrzeugflotten des öffentlichen Nahverkehrs; University of Stuttgart: Stuttgart, Germany, 2016. [Google Scholar]
- Auld, J.; Sokolov, V.; Stephens, T.S. Analysis of the effects of connected-automated vehicle technologies on travel demand. Transp. Res. Rec. 2017, 2625, 1–8. [Google Scholar] [CrossRef]
- Kim, K.; Rousseau, G.; Freedman, J.; Nicholson, J. The Travel Impact of Autonomous Vehicles In Metro Atlanta through Activity-Based Modeling. In Proceedings of the 15th TRB National Transportation Planning Applications Conference, Atlantic City, NJ, USA, 17–21 May 2015. [Google Scholar]
- Martinez, L.M.; Viegas, J.M. Assessing the impacts of deploying a shared self-driving urban mobility system: An agent-based model applied to the city of Lisbon, Portugal. Int. J. Transp. Sci. Technol. 2017, 6, 13–27. [Google Scholar] [CrossRef]
- Spieser, K.; Treleaven, K.; Zhang, R.; Frazzoli, E.; Morton, D.; Pavone, M. Toward a systemic approach to the design and evaluation of automated mobility-on-demand systems: A case study in Singapore. In Road Vehicle Automation. Lecture Notes in Mobility; Meyer, G., Beiker, S., Eds.; Springer: Cham, Switzerland, 2014; pp. 229–245. [Google Scholar]
- Zhang, W. The Interaction between Land Use and Transportation in the Era of Shared Autonomous Vehicles: A Simulation Model. Ph.D. Thesis, Georgia Institute of Technology, Atlanta, GA, USA, 2017. [Google Scholar]
- Zambrano-Martinez, J.L.; Calafate, C.T.; Soler, D.; Lemus-Zúñiga, L.G.; Cano, J.C.; Manzoni, P.; Gayraud, T. A centralized route-management solution for autonomous vehicles in urban areas. Electronics 2019, 8, 722. [Google Scholar] [CrossRef] [Green Version]
- Rossi, F.; Zhang, R.; Hindy, Y.; Pavone, M. Routing autonomous vehicles in congested transportation networks: Structural properties and coordination algorithms. Auton. Robot. 2018, 42, 1427–1442. [Google Scholar] [CrossRef] [Green Version]
- Horni, A.; Nagel, K.; Axhausen, K.W. The Multi-Agent Transport Simulation MATSim; Ubiquity: London, UK, 2016. [Google Scholar]
- Harb, M.; Stathopoulos, A.; Shiftan, Y.; Walker, J.L. What do we (Not) know about our future with automated vehicles? Transp. Res. Part C 2021, 123, 102948. [Google Scholar] [CrossRef]
- Frehn, M.; Steinberg, G.; Schröder, S. Methodik und Ergebnisse der Straßenraumverträglichkeit. Verkehrsentwicklungsplan Bremen 2025. 2013. Available online: http://www.bau.bremen.de/sixcms/media.php/13/130228_E03_Strassenraumvertraeglichkeit_Methodik_Ergebnisse.pdf (accessed on 12 February 2021).
- Baier, R.; Hebel, C.; Jachtmann, Y.; Reinartz, A.; Schäfer, K.H.; Warnecke, A. Stadt Mönchengladbach. Untersuchungen zur Verkehrsentwicklungsplan 2011, BSV—Büro für Stadt- und Verkehrsplanung Reinhold Baier, Aachen. Available online: https://tinyurl.com/yaqvgpwk (accessed on 13 February 2021).
- Von Mörner, J.; Müller, B.; Topp, H. Entwurf und Gestaltung innerörtlicher Straßen. Forschung Straßenbau und Straßenverkehrstechnik; Bericht 425; Bundesministerium für Verkehr: Bonn, Germany, 1984. [Google Scholar]
- Graph Integration Platform—GIP. The Reference System of Austrian Public Authorities for Transport Infrastructure Data. Available online: http://gip.gv.at/en/index.html (accessed on 11 February 2021).
- Su, S.; Zhou, H.; Xu, M.; Ru, H.; Wang, W.; Weng, M. Auditing street walkability and associated social inequalities for planning implications. J. Transp. Geogr. 2019, 74, 62–76. [Google Scholar] [CrossRef]
- Boesch, P.M.; Ciari, F.; Axhausen, K.W. Autonomous Vehicle Fleet Sizes Required to Serve Different Levels of Demand. Transp. Res. Rec. 2016, 2542, 111–119. [Google Scholar] [CrossRef] [Green Version]
- Trafility, Wiener Linien, Wiener Lokalbahnen, TU Graz. In auto.Waves: Autonomes Fahren—Wirkungsanalyse Verkehr, Energie und Stadt für den Raum Wien; Research Report; Institute of Highway Engineering and Transport Planning, Vienna City Administration, Urban Planning Department: Vienna, Austria, 2020.
- Kickhofer, B.; Hosse, D.; Turnera, K.; Tirachini, A. Creating an Open MATSim Scenario from Open Data: The Case of Santiago de Chile; TU Berlin, Transport System Planning and Transport Telematics: Berlin, Germany, 2016. [Google Scholar]
- Hörl, S.; Balac, M.; Axhausen, K.W. A first look at bridging discrete choice modeling and agent-based microsimulation in MATSim. Procedia Comput. Sci. 2018, 130, 900–907. [Google Scholar] [CrossRef]
- Tomschy, R.; Herry, M.; Sammer, G.; Klementschitz, R.; Riegler, S.; Follmer, R.; Gruschwitz, D.; Josef, F.; Gensasz, S.; Kirnbauer, R.; et al. Österreich unterwegs 2013/2014: Ergebnisbericht zur österreichweiten Mobilitätserhebung “Österreich unterwegs 2013/2014“; Bundesministerium für Verkehr, Infrastruktur und Technologie: Vienna, Austria, 2016. [Google Scholar]
- Brovarone, E.V.; Scudellari, J.; Staricco, L. Planning the transition to autonomous driving: A policy pathway towards urban liveability. Cities 2021, 108, 102996. [Google Scholar] [CrossRef]
- Bischoff, J.; Maciejewski, M.; Nagel, K. City-Wide Shared Taxis: A Simulation Study in Berlin. In Proceedings of the IEEE 20th International Conference on Intelligent Transportation Systems (ITSC), Yokohama, Japan, 16–19 October 2017; pp. 275–280. [Google Scholar]
- Levin, M.W.; Kockelman, K.M.; Boyles, S.D.; Li, T. A general framework for modeling shared autonomous vehicles with dynamic network-loading and dynamic ride-sharing application. Computers. Environ. Urban Syst. 2017, 64, 373–383. [Google Scholar] [CrossRef]
- Ester, M.; Kriegel, H.-P.; Sander, J.; Xu, X. A Density-Based Algorithm for Discovering Clusters in Large Spatial Databases with Noise. In Proceedings of the Second International Conference on Knowledge Discovery and Data Mining, Portland, ME, USA, 2–4 August 1996; pp. 226–231. [Google Scholar]
- Gelauff, G.; Ossokina, I.; Teulings, C. Spatial Effects of Automated Driving: Dispersion, Concentration or Both; KIM–Netherlands Institute for Transport Policy Analysis: The Hague, The Netherlands, 2017. [Google Scholar]
- Auld, J.; Verbas, O.; Javanmardi, M.; Rousseau, A. Impact of privately-owned level 4 CAV technologies on travel demand and energy. Procedia Comput. Sci. 2018, 130, 914–919. [Google Scholar] [CrossRef]
- de Correia, G.H.; Looff, E.; van Cranenburgh, S.; Snelder, M.; van Arem, B. On the impact of vehicle automation on the value of travel time while performing work and leisure activities in a car: Theoretical insights and results from a stated preference survey. Transp. Res. Part A 2019, 119, 359–382. [Google Scholar] [CrossRef] [Green Version]
- Kolarova, V.; Steck, F.; Bahamonde-Birke, F.J. Assessing the effect of autonomous driving on value of travel time savings: A comparison between current and future preferences. Transp. Res. Part A 2019, 129, 155–169. [Google Scholar] [CrossRef]
- Friedrich, B. The effect of autonomous vehicles on traffic. In Autonomous Driving; Maurer, M., Gerdes, C.J., Lenz, B., Winner, H., Eds.; Springer: Heidelberg, Germany, 2016; pp. 317–334. [Google Scholar]
- Meyer, J.; Becker, H.; Bösch, P.M.; Axhausen, K.W. Autonomous vehicles: The next jump in accessibilities? Res. Transp. Econ. 2017, 62, 80–91. [Google Scholar] [CrossRef] [Green Version]
- Gucwa, M. Mobility and Energy Impacts of Automated Cars. In Proceedings of the Automated Vehicles Symposium, San Francisco, CA, USA, 15–17 July 2014. [Google Scholar]
- Ghielmetti, M.; Steiner, R.; Leitner, J.; Hackenfort, M.; Diener, S.; Topp, H. Flächiges Queren in Ortszentren—Langfristige Wirkung und Zweckmäßigkeit; Bundesamt für Straßen: Bern, Switzerland, 2017. [Google Scholar]
- Gössling, S. Why cities need to take road space from cars-and how this could be done. J. Urban Des. 2020, 25, 443–448. [Google Scholar] [CrossRef]
- Arellana, J.; Saltarín, M.; Larrañaga, A.M.; González, V.I.; Henao, C.A. Developing an urban bikeability index for different types of cyclists as a tool to prioritise bicycle infrastructure investments. Transp. Res. Part A 2020, 139, 310–334. [Google Scholar] [CrossRef]
- Moura, F.; Cambra, P.; Gonçalves, A.B. Measuring walkability for distinct pedestrian groups with a participatory assessment method: A case study in Lisbon. Landsc. Urban Plan. 2017, 157, 282–296. [Google Scholar] [CrossRef]
- Holden, E.; Gilpin, G.; Banister, D. Sustainable mobility at thirty. Sustainability 2019, 11, 1965. [Google Scholar] [CrossRef] [Green Version]
- Nello-Deakin, S. Is there such a thing as a ‘fair’ distribution of road space? J. Urban Des. 2019, 24, 698–714. [Google Scholar] [CrossRef] [Green Version]
- Soteropoulos, A.; Mitteregger, M.; Berger, M.; Zwirchmayr, J. Automated Drivability: Toward an assessment of the spatial deployment of level 4 automated vehicles. Transp. Res. Part A Policy Pract. 2020, 136, 64–84. [Google Scholar] [CrossRef]
- Anciaes, P.R.; Jones, P. How Do Pedestrians Balance Safety, Walking Time, and the Utility of Crossing the Road? A Stated Preference Study; Street Mobility and Network Accessibility Series; Working Paper 08; University College London: London, UK, 2016; Available online: https://discovery.ucl.ac.uk/id/eprint/1505652/1/Anciaes_ucl_streetmobility_paper08.pdf (accessed on 10 January 2021).
- Axhausen, K.W.; Livingston, C.; Hörl, S.; Bruns, F.; Fischer, R.; Tasnády, B. Auswirkungen des Automatisierten Fahrens; Teilprojekt 2; Verkehrliche Auswirkungen und Infrastrukturbedarf; ASTRA—Bundesamt für Strassen: Bern, Switzerland, 2020. [Google Scholar]
- Tirachini, A.; Cats, O. COVID-19 and public transportation: Current assessment, prospects, and research needs. J. Public Transp. 2020, 22, 1. [Google Scholar] [CrossRef]
- Beck, M.J.; Hensher, D.A.; Wei, E. Slowly coming out of COVID-19 restrictions in Australia: Implications for working from home and commuting trips by car and public transport. J. Transp. Geogr. 2020, 88, 102846. [Google Scholar] [CrossRef]
- Schieben, A.; Wilbrink, M.; Kettwich, C.; Madigan, R.; Louw, T.; Merat, N. Designing the interaction of automated vehicles with other traffic participants: Design considerations based on human needs and expectations. Cogn. Technol. Work 2019, 21, 69–85. [Google Scholar] [CrossRef] [Green Version]
- Merat, N.; Mun Lee, Y.; Markkula, G.; Uttley, J.; Camara, F.; Fox, C.; Dietrich, A.; Weber, F.; Schieben, A. How do we study pedestrian interaction with automated vehicles? Preliminary findings from the European interACT project. In AVS 2019: Road Vehicle Automation 6; Meyer, G., Beiker, S., Eds.; Springer: Cham, Switzerland, 2019; pp. 21–33. [Google Scholar]
- Woodman, R.; Lu, K.; Higgins, M.D.; Brewerton, S.; Jennings, P.A.; Birrell, S. Gap acceptance study of pedestrians crossing between platooning autonomous vehicles in a virtual environment. Transp. Res. Part F 2019, 67, 1–14. [Google Scholar] [CrossRef]
- Pyrialakou, D.V.; Gkartzonikas, C.; Gatlin, J.D.; Gkritza, K. Perceptions of safety on a shared road: Driving, cycling, or walking near an autonomous vehicle. J. Saf. Res. 2020, 72, 249–258. [Google Scholar] [CrossRef]
- Kyriakou, K.; Resch, B.; Sagl, G.; Petutschnig, A.; Werner, C.; Niederseer, D.; Liedlgruber, M.; Wilhelm, F.H.; Osborne, T.; Pykett, J. Detecting moments of stress from measurements of wearable physiological sensors. Sensors 2019, 19, 3805. [Google Scholar] [CrossRef] [PubMed] [Green Version]
- Ye, Y.; Zeng, W.; Shen, Q.; Zhang, X.; Lu, Y. The visual quality of streets: A human-centred continuous measurement based on machine learning algorithms and street view images. Environ. Plan. B Urban Anal. City Sci. 2019, 46, 1439–1457. [Google Scholar] [CrossRef]
- González-González, E.; Nogués, S.; Stead, D. Parking futures: Preparing European cities for the advent of automated vehicles. Land Use Policy 2020, 91, 104010. [Google Scholar] [CrossRef]
- Zhang, W.; Guhathakurta, S.; Fang, J. Exploring the impact of shared autonomous vehicles on urban parking demand: An agent-based simulation approach. Sustain. Cities Soc. 2015, 19, 34–45. [Google Scholar] [CrossRef]
- Boesch, P.M. Autonomous Vehicles—The Next Revolution in Mobility. Ph.D. Thesis, ETH Zurich, Zurich, Switzerland, 2020. [Google Scholar]
- Seuwou, P.; Banissi, E.; Ubakanma, G. The Future of Mobility with Connected and Autonomous Vehicles in Smart Cities. In Digital Twin Technologies and Smart Cities; Farsi, M., Daneshkhah, A., Hosseinian-Far, A., Jahankhani, H., Eds.; Springer: Cham, Switzerland, 2019; pp. 37–52. [Google Scholar]
- Mohammadi, F.; Nazri, G.A.; Saif, M. A Real-Time Cloud-Based Intelligent Car Parking System for Smart Cities. In Proceedings of the 2nd IEEE International Conference on Information Communication and Signal Processing (ICICSP), Weihei, China, 28–30 September 2019; pp. 235–240. [Google Scholar]
- Shladover, S.E. Connected and automated vehicle systems: Introduction and overview. J. Transp. Syst. 2018, 22, 190–200. [Google Scholar] [CrossRef]
- International Transport Forum. Cooperative Mobility Systems and Automated Driving. Summary and Conclusion; OECD: Paris, France, 2020; Available online: https://www.itf-oecd.org/sites/default/files/docs/cooperative-mobility-systems-automated-driving-roundtable-summary.pdf (accessed on 5 January 2021).
- Botello, B.; Buehler, R.; Hankey, S.; Mondschein, A.; Jiang, Z. Planning for walking and cycling in an autonomous-vehicle future. Transp. Res. Interdiscip. Perspect. 2019, 1, 100012. [Google Scholar] [CrossRef]


| Area Category | Compatible Traffic Volume (Vehicles at Peak Hour) |
|---|---|
| City center/business district | ≤20 (well compatible) >20–50 (compatible) >50–150 (only just compatible) >150–400 (not compatible) >400 (completely not compatible) |
| Mixed-use with intensive commercial use | ≤50 (well compatible) >50–150 (compatible) >150–400 (only just compatible) >400–600 (not compatible) >600 (completely not compatible) |
| Mixed-use with medium intensive commercial use | ≤150 (well compatible) >150–400 (compatible) >400–600 (only just compatible) >600–1000 (not compatible) >1000 (completely not compatible) |
| Low-density residential | ≤400 (well compatible) >400–600 (compatible) >600–1000 (only just compatible) >1000–1200 (not compatible) >1200 (completely not compatible) |
| Industrial | ≤600 (well compatible) >600–1000 (compatible) >1000–1200 (only just compatible) >1200–1500 (not compatible) >1500 (completely not compatible) |
| (a) Distribution of Space Ratio between Area Width for Pedestrians and Cyclists in Comparison to Area Width for Motor Vehicle Traffic | (b) Use by Pedestrians and Cyclists | (c) Speed Average Speed on the Street Section | (d) Heavy-Goods Vehicle Traffic HGV Share of the Total Motor Vehicle Traffic Volume | (e) Crossing Needs | Categories of Compatibility with Needs of Surrounding Uses and Users | Adaptation of the Maximum Compatible Traffic Volume |
|---|---|---|---|---|---|---|
| ≥1.25 | very low | ≤10 km/h | very low | very low (streets sections with no shops or other facilities) | ++ well compatible | +100 vehicles/peak hour |
| 1.00 to <1.25 | low | >10 km/h ≤20 km/h | low | low (street sections with at least 1 shop or other facility, no cross-relations in between) | + compatible | +50 vehicles/peak hour |
| 0.75 to <1.00 | medium | >20 km/h ≤30 km/h | medium | medium (squares and parks or streets sections with 1 or more cross-relations between shops or other facilities) | o only just compatible | ±0 vehicles/peak hour |
| 0.5 to <0.75 | high | >30 km/h ≤40 km/h | high | high (shopping streets) | - not compatible | −50 vehicles/peak hour |
| <0.5 | very high | >40 km/h | very high | very high (shopping streets or squares and parks with 2 or more cross-relations between shops or other facilities) | -- Completely not compatible | −100 vehicles/peak hour |
| Number of Design Elements per 100 m | Number of Trees and Bushes per 100 m | ||||
|---|---|---|---|---|---|
| 0 | 1 to 4 | 5 to 9 | 10 to 14 | 15 or More | |
| 0 | -- | - | - | o | o |
| 1 | - | o | o | + | + |
| 2 to 4 | o | + | + | ++ | ++ |
| 5 or more | + | ++ | ++ | ++ | ++ |
| Area Category | Crossability—Number of Crossing Aids per 100 m | |||||||||||||||||
|---|---|---|---|---|---|---|---|---|---|---|---|---|---|---|---|---|---|---|
| 0 | 0,1 | 0,2 | 0,3 | 0,4 | 0,5 | 0,6 | 0,7 | 0,8 | 0,9 | 1,0 | 1,1 | 1,2 | 1,3 | 1,4 | 1,5 | 1,6 | 1,7+ | |
| City center/commercial area | -- | -- | -- | -- | -- | -- | -- | -- | - | - | - | o | o | o | + | + | + | ++ |
| Mixed-use with intensive commercial use | -- | -- | -- | -- | -- | -- | - | - | - | o | o | o | + | + | + | ++ | ++ | ++ |
| Mixed-use with medium intensive commercial use | -- | -- | -- | -- | - | - | - | o | o | o | + | + | + | ++ | ++ | ++ | ++ | ++ |
| Low-density residential | -- | -- | - | - | - | o | o | o | + | + | + | ++ | ++ | ++ | ++ | ++ | ++ | ++ |
| Industrial | -- | - | - | o | o | o | + | + | + | ++ | ++ | ++ | ++ | ++ | ++ | ++ | ++ | ++ |
| Criterion | Weighting 1: Equal Weights of Criteria | Weighting 2: Higher Weight for C1, Lower Weight for C5 and C6 | Weighting 3: Considerable Higher Weight for C1, Lower Weights for C3 to C7 |
|---|---|---|---|
| C1: Distribution of space | 1 | 2 | 3.5 |
| C2: Use by pedestrians and cyclists | 1 | 1 | 1 |
| C3: Speed | 1 | 1 | 0.5 |
| C4: Heavy-goods vehicle traffic | 1 | 1 | 0.5 |
| C5: Crossing needs | 1 | 0.5 | 0.5 |
| C6: Green and design elements | 1 | 0.5 | 0.5 |
| C7: Crossability | 1 | 1 | 0.5 |
| Street Section | Maximum Compatible Traffic Volume | Adaptation of Maximum Compatible Traffic Volume | ||||||||||
|---|---|---|---|---|---|---|---|---|---|---|---|---|
| C1 | C2 | C3 | C4 | C5 | C6 | C7 | Total | Adapted Maximum Compatible Traffic Volume | Actual Traffic Volume | Assessment of Compatibility | ||
| Street section in area category “mixed-use with intensive commercial use” | 150 | +175 | −100 | −25 | −50 | ±0 | −25 | +50 | +25 | ≤75 (++) >75 bis 175 (+) >175 bis 425 (o) >425 bis 625 (-) >625 (--) | 157 | + compatible |
| weights | ||||||||||||
| 3.5 | 1 | 0.5 | 0.5 | 0.5 | 0.5 | 0.5 | ||||||
| unweighted | ||||||||||||
| +50 | −100 | −50 | −100 | ±0 | −50 | +100 | ||||||
| Scenario | Assessment of Street Sections | Applied Maximum Compatible Traffic Volume at Peak Hour | ||
|---|---|---|---|---|
| 10% Decrease | Actually Applied | 10% Increase | ||
| Reference Scenario | well compatible | 29.6% | 32.8% | 36.1% |
| compatible | 33.1% | 34.0% | 34.3% | |
| only just compatible | 14.3% | 12.5% | 10.9% | |
| not compatible | 8.0% | 7.1% | 6.5% | |
| completely not compatible | 15.0% | 13.6% | 12.1% | |
| Scenario 1 | well compatible | 29.2% | 32.7% | 36.0% |
| compatible | 33.0% | 33.8% | 34.2% | |
| only just compatible | 14.9% | 13.0% | 11.2% | |
| not compatible | 7.9% | 7.1% | 6.6% | |
| completely not compatible | 15.0% | 13.4% | 11.9% | |
| Scenario 2 | well compatible | 30.2% | 33.7% | 36.8% |
| compatible | 32.9% | 33.4% | 33.8% | |
| only just compatible | 13.8% | 12.1% | 10.6% | |
| not compatible | 8.1% | 7.3% | 6.7% | |
| completely not compatible | 15.0% | 13.5% | 12.1% | |
| Scenario 3 | well compatible | 29.4% | 32.7% | 36.0% |
| compatible | 33.2% | 34.0% | 34.3% | |
| only just compatible | 14.3% | 12.7% | 11.0% | |
| not compatible | 7.9% | 6.6% | 6.3% | |
| completely not compatible | 15.2% | 13.8% | 12.4% | |
| 100.0% | 100.0% | 100.0% | ||
Publisher’s Note: MDPI stays neutral with regard to jurisdictional claims in published maps and institutional affiliations. |
© 2021 by the authors. Licensee MDPI, Basel, Switzerland. This article is an open access article distributed under the terms and conditions of the Creative Commons Attribution (CC BY) license (http://creativecommons.org/licenses/by/4.0/).
Share and Cite
Soteropoulos, A.; Berger, M.; Mitteregger, M. Compatibility of Automated Vehicles in Street Spaces: Considerations for a Sustainable Implementation. Sustainability 2021, 13, 2732. https://doi.org/10.3390/su13052732
Soteropoulos A, Berger M, Mitteregger M. Compatibility of Automated Vehicles in Street Spaces: Considerations for a Sustainable Implementation. Sustainability. 2021; 13(5):2732. https://doi.org/10.3390/su13052732
Chicago/Turabian StyleSoteropoulos, Aggelos, Martin Berger, and Mathias Mitteregger. 2021. "Compatibility of Automated Vehicles in Street Spaces: Considerations for a Sustainable Implementation" Sustainability 13, no. 5: 2732. https://doi.org/10.3390/su13052732
APA StyleSoteropoulos, A., Berger, M., & Mitteregger, M. (2021). Compatibility of Automated Vehicles in Street Spaces: Considerations for a Sustainable Implementation. Sustainability, 13(5), 2732. https://doi.org/10.3390/su13052732