Article

Effects of Technological Progress from Different Sources on Haze Pollution in China

1
School of Economics and Management, China University of Geosciences (Wuhan), Wuhan 430074, China
2
Freeman School of Business, Tulane University, New Orleans, LA 70118, USA
*
Author to whom correspondence should be addressed.
Sustainability 2021, 13(5), 2730; https://doi.org/10.3390/su13052730
Submission received: 31 January 2021 / Revised: 24 February 2021 / Accepted: 26 February 2021 / Published: 3 March 2021

Abstract

:
Technological progress has always been regarded as an important factor affecting haze pollution. A large number of academic studies have focused on the effect of technological progress on haze pollution, but there are few discussions on the effects of technological progress from different sources. In view of this, a dynamic panel model is constructed, and a systematic generalized method of moments (GMM) method is applied to empirically test the overall impact of technological progress from different sources on haze pollution and the regional heterogeneity of the impact. The results show that the overall and regional impact of technological progress from different sources on haze pollution is entirely different. Among them, for the whole country, independent innovation has a significant inhibitory effect on haze pollution, and technology introduction has aggravated haze pollution to a certain extent. At the regional level, all types of technological progress in the east can effectively reduce haze, the central region having haze reduction results consistent with the overall national level, and in the west, independent innovation and direct introduction can effectively reduce haze, while reverse technology spillover is ineffective. Therefore, policy recommendations such as improving the ability of independent innovation, improving the quality of technology introduction, and coordinating regional technology against haze are put forward.

1. Introduction

In recent years, haze pollutants especially, PM2.5 (particulate matter with a diameter ≤2.5 μm accessible to the lungs), have swept across China. Its wide coverage and difficulty of controlling has attracted the attention of the government. From the release of the Air Pollution Prevention and Control Action Plan in September 2013 to the end of 2017, the average concentration of PM2.5 in crucial areas such as the Beijing–Tianjin–Hebei, Yangtze River Delta, and Pearl River Delta dropped by 39.6%, 34.3%, and 27.7% respectively, and 45 essential tasks were completed on schedule. However, the China Ecological Environment Bulletin published by the Ministry of Ecology and Environment in 2019 showed that 217 of the 338 cities at prefecture-level and above have air quality exceeding the standard, which means haze prevention and control is still severe.
Haze is a weather phenomenon with visibility less than 10 km due to a dense accumulation of fine aerosol particles [1]. Its most prominent features are long duration, wide coverage, and high particle concentration [2], PM2.5 particles are small in diameter and can adsorb toxic and harmful substances easily, which would seriously threaten the ecosystem and human health [3,4] and hinder social and economic development [5]. The causes of haze weather include both natural factors and socio-economic factors. Natural factors include air humidity and temperature, rainfall [6], etc., and socio-economic factors contain technological progress, industrial structure, energy structure, and energy, utilization efficiency, transportation, etc. [7,8,9,10], among which technological progress has attracted the attention of academia as the main influencing factor.
Academia has drawn a variety of research conclusions around the effect of technological progress on haze pollution. One view is that technological progress has a significant inhibitory effect on haze pollution. In the related literature, Ehrlich and Holdren [11] proposed the basic research framework of environmental issues—IPAT (Environmental Impact = Population * Affluence * Technology) model, but because the model may ignore the multiple factors affecting the environment, and face the limitation of the same proportional linear change of the impact of different factors on the environment [12]. To investigate the impact of various factors on environmental changes more comprehensively, Dietz and Rosa [13] modified and optimized the random form of IPAT into the STIRPAT (Stochastic Impacts by Regression on Population, Affluence, and Technology) function. The STIRPAT model allows the estimation of each coefficient as a parameter, and appropriately decomposes and improves each impact factor [14]. Based on this model, Liu [15] combining the kernel density estimation method, proved that technological advancement is not only effective in the suppression of haze pollution, but also promotes haze reduction in neighboring provinces through technology spillover effects. In addition, some scholars have also used the LMDI decomposition (Logarithmic Mean Divisia Index) to demonstrate that technological progress has a positive effect on PM2.5 emission reduction [16]. From a longer-term perspective, Wei, et al. [17] established a dynamic multi-regional computable general equilibrium model to predict the compliance of China’s PM2.5 concentration in 2030 under technological progress and tax-related policies. The results also proved that technological progress plays a significant role in air pollution control. However, there is a different view holds that technological advances have a limited effect on haze reduction [18], Shao, Li, Cao and Yang [8] suggest that due to the biased technological progress, the increase in research and development (R&D) intensity has not had the desired effect of reducing haze, but has to some extent, contributed to the increase in haze pollution.
Traditionally, most measures of technological progress are divided into neutral technological progress and biased technological progress [19,20,21,22,23]. Few documents discuss the impact of independent innovation and technology introduction, the two main technological progress sources on China’s environment. Existing studies have affirmed the haze reduction effect of independent innovation, and believed that independent innovation is beneficial to achieve haze reduction through optimizing industrial structure, improving energy efficiency, and ameliorating governance efficiency [24,25]. The relationship between technology introduction and environmental pollution in the host country has been disputed for a long time, two diametrically opposed views were mainly manifested. One is represented by the “pollution haven” hypothesis, which believes that technology introduction would reduce the host country’s environmental welfare. The reason is that developed countries transferred a large number of polluting industries to developing countries with poor environmental regulatory standards through technology introduction [26,27], at the same time, relaxed environmental regulations in developing countries can accelerate the exploitation of natural resources and bring about environmental degradation [28]. The other is represented by the “pollution halo” hypothesis, pointing out that the “demonstration effect” of technology introduction and the “learning effect” of the host country would instead promote the improvement of the host country’s environment [29,30]. Whether the introduction of technologies due to lowered environmental standards has brought pollution or technology has yet to be determined. Further, due to differences in geographical conditions and economic development levels in different regions of China, the effects of technological progress from different sources on haze pollution would also be heterogeneous, while current research has not paid enough attention to this issue. If the analysis results could not be “adapted to local conditions”, it would be detrimental to the effective implementation of haze reduction policies.
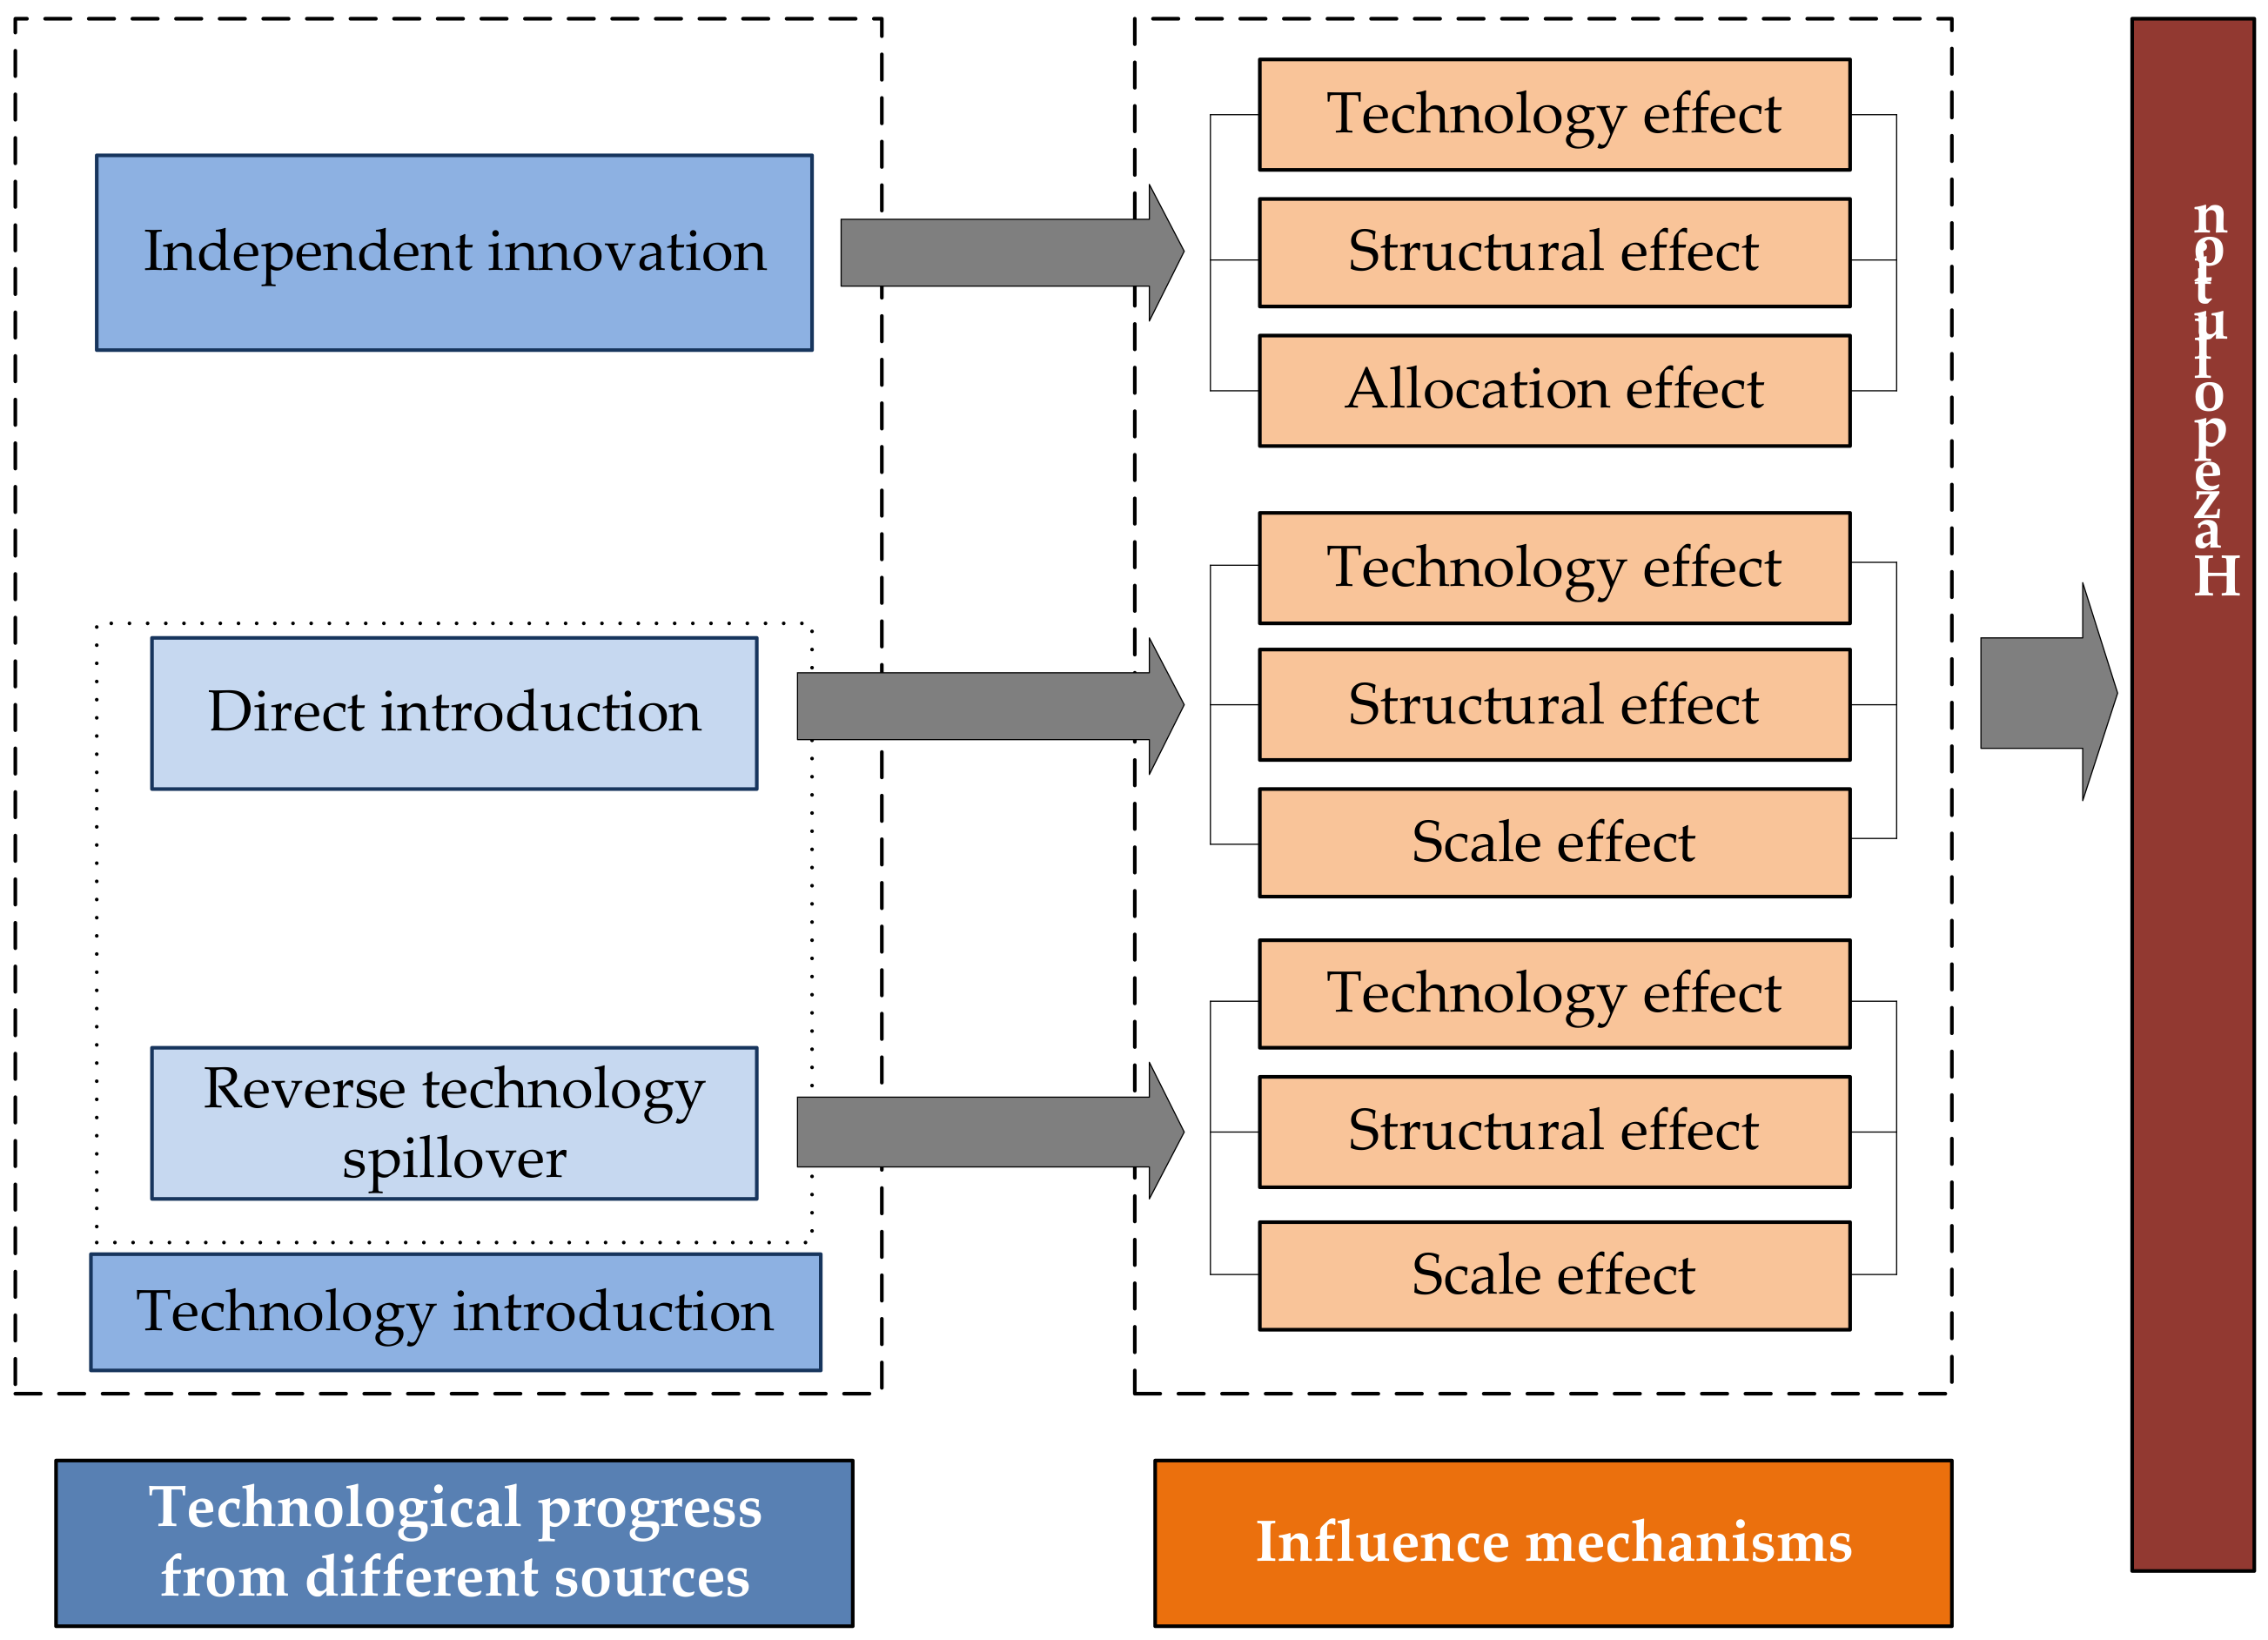
To make up for the deficiencies of existing research, this study attempts to make efforts from the following aspects. First of all, based on the technology catch-up model of China as an emerging economy, the channels that generate technological progress are divided into independent innovation and technology introduction. The technology introduction channels include the direct introduction and reverse spillover. The GMM method is applied to discuss the impact of the above two technological progress from different sources and channels on haze pollution. The research conclusions are conducive to enriching the existing studies on technology pollution control theory and whether it is pollution haven effect or the pollution halo effect. Secondly, taking into account the differences in technological endowments in China caused by different regional characteristics, resource endowments and economic development levels, the 30 provinces (municipalities and autonomous regions) are divided into eastern, central and western regions so as to discuss the spatial differentiation characteristics of the haze reduction effects of the technological progress of different sources. This study attempts to answer the following questions. Could technological progress from different sources achieve haze reduction effects? What is its implementation mechanism? Is this realization effect and mechanism heterogeneous in different regions of China?
The rest of this paper is organized as follows: The theoretical mechanism is analyzed in part two to examines the types of technological progress sources and how different sources of technological progress affect haze pollution; model methods and data sources are introduced in part three; empirical results and analysis are shown in part four; and we make the conclusion and policy recommendations of this study in the final part.

2. Sources of Technological Progress and Its Impact on Haze Pollution

2.1. Sources of Technological Progress

The technological progress is achieved mainly through two channels. One is independent innovation; that is, creativity is generated and transformed into products with market value; the other is technology introduction; that is, the diffusion of technology from abroad to domestic. Studies in academia have generally affirmed the important role of independent innovation in increasing productivity and promoting technological progress [31]. However, as an emerging economy, the significant imbalance in China’s economic development presents more complex technological decisions than developed countries. Under the conditions of an open economy, besides independent innovation, consideration should also be given to the introduction, imitation and catch-up of technology. The direct introduction of technology brought by foreign direct investment (FDI) and the reverse technology spillover effect of outward foreign direct investment (OFDI) are important channels for disseminating foreign technology to the country [32,33].
Since the 1980s, FDI has become one of the forms of technology transfer in China. Advanced technologies can be internalized at a low cost. The effect of FDI on technological progress is called the technology spillover effect. As far as the technology spillover effect of FDI is concerned, there are three theoretical explanations: industrial organization theory, international trade theory and endogenous growth theory. Industrial organization theory attempts to study the indirect impact or externalities of FDI on the host country and believes that FDI is not only one of the sources of capital but also a channel for the host country’s technological progress [34]. The focus of international trade theory is to study why FDI occurs. The international trade theory defines FDI characteristics as intellectual capital with the attributes of public investment or “public product”. Some scholars have formally proved how FDI act as a catalyst to promote the development of local industries through linkage effects [26]. The endogenous growth model believes that FDI is an essential source of the human capital increase, technological change, and the spillover of ideas in the country. The spillover effect depends on the extent to which local companies actively respond to technological gaps and invest in “learning activities” [35].
Unlike the positive technology spillover from the parent company of the multinational company to the subsidiary of the host country brought by direct introduction, the reverse technology spillover is equivalent to the return of OFDI to the parent company’s technology or the home country. The rapid growth of OFDI in emerging economies headed by China in recent years has made it self-evident that they intend to obtain reverse technology spillovers from developed host countries through OFDI. This phenomenon has also inspired scholars to demonstrate the importance of reverse technology spillovers. It has revealed that emerging economies do not bear the “monopolistic competitive advantage” and “ownership advantage” proposed by traditional theories, but are more inclined to seek technology from host countries with higher technological levels [36,37] through technology diffusion effects, demonstration imitation effect, and so on [38] to make up for competitive disadvantages, thereby improving domestic production efficiency and technological level. Based on the current results, the reverse technology spillover channels of OFDI can be divided into three levels. First, at the enterprise level, the overseas subsidiaries of the host country imitate and absorb advanced technologies through platform sharing and talent flow, and share R&D resources with the parent company. Second, at the industrial level, after acquiring advanced technology, the parent company can stimulate other companies in the same industry to follow-up and learn through demonstration effects, and even seek advanced overseas technology through OFDI as well. The pressure of competition in the same industry also forces other companies to actively improve their R&D levels, thereby driving technological progress [39]. Third, at the national level, after a certain industry in the home country obtaining the more advanced technological knowledge of the host country through OFDI channels, the reverse technology spillover can be transmitted to other industries [40].

2.2. Influencing Mechanism

The influencing mechanism of technological progress from different sources on haze pollution can be summarized in Figure 1. The impact of technological progress from different sources on haze pollution is heterogeneous due to different influencing mechanisms. Independent innovation affects haze pollution through technical, structural, and allocation effects. Direct technology introduction and technology reverse spillovers are acted on haze by technical effects, structural effects, and scale effects.
The impact of independent innovation on haze pollution includes the combined effects of technical effects, structural effects, and allocation effects. From the perspective of technological effects, first of all, technological effects could apply the clean production technology provided by independent innovation to the front of the energy and production system to increase the resource utilization rate of enterprises from the origins [41,42], thereby reducing haze pollution. Secondly, regions with a high degree of independent innovation are more likely to have pollution monitoring equipment, which could monitor and obtain regional pollution emission information in real time, avoiding high-pollution emissions from enterprises during the process. Finally, a higher level of technology R&D could be used to deal with pollution, improve clean energy R&D capabilities and use technology to promote energy utilization and the optimization of energy structure to reduce haze emissions. From the perspective of structural effects, innovative technologies would gradually eliminate the traditional high energy consumption and high pollution elements used by polluting industries and enterprises, thereby renewing existing industrial sectors, promoting self-upgrading of the industrial structure, optimizing the input structure of polluting industries and enterprises, and alleviating environmental pressure. From the perspective of allocation effects, regions with higher levels of innovative technologies often have more developed low-pollution industries, which could gather capital, labor, and other elements into technology-intensive low-pollution industries and is conducive to optimizing the allocation of industries and resources, so that to improve energy efficiency and environmental quality. Accordingly, this study infers that independent innovation could affect haze pollution by combining technical, structural, and allocation effects.
The effect of direct introduction on haze is also the consequence of multiple effects. Grossman and Krueger [43] proposed that FDI has three influencing mechanisms on the environment, which are scale effect, structural effect, and technological effect. The scale effect is that the inflow of foreign capital would expand the scale of regional production to a certain extent, which signifies a large influx of labor and an increase in energy consumption. Therefore, the inflow of foreign capital would bring more air pollution by boosting economic development. The structural effect refers to the inflow of FDI and the introduction of foreign low-energy, low-pollution factors, thereby renewing and upgrading the industry’s internal structure, optimizing the input of enterprise factors promoting resource utilization and reducing haze pollution. The technological effect depends on whether the technology spillover of FDI to the host country is environmentally friendly. In summary, when the scale effect is greater than the structural effect and the technical effect is negative, the FDI would aggravate haze pollution.
The impact of reverse technology spillover on haze pollution includes scale effect, structural effect and technological effect. Outward investment by firms is often perceived as having an indirect impact on the environment by driving economic growth in the home country, which is known as a scale effect [44]. The current extensive development model in China has not been fundamentally changed, and weaker environmental supervision will even further solidify the development model of international direct investment. Therefore, we deem that the scale effect would promote haze pollution. The technical effect is mainly manifested in the absorption of imitated foreign green innovative technologies through OFDI and spillover to the home country, while producing cleaner production methods to reduce environmental pollutant emissions. Structural effect bears different performance based on the degree of regional development. On the one hand, regions with higher economic development often transfer production to the host country in the process of OFDI in order to save higher labor costs, which is a kind of substitution for export activity. Most of the products being replaced are pollution-intensive products, which optimize the allocation of factors in the home country. Therefore, the structural effect of OFDI in more developed regions can reduce haze pollution; on the other hand, the motivation for OFDI in economically underdeveloped regions is to expand the market scale, this not only could not help to reduce the production of pollution-intensive products in the home country, but will increase the output of related intermediate inputs instead. Therefore, the structural effect in this case is positive and haze pollution is aggravated.

3. Data and Model Construction

3.1. Variable Selection and Data Sources

3.1.1. Variable Selection

The explained variable is haze pollution. PM2.5 is one of the most important components of haze pollution. Based on this, the annual average concentration of PM2.5 in various provinces and cities in China is used to do the measurement.
The core explanatory variables include the following three variables: R&D indicators can characterize independent innovation (rd), and the number of patent applications granted can more directly reflect the level of innovation. Therefore, this article selects the number of patent applications granted to measure technological progress caused by independent innovation. The direct introduction of technology (ifdi) can be measured using actual FDI. The inverse technology spillover (ofdi) can be measured using the stock of China’s foreign non-financial direct investment. The stability of the stock data helps to explore the impact of its spillover effect on the environment more robustly.
Control variables include the level of economic development, industrial structure, environmental regulations and transportation.
The level of economic development (lngdp). Generally speaking, rapid economic growth would lead to an increase in energy consumption and aggravate the pressure on the ecological environment, which in turn leads to an increase in haze pollution. According to the usual practice, per capita GDP is used to measure the level of economic development.
Industrial structure (indus). Although China’s current economic growth mode is changing from extensive to intensive, with an attempt to promote optimization and upgrading of industrial structure, environmental problems still are severe. This paper measures industrial structure level by the proportion of the added value of the secondary industry, including industry and construction in GDP.
Environmental regulations (er). Many research achievements in academia show that a certain intensity of environmental regulations could promote haze emission reduction. This paper applies the ratio of the actual investment in industrial pollution control to the main business cost of industries above designated size to measure the intensity of environmental regulations.
Transportation (trans). Pollutants such as carbon monoxide, nitrogen oxides, and sulfur dioxide in automobile exhaust are the main sources of haze pollution. The number of private car ownership per unit road mileage to measure transportation is adopted in this paper.

3.1.2. Data Sources

Based on data availability and validity, this paper selects the statistical data of 30 provinces (municipalities and autonomous regions) in China from 2000 to 2017 except Tibet, Hong Kong, Macao, and Taiwan for analysis. Due to the lateness of China in measuring PM2.5, it is difficult to obtain the data. Therefore, this paper uses the air pollution raster data released by the Atmospheric Composition Analysis Group and extracted it through ArcGIS software. The advantage of these data is that compared with ground observation data, air pollution data extracted from satellite maps is more objective with wider coverage so that potential data loss problems can be avoided. Different sources of technical progress and control variable index data are from the “China Statistical Yearbook”, “China Environment Yearbook”, China’s Foreign Direct Investment Statistical Bulletin, provincial statistical yearbooks or latest statistical bulletins published by the provincial statistical bureaus and the provincial ecological environment bureaus. The missing data are supplemented by interpolation. (Table 1)

3.2. Model Construction

Haze pollution is a dynamic and continuous process. The haze pollution in this period will have an impact on the next period. Therefore, this study selects the dynamic panel model and uses the lagging period of haze pollution as an explanatory variable to entitle the model to dynamic interpretation capabilities. Simultaneously, considering that it takes a certain amount of time for technological progress to act on the haze and produce an effect, this paper also analyzes the technological progress with a lag term. The model is constructed as follows:
ln   z i t = γ i + λ   ln   z i t 1 + α T i t 1 + β X i t 1 + ε i t
Among them, ln z i t represents the natural logarithm of the haze pollution in province i in year t; γ i is an unobservable individual effect; λ represents the impact of the previous haze pollution on the haze pollution in the current period, and T i t 1 is technical progress of a lag term; X i t represents all the control variable, α , β represent technological progress of a lag term and the degree of influence of each control variable on haze pollution, ε i t is a random error term.
Due to the existence of individual effects in the model, endogenous problems will arise. To solve the interference caused by this problem on the regression results, the differential GMM or systematic GMM methods are usually used. However, when the explained variable shows a strong serial correlation or the fluctuation of the individual effect is much larger than the fluctuation of the conventional interference item, the differential GMM estimation method can be found through Monte Carlo simulation that its performance is often not quite ideal. The reason is that the correlation between the three-period lag of the explained variable and the first-order difference of the explained variable is weak, that is, there will be a problem of weak instrumental variables. The systematic GMM estimator further uses the lag term of the difference variable as the tool variable of the level value. Based on differential GMM estimation, the available tool variables are further increased, and the horizontal equation and difference equation are used in the estimation process, which overcomes the weak instrument variable problem of the first-order difference GMM estimation to a certain extent [45]. In addition, it can also solve the endogeneity, heteroscedasticity, and multicollinearity problems of methods such as least squares and fixed effects. In a limited sample, the two-order systematic GMM can significantly reduce the error, so this paper selects the two-step systematic GMM is used as a regression method.

3.3. Descriptive Statistics

The descriptive statistics of each variable are shown in Table 2.
Table 3 is a descriptive statistical result of technological progress from different sources after dividing 30 provinces (municipalities and autonomous regions) into regions by east, middle, and west. From the mean data, it can be found that there are significant differences in technological progress from different sources, at the same time, even the same technological progress also shows apparent heterogeneity in different regions.

4. Empirical Results and Analysis

4.1. Overall Haze Reduction Effect of Technological Progress from Different Sources

To ensure the accuracy of the model, the Arellano–Bond and over-recognition test should be passed. First, the AR(1) and AR(2) results can show whether the differential residuals in the model are related to the first-order sequence, but not related to the second-order or higher-order sequence so the problem of sequence correlation can be solved; secondly, the over-identification test is mainly to judge whether the instrumental variables used are valid. The Hansen test is used in the empirical test. The original hypothesis is that all instrumental variables are exogenous. Therefore, if the instrumental variables are valid, the null hypothesis should not be rejected. The estimation results of Table 4 show that these two judgment criteria are met, indicating that the setting of the dynamic panel model is relatively correct and reasonable. According to the estimated results of the overall haze reduction effect, among the four different sources of technological progress, independent innovation has suppressed haze pollution at a significance level of 1% and direct introduction has promoted the haze pollution at a significance level of 10%. Reverse technology spillover promotes haze pollution at a significant level of 5%.
Independent innovation has an inhibitory effect on haze pollution. The possible reason is that technical effects, structural effects, and configuration effects have all suppressed haze pollution to varying degrees. First, independent innovation can improve haze pollution by promoting energy saving and environmental protection technology through the technological effects produced by R&D activities. The cleaner production technology of China is developing faster and faster, which could be applied to energy and other fields to improve the efficiency of resource use and achieve prevention at the front end of the production process so that fewer pollutants are generated in the production and life process and the collection and recycling of production waste are more efficient. From the perspective of China’s atmospheric monitoring equipment, the government centrally purchased large-scale monitoring stations from 2011 to 2012. Since then, the number of national control points for atmospheric monitoring has stabilized at 1436. The Chinese government has issued more than ten environmental monitoring plans and notice during 2015–2018 (http://www.chyxx.com/industry/201905/743242.html (accessed on 2 March 2021)). Therefore, a new round of environmental monitoring equipment R&D and sales growth were spawned, which has played a role in avoiding high pollution emissions of enterprises; the emergence of emerging technologies has also increased the possibility of reusing pollutants and creating new value. The level of environmental pollution control has achieved the effect of suppressing haze pollution. Second, independent innovation may increase the proportion of emerging industries, thereby increasing the level of haze emission reduction through structural effects. The increase in the proportion of emerging industries will also bring about the input of new elements. Based on the traditional industry and product structure, the allocation effect will improve the original industry’s resource utilization and operating efficiency, reduce energy consumption, and improve haze emission reduction.
The direct introduction of technology will aggravate haze pollution to a certain extent. This conclusion verifies the “pollution haven hypothesis”. The reason may be that the negative impact of scale and technology effects on haze emission reduction is greater than the positive impact of structural effects. From the perspective of scale effect, China’s FDI reached US$131.035 billion in 2017, a 142 times increase compared with the implementation of the reform and open up strategy in 1978 (The earliest available FDI data from China’s Ministry of Commerce was $916 million in 1983). Its introduction has spurred the investment of human capital and more resources and has promoted the excessive development and consumption of some energy and natural resources, thus having a negative effect on haze emission reduction. From the perspective of structural effects, the actual use of foreign capital in high-tech manufacturing was 43.69 billion yuan from January to August in 2017, a year-on-year increase of 15%; the actual use of foreign capital in high-tech service industries was 81.44 billion yuan, a year-on-year increase of 21.4%. The actual use of foreign capital in information services, R&D and design services, and scientific and technological achievements transformation services increased by 20.1%, 7.3%, and 55.1% year-on-year, respectively (http://finance.people.com.cn/n1/2017/1101/c1004-29620504.html (accessed on 2 March 2021)), reducing the proportion of high-pollution and high-energy-consuming factors. However, China, as a whole, is a developing country in the process of industrialization. The introduction of FDI has also promoted the expansion of many intensive industries, which makes the structural effect bring less positive affected. From the perspective of technological effects, the technological effects introduced by China’s FDI are mainly manifested in productivity-enhancing technologies, but rarely in environmentally friendly technologies, which may also have a negative effect on haze reduction.
Reverse technology spillover will aggravate haze pollution to a certain extent. The reason may be that the negative impact of scale and structure effects on haze emission reduction is greater than the positive impact of technical effects. In recent years, the scale of China’s OFDI has expanded rapidly. According to the annual average growth rate, the OFDI of 30 provinces (municipalities and autonomous regions) in 2003 was only about 3.7286 million U.S. dollars, and reached 726.4 billion U.S. dollars in 2017, an increase of 196 times (Data source: Ministry of Commerce of the People’s Republic of China Statistical Bulletin on Outward Direct Investment). The 19th National Congress of the Communist Party of China first proposed high-quality economic development in 2017. Before that, China mainly promoted economic development through market-seeking and resource-seeking OFDI, and the overall extensive development model exacerbated the haze emission. From the perspective of structural effects, China, as an emerging economy, tried to expand the market scale by increasing OFDI rather than optimizing the industrial structure in the early years. The pollution-intensive industries did not decrease, but increased instead. In such a case, the structural effect intensified haze pollution. Although the technological effect has brought China’s leading technological R&D and introduced low-carbon production methods, its popularity is narrow. The reverse technology spillover in many underdeveloped regions across the country is not ideal, resulting in technological effects far lower than scale effects and structural effects.

4.2. The Overall Effect of Control Variables

At a significance level of 10%, the industrial structure has shown a certain boosting effect on haze pollution; that is, an increase in the added value of the secondary industry including industry and construction as a proportion of GDP, which would aggravate haze pollution. This study uses the proportion of the secondary industry’s added value, including industry and construction of the GDP as a measure indicator of the industrial structure. The secondary industry mainly includes the industrial sector for resource extraction and processing, and the manufacturing sector, which bears high energy requirements and low utilization rates. As the proportion of the secondary industry increases, haze pollution as one of the accompanying results would also increase [46]. In the process of industrialization, China has long implemented the development strategy of “attaching greater importance to the industry and attaching little importance to the service industry”. China’s secondary industry accounted for 134.12% of the U.S.’s GDP in 2017, while the tertiary industry accounted for only 40.75% of the U.S.’s GDP. The extensive economic growth mode has made the aggravation of haze pollution an inevitable result. In this sense, one possible way to effectively reduce haze pollution is to restrict extensive secondary industries’ development to reduce their share, or realize the green transformation and upgrading of secondary industries’ internal structure furtherly.
Environmental regulations have a significant negative impact on haze pollution at a significance level of 1%; that is, an increase in the ratio of the actual investment in industrial pollution control to the main business costs of industries above the designated scale will inhibit haze pollution. Since the Porter hypothesis was put forward in the 1990s, the academic community has conducted fervent discussions around its validity and generated three research conclusions, the traditional school of thought [47], the Porter hypothesis [48,49,50], and that environmental regulation and green technology innovation were not simply linear relationships [51]. Based on the empirical results of this paper, the validity of Porter’s hypothesis has been confirmed. In response to the increasingly serious challenge of haze pollution, China first proposed the concept of “Beautiful China” in 2012 and then announced the “Air Pollution Prevention and Control Action Plan” in 2013. Since then, Beijing’s PM2.5 concentration in 2017 reduced to 58 mg/m3, a decrease of 20.5% compared to 2016 and some heavily polluted provinces (Anhui, Sichuan, and Heilongjiang) reached the standard ahead of schedule (https://www.antpedia.com/news/89/n-1453589.html (accessed on 2 March 2021)).
Transportation has a positive impact on haze pollution at a significant level of 5%; that is, an increase in the number of private cars per mileage will increase haze pollution. Theoretically speaking, a large number of regional private cars will increase the number of motor vehicles and increase the possibility of road congestion, which would increase the running time of motor vehicles, thereby increasing fuel consumption and exhaust emissions and reducing air quality. A large number of academic studies have found direct and indirect evidence of air pollution caused by transportation. Studies by Frey, et al. [52] and Basarić, et al. [53] showed that 50% of the nitrogen dioxide in the air comes from motor vehicle exhaust, while other studies indicate that cities have increased other forms of transportation, such as rail transit and buses which could reduce air pollution by replacing private car travel [54]. According to the TomTom Traffic Index ranking, among the top ten cities in terms of congestion, nine of them are located in emerging economies. Among the top 30 cities, one-third of them are located in China. At the same time, motor vehicle exhaust contributes 74% of the hydrocarbons, 63% of carbon monoxide, 37% of nitrogen dioxide and more than 20% of suspended solids in the air of major cities in China [55], confirming that transportation of China accelerates haze pollution.
At a significance level of 10%, the increase in economic development has exacerbated haze pollution. Academia often uses the Environmental Kuznets Curve (EKC) proposed by Grossman and Krueger [43] to describe the inverted U-shaped curve relationship between environmental pollution and per capita GDP. The hypothesis points out that environmental pollution would increase with the increase in per capita income in the early stage of economic growth. However, under the combined influence of the structural and technological effects of economic activities, together with government environmental regulations, environmental pollution would gradually decrease in the medium and long term. From the perspective of economic growth trends, China has become the world’s second-largest economy, the largest exporter and second-largest importer and is the world’s fastest-growing major economy since 2010. However, in recent years, due to the continuous pursuit of rapid economic development, many challenges have arisen, such as increasing energy demand, as well as resource waste and environmental problems that cannot be ignored. China is currently in the dilemma of the EKC curve. Environmental pollution and economic growth are in, or gradually entering, a phase of positive correlation. It is impossible to determine when haze pollution and economic growth will be “decoupled” [56].

4.3. Regional Differences in Haze Reduction by Technological Progress from Different Sources

Table 5 is the estimated results of the haze reduction effects of different sources of technological progress in diverse regions. It can be seen that the haze reduction effects of different sources of technological progress show obvious regional heterogeneity in eastern, central, and western China.
It can be seen from Table 5 that independent innovations in the eastern, central, and western regions can all inhibit haze pollution, and they are significant at the levels of 10%, 5%, and 10%, respectively. This result is consistent with many research conclusions that the relationship between technological progress and pollution will be heterogeneous due to differences in regional development conditions [57,58]. This paper explains the positive effects and the differences in its effects from the configuration effect, structural effect, and technological effect of the three major regions: First, the eastern part has a high degree of marketization, economic, social development and the level of independent innovation has also entered a higher stage. The driving force of its development is now based on knowledge, technology, and other elements. Unlike the traditional elements of the input industry, these elements have the characteristics of low diffusion costs, increasing marginal returns and diminishing returns to scale, which would promote the upgrading of the industrial structure in the eastern region and reduce smog pollution. Secondly, the central region is an important energy production area in China. The improvement of the level of independent innovation will improve clean energy R&D capabilities to a certain extent and reduce the amount of excess harmful gas emitted by low energy utilization. In addition, Li, et al. [59] used traditional growth and algorithms to explore the spatial distribution characteristics of factor allocation efficiency. They found that the scarce capital and labor factor endowments in western China make it more sensitive to factor allocation distortions and have a higher allocation effect, leading to the alleviation of haze pollution.
It can be seen from Table 5 that the direct introduction of technology suppressed the haze pollution in the east and west at the significance levels of 10% and 5%, respectively, and failed the significance test in the central part. The economic development level of the eastern region is relatively high, the market demand potential is relatively large, and the market share that foreign-funded enterprises can obtain is correspondingly greater. The inflow of FDI in the eastern region accounted for 61.02% of the national total, which also brought a greater production scale in 2017. Since enterprises in the same industry value chain need to unify production standards and technical processes when cooperating, the inflow of FDI will force local enterprises to upgrade their technology and continuously improve their intermediate quality and production technology levels. The richness of labor and other resources in the eastern region makes it easier to achieve technological upgrade, thereby improving energy utilization and promoting haze emission reduction. Therefore, the reason for the suppression of haze pollution by FDI in the eastern region may be that the negative technical and structural effects are greater than the positive scale effects. Comparatively speaking, the economic development in the western region is relatively low, the utilization of foreign capital started late and is not attractive to foreign capital. The scale of foreign capital in various provinces is generally small and the requirements for innovative knowledge and technology brought by foreign capital are also low. At such an early stage, moderate the technological effects brought about by the inflow of FDI will significantly increase technological innovation output, thereby reducing environmental pressure.
It can be seen from Table 5 that reverse technology spillovers have aggravated haze pollution in the central and western regions at 5% and 10% significance levels respectively, and suppressed haze pollution in the eastern region at 5% levels. The reason is that the negative structural effect and technical effect of reverse technology spillover in the eastern region are greater than the scale effect. In contrast, the central and western regions’ positive structural effect and scale effect far exceed the negative technical effect. Although the scale of OFDI in the eastern and central and western regions has expanded to varying degrees, and the scale effect has brought a negative impact on the environment, in terms of structural effects, the rapid development of the eastern economy is accompanied by higher labor costs than other regions. Regions are more inclined to transfer pollution-intensive production activities to the host country through OFDI, thereby optimizing the industrial structure and reducing air pollution in the home country. The central and western regions possess lower labor costs and the primary motivation for OFDI is also to expand the market. Promoting economic development cannot effectively reduce the number of pollution-intensive industries in the home country, and its technological effect on the environment is not enough to compensate for the pollution caused by scale and structural effects.

4.4. Robustness Test

To avoid the influence of outliers on research results, all data in this paper have been processed with 1% tailing, which has a certain contribution to the robustness of the results. On this basis, considering the outbreak of the 2008 economic crisis, large-scale unemployment, and corporate bankruptcy worldwide have had an enormous negative impact on China’s technology import activities. Therefore, the 2008–2009 data was removed before performing the second systematic GMM estimation. As shown in Table 6, the estimation results of the core explanatory variables are basically consistent with the previous ones, which can prove that the research results of this paper are relatively robust.

5. Conclusions and Policy Implications

The sources of technological progress in emerging economies mainly include domestic independent innovation and the introduction of advanced technology from abroad. Among them, technology introduction can be subdivided into two channels: direct introduction and reverse spillover. At present, there is no definite conclusion about how they affect haze pollution and their effects. To answer this question, this paper first constructs a theoretical explanation framework for the influence of technological advances from different sources on haze pollution. Secondly, based on China’s panel data, the paper establishes a dynamic panel measurement model, and uses systematic GMM estimation methods to test the effects of technological advances from different sources on haze pollution. Finally, considering the regional heterogeneity, the impact of technological progress from different sources in the eastern, central, and western regions of China on haze pollution is analyzed.
First of all, from the national perspective, independent innovation has effectively reduced haze pollution due to structural and technological effects. While the research results of technology introduction tend to support the “pollution haven” hypothesis, direct introduction and reverse spillover through the effects of scale, structure, and technology have aggravated haze pollution in China. Secondly, from the regional perspective, independent innovation and technology introduction in the eastern region have suppressed haze pollution. Due to the relatively developed economic conditions and technological level of the eastern region, the “demonstration effect” and “learning effect” have been realized, confirming the “pollution halo” hypothesis. Independent innovation in the central region has suppressed haze pollution, while the haze reduction effect of direct technology introduction is not significant. Independent innovation and direct technology introduction in the western region can effectively curb haze pollution, but reverse technology spillovers aggravate haze pollution. Finally, rapid economic development, heavy industrial structure, and increased number of private cars have aggravated haze pollution, while strengthening environmental regulations is conducive to haze reduction. The overall results are shown in Table 7.
Based on the above research conclusions, in order to achieve effective control of China’s haze pollution through different sources of technological progress, the policy implications of this paper are as follows. First of all, although the introduction of technology promotes China’s economic transformation, which could improve the absorptive capacity of the industry to a certain extent, the negative environmental effects that followed cannot be ignored. When formulating relevant policies, stricter environmental protection standards should be formulated based on the technical situation of the parent and subsidiary companies of multinational companies to prevent pollution from being transferred from relatively developed countries to the host country. At the same time, technology-seeking FDI should also be encouraged to enable enterprises to reduce the cost of internationalization, promoting from the end to the top, and transform and upgrade the original traditional industrial structure. Secondly, the haze reduction policy needs to be “adapted to local conditions” and promote inter-regional linkage. The eastern region should actively play a role in demonstration effect, radiate and drive the surrounding areas to improve technology digestion and absorption capabilities, independent R&D capabilities and explore new low-carbon development models. As the energy reserves of the western region possess strong advantages, but with a low energy utilization efficiency, it is possible to establish energy economic cooperation with the eastern and central regions, learn advanced technology and experience, introduce and train high-quality talents and strengthen the region’s absorptive capacity of technological progress to achieve effective haze prevention and control. Finally, in view of the impact of control variables on haze pollution, we suggest focus should be placed on improving the quality of economic development to decouple economic development from PM2.5 emissions. It is necessary to increase entry criteria of high energy-consuming and high-polluting industries, encourage industry-university-research integration, and push forward the coordinated, high-level and rational development of the industrial structure. Green travel concept should be encouraged, so it is necessary to increase other forms of regional transportation, such as subways, bicycles, buses, etc., so that pollution caused by private car congestion can be reduced. Based on maintaining the strength of environmental regulations, relevant laws and regulations and policy systems for air pollution management should be further formulated and improved, including the collection of environmental taxes, the construction of emission rights trading markets, so that outdated production capacity can be sifted out to improve environmental production performance.

6. Discussion

6.1. Contributions

At the theoretical level, first, this paper tries to break through the perspective of existing studies that analyze technological progress from a single path and portray the haze reduction effect of technological progress from a more comprehensive perspective. This paper expands the research on technological progress in haze control by classifying technological progress from different sources and exploring its different effects on haze pollution, which can be used in the future to conduct further mechanism research by combining more analytical tools. Second, the results of this paper further corroborate the long-standing controversial “pollution paradise” and “pollution halo” hypotheses, and conclude that the effect of technology on haze control is more consistent with the “pollution halo” hypothesis in areas with high economic development, while the “pollution haven” is confirmed in areas with relatively low economic development, which enriches the existing research on technology pollution control theory.
At the practical level, considering the characteristics of China as an emerging economy, this paper incorporates technology introduction into the research framework, and also takes into account the differences in location, resource endowment, and economic development levels of various regions in China, compares and analyzes the regional differences in the effectiveness of different sources of technological progress in reducing haze in China, which can provide a basis for the formulation of “ locally tailored “ and more comprehensive technological haze reduction policies.

6.2. Limitations and Future Study

It should be noted that there is still space for improvement in this paper. Firstly, the main reason is that the spatial correlation of haze pollution is not considered. In fact, haze pollution is not a purely local environmental problem, it will diffuse or transfer to nearby areas through natural factors such as atmospheric circulation to a large extent. PM2.5, in particular, is easier to transmit over long distances and stay in the atmosphere for a long time affecting the local and neighboring areas [60]. Therefore, subsequent studies need to empirically identify spatial factors and consider, for example, combining spatial econometric models and applying them to tests of the haze reduction effects of technological progress from different sources.
Secondly, from the perspective of the influence mechanism, this paper focuses on the analysis by combining previous theories, and summarizes the mechanism of technological progress on haze pollution as a combination of structural effect, scale effect, and technology effect, etc. In the empirical part, each effect is also supported by the reality of Chinese economy and society. However, the overall effect mechanism is not quantified, and how to explain the effect mechanism more intuitively through empirical data will become a difficulty and direction for future research.

Author Contributions

Conceptualization, Y.Z., S.X. and S.Y.; methodology, Y.Z.; software, Y.Z. and T.Z.; validation, Y.Z. and T.Z.; formal analysis, Y.Z.; investigation, T.Z.; resources, Y.Z.; data curation, Y.Z.; writing—original draft preparation, Y.Z.; writing—review and editing, T.Z., T.W., and S.X.; visualization, T.W.; supervision, S.X. and S.Y.; project administration, Y.Z.; funding ac-quisition, S.X. and S.Y. All authors have read and agreed to the published version of the manuscript.

Funding

This research was funded by the Post-Fund Project Supported by the National Social Science Foundation of China (Grant NO. 20FGLB038).

Institutional Review Board Statement

Not applicable.

Informed Consent Statement

Not applicable.

Data Availability Statement

Not applicable.

Conflicts of Interest

The authors declare no conflict of interest.

References

  1. Tao, M.H.; Chen, L.F.; Su, L.; Tao, J.H. Satellite observation of regional haze pollution over the North China Plain. J. Geophys. Res. Atmos. 2012, 117. [Google Scholar] [CrossRef]
  2. Huang, R.J.; Zhang, Y.L.; Bozzetti, C.; Ho, K.F.; Cao, J.J.; Han, Y.M.; Daellenbach, K.R.; Slowik, J.G.; Platt, S.M.; Canonaco, F.; et al. High secondary aerosol contribution to particulate pollution during haze events in China. Nature 2014, 514, 218–222. [Google Scholar] [CrossRef] [Green Version]
  3. Chen, H.; Hu, D.W.; Wang, L.; Mellouki, A.; Chen, J.M. Modification in light absorption cross section of laboratory-generated black carbon-brown carbon particles upon surface reaction and hydration. Atmos. Environ. 2015, 116, 253–261. [Google Scholar] [CrossRef] [Green Version]
  4. Shen, X.J.; Sun, J.Y.; Zhang, X.Y.; Zhang, Y.M.; Zhang, L.; Che, H.C.; Ma, Q.L.; Yu, X.M.; Yue, Y.; Zhang, Y.W. Characterization of submicron aerosols and effect on visibility during a severe haze-fog episode in Yangtze River Delta, China. Atmos. Environ. 2015, 120, 307–316. [Google Scholar] [CrossRef] [Green Version]
  5. Li, H.; Zhang, M.; Li, C.; Li, M. Study on the spatial correlation structure and synergistic governance development of the haze emission in China. Environ. Sci. Pollut. Res. 2019, 26, 12136–12149. [Google Scholar] [CrossRef]
  6. Yoo, J.M.; Lee, Y.R.; Kim, D.; Jeong, M.J.; Stockwell, W.R.; Kundu, P.K.; Oh, S.M.; Shin, D.B.; Lee, S.J. New indices for wet scavenging of air pollutants (O-3, CO, NO2, SO2, and PM10) by summertime rain. Atmos. Environ. 2014, 82, 226–237. [Google Scholar] [CrossRef]
  7. Chen, S.M.; Zhang, Y.; Zhang, Y.B.; Liu, Z.X. The relationship between industrial restructuring and China’s regional haze pollution: A spatial spillover perspective. J. Clean. Prod. 2019, 239, 115808. [Google Scholar] [CrossRef]
  8. Shao, S.; Li, X.; Cao, J.H.; Yang, L.L. China’s economic policy choices for governing smog pollution based on spatial spillover effects. Econ. Res. J. 2016, 51, 73–88. [Google Scholar]
  9. Shi, T.; Zhang, W.; Zhou, Q.; Wang, K. Industrial structure, urban governance and haze pollution: Spatiotemporal evidence from China. Sci. Total Environ. 2020, 742, 139228. [Google Scholar] [CrossRef]
  10. Zhu, L.Y.; Hao, Y.; Lu, Z.N.; Wu, H.T.; Ran, Q.Y. Do economic activities cause air pollution? Evidence from China’s major cities. Sustain. Cities Soc. 2019, 49, 101593. [Google Scholar] [CrossRef]
  11. Ehrlich, P.R.; Holdren, J.P. Impact of population growth. Science 1971, 171, 1212–1217. [Google Scholar] [CrossRef] [PubMed]
  12. Zhong, X.J.; Long, S.B. Rethinking the environmental impact of the IPAT model. China Popul. Resour. Environ. 2016, 26, 61–68. [Google Scholar]
  13. Dietz, T.; Rosa, E.A. Effects of population and affluence on CO2 emissions. Proc. Natl. Acad. Sci. USA 1997, 94, 175–179. [Google Scholar] [CrossRef] [Green Version]
  14. Shao, S.; Yang, L.L.; Yu, M.B.; Yu, M.L. Estimation, characteristics, and determinants of energy-related industrial CO2 emissions in Shanghai (China), 1994–2009. Energy Policy 2011, 39, 6476–6494. [Google Scholar] [CrossRef]
  15. Liu, X.H. Dynamic evolution, spatial spillover effect of technological innovation and haze pollution in China. Energy Environ. 2018, 29, 968–988. [Google Scholar] [CrossRef]
  16. Dong, F.; Yu, B.L.; Pan, Y.L. Examining the synergistic effect of CO2 emissions on PM2.5 emissions reduction: Evidence from China. J. Clean. Prod. 2019, 223, 759–771. [Google Scholar] [CrossRef]
  17. Wei, W.X.; Ma, X.L.; Li, P.; Chen, Y. Roles of technological progress and tax in regional air pollution control in China. China Popul. Resour. Environ. 2016, 26, 1–11. [Google Scholar]
  18. Li, G.D.; Fang, C.L.; He, S.W. The influence of environmental efficiency on PM2.5 pollution: Evidence from 283 Chinese prefecture-level cities. Sci. Total Environ. 2020, 748, 10. [Google Scholar] [CrossRef]
  19. Acemoglu, D. Directed technical change. Rev. Econ. Stud. 2002, 69, 781–809. [Google Scholar] [CrossRef] [Green Version]
  20. Lin, B.Q.; Chen, X. How technological progress affects input substitution and energy efficiency in China: A case of the non-ferrous metals industry. Energy 2020, 206, 15. [Google Scholar] [CrossRef]
  21. Wang, B.B.; Qi, S.Z. Biased technological progress, factor substitution and China’s industrial energy intensity. Econ. Res. J. 2014, 49, 115–127. [Google Scholar]
  22. Yang, L.; Li, Z. Technology advance and the carbon dioxide emission in China—Empirical research based on the rebound effect. Energy Policy 2017, 101, 150–161. [Google Scholar] [CrossRef]
  23. Yi, M.; Wang, Y.Q.; Sheng, M.Y.; Sharp, B.; Zhang, Y. Effects of heterogeneous technological progress on haze pollution: Evidence from China. Ecol. Econ. 2020, 169, 11. [Google Scholar] [CrossRef]
  24. Song, M.L.; Fisher, R.; Kwoh, Y. Technological challenges of green innovation and sustainable resource management with large scale data. Technol. Forecast. Soc. Chang. 2019, 144, 361–368. [Google Scholar] [CrossRef]
  25. Fan, F.; Cao, D.L.; Ma, N. Is Improvement of Innovation Efficiency Conducive to Haze Governance? Empirical Evidence from 283 Chinese Cities. Int. J. Environ. Res. Public Health 2020, 17, 6095. [Google Scholar] [CrossRef]
  26. Markusen, J.R.; Venables, A.J. Foreign direct investment as a catalyst for industrial development. Eur. Econ. Rev. 1999, 43, 335–356. [Google Scholar] [CrossRef] [Green Version]
  27. Sapkota, P.; Bastola, U. Foreign direct investment, income, and environmental pollution in developing countries: Panel data analysis of Latin America. Energy Econ. 2017, 64, 206–212. [Google Scholar] [CrossRef]
  28. Rahman, Z.U.; Cai, H.; Ahmad, M. A new look at the remittances-fdi- energy-environment nexus in the case of selected asian nations. Singap. Econ. Rev. 2019, 0, 1–19. [Google Scholar] [CrossRef]
  29. Repkine, A.; Min, D. Foreign-Funded Enterprises and Pollution Halo Hypothesis: A Spatial Econometric Analysis of Thirty Chinese Regions. Sustainability 2020, 12, 5048. [Google Scholar] [CrossRef]
  30. Zhang, C.; Zhou, X. Does foreign direct investment lead to lower CO2 emissions? Evidence from a regional analysis in China. Renew. Sustain. Energy Rev. 2016, 58, 943–951. [Google Scholar] [CrossRef]
  31. Lee, D. The role of R&D and input trade in productivity growth: Innovation and technology spillovers. J. Technol. Transf. 2020, 45, 908–928. [Google Scholar] [CrossRef]
  32. Ciruelos, A.; Wang, M. International technology diffusion: Effects of trade and FDI. Atl. Econ. J. 2005, 33, 437–449. [Google Scholar] [CrossRef]
  33. Pan, X.F.; Li, M.N.; Wang, M.Y.; Chu, J.H.; Bo, H.G. The effects of outward foreign direct investment and reverse technology spillover on China’s carbon productivity. Energy Policy 2020, 145, 9. [Google Scholar] [CrossRef]
  34. Blomström, M.; Kokko, A. Multinational corporations and spillovers. J. Econ. Surv. 1998, 12, 247–277. [Google Scholar] [CrossRef]
  35. Ethier, W.J.; Markusen, J.R. Multinational firms, technology diffusion and trade. J. Int. Econ. 1996, 41, 1–28. [Google Scholar] [CrossRef] [Green Version]
  36. Huang, J.B.; Du, D.; Tao, Q.Z. An analysis of technological factors and energy intensity in China. Energy Policy 2017, 109, 1–9. [Google Scholar] [CrossRef]
  37. Pan, X.F.; Zhang, J.; Song, M.L.; Ai, B.W. Innovation resources integration pattern in high-tech entrepreneurial enterprises. Int. Entrep. Manag. J. 2018, 14, 51–66. [Google Scholar] [CrossRef]
  38. Fosfuri, A.; Motta, M. Multinationals without advantages. Scand. J. Econ. 1999, 101, 617–630. [Google Scholar] [CrossRef]
  39. Bertrand, O.; Capron, L. Productivity enhancement at Home via cross-border acquisitions: The roles of learning and contemporaneous domestic investments. Strateg. Manag. J. 2015, 36, 640–658. [Google Scholar] [CrossRef]
  40. Piperopoulos, P.; Wu, J.; Wang, C.Q. Outward FDI, location choices and innovation performance of emerging market enterprises. Res. Policy 2018, 47, 232–240. [Google Scholar] [CrossRef]
  41. Guarini, M.R.; Morano, P.; Sica, F. Historical School Buildings. A Multi-Criteria Approach for Urban Sustainable Projects. Sustainability 2020, 12, 1076. [Google Scholar] [CrossRef] [Green Version]
  42. Guarini, M.R.; Morano, P.; Sica, F. Integrated Ecosystem Design: An Evaluation Model to Support the Choice of Eco-Compatible Technological Solutions for Residential Building. Energies 2019, 12, 2659. [Google Scholar] [CrossRef] [Green Version]
  43. Grossman, G.M.; Krueger, A.B. Economic growth and the environment. Q. J. Econ. 1995, 110, 353–377. [Google Scholar] [CrossRef] [Green Version]
  44. Ali, U.; Shan, W.; Wang, J.J.; Amin, A. Outward foreign direct investment and economic growth in China: Evidence from asymmetric ardl approach. J. Bus. Econ. Manag. 2018, 19, 706–721. [Google Scholar] [CrossRef] [Green Version]
  45. Blundell, R.; Bond, S. Initial conditions and moment restrictions in dynamic panel data models. J. Econom. 1998, 87, 115–143. [Google Scholar] [CrossRef] [Green Version]
  46. Yuan, Y.; Xi, Q.M.; Sun, T.S.; Li, G.P. The impact of the industrial structure on regional carbon emission: Empirical evidence across countries. Geogr. Res. 2016, 35, 82–94. [Google Scholar]
  47. Gollop, F.M.; Roberts, M.J. Environmental Regulations and Productivity Growth: The Case of Fossil-fueled Electric Power Generation. J. Political Econ. 1983, 91, 674. [Google Scholar] [CrossRef]
  48. Berman, E.; Bui, L.T.M. Environmental regulation and productivity: Evidence from oil refineries. Rev. Econ. Stat. 2001, 83, 498–510. [Google Scholar] [CrossRef] [Green Version]
  49. Shapiro, J.S.; Walker, R. Why Is Pollution from US Manufacturing Declining? The Roles of Environmental Regulation, Productivity, and Trade. Am. Econ. Rev. 2018, 108, 3814–3854. [Google Scholar] [CrossRef] [Green Version]
  50. Yang, C.H.; Tseng, Y.H.; Chen, C.P. Environmental regulations, induced R&D, and productivity: Evidence from Taiwan’s manufacturing industries. Resour. Energy Econ. 2012, 34, 514–532. [Google Scholar] [CrossRef]
  51. Zhou, Q.; Zhang, X.L.; Shao, Q.L.; Wang, X.L. The non-linear effect of environmental regulation on haze pollution: Empirical evidence for 277 Chinese cities during 2002–2010. J. Environ. Manag. 2019, 248, 109274. [Google Scholar] [CrossRef] [PubMed]
  52. Frey, H.C.; Unal, A.; Rouphail, N.M.; Colyar, J.D. On-road measurement of vehicle tailpipe emissions using a portable instrument. J. Air Waste Manag. Assoc. 2003, 53, 992–1002. [Google Scholar] [CrossRef] [Green Version]
  53. Basarić, V.; Đorić, V.; Bogdanović, V.; Mitrović, J.; Jović, J. Effects of Traffic on NO2 and PM 10 Emissions in Novi Sad. Pol. J. Environ. Stud. 2014, 23, 5. [Google Scholar]
  54. Chen, Y.; Whalley, A. Green Infrastructure: The Effects of Urban Rail Transit on Air Quality. Am. Econ. J. Econ. Policy 2012, 4, 58–97. [Google Scholar] [CrossRef] [Green Version]
  55. Li, W.X.; Yin, S. Analysis on cost of urban rail transit. J. Transp. Syst. Eng. Inf. Technol. 2012, 12, 9–14. [Google Scholar] [CrossRef]
  56. Dong, K.Y.; Sun, R.J.; Jiang, H.D.; Zeng, X.G. CO2 emissions, economic growth, and the environmental Kuznets curve in China: What roles can nuclear energy and renewable energy play? J. Clean Prod. 2018, 196, 51–63. [Google Scholar] [CrossRef]
  57. Dauda, L.; Long, X.L.; Mensah, C.N.; Salman, M. The effects of economic growth and innovation on CO2 emissions in different regions. Environ. Sci. Pollut. Res. 2019, 26, 15028–15038. [Google Scholar] [CrossRef] [PubMed]
  58. Du, K.R.; Li, P.Z.; Yan, Z.M. Do green technology innovations contribute to carbon dioxide emission reduction? Empirical evidence from patent data. Technol. Forecast. Soc. Chang. 2019, 146, 297–303. [Google Scholar] [CrossRef]
  59. Li, Y.; Gao, B.; Lei, H. Changes in factor productivity in China: 1978–2016. J. Quant. Tech. Econ. 2018, 35, 21–39. [Google Scholar] [CrossRef]
  60. Bodor, Z.; Bodor, K.; Keresztesi, Á.; Szép, R. Major air pollutants seasonal variation analysis and long-range transport of PM10 in an urban environment with specific climate condition in Transylvania (Romania). Environ. Sci. Pollut. Res. 2020, 27, 38181–38199. [Google Scholar] [CrossRef]
Figure 1. The impact mechanism of technological progress from different sources on haze pollution.
Sustainability 13 02730 g001
Table 1. Variables selection.
VariablesNameIndicator
Explained variableHaze pollutionPM2.5 annual average concentration
Core explanatory variablesIndependent innovationNumber of granted patent applications
Direct introductionActual total FDI
Reverse technology spilloverForeign non-financial direct investment
Control variablesEconomic development levelGDP per capita
Industrial structureThe proportion of the added value of the secondary industry, including industry and construction in GDP
Environmental regulationsThe ratio of the actual completed investment in industrial pollution control to the main business cost of the industry above designated scale
TransportationPrivate car ownership per unit road mileage
Table 2. Variable descriptive statistics results.
TypeVariableObsMeanSDMinMax
Haze pollutionlnz5403.5790.4532.4164.343
Technological progresslnrd5408.7331.6714.61512.387
lnifdi54012.0471.8227.51414.851
lnofdi5409.6444.1170.00015.742
Controlsindus54046.1107.80720.70057.800
er5400.2160.1910.0200.967
trans54023.19434.6771.456196.073
lngdp54010.0240.8368.33411.653
Table 3. Descriptive statistics of technological progress from different sources by region.
VariableAreaObsMeanSDMinMax
lnrdEastern regions1989.6801.6415.29812.506
Central regions1448.7221.1776.87510.986
Western regions1987.791.4824.36911.067
lnifdiEastern regions19813.3661.02310.67115.017
Central regions14412.2861.2319.85514.346
Western regions19810.5581.7147.33613.867
lnofdiEastern regions19810.8844.1200.00016.342
Central regions1449.4733.7500.00013.833
Western regions1988.5384.0650.00013.542
Table 4. Estimation results of haze reduction effects of technological progress from different sources.
lnrdlnifdilnofdi
l.lnz0.535 *0.471 ***0.470 ***
(1.854)(3.945)(3.737)
l.T−0.228 ***0.027 *0.014 **
(−2.865)(1.673)(2.340)
indus−0.0070.010 *0.009 *
(−0.533)(1.712)(1.744)
er−1.454 ***0.0870.127
(−2.919)(1.269)(1.532)
trans0.003 *0.002 **0.003 ***
(1.852)(2.350)(3.040)
lngdp0.153−0.044−0.097 **
(1.516)(−1.296)(−2.292)
_cons2.660 ***1.532 ***2.233 ***
(4.413)(4.022)(4.419)
N510510510
AR(1)0.0430.0010.002
AR(2)0.8390.1820.352
Hansen0.1080.2010.110
instruments172927
Note: Figures in parentheses are t values; *, **, *** denote statistical significance levels at 10%, 5% and 1% respectively.
Table 5. Estimated results of regional haze reduction effects of technological progress from different sources.
Eastern RegionsCentral RegionsWestern Regions
l.lnrd−0.050 *−0.446 **−0.145 *
(−2.033)(−1.983)(−1.721)
ControlsYYY
AR(1)0.0730.0220.093
AR(2)0.4150.6710.163
Hansen0.6350.9870.256
l.lnifdi−0.141 *0.049−0.043 **
(−1.736)(0.387)(−2.150)
ControlsYYY
AR(1)0.0740.0310.083
AR(2)0.3100.4160.354
Hansen0.6800.5580.321
l.lnofdi−0.025 **0.098 **0.035 *
(−2.200)(2.106)(1.850)
ControlsYYY
AR(1)0.0720.0000.052
AR(2)0.3220.1540.260
Hansen0.2220.8540.647
Note: Figures in parentheses are t values; *, ** denote statistical significance levels at 10% and 5% respectively.
Table 6. Robustness test.
lnrdlnifdilnofdi
l.lnz0.490 ***0.391 ***0.487 ***
(3.237)(3.281)(3.592)
l.T−0.179 ***0.0670.014 **
(−3.055)(1.292)(4.168)
_cons1.204 ***1.590 ***2.567 ***
(3.230)(3.754)(4.168)
ControlYYY
N420420420
AR(1)0.0020.0010.001
AR(2)0.4680.9530.501
Hansen0.1190.1810.114
instruments273028
Note: Figures in parentheses are t values; **, *** denote statistical significance levels at 5% and 1% respectively.
Table 7. Results on the impact of technological progress on haze pollution from different sources.
TypeIndependent InnovationDirect IntroductionReverse Technology Spillover
Region
Country++
Eastern Region
Central Region/+
Western Region+
Note: ‘−, +’ express negative and positive correlation between technological progress and haze pollution; ‘/’ indicate insignificance.
Publisher’s Note: MDPI stays neutral with regard to jurisdictional claims in published maps and institutional affiliations.

