Article

Compatibility of Automated Vehicles in Street Spaces: Considerations for a Sustainable Implementation

by
Aggelos Soteropoulos
1,2,*,
Martin Berger
2 and
Mathias Mitteregger
1
1
Future.lab, Technical University of Vienna, 1040 Vienna, Austria
2
Institute for Transportation System Planning, Technical University of Vienna, 1040 Vienna, Austria
*
Author to whom correspondence should be addressed.
Sustainability 2021, 13(5), 2732; https://doi.org/10.3390/su13052732
Submission received: 21 January 2021 / Revised: 25 February 2021 / Accepted: 25 February 2021 / Published: 3 March 2021

Abstract

:
Automated Vehicles (AVs) will bring a fundamental change in the mobility sector in the coming years. Whereas many studies emphasize opportunities with AVs, studies on the impacts of AVs on travel behavior particularly show an overall increase in traffic volume. This increase could impair the needs of other uses and users within street spaces and decrease the permeability of the street space for pedestrians and cyclists. However, only a few studies, so far, have looked at the changes of traffic volume due to AVs at the street level, and to what extent these impair the needs of other uses and users within different street spaces was not in the focus at all. This paper investigates the compatibility of AVs in street spaces, building on different modeling results of scenarios with AVs based on the Multi-Agent Traffic Simulation (MATSim) framework. Using the so-called compensatory approach and the whole street network of Vienna, Austria, as a case study, we examine how compatible AVs and their related changes in traffic volume are with the needs of other uses and users, i.e., pedestrians and cyclists, within different street spaces, by specifically considering the various characteristics of the latter. Results show that the effects of AVs on the compatibility of street spaces would be unevenly distributed across the city. For Shared Automated Vehicles (SAVs), a deterioration in compatibility is observable, especially in inner-city dense areas, because of an increase in traffic volume and an already high amount of competing uses. In contrast, especially (on main roads) in the outskirts, improvements in compatibility are possible. This particularly applies to SAVs with a stop-based service. However, private AVs interlinked with an overall capacity increase would lead to a deterioration in compatibility, especially in parts of the higher-level street network that already have incompatible traffic volumes, further increasing the separating or barrier effect of such streets. The results can provide insights for policymakers and stakeholders about where and how to facilitate AVs, to reach an implementation that is compatible with the different uses and needs of users within street spaces: While SAVs should be implemented particularly in the outskirts, as a complement for public transport, an implementation of AVs in the lower-level street network in inner parts of the city should not be facilitated, or it should at least be linked to measures that make street spaces more compatible with the needs of pedestrians and cyclists, e.g., implementation of walking and cycling infrastructure.

1. Introduction

Automated Vehicles (AVs) will completely change our mobility and the way of moving from point A to point B. Already in the next years, dynamic developments with fundamental changes can be expected in the mobility sector which bring both opportunities and risks. From the point of view of transport planning, infrastructure planning, and city planning, strategies are needed to determine where and how AVs can be implemented in the best possible and sustainable way [1,2,3,4].
Several studies have already been carried out on the impacts of AVs on traffic, travel behavior, and land use, or on wider societal or environmental implications, which can serve as a basis for developing strategies and measures for political decision-makers. Opportunities of AVs mentioned in these studies include, amongst other things, higher capacity utilization of existing transport infrastructure, improved cost-effectiveness of public transport if costs of personnel can be reduced, and extended mobility options for specific user groups (e.g., mobility-impaired people) [1,5]. However, concerning the impacts on travel behavior, most studies assume that AVs will increase the attractiveness of vehicles and thus traffic volume, i.e., Vehicle-Miles-Traveled (VMT), in the areas intended for AVs due to numerous advantages in terms of comfort, use of in-vehicle time, and the possible mobilization of new user groups [6,7]. However, these changes in traffic volume due to AVs were mostly shown on a city-wide or transport-system level, but how they interfere within street spaces with their different adjacent uses and needs of users was hardly researched so far; however, this is of high relevance regarding implementation strategies for AVs in cities.
In principle, street spaces are subject to a wide range of competing usage demands and requirements and needs of people who want to move, stroll, meet, stay, sit, or play [8,9]. In addition to the traffic function of streets, the type and extent of further demands on street spaces result from their environment, i.e., the nature and extent of buildings and type of land usage along the street (surrounding uses) and the linkages between the two sides of the street [10,11]. These usage demands are partly contradictory, conflict with the traffic function of streets, and lead to conflicts of use within street spaces [12]. In particular, conflicts between the demands of motor vehicle traffic and the needs of other users, i.e., pedestrians and cyclists or users of micro-mobility (that move, stay, sit, etc., in the street space), are only reasonable up to a certain intensity or reasonable depending on the concrete situation. However, if the traffic volume of motor vehicles rises above this limit, it reaches a level of dominance that impairs the other needs of users of the street space to an extent that is no longer compatible [10,11,13].
Therefore, from a planning point of view, it is necessary to investigate to what extent the implementation and use of AVs in street spaces are compatible with the uses and needs of other users within street spaces due to the increase in traffic volume associated with AVs. This is all the more important as not only an increase in traffic volume might affect street spaces with AVs in the future, but also the traffic flow facilitated by AVs with short gaps between vehicles enabling higher capacity utilization of the transport infrastructure, leads to denser traffic. Pedestrians and cyclists could find gaps more difficult and the separating or barrier effect of the streets (also known as community severance), relating to both physical and psychological impediments to pedestrian and cyclist movements [14,15], is increased. This leads to a decreasing permeability of the street space for pedestrians and cyclists [16,17].
This paper investigates the compatibility of AVs and their related changes in traffic volume with the needs of other uses and users, i.e., pedestrians and cyclists, within different street spaces. Using the case study of Vienna, Austria, first different scenarios with AVs are modeled, using the Multi-Agent Transport Simulation (MATSim) framework which was performed by Trafility (www.trafility.at (accessed on 21 January 2021)) to obtain potential changes in traffic volume due to AVs at the street level. Building on the modeling results, the so-called compensatory approach based on GIS is used to assess how compatible these changes in traffic volume due to AVs are with the needs of other uses and users in the street spaces, i.e., to what extent the changes in traffic volume due to AVs impair these needs, by specifically considering various characteristics of the street spaces. To the best of our knowledge, this has not been done before.
This paper is structured as follows. Section 2 presents related work on this topic and stresses the particular contribution of this study with regard to previous research. Section 3 describes the different scenarios with AVs and their modeling, using MATSim, as well as the compensatory approach for examining the compatibility of AVs within street spaces, based on the changes in traffic volume in the scenarios. Section 4 presents the results of the analysis of the compatibility of AVs within street spaces, using the case study of Vienna, Austria. Section 5 provides a discussion of the results and Section 6 closes the paper with a conclusion and possible future avenues of research.

2. Related Works

Investigating the impacts of AVs on travel behavior has been widely popular in the last years. Existing studies apply various models and simulations to analyze these impacts, as AVs are not yet available to the public at large, and gathering empirical data for further analysis is not possible on a large scale [16,18]. This includes existing travel demand modeling methods, including trip-based models [19], activity-based models [20,21]) and agent-based models [22,23,24,25].
Besides using different methods to explore impacts, the studies also define different scenarios for the transport supply with AVs, i.e., by replacing all or a specific share of current private vehicle trips with Shared Automated Vehicles (SAVs) and private AVs [21,26], by splitting trips by modes, using a rule-based mode-choice model based on the existence/non-existence of public transport [22,27] or by incorporating SAVs and private AVs as a new transport option in the mode-choice model [19,28]. Moreover, studies also apply different assumptions for AVs, e.g., regarding the reduction of the Value of Time (VOT), because of increased comfort and productivity while traveling as a passenger, instead of concentrating on the driving task and increased road capacity, but also how SAVs are assigned and relocated or the size of SAVs and acceptable waiting times or operating costs [16].
Focusing on private AVs, Kim et al. [29], for example, used an activity-based model (including mode and trip-choice), assumed a change in road capacity by +50%, and indicated an increase in VMT by 4% for the Atlanta region in the US. The increase in VMT goes up to 13% when also assuming changes in the value of time by −50% for private AVs compared to current private cars. Zhao and Kockelmann [19] investigated the effects of both private AVs and SAVs in Austin, USA, using a trip-based model. They assume a reduction in VOT for both private AVs and SAVs by 50% compared to current private cars and operating costs of 1 $ per mile and report an increase in VMT by 28%. Martinez and Viegas [30] assume a replacement of all motorized trips by SAVs with ridesharing and indicate also a decrease in Vehicle Kilometers Traveled (VKT) by 25% for the city of Lisbon, Portugal.
However, some of the earlier studies [31] did not consider congestion and explicit traffic assignment [32], while studies looking at the routing of AVs in congested areas stress the issue of balancing traffic flows [33,34]. In recent years, several studies looking at the impacts of AVs on travel behavior also used the agent-based model MATSim [23,24]. MATSim allows users to consider these issues and to obtain more realistic and executable travel plans under transport constraints, as well as for a more detailed investigation [23,35].
Boesch et al. [24], for example, used the MATSim framework and focused on the effects of both private AVs and SAVs in the city of Zug in Switzerland. They assume a reduction of the value of time for SAVs by 54%, compared to current private cars, as well as operating costs of 0.46 CHF/km (and a reduction of the value of time for private AVs and operating costs for private AVs and public transport), and indicate an increase in VMT by 16%.
Overall, the studies mostly indicate an overall increase in VMT due to private AVs and SAVs, unless there is a high share of people willing to share their ride and especially if a reduction in the value of time is assumed [16,36]. However, results on the changes in traffic volume, i.e., VMT, were mostly presented on a city-wide level and only a few of these studies also looked at changes in traffic volumes at the street level.
Friedrich and Hartl [27], for example, investigated the impacts of SAVs, using a macroscopic travel demand model, and assume a replacement of all private cars by SAVs with and without ridesharing (but existent public transit), for the region of Stuttgart in Germany. They indicate an overall increase in VKT by 18% for SAVs without ridesharing and an overall decrease in VKT by 20% for SAVs with ridesharing. However, when looking at the street level, mixed effects are shown. The results for SAVs with ridesharing show a reduction in traffic volume, especially on main roads in the outskirts, while some roads in the lower-level street network in inner parts of the city experience an increase in traffic volume. For SAVs without ridesharing, however, an increase in traffic volume is shown on most streets of the higher and lower-level street network.
Similarly, in a study by the International Transport Forum [22] the effects of SAVs with ridesharing are investigated for Lisbon, Portugal, using an agent-based model. They assume a replacement of all private cars by SAVs with ridesharing (but existent public transit) and report an overall decrease in VMT by 6%. When looking at the distribution of traffic volume at street level at peak hour, especially streets in the higher-level street network experience a drop in traffic. However, for streets of the lower-level street network in the city-center (especially in areas where traffic was previously largely absent), an increase in traffic is reported. It is also mentioned that this potential increase in traffic conflicts with walking and cycling in these areas.
However, so far this circumstance, i.e., to what extent a possible increase in travel volume by AVs in specific areas impairs the needs of other users, e.g., pedestrians and cyclists, and uses or is compatible with these needs, was not investigated further for the case of AVs.
Several earlier studies address this aspect, although not in the context of AVs. These studies used different approaches to assess the compatibility of traffic with the needs of other uses and users, i.e., pedestrians and cyclists, and were used in the last years in Bühlmann and Laube [11], Frehn et al. [37], or Baier et al. [38]. Besides a lot of qualitative and broad approaches [37,38], one often applied and more comprehensive approach for this topic is the so-called compensatory approach by von Mörner et al. [39] which was refined by Bühlmann and Laube [11]. This approach assesses the compatibility of traffic with the needs of other uses and users in the street space by specifically taking into account the different characteristics, e.g., typology, area type, etc., of street spaces in a quantitative and more detailed way.
This paper differs from previous work, as it looks at the impacts of AVs on travel behavior, i.e., changes in traffic volume, at the street level based on outputs from different scenarios with AVs which were modeled with MATSim and allow for an investigation with great temporal and spatial detail. It further builds on these results and uses the compensatory approach based on GIS to assess the compatibility of these changes in traffic volume due to AVs with the needs of other uses and users in street spaces, which has not been done in other studies before.

3. Method

In order to investigate the compatibility of AVs in street spaces, an analysis on the traffic volume changes due to AVs at street level was performed for the case study of Vienna, building on outputs from different scenarios with AVs modeled in MATSim. Based on the modeling results on changes in traffic volume, i.e., number of vehicles at peak hour, at street level, the compensatory approach based on GIS is used to assess the compatibility of the changes in traffic volume due to AVs with the different demands of uses and users within street spaces.

3.1. Data: Street Network and Street Segmentation

Street network data of the year 2019 were obtained for the whole administrative area of the city of Vienna from the Austrian Graph Integration Platform (GIP). The GIP is a freely accessible administrative database owned by different road operators (state, cities, municipalities) in Austria which update this database [40]. Within this dataset, all streets not approved for motorized traffic (e.g., walking and cycling paths) were deleted. The street network was split up into street links with a maximum length of 100 m (N = 52,840), which proved to be the most suitable spatial reference units in order to investigate the compatibility of AVs in different street spaces. This was done because, on the one hand, the physical attributes and amenities vary within one street and its intersections, and on the other hand, a too-small segment size would produce a large amount of noise [41].

3.2. Scenarios of AVs Modeled in MATSim

The scenarios that build the basis for examining the compatibility of AVs in street spaces are based on MATSim, a large-scale agent-based transport simulation package that was used to model each person’s activities in a realistic transportation network, i.e., city of Vienna, and to observe on an individual level how agents (representing travelers and vehicles) fare in the network [23,35] (The simulation within MATSim was carried out by Trafility and is described in more detail in [42]).
Within MATSim, all agents try to maximize their utility in a co-evolutionary iterative process until a dynamic user equilibrium is reached, meaning that no agent can further improve their mobility behavior by modifying their plan [23,43,44]. An iteration in MATSim generally consists of three steps:
  • In the first step, the plans, i.e., activities and connecting trips during a day, of all agents are simulated simultaneously based on input data of a synthetic population. A queue-simulation model is used which moves vehicles from link to link in the network. When the capacity limit of a link is reached, traffic slows down and congestion builds up on the upstream link. This way, the choices from the agents’ plans directly affect the simulation travel times. Since this may introduce delays, the outcome of a plan is different than its initial version [44,45].
  • Therefore, the second step of the iteration is the scoring, i.e., comparing how well an initial plan worked out. The observed plan is translated into a utility value (score) based on a predefined utility function (e.g., performing an activity is increasing utility while driving a car or having to wait for a bus is decreasing utility). This utility function accounts for both the travel and the activities (Equation (1)). The final score is assigned to the selected plan of the agent. Over time, agents can collect such plans in their memory which has a predefined size of N past plans [23,45].
    U = i = 1 q U t r a v e l , i t t r a v e l , i + j = 1 q + 1 U a c t i v i t y , i t a c t i v i t y , j
    of travel for ith trip in a day; i = 1, 2, 3, …, q trips; ttravel; i = Travel time for ith trip; Uactivity; j = Utility of performing the jth activity in a day; j = 1, 2, 3, …, q + 1 activities; and tactivity; i = Duration of jth activity [23,35]
  • The last stage of the iterative process is re-planning: For each agent, a re-planning strategy is chosen. This may be a selection strategy (i.e., selecting from an agent’s memory a plan based on its utility) or an innovation strategy, where a certain plan of an agent is duplicated and modified in a specific way (e.g., choosing a different departure time for a trip). Finally, if this leads to a state where an agent has more than N plans in memory, a removal procedure is applied, that chooses a plan to be deleted from the memory. In the next iteration, the selected/modified plans will be executed, scored, re-planned, and so on, until a dynamic user equilibrium is reached, i.e., no agent can further improve their mobility behavior by modifying their plan [23,35,45].
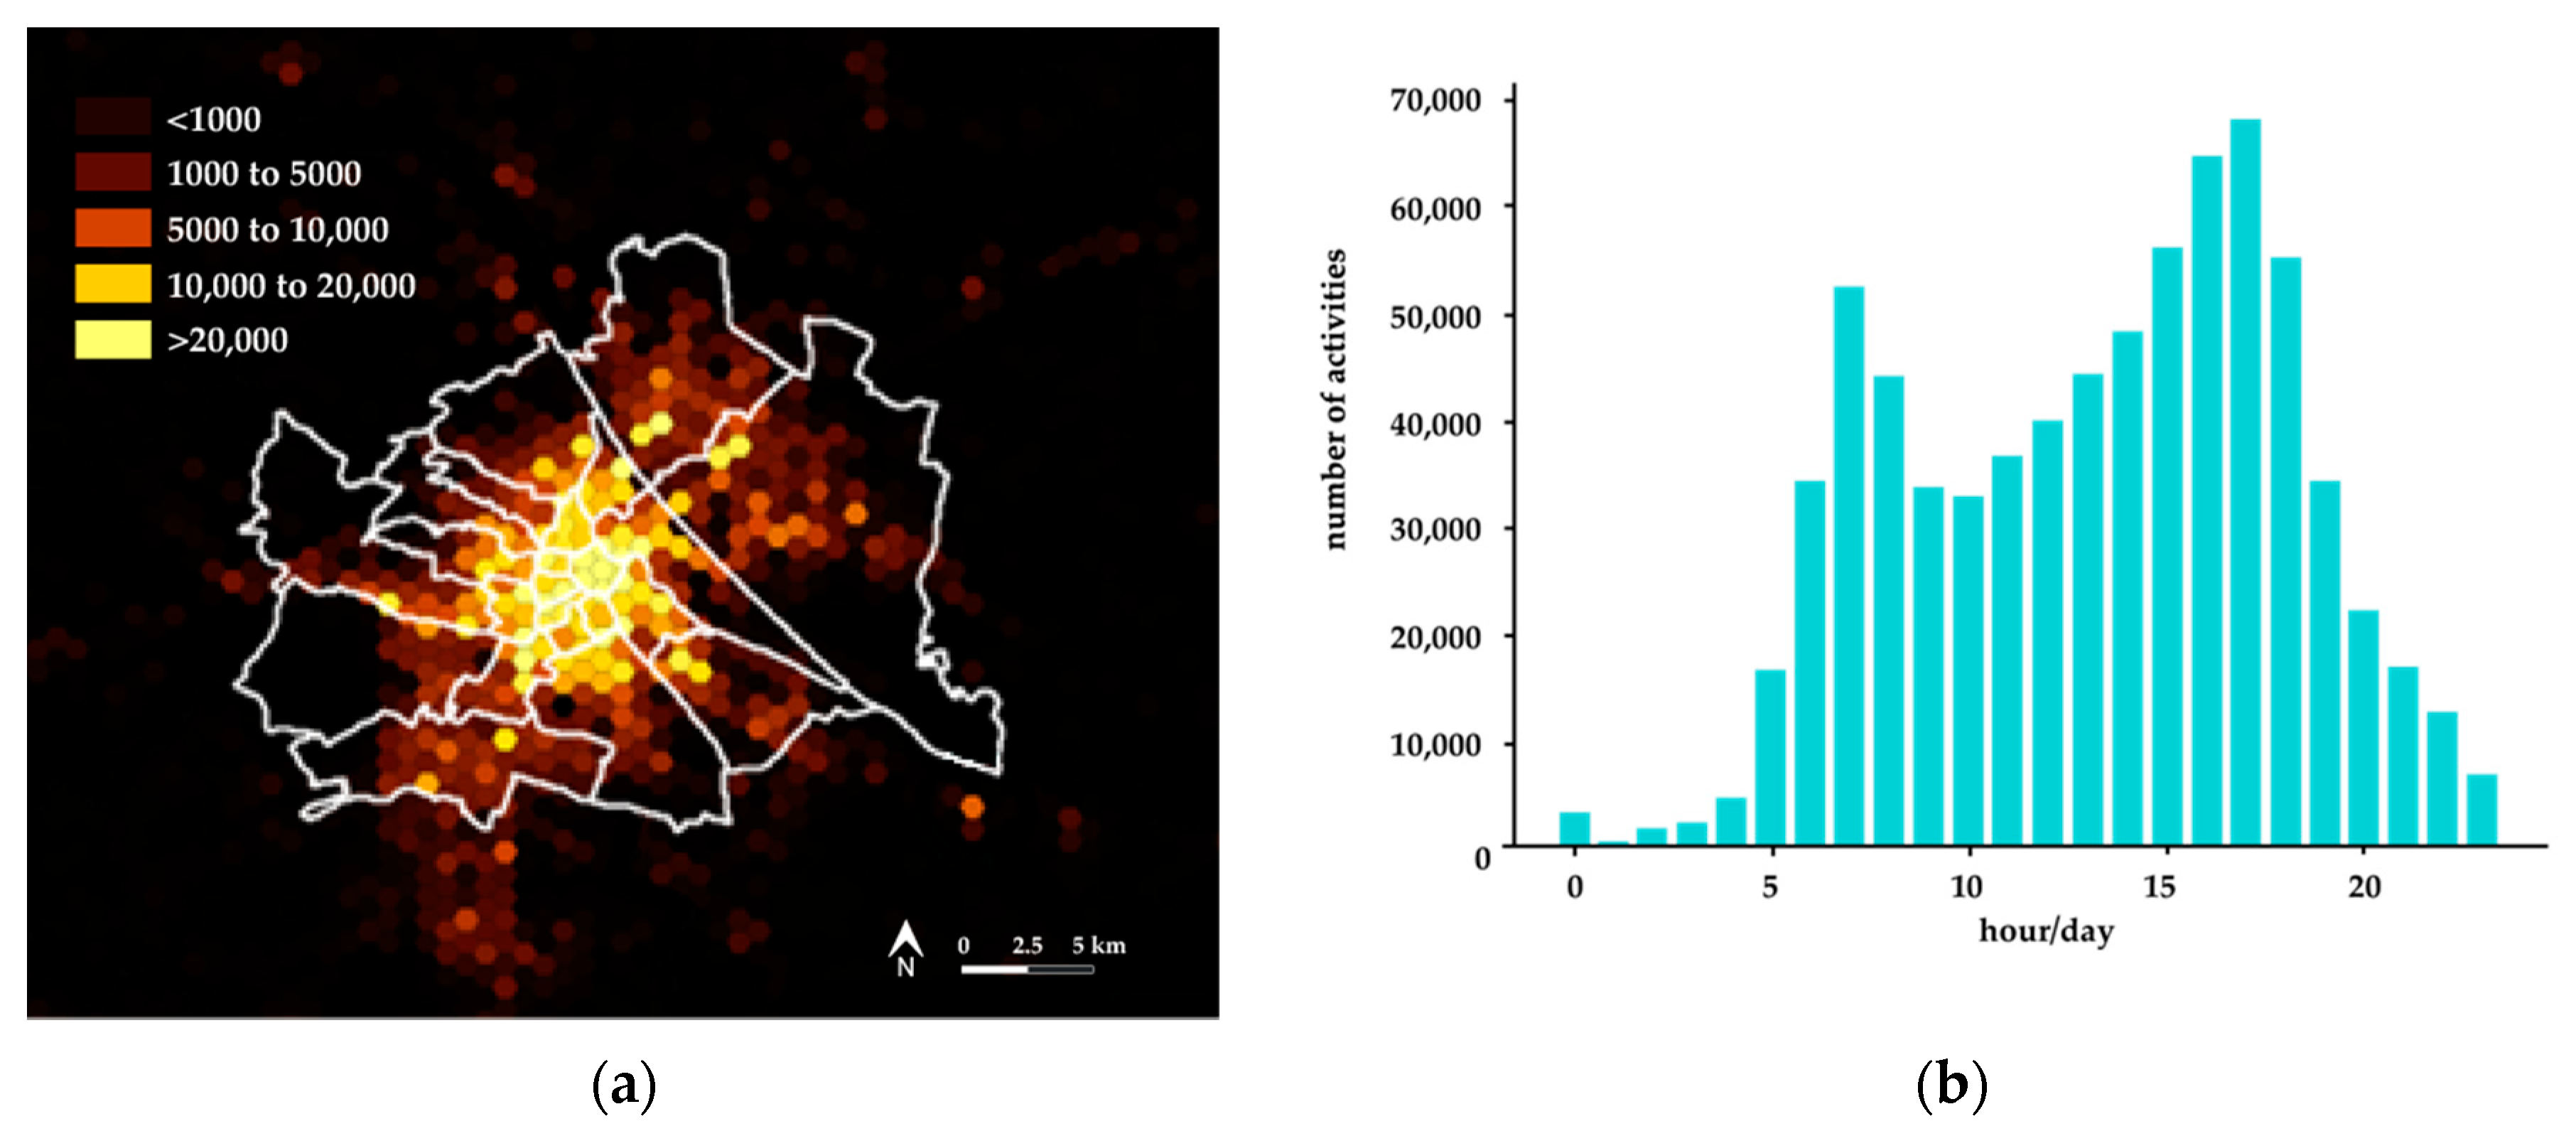
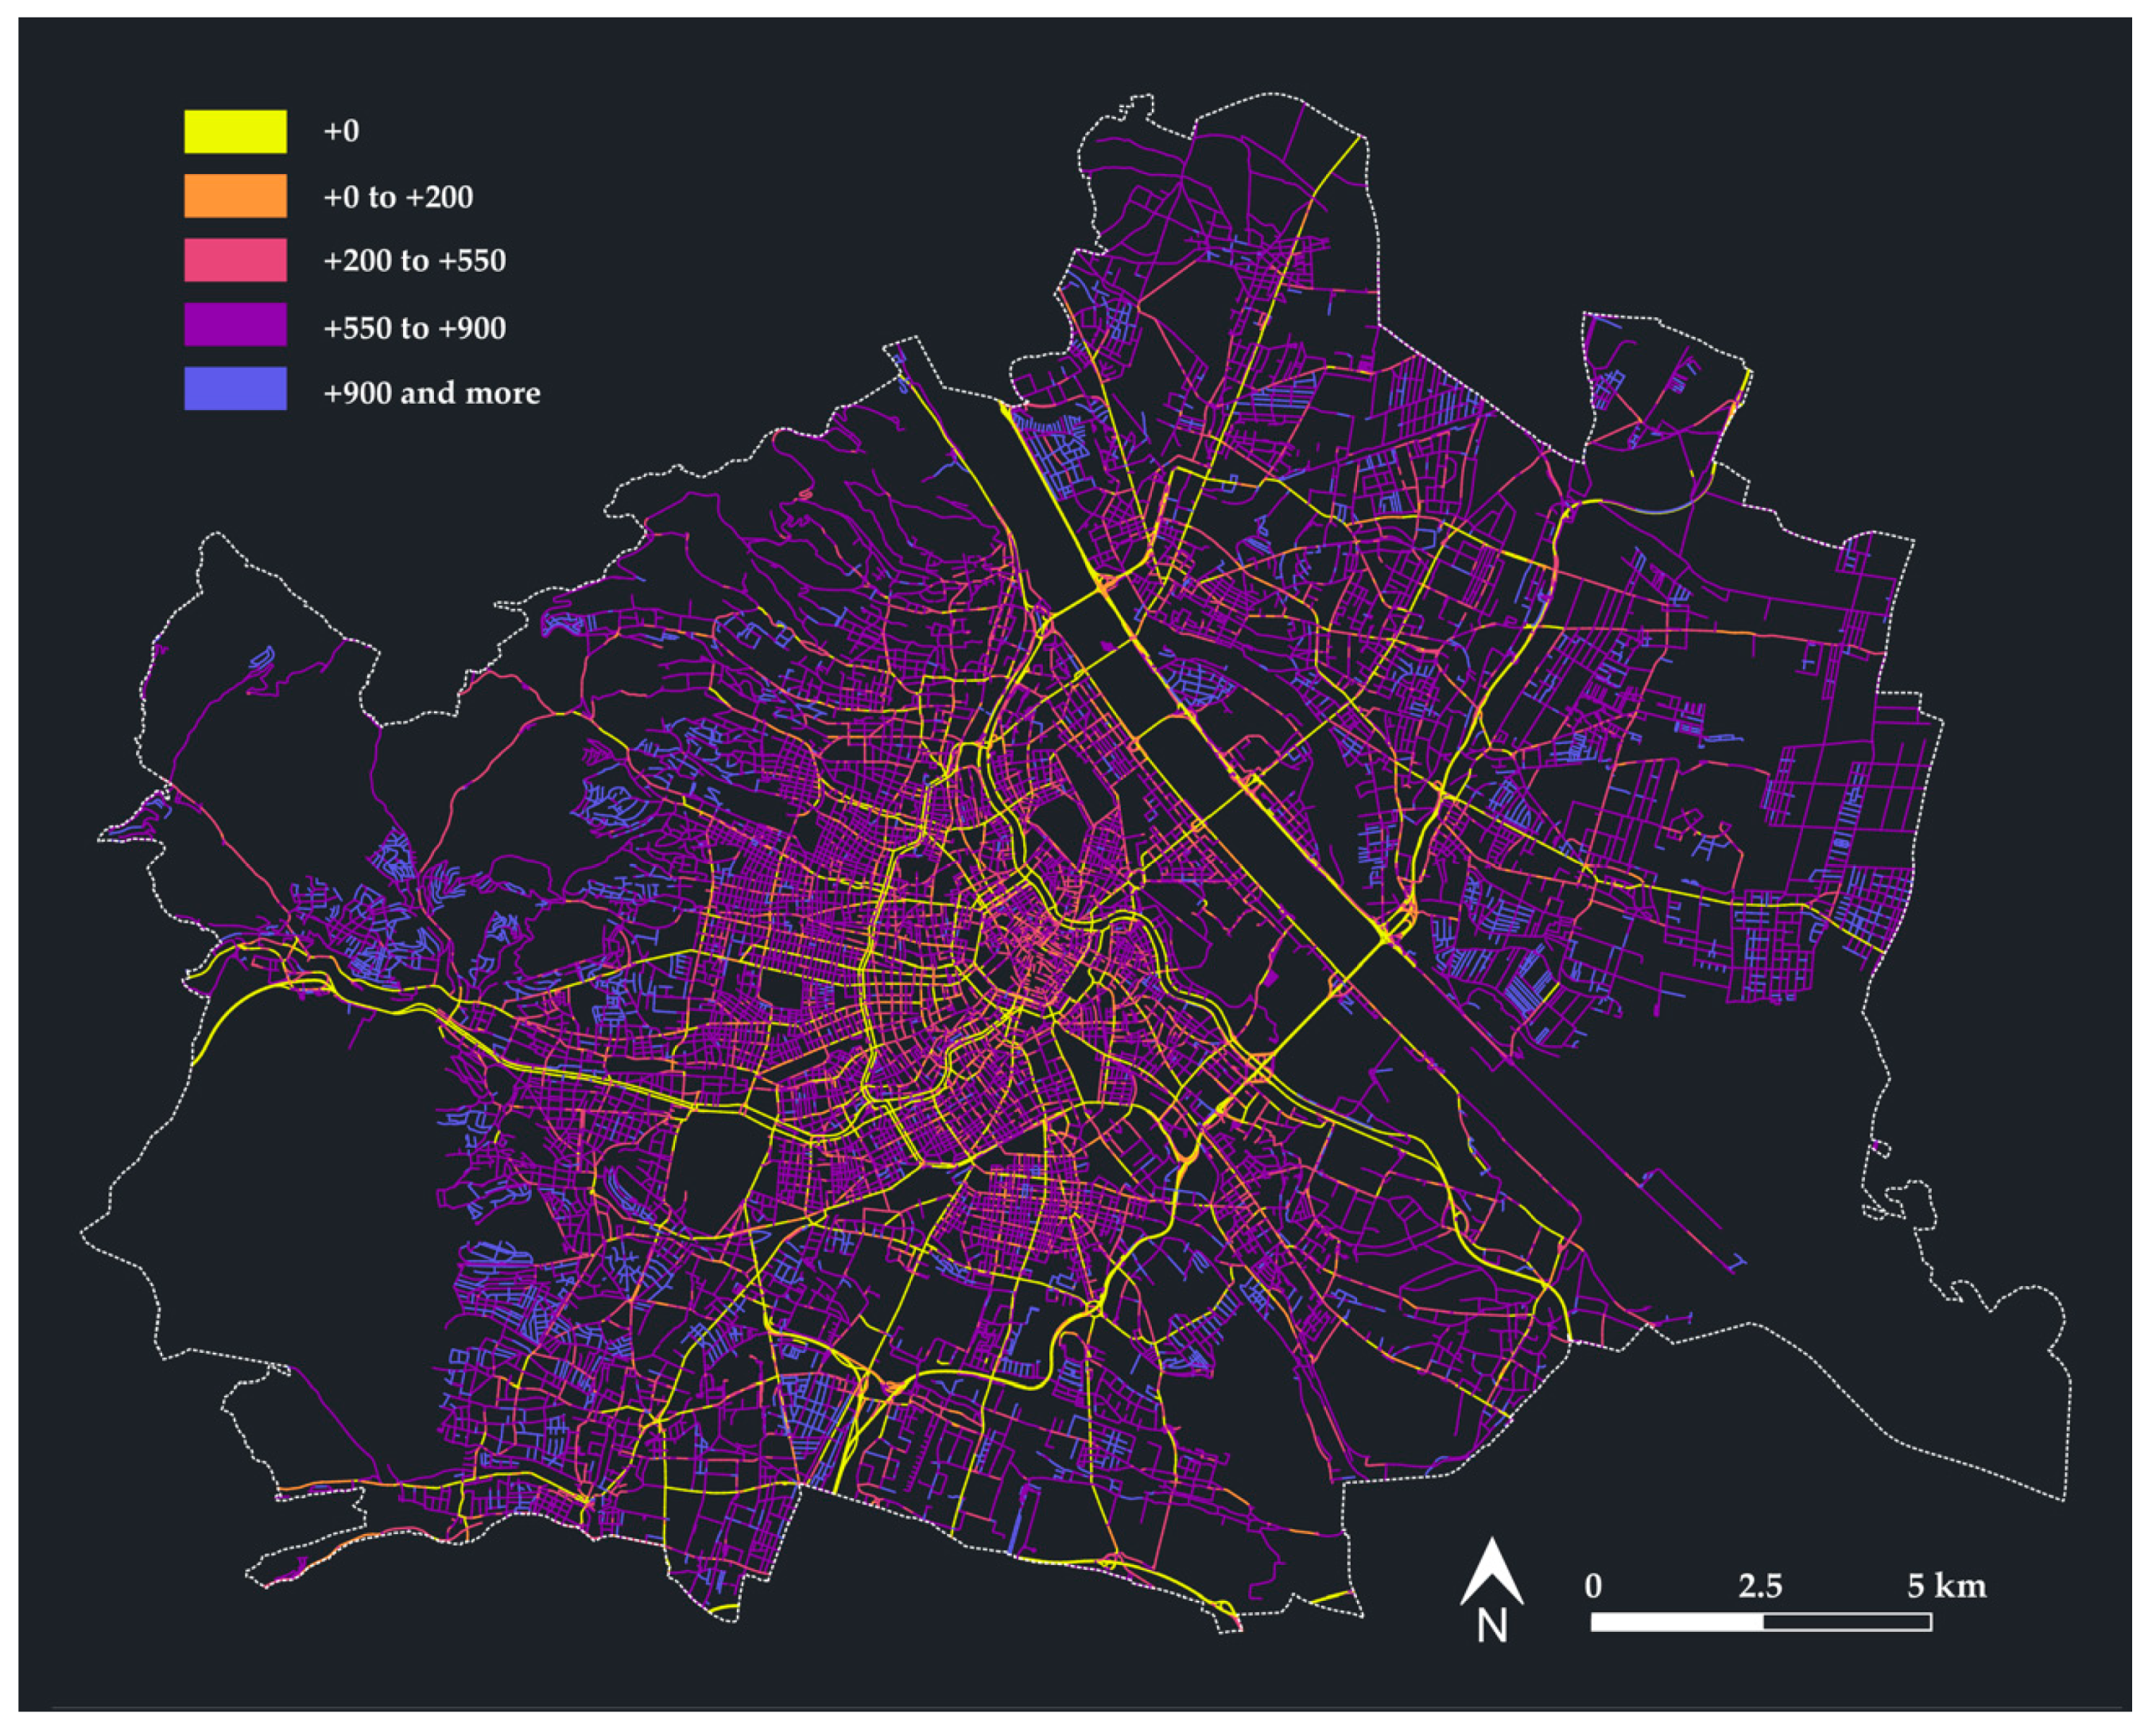
Input data for start points, end points, and times of activities of agents within the simulation, i.e., their daily activities and times, were obtained from mobile phone data, i.e., anonymized motion trajectories from location area updates of mobile phones connecting to radio cells, from the Austrian national mobile phone provider A1. Based on an automated process to detect anonymized movement trajectories from the mobile phone data, a randomized data sample was generated and spatially distributed over the entire analysis area, which formed the basis for the synthetic population used for the simulation. Figure 1 shows the spatial distribution of activities, as well as the number of activities carried out throughout the day, based on the mobile phone data. By using detailed mobile phone data, daily activities, and times were derived, which improved the assessment of AVs’ impact on travel behavior and the mapping of temporal–spatial relationships.
The simulation was modeled for a typical weekday and uses the mobile phone data from a weekday, i.e., Wednesday (representing a typical weekday), in October 2018. The implementation of public transport was based on actual timetables. To reduce calculation time within the simulation, pedestrians and cyclists were not routed based on the existing street network; instead, their travel times and distances were approximated, utilizing Euclidean distance and a detour factor.
The simulation was calibrated based on (a) data from permanently installed traffic counters, i.e., inductions loops and overhead detectors, owned by the city of Vienna and the operator of the Austrian motorways; (b) counting data of public transit passengers from the Vienna public transport authority; and (c) data from the national transport household survey [46].
To model the impacts of AVs on the transport system for the whole city of Vienna, a reference scenario resembling the actual or current mobility within the city and three scenarios with AVs were developed. In the first scenario, SAVs with door-to-door service and in the second scenario, SAVs stopping only at specific stops, i.e., existing bus stops, are implemented as a new means of transport. In the first scenario, agents are picked up by SAVs from one activity location (e.g., home) and brought to the next activity location, while in the second scenario, SAVs transport agents between existing bus stops nearest to their activity locations. Here, the total travel time includes walking time to and from the stop. Within both scenarios, SAVs allow ridesharing, meaning that other agents can get on board or get off from the SAVs along the way. The third scenario focuses on the automation of current private vehicles, i.e., currently existing private vehicles are replaced by private AVs.
It should be mentioned, that the different scenarios—similarly to the scenarios on the transport supply with AVs used in former modeling studies (Section 2)—would strongly need specific policies, e.g., policy changes to incentivize sharing in the case of SAVs, that are not anticipated in the scenarios in detail. Nonetheless, defining specific scenarios and assessing their effects helps to conceptualize the future with AVs and to identify what kind of implementation of AVs and which policies for AVs are necessary in order to reach desirable scenarios [18,47].
To model the SAVs within Scenario 1 (SAVs with door-to-door service) and Scenario 2 (SAVs with a stop-based service) the demand-responsive transport optimization extension for MATSim [48] was used. SAVs are dynamically routed, using an insertion heuristic that aims at minimizing the total taxi workload measured as the total time spent on handling requests [48]. Whenever a new request is submitted, the algorithm searches the routes of all vehicles for optimal insertion. A request from a passenger is accepted if the following criteria are met:
  • The maximum waiting time a customer is willing to wait for departing (i.e., waiting and boarding), which was assumed—based on former studies [42,49]—to be 10 min, is not exceeded.
  • The request can be satisfied within the service hours of the SAVs, i.e., between 04:00 and 24:00 h, and the vehicle time window and capacity of vehicles consisting of 10 seats is not exceeded.
  • The overall time spent on traveling (waiting, boarding and riding) must not exceed the empirically derived time tr with tr = αtrdirect + β, where trdirect is the direct time between the origin and destination of the request, while α and β are used to model the maximum amount of time loss due to waiting, boarding, i.e., pick-up and drop-off, and possible detours). Time for boarding was assumed to be 45 s.
A request can be rejected only immediately after submission. Once scheduled, the request is guaranteed to be served and cannot be rejected later even if there are some delays while driving that lead to violation of the wait and travel time restrictions above [48].
The starting points of the SAVs, i.e., their distribution at the beginning of the service time, were determined through a temporal–spatial clustering that was based on activity end times. For the clustering, the Density-Based Spatial Clustering of Applications with Noise (DBSCAN) algorithm [50] was used with a minimum cluster sample of 100 activities and a maximum distance between activities of 250 m. Based on this activity clustering, starting points and number of SAVs were distributed in such a way that the SAVs cover 15% of the cluster’s demand.
Within Scenario 3 an automation of all current private vehicles was incorporated, i.e., existing private vehicles were assumed to be automated. This included a utility increase of private AVs in MATSim by 25% due to higher comfort and the possibility to use in-vehicle-time. This reflects assumptions on a reduction of the value of time made in former studies, often varying from −20 to −50% [24,51,52], but also corresponds with the results of stated preference surveys on this topic [36,53,54]. Moreover, the capacity of the whole street network was increased by 40% as AVs—especially with a high penetration rate—enable closer gaps between vehicles and increase capacity. This also corresponds with existing studies in which assumptions on an increase of capacity due to AVs mostly vary between 10 and 80% [20,28,55,56,57].

3.3. Measuring the Compatibility of AVs in Street Spaces

The method used to measure the compatibility of AVs with other demands of uses and users in the street space builds on the so-called compensatory approach initially developed in the work of [39] and further developed by [11]. For the analysis of the compatibility of AVs with other usage demands in the street spaces, this compensatory approach was adapted and further developed to account for the specific implications and characteristics of AVs.
The compensatory approach assesses the compatibility based on the traffic volume at peak hour and the specific characteristics of the street space and is structured into three analysis steps [11]: First a rough maximum compatible traffic volume, i.e., number of motor vehicles at peak hour, is defined for individual streets sections, based on the area type, nature and extent of buildings, adjacent uses, and the location’s function and importance. Since this defined maximum traffic volume may vary depending on various influencing factors, it is adapted based on further characteristics of the street space in a second step. In a third step, the adapted maximum traffic volume at peak hour is compared with the actual traffic volume at peak hour in order to assess the compatibility of the actual traffic volume with the other demands within a street section. All of these steps were carried out by using ArcGIS.

3.3.1. Determining the Maximum Compatible Traffic Volume

To determine the maximum compatible traffic volume for an individual street section, the area type, the extent and age of buildings, and the adjacent uses were considered. In principle, and based on the studies of [8,11], areas in the city center, i.e., areas with a high density of buildings, shops and businesses, request a higher demand on the qualities of the street space, i.e., higher needs of pedestrians and cyclists (e.g., residents, employees, customers, etc.) to move, stroll, stay, or sit in these street spaces, than residential areas with predominant detached or semidetached buildings or industrial areas, where the density of buildings, shops and businesses is lower, or these are not even present.
To consider these issues and based on [11,39] five different area categories are distinguished for determining the maximum compatible traffic volume of street spaces:
  • City center/business district: predominant close block development with more than four floors and intensive business use and shops
  • Mixed-use with intensive business use: predominant close block development with more than four floors and medium to intensive business use and shops
  • Mixed-use with medium intensive business use: predominant close block development with more than four floors or half-open buildings with two to four floors and medium intensive business use and shops
  • Low-density residential: predominant detached and semidetached buildings and allotments with only occasional shops or other public-intensive uses
  • Industrial: predominant industrial uses with low demands of residents and no public-intensive uses, such as residential or shopping
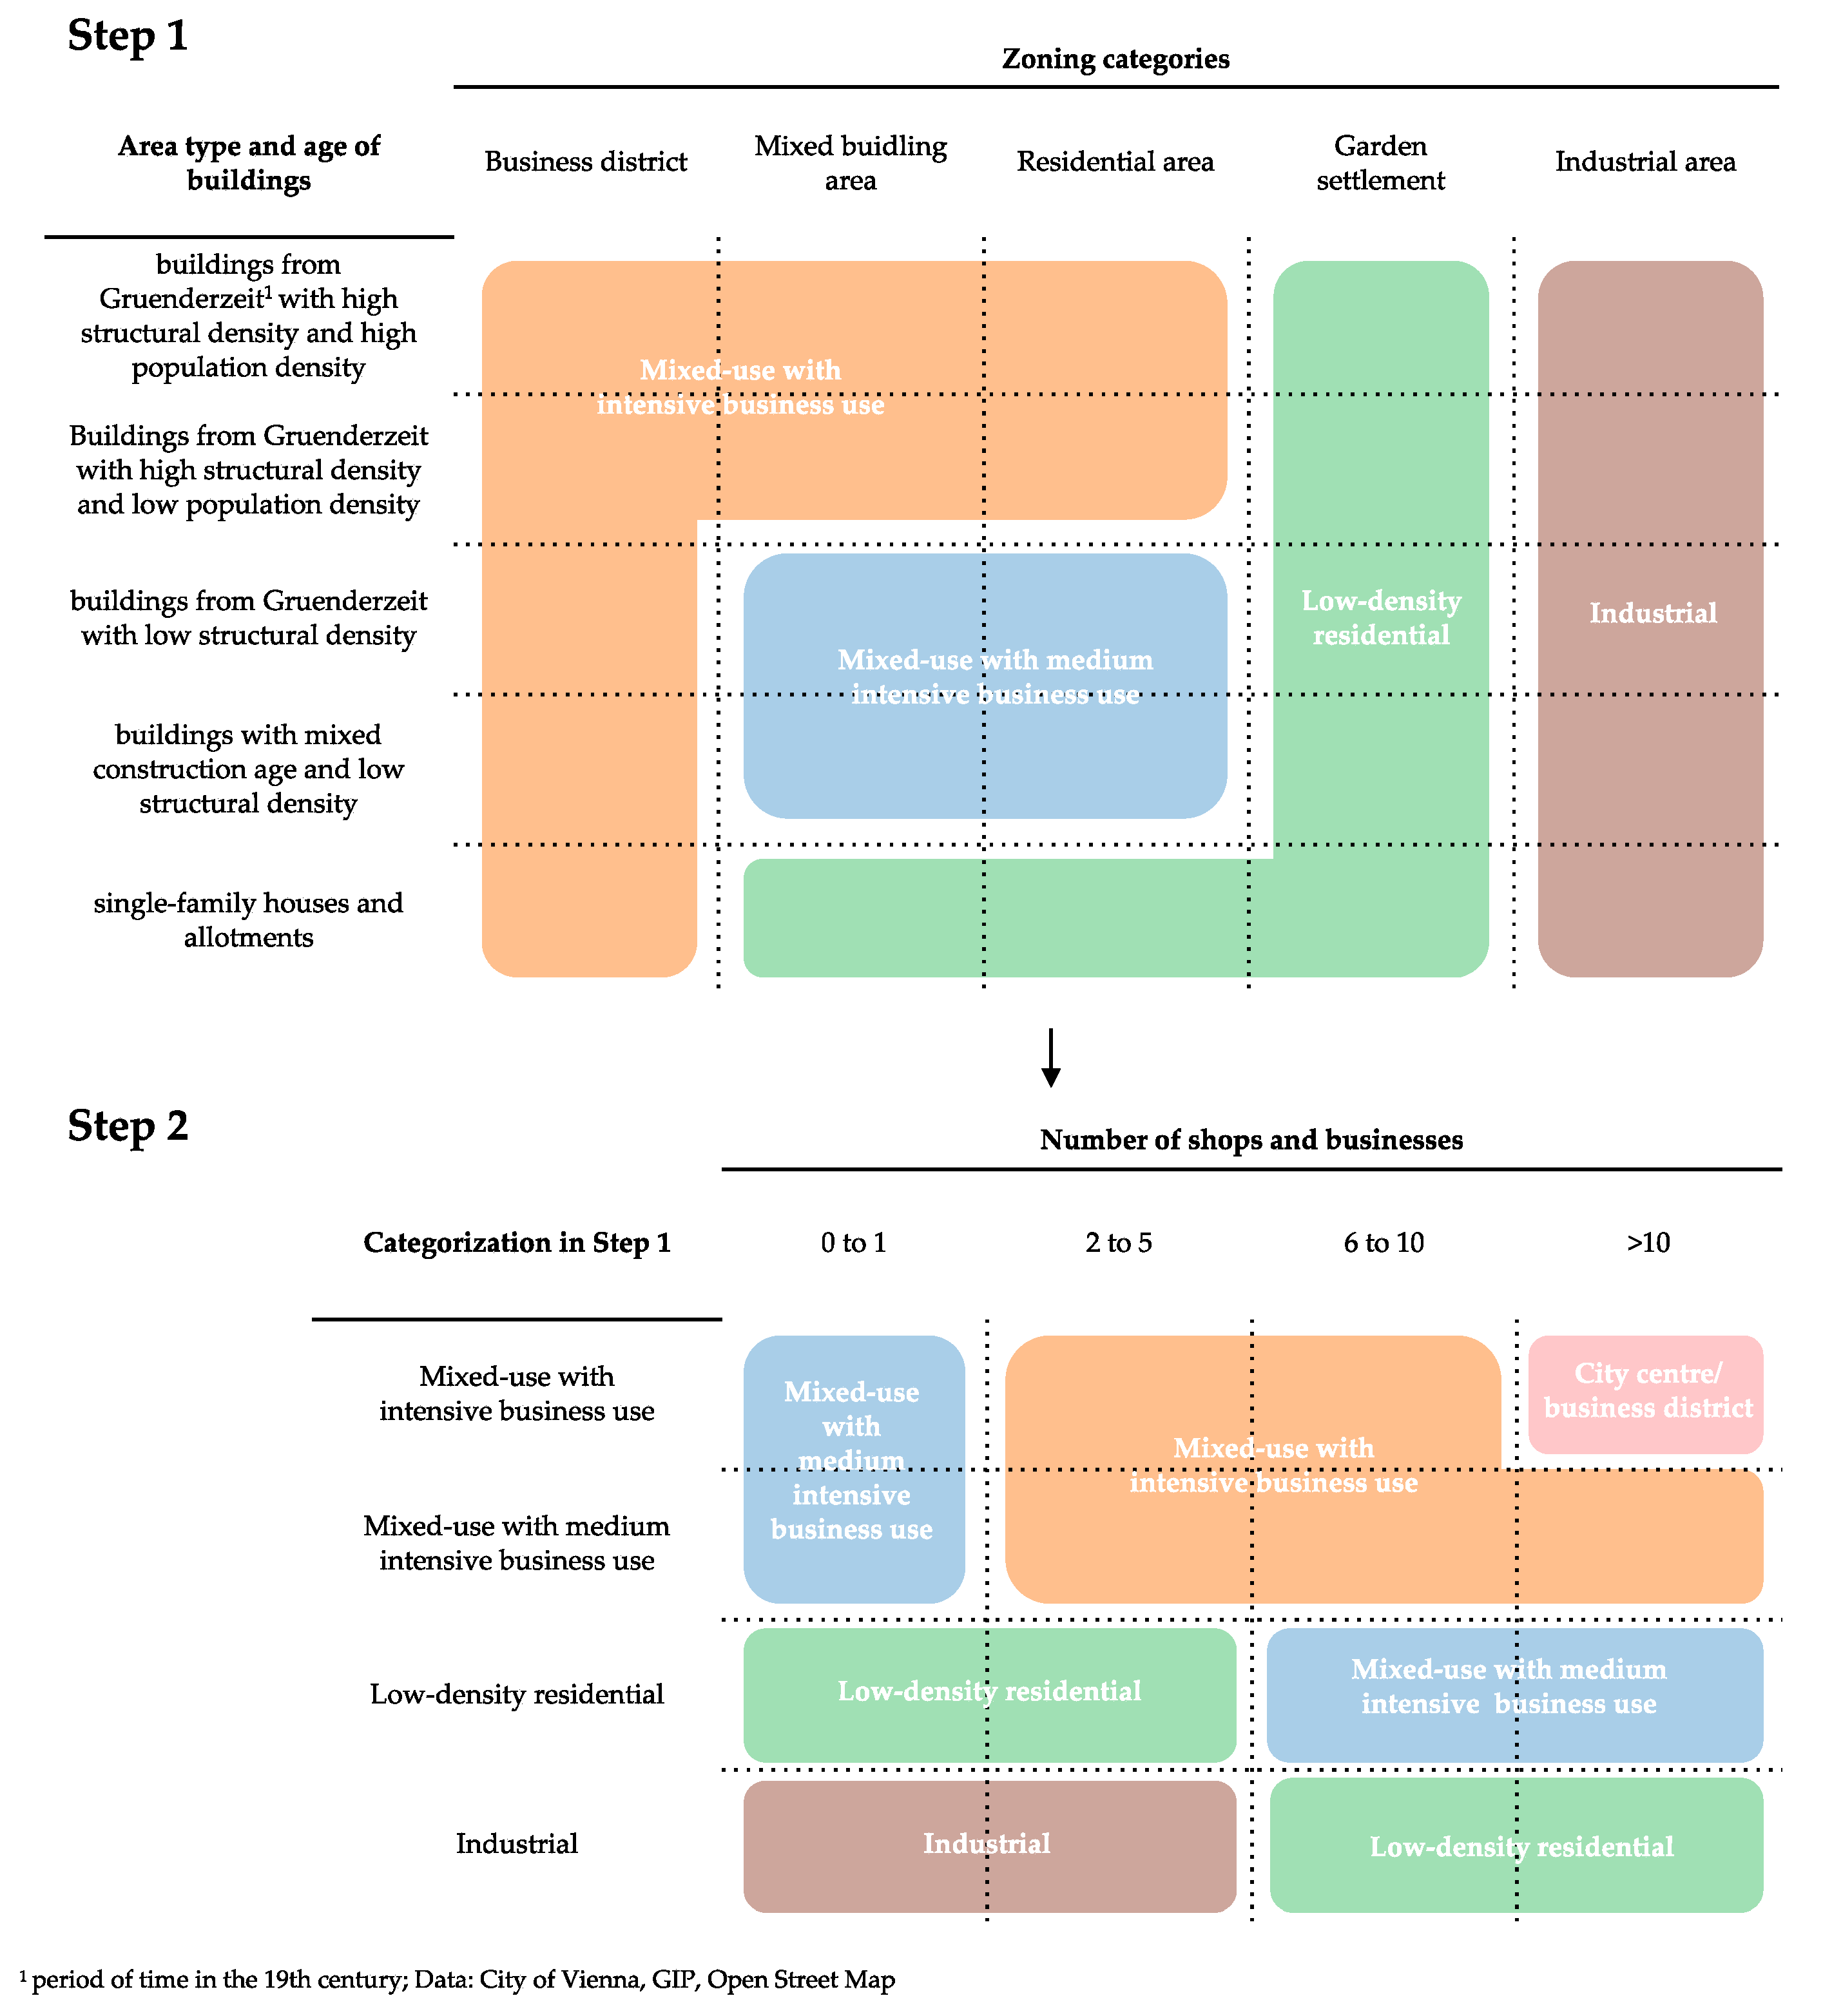
In order to categorize the street sections based on the different area categories, in a first step, data on (a) area types and age of buildings and (b) zoning categories were used. In a second step, also data on the number of shops and businesses were used to categorize the whole street network of Vienna in the different categories (Figure 2). Here, data from the city of Vienna, GIP, and Open Street Map were used. Motorways and expressways were assigned to the last category due to their exclusive traffic function. An overview of the categorization of the street network of Vienna according to the different area categories is presented in Appendix A.
Based on authors [11,39], the following maximum compatible traffic volumes, i.e., motor vehicles at peak hour, have been applied for the different area categories (Table 1).

3.3.2. Adapting the Maximum Compatible Traffic Volume Based on Further Characteristics

The categories distinguished in the first step only form a rough categorization. Within the respective categories, however, the design of the street space and their use by pedestrians and cyclists may differ significantly. Therefore, the applied value of the maximum compatible traffic volume based on the area categories is adapted by considering the criteria (a) distribution of space, (b) use by pedestrians and cyclists, (c) speed, (d) heavy-goods vehicle traffic, (e) crossing needs, (f) green and design elements, and (g) crossability. Here, the criterion crossing needs was considered in addition to the initial compensatory approach of authors [11,39]—which only incorporates the other six criteria—to also account for different existing types and intensities of crossing needs (low/punctual, high/linear) in street spaces.
Based on the logic of the compensatory approach, these criteria serve as compensation aspects because of which the level of the compatible traffic volume with the demands of other uses and users in the street spaces may increase or decrease in the magnitude of +100 to −100 vehicles at peak hour [11,39]. The following section describes how the different criteria, i.e., characteristics of the street space, have been considered. Here, Table 2, Table 3 and Table 4 give an overview of how the criteria were assessed. The assessment of the different criteria for the whole street network of Vienna is presented in Appendix B.

Assessment of Criteria

(a) Distribution of space
The criterion distribution of space evaluates the width of areas dedicated for pedestrians and cyclists, i.e., sidewalks, cycle lanes and green strips, in relation to the area dedicated for motor vehicle traffic, i.e., roadway and area for stationary traffic. Based on [11,12], it assumes that the smaller the ratio between the width of the area for pedestrians and cyclists in the street space in comparison to the width of the area for motorized traffic, the less motor vehicle traffic is tolerated. To calculate the ratio, data from the city of Vienna were used. Since there were no data available on the width of bicycle infrastructure on the roadway, the ratio determined was adapted according to the following: If there is a bicycle street within the street section, the ratio was increased by 20%, if there is a cycle lane on the street section, the ratio was increased by 15%, if there is a multi-purpose lane on the street section, the ratio was increased by 10%, and if cycling against the one-way traffic exists on the street section the ratio was increased by 5%. Finally, for the ratio between the width of the area for pedestrians and cyclists and the width of the area for motor vehicle traffic, the compatibility levels shown in Table 2 were determined.
(b) Use by pedestrians and cyclists
The criterion use by pedestrians and cyclists assumes that motor vehicle traffic disturbs or endangers pedestrians and cyclists in their activities in the street space. Therefore, with an increasing number of pedestrians and cyclists that use the street space, motor vehicle traffic is less compatible [12,39]. Data for the number of pedestrians and cyclists within the street space were derived from a Strava heat map, building on different relational categories of the intensity of use by pedestrians and cyclists, as the actual number of pedestrians and cyclists was not explicitly available from Strava (Table 2).
(c) Speed
The criterion speed evaluates the driven speeds at the street section. Based on [11,12], it assumes that traffic speeds have a decisive influence on the usability of the street by residents and the safety of non-motorized road users (e.g., crossability of the road) and that higher speeds driven at the street section make motor vehicle traffic less compatible. For the evaluation, the respective average driven speed at the street sections for the reference scenario and the three scenarios with AVs in MATSim were calculated and the compatibility levels that are shown in Table 2 were implemented.
(d) Heavy goods vehicle traffic
The criterion heavy-goods vehicle traffic evaluates the share of heavy-goods vehicles (HGV) of the total motor vehicle traffic volume. Based on [11,39], it assumes that HGV traffic, in conjunction with an overall low volume of traffic, is a nuisance for residents, particularly due to noise emissions but also concerning traffic safety. Since data on the share of HGV traffic were not available, the HGV share was derived based on the street category and information on residential streets (traffic-calmed sectors with walking speed) and industrial areas as shown in Table 2.
(e) Crossing needs
The criterion crossing needs specifically evaluates the actual crossing needs at the street section. It assumes that the existence of shops, businesses, or other facilities on both sides of a street, as well as specific places and parks, generate a different intensity of crossing needs. Whereas in shopping streets often high linear crossing needs and at squares, parks and square-like street spaces aerial crossing needs exist, other street spaces only incorporate low punctual crossing needs [12,58]. Based on [12], it is assumed that motor vehicle traffic disturbs the crossing activities and that with increasing intensity of crossing needs, motor vehicle traffic is less compatible. For this criterion, the intensity of crossing needs was derived based on the number of cross-relations between shops, businesses and other facilities, i.e., schools, sport centers, kindergartens, hotels, etc., on both sides of the street section, as well as based on information on shopping streets and squares and (entry points of) parks, based on data from the city of Vienna (Table 2).
(f) Green and design elements
The criterion green and design elements evaluates the design of the street space with green areas and trees or related design elements. Based on [11,12], the assumption is that fewer green areas and trees or related design elements in the street space reduce the quality of stay and therefore less motorized vehicles are compatible. The evaluation is based on the number of design elements, i.e., street furniture, benches, fountains, etc., as well as trees, bushes, or flowers in the street space, and the compatibility levels that are shown in Table 3 were implemented. Data were obtained from the city of Vienna and Open Street Map.
(g) Crossability
The criterion crossability evaluates the number of crossing aids in relation to the length of the street section. Based on [12], it assumes that depending on the previously defined area categories (Section 3.3.1), an appropriate number of crossing aids is necessary to ensure that pedestrians can cross the street easily as possible and without long detours. To obtain the final value for the criterion, the ratio of the number of crossing aids in comparison to the length of the street section is multiplied by 100, whereby, for example, a value of 1.0 means an average distance of 100 m between two crossing aids [12]. Table 4 gives an overview of the respective compatibility levels for each of the predefined area categories. According to [12], it is assumed that pedestrian and encounter zones and residential streets can be crossed everywhere and, therefore, these are well compatible with the needs of the uses and users; for streets with a speed limit of 30 km/h, it is assumed that these can be crossed almost everywhere and that they are, therefore, only just compatible with the needs of the surrounding uses and users. If streets with a speed limit of 30 km/h are additionally equipped with one or more crossing aids, it is assumed that these street sections are compatible with the needs of the surrounding uses and users.

Weighting of Criteria

To adapt the maximum compatible traffic volume based on the different criteria, a weighting of the different criteria (rather than using a simple addition) was applied. In general, such weightings of different criteria are often based on (1) surveys, (2) reviewing the relevance of criteria and weighting in the literature or former studies, or (3) a consultation of decision-makers and experts. We based our weighting on the relevance of the different criteria described in the literature, as well as internal discussions on the importance of the criteria. Current literature especially emphasizes the existence of walking and cycling infrastructure and sufficient space (e.g., width of sidewalks or bike lanes) allocated to pedestrians and cyclists as highly relevant from the perspective of pedestrians and cyclists with regard to the existing motor vehicle traffic—and thus for the assessment of the compatibility of traffic volume with the needs of uses and users within the street space [59,60,61]: In street spaces with only small space allocated to pedestrians and cyclists, considerably less motor vehicle traffic is compatible. Of course, also other criteria like speed, the crossability or the use by pedestrians and cyclists, i.e., the number of pedestrians and cyclists currently using the street space, are important [12,15]. However, an adequate provision of space for pedestrians and cyclists is a key factor. In addition, current claims for a reprioritization of street spaces in favor of transportation modes such as walking and cycling and away from private motorized transport that match the latest calls for a transition to sustainable urban mobility [9,62,63] further prioritize this criterion.
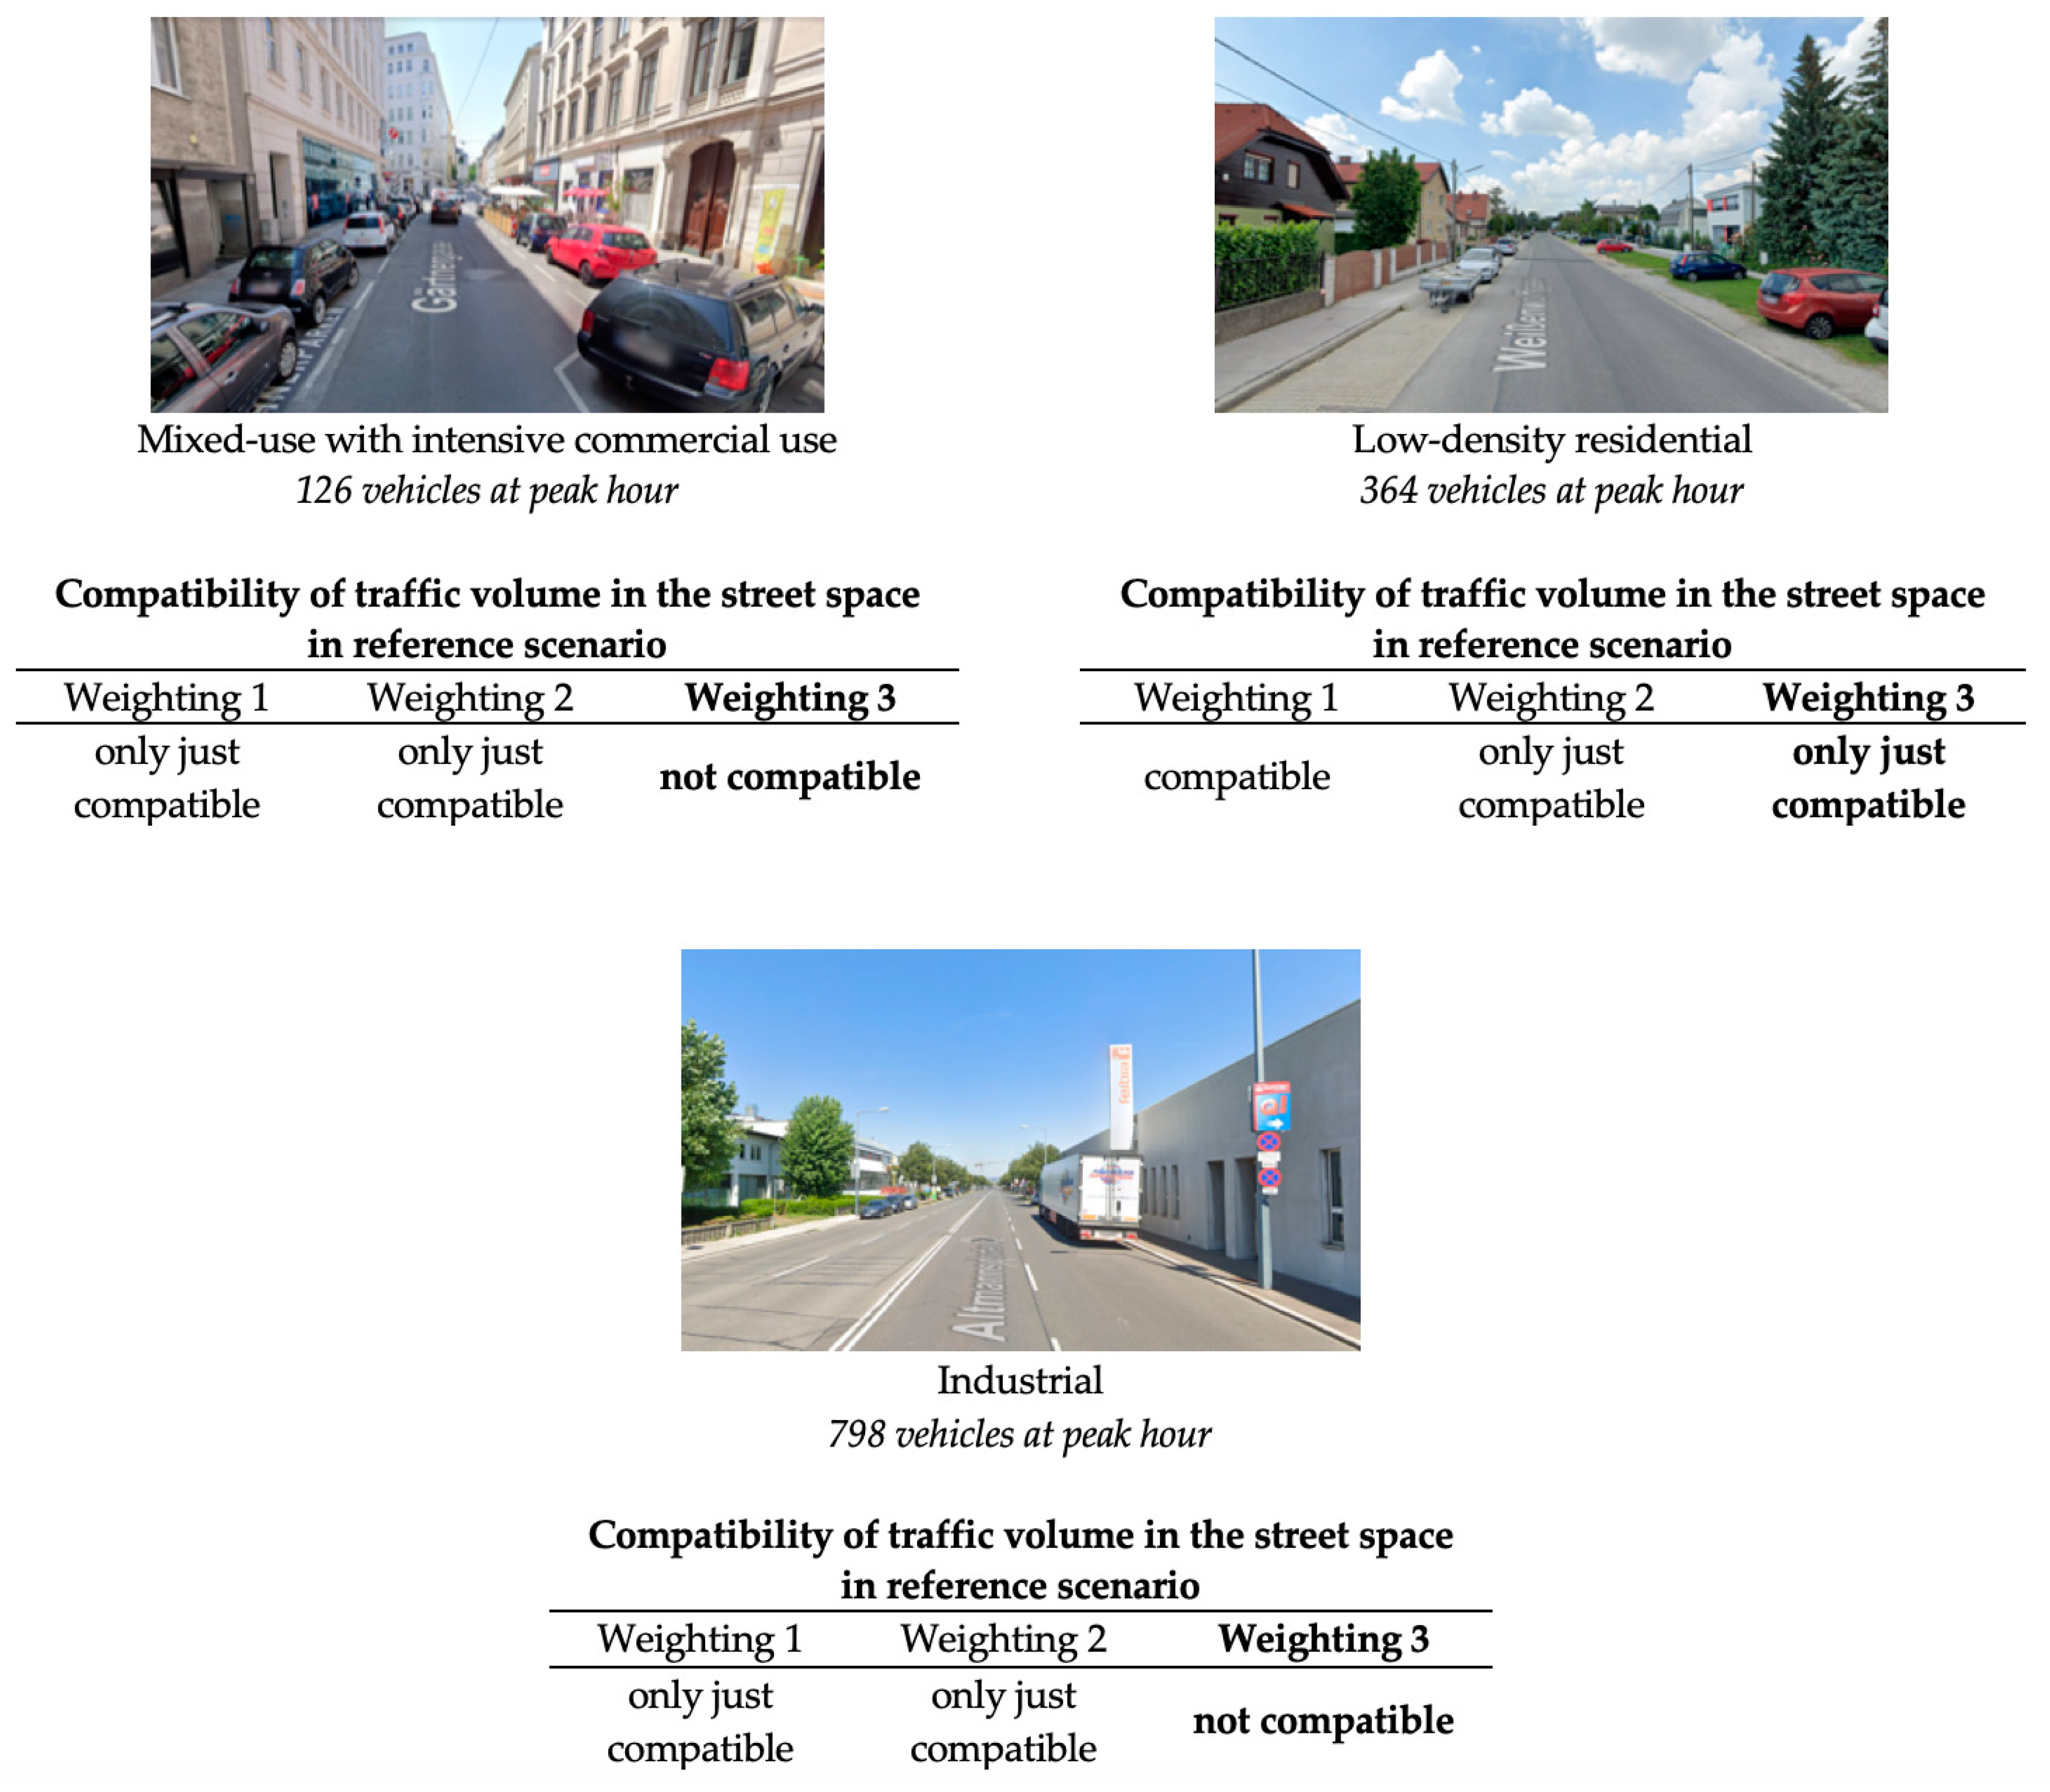
Therefore, a variety of different weights for the criteria have been discussed by using various exemplary images of street spaces in Vienna and comparing the different results regarding the compatibility of the street spaces with the traffic volume in the reference scenario, i.e., comparison of the actual traffic volume in the reference scenario with the different adapted maximum compatible traffic volumes based on the several weightings. Table 5 and Figure 3 give an exemplary overview of this evaluation and exemplary weightings in comparison with equal weighting of criteria. Based on the comparison, the following weighting of criteria was chosen (indicated in bold in Table 5): The criterion distribution of space was weighted highest (weight of 3.5), whereas the weight for the criterion use by pedestrians and cyclists was unchanged and all other criteria were weighted, accordingly, lower. Initially, it was discussed to make the weighting more balanced with only a somewhat higher weight for the criterion distribution of space, leave the criteria use by pedestrians and cyclists, speed, heavy-goods vehicles, and crossability unchanged and apply corresponding lower weights for the criteria green and design elements and crossing needs. However, the comparison of the various weightings for the different street spaces in our view overall showed more plausible results for the weighing described above.

3.3.3. Comparison between Actual Traffic Volume and Adapted Maximum Compatible Traffic Volume

After the maximum compatible traffic volume for the respective street sections was adapted by taking into account the different weighted characteristics, it is compared to the actual traffic volume in the street sections. The comparison was conducted for each of the scenarios that were modeled in MATSim, i.e., the reference scenario and the three scenarios with AVs. Based on that, the compatibility of the traffic volume in the scenarios with the other needs of uses and users at the street space was assessed for the whole street network of Vienna. Table 6 gives an example of how the comparison was conducted.

4. Results

4.1. Street-Level Changes in Traffic Volume at Peak Hour

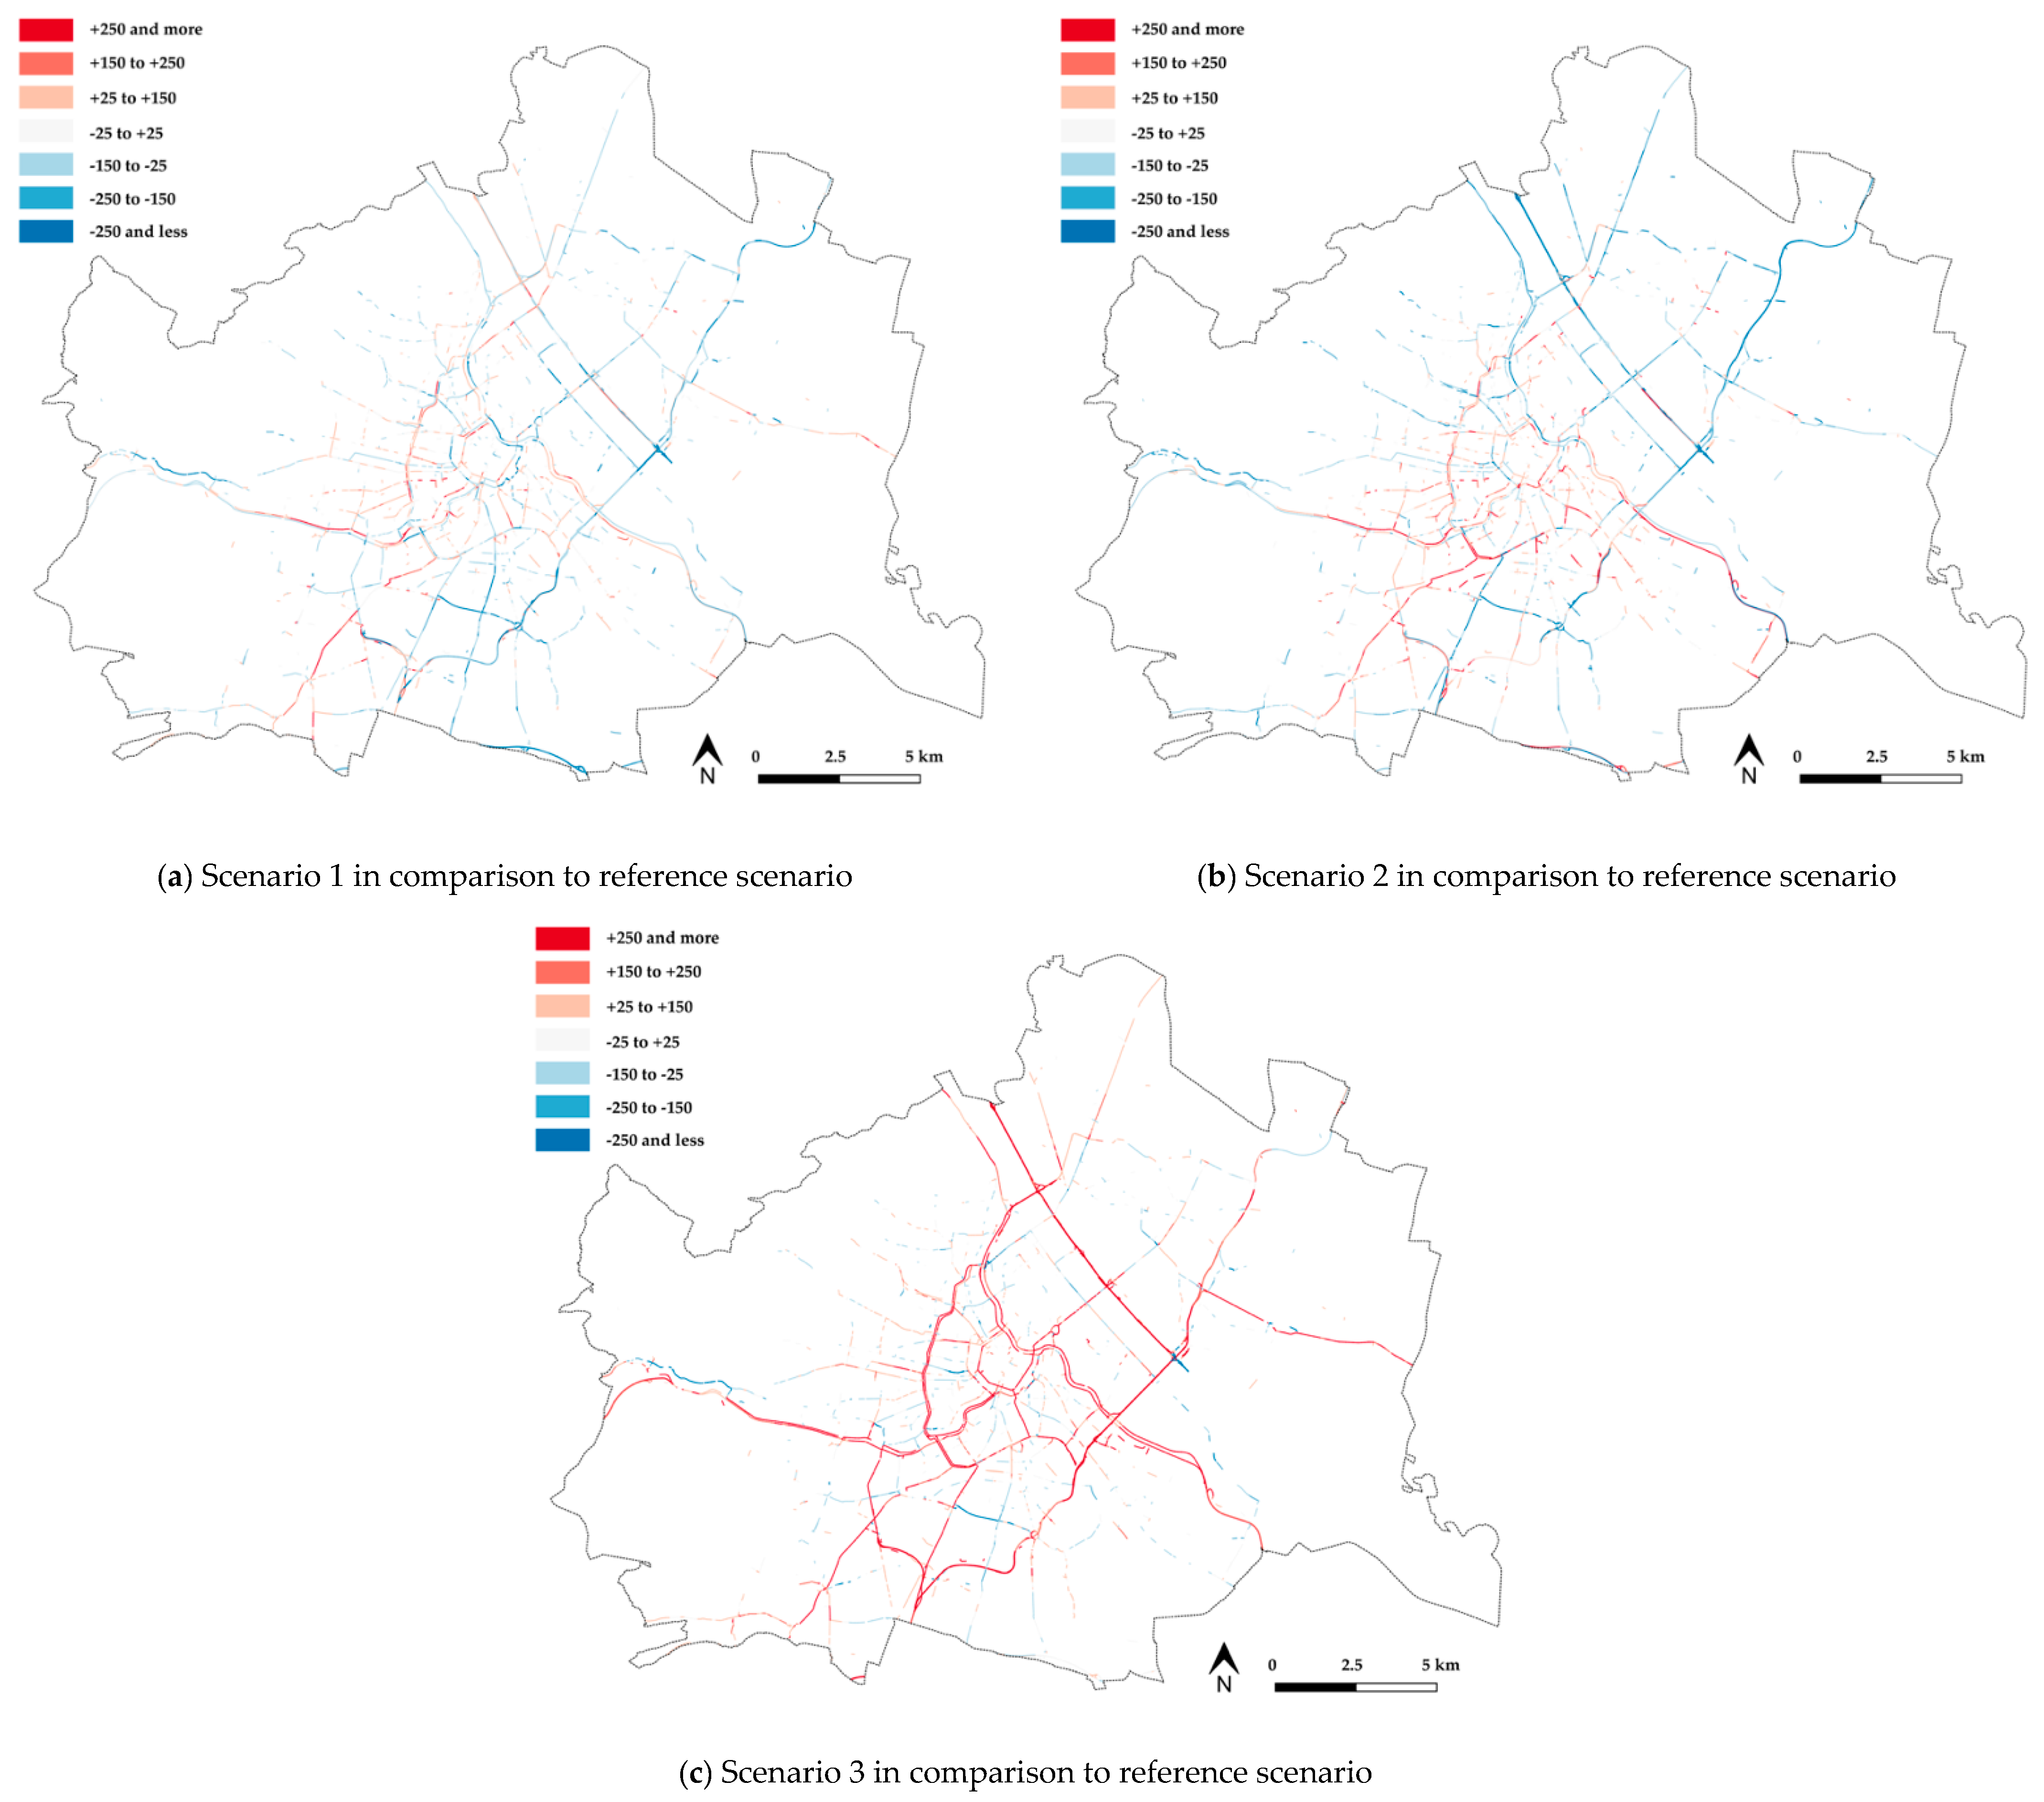
As the approach to assess the compatibility of street spaces with AVs builds on changes in traffic volume at peak hour at street level, Figure 4 shows changes in traffic volume, i.e., changes in the number of vehicles at peak hour, for the entire street network of Vienna for Scenario 1 (SAVs with door-to-door service), Scenario 2 (SAVs with stop-based service) and Scenario 3 (private AVs) in comparison to the reference scenario.
For the scenarios with SAVs, the results show an increase of vehicles at peak hour in the inner parts of the city—especially in the lower-level street network. In Scenario 2, the increase is more intense on specific street sections in the inner parts of the city, while Scenario 1 shows an increase in the number of vehicles at peak hour in more street sections, i.e., on a larger scale and even in outer parts of the city (e.g., in the northwest of the city center). However, for Scenario 2, especially on main roads in the outskirts, e.g., northeast of the Danube river, a decrease in the number of vehicles at peak hour is observable.
In contrast, Scenario 3 shows an increase in the number of vehicles at peak hour, especially for the higher-level street network, i.e., motorways, expressways, primary and secondary roads.

4.2. Assessment of the Compatibility of Street Spaces
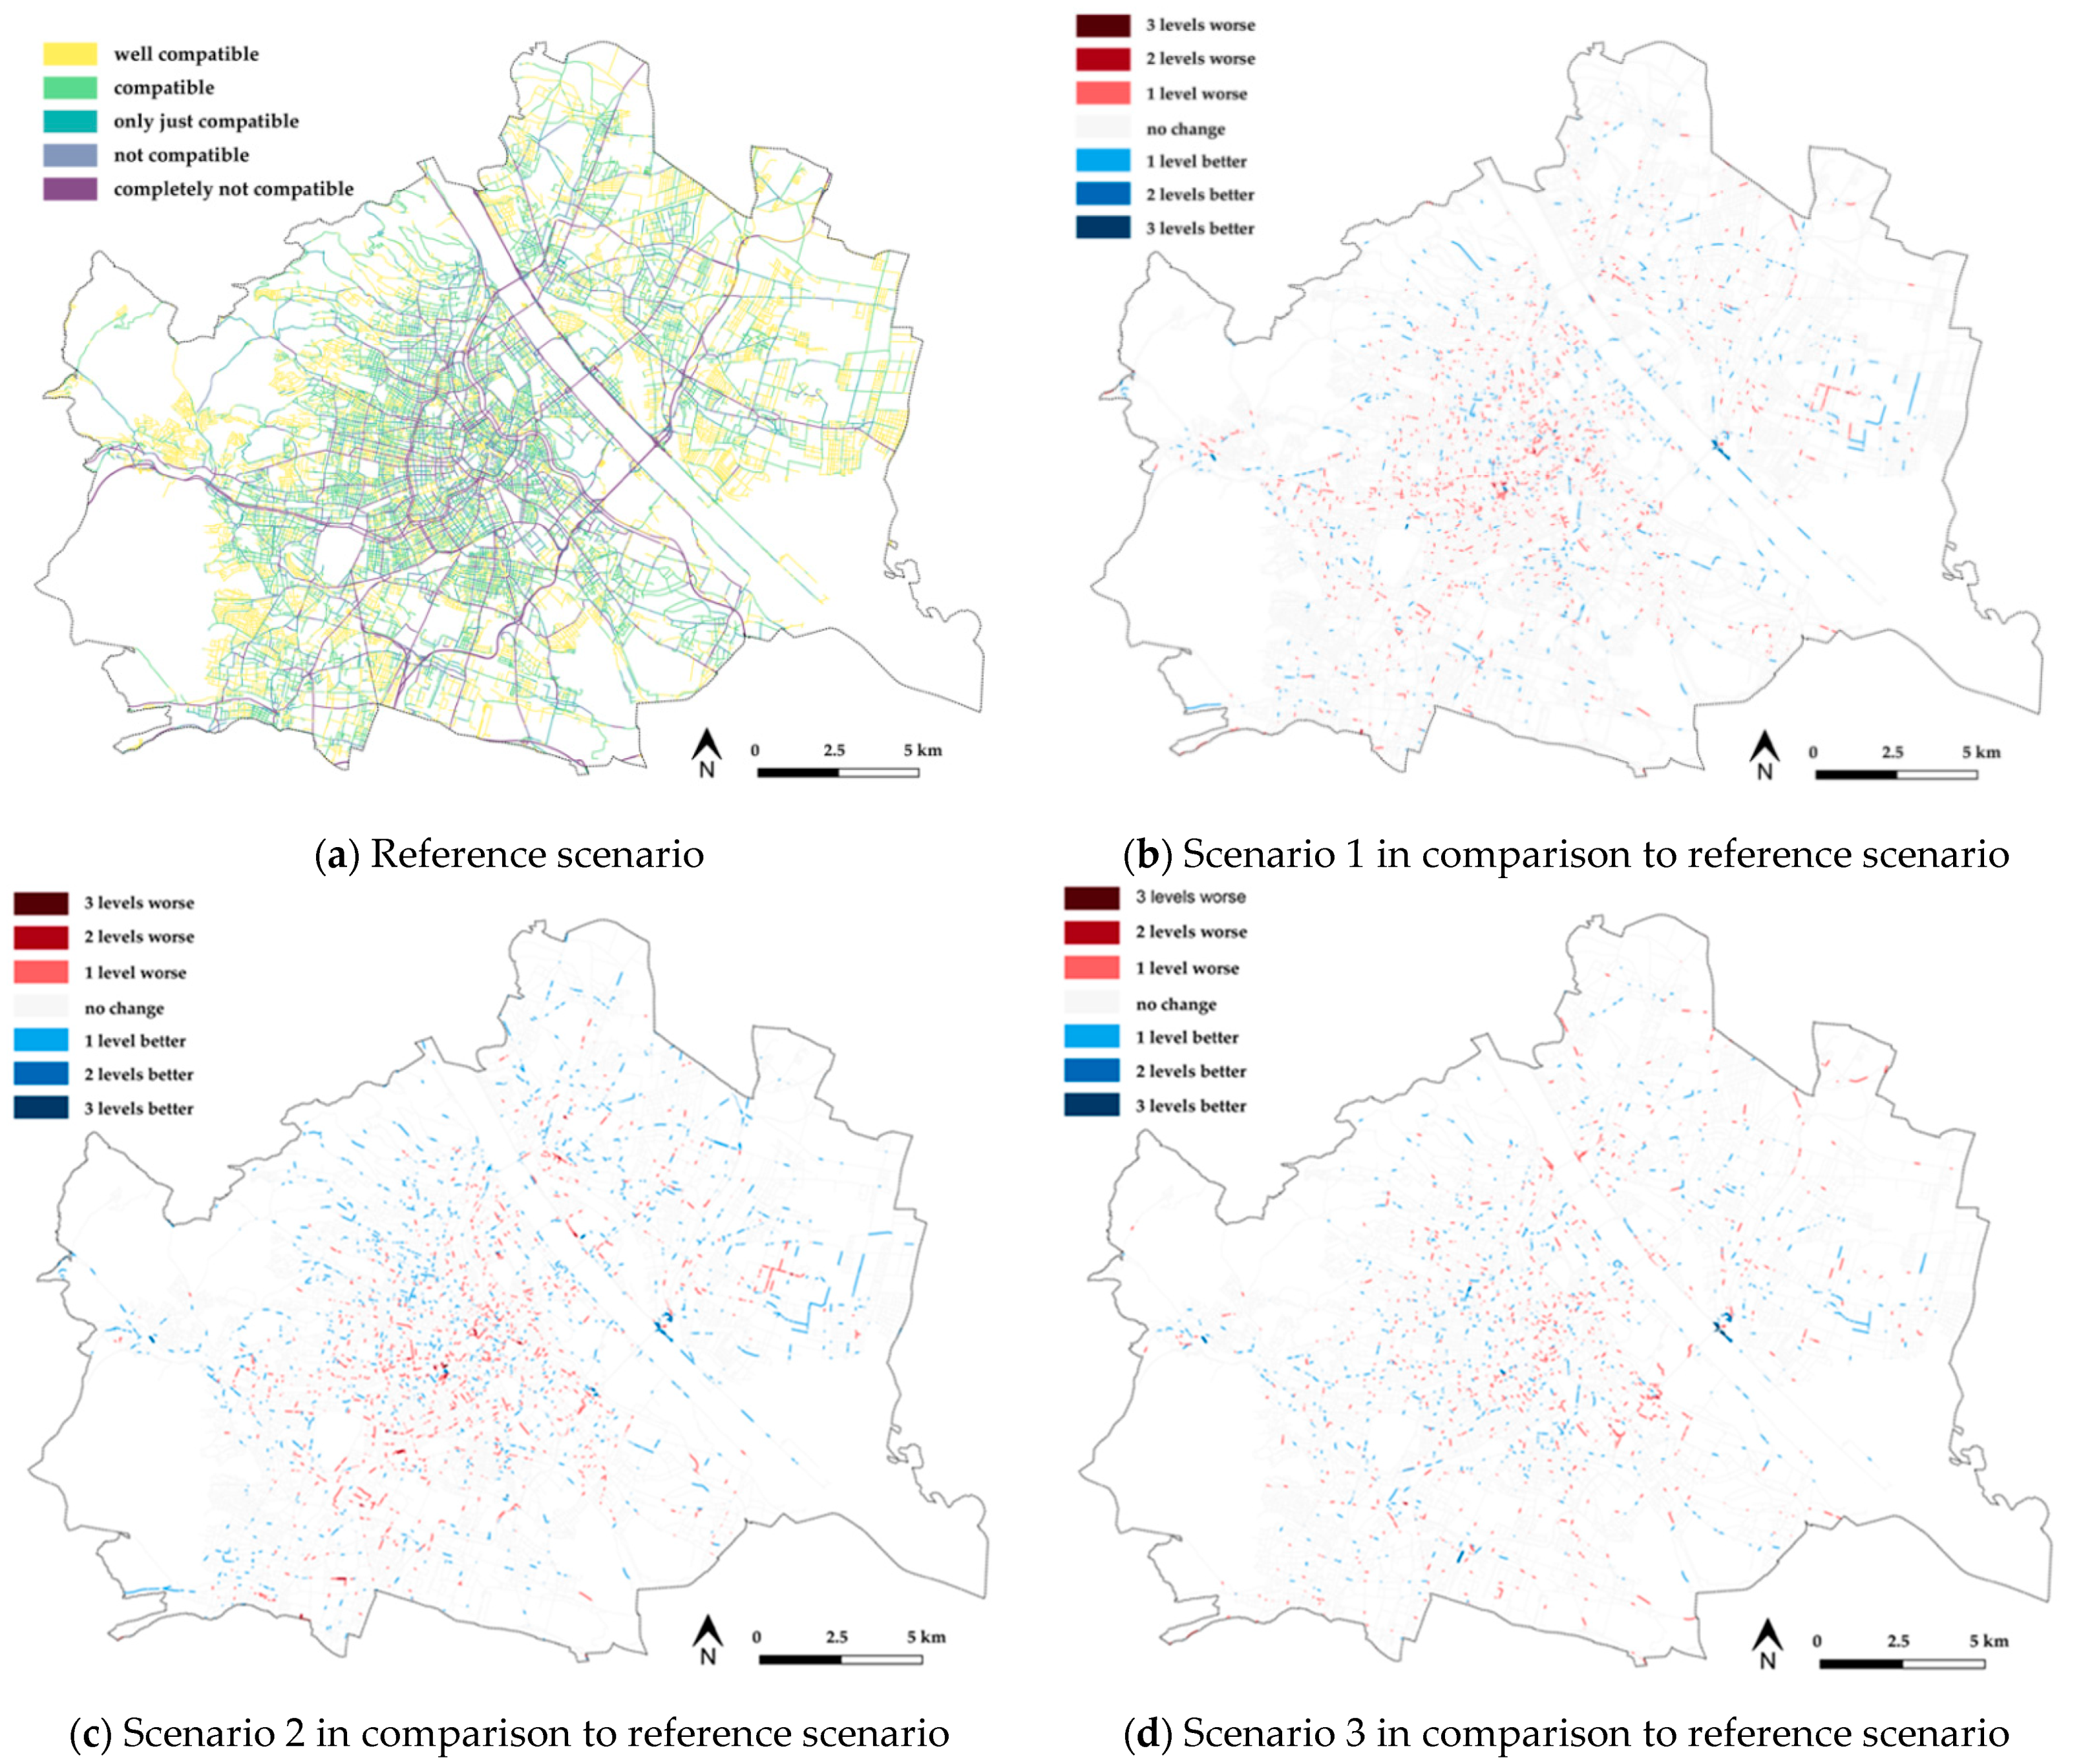
Figure 5 gives an overview of the compatibility assessment of street spaces in the reference scenario without AVs and also shows the changes in the assessment of the compatibility between Scenarios 1 to 3 (Section 3.2) and the reference scenario.
For the reference scenario, it is apparent that the current traffic volume, i.e., number of vehicles at peak hour, is compatible in many of the street spaces in the lower-level street network in Vienna—especially in the outskirts. In the higher-level street network (e.g., main roads) and also in several streets in the lower-level street network in the inner parts of the city, the actual traffic volume is mostly not compatible with the needs of the surrounding uses and users, i.e., pedestrians and cyclists.
Looking at the changes between scenarios with AVs, i.e., Scenarios 1 to 3, in comparison to the reference scenario, in line with the aforementioned changes in traffic volume, it is noticeable that all scenarios with AVs show lower levels of compatibility in comparison to the reference scenario, especially in the inner parts of the city. In these inner parts, the compatibility strongly deteriorates especially in Scenario 2 (SAVs with a stop-based service), but also in Scenario 1 (SAVs with door-to-door service). However, Scenario 2 also shows an improvement in compatibility along streets in the outskirts, e.g., in the north-western and northeastern outskirts, as well as in the southeast. In contrast to Scenarios 1 and 2, Scenario 3 (private AVs) also shows a deterioration in compatibility in comparison to the reference scenario southeast of the city center, as well as in the north near motorways and expressways. In inner parts of the city, the deterioration in compatibility is not as intense as in both scenarios with SAVs.
Figure 5. Overview of the assessment of the compatibility in the reference scenario (a), as well as in Scenario 1 (b), Scenario 2 (c) and Scenario 3 (d) in comparison to the reference scenario. For a more detailed look regarding the change in compatibility between Scenarios 1 to 3 in comparison to the reference scenario, Figure 6 shows changes in traffic volume, i.e., number of vehicles at peak hour, only for those street sections on which traffic volumes were already completely not compatible in the reference scenario.
Sustainability 13 02732 g005
The results for Scenario 1 (SAVs with door-to-door service) and Scenario 2 (SAVs with a stop-based service) show that of the streets which were already completely not compatible before, only those in the central and western part of Vienna experience a high increase in traffic volume, whereas traffic volume for streets in the eastern and southern part (and far western part) of Vienna decreases—to a broader extent in Scenario 2. However, results for Scenario 3 (private AVs) show that traffic volume at peak hour (highly) increases in most of the already completely not compatible streets which leads to an even higher non-compatibility with the needs of uses and other road users in these street sections.

4.3. Sensitivity Analysis

The change in compatibility is not only dependent on the change in traffic volume but also on the applied maximum compatible traffic volume. Therefore, Table 7 shows the share of street sections in different compatibility categories for (a) the actually applied maximum compatible traffic volume at peak hour, (b) a decrease in the applied maximum compatible traffic volume at peak hour by 10%, and (c) an increase in the applied maximum compatible traffic volume at peak hour by 10% for the reference scenario and the Scenarios 1 to 3.
It is shown that decreasing the applied maximum compatible traffic volume at peak hour (in the different area categories) by 10% increases the share of street spaces in which the traffic volume is completely not compatible in comparison to the actually applied maximum compatible traffic volume at peak hour for the reference scenario and Scenarios 1 to 3. However, when increasing the applied maximum compatible traffic volume at peak hour by 10%, an increase in the share of street spaces with compatible and also well compatible traffic volumes is shown in comparison to the actual applied maximum traffic volume at peak hour for the reference scenario and the Scenarios 1 to 3.
On the other hand, when looking at the share of street sections in different compatibility categories for the reference scenario in comparison to Scenarios 1 to 3, for all the different applied maximum compatible traffic volumes at peak hour, the same directions are shown:
  • For Scenario 1 (SAVs with door-to-door service), the share of street spaces with well compatible and compatible traffic volumes decreases in comparison to the reference scenario, while the share of street spaces with only just compatible traffic volumes increases, indicating a shift from street spaces with well compatible and compatible traffic volumes to such with only just compatible traffic. However, on the other hand, the share of street spaces with completely not compatible traffic volumes also decreases in comparison to the reference scenario, indicating likewise an improvement in compatibility.
  • Similarly, for Scenario 2 (SAVs with a stop-based service) also mixed effects are shown: On the one hand, an increase in the share of street sections with well compatible traffic volumes, in comparison to the reference scenario, is shown, indicating an improvement in compatibility. On the other hand, a decrease in the share of street spaces with compatible and only just compatible traffic volumes is shown, while the share of street spaces with not compatible traffic volumes increases and the share of street spaces with completely not compatible traffic volumes mainly remains the same, indicating also a deterioration of compatibility for some street sections.
  • For Scenario 3 (private AVs), however, the share of street spaces with well compatible traffic volumes decreases (and the share of street spaces with (only just) compatible traffic increases), while also the share of street spaces with completely not compatible traffic volumes increases (and the share of street spaces with not compatible traffic decreases)—indicating both a shift of street spaces with well compatible traffic volumes to street spaces with compatible traffic and a shift from street spaces with not compatible traffic volumes to street spaces with completely not compatible traffic, i.e., an overall decrease in compatibility.

4.4. Sensibility of the Compatibility with Increased Traffic in Street Spaces and Interlinking with the Technical–Infrastructural Suitability of Street Spaces for AVs

For further investigation, Figure 7 shows the sensibility of the compatibility with additional traffic in street spaces, i.e., the possible increase in the number of vehicles at peak hour before traffic volumes become completely not compatible.
It is observable that traffic volumes in the higher-level street network—especially main roads in the city center—are already completely not compatible and therefore, any increase in vehicles would further increase non-compatibility. Moreover, also for streets in the lower-level street network in the inner parts of the city, only a minor traffic increase would be possible as these street sections already have a high traffic volume in comparison to the needs of surrounding uses and users. However, some areas in the outskirts seem less sensible to additional traffic, i.e., higher levels of additional traffic would be possible before compatibility would decrease, since current traffic volume in these street sections is very low and the needs of surrounding uses and users are lower than in the inner parts of the city.
Besides the compatibility of AVs within street spaces or the sensibility of the compatibility in street spaces to additional traffic due to AVs, also the existing conditions and configurations of street spaces are important in order to assess whether the implementation of AVs may be suitable. The latter could lead to a different complexity for the functional operation of Automated Driving Systems (ADSs) and thus differentiate regarding their technical–infrastructural suitability for AVs. Soteropoulos et al. [64] developed an index to assess the technical–infrastructural suitability of street spaces for the functional operation of AVs, i.e., the automated drivability, and applied this concept by using the case study of the city of Vienna. Overlapping both this assessment of the automated drivability, as well as the assessment on the sensibility of the compatibility in street spaces, with regard to additional traffic at peak hour (Figure 7), street sections can be observed where (1) AVs could be deployed without (major) adjustments and relatively soon from a technical–infrastructural perspective and, likewise, (2) an expected increase in traffic volume due to AVs would be less problematic regarding the needs of surrounding uses and users, i.e., pedestrians and cyclists.
Figure 8 shows the overlap of these assessments for the whole street network of Vienna. It is well noticeable that most streets in the city center, i.e., in particular main roads (with high speeds and adjacent business use) but also streets in the lower-level street network, (shown in pink) have a low automated drivability and likewise permit only a low increase of additional vehicles until they become completely not compatible. However, some street sections in the outskirts (shown in dark green) are also characterized by a higher automated drivability and likewise permit an increase of vehicles before they become completely not compatible, i.e., in particular streets in industrial areas with low speeds and a low number of pedestrians and cyclists.

5. Discussion

The implementation of AVs will be a relevant topic for cities, transport, and city planning in the near future. The results presented in this paper are a first investigation of the extent to which the implementation and use of AVs and related changes in traffic volume are compatible with the needs of pedestrians and cyclists within different street spaces. Such an assessment could help cities to implement AVs in a more sustainable way also considering the needs of pedestrians and cyclists and recognizing not only the traffic function of street spaces but also their function as spaces for people to meet, stay, sit, or play.
The results for the city of Vienna show that changes in traffic volume, i.e., number of vehicles at peak hour, with AVs are unevenly distributed in all scenarios investigated. Putting these changes in traffic volume at peak hour in relation to the different characteristics of street spaces, i.e., land use along the street (surrounding uses) and the needs of users within these street spaces, to assess the compatibility of AVs, further showed diverse results.
For SAVs, increases in traffic volume are observable especially in street sections (in the lower-level street network) in inner parts of the city. These results correspond very much with the results of References [22,27] who also report an increase in traffic volume due to SAVs with ridesharing especially in the lower-level street network in inner-city areas.
Based on the compatibility assessment of these increases in traffic volume with the needs of uses and users in inner-city streets spaces, this also leads to a (strong) deterioration of compatibility due to a high sensibility regarding additional traffic in these street spaces, as it competes with numerous other uses: Especially in areas with intensive business use, there is a wider range of usage demands, due to pedestrian and bicycle traffic, cross-traffic, restaurants, and leisure activities of neighboring residents within the street spaces. Here, for SAVs with a stop-based service, several streets in inner parts experienced a higher increase in traffic volume, also leading to stronger deterioration in compatibility, in comparison to SAVs with door-to-door service.
However, while for SAVs with a door-to-door service increases in traffic volume are observable also in some of the outer parts of the city of Vienna, SAVs with a stop-based service could also reduce traffic volume at peak hour in some streets—especially at main roads—in the outskirts. This also corresponds very much with the results of References [22,27] that both indicate a reduction in traffic volume for SAVs with ridesharing, especially on main roads. However, both studies report these effects for SAVs with door-to-door service.
These decreases in traffic volume on main roads—according to the compatibility assessment—also lead to improvements in compatibility, i.e., reducing the separating effects of such streets.
In the scenario with SAVs with a stop-based service, passengers can only get on and off at existing bus stops and therefore increases in traffic volume are bundled. Especially in inner parts of the city where the density of bus stops is very high and no long walks to use the SAVs have to be done. Here, high increases in traffic volume are bundled at street sections near bus stops which in addition to high usage demands also lead to a stronger deterioration in compatibility. On the other hand, such a service seems to be an alternative to private cars in the outskirts but still, it bundles more users at specific stops and therefore could reduce traffic volume especially on main roads in the outskirts to an extent that could also improve the compatibility of such streets.
In contrast, SAVs with a door-to-door service also lead to an increased traffic volume in some areas in the outskirts, as SAVs with a door to door service seem to be more convenient than SAVs stopping only at existing bus stops in these areas. After all, bus stops are less dense in these areas and longer walks would be necessary in order to use SAVs. Therefore, SAVs with a door-to-door service are used in these areas, instead of public transport vehicles or to access public transport stops, e.g., subway stations, instead of walking to them. However, the overall increases in traffic volume in street spaces in the outskirts (that at the same time are characterized by lower usage demands), but especially in inner parts are more distributed over the street network. Therefore, they are not so intense for specific street sections (in comparison to a more bundled increase in traffic volume for SAVs with a stop-based service), leading to a less intense deterioration of compatibility.
Results for private AVs, for which changes in traffic volumes at the street level have not been investigated in detail in former studies, show increases in traffic volume at peak hour mostly on streets that were already not compatible in the reference scenario. This leads to an even higher non-compatibility with demands of other road users in these street sections. Here, it seems that the increase in the overall capacity of the street network by 40% and the increase in utility by 25% of AVs leads to the circumstance that more people are using AVs and that these are used especially in the higher-level street network as speeds are innately higher as in the lower-level street network and the increase in capacity heightens average speeds (and reduces congestion) and the reliability of higher speeds for more vehicles. Therefore, especially higher-ranked streets which were already a barrier in the city become an even stronger barrier.
When taking into account not only the compatibility of street spaces but also the technical–infrastructural suitability of AVs, it is shown that especially areas in the outskirts such as industrial areas or low-density residential areas seem to have a low sensibility for further traffic (as the number of vehicles in these street sections are very low and also the needs of surrounding uses and users are lower than in some of the inner parts of the city) and are also more suitable from a technical–infrastructural view. Given the results of the different scenarios with AVs, in particular at these street sections or in these areas a dedicated implementation of AVs, especially as a stop-based SAV service, could be interesting for cities.
However, although the assessment of the compatibility, using the compensatory approach, gives first insights, the assessment is only a coarse investigation of the compatibility of AVs in different street spaces and has several limitations.
The applied compensatory approach gives a height weight to the factor of traffic volume at peak hour which is a relevant factor and through which the density of (and gaps between) vehicles can be indirectly taken into account. Thus, a coarse assessment regarding the compatibility of AVs in street spaces can be made with the help of this approach. However, other aspects of AVs within the streets spaces, e.g., stopping SAVs at street spaces for picking up or dropping off passengers, that could further increase the separating or barrier effect of the streets, i.e., decreasing the permeability of the street spaces, or specific aspects of traffic flow and impacts on pedestrians and cyclists have to be investigated on a more detailed level, for example, by using microscopic traffic flow simulation (e.g., Verkehr In Städten—SIMulationsmodell (VISSIM)) in specific streets (in addition to MATSim), to have a more detailed analysis on the impact of AVs on the barrier effect.
Moreover, although values of the maximum compatible traffic volume were derived from the literature, and also a sensitivity analysis was conducted, clearly results on the compatibility heavily rely on the values of the maximum compatible traffic volume and the defined area categories. Furthermore, the adaptation of these values, using different characteristics, as well as their weighting, plays an important role. Although all of these aspects rely on existing literature and were also discussed with stakeholders from the city of Vienna regarding plausibility, more emphasis has to be put on these issues and they need to be investigated further. This also includes a consideration of linkages between the different specific characteristics of the street space, e.g., speed and crossability, and a more specific differentiation between different areas categories and street spaces or taking into account further empirical findings on the perception of the characteristics in their weighting [65]. Moreover, some of the data needed for the approach were not available in a detailed enough manner, e.g., data on the number of pedestrians and cyclists or also micro-mobility users and the share of HGV traffic (e.g., from transportation models or micro-mobility providers) were not available; instead, an approximation of data for the specific characteristics of the street space was used.
Beyond that, it should also be mentioned that the different scenarios that built the basis for the modeling and the assessment of the compatibility could only show coarse directions of impacts with AVs for a longer time horizon as they assume an operation of AVs in the whole city of Vienna. Moreover, they would also incorporate specific policies resulting in such scenarios that were not anticipated for the modeling in detail. As described before (when mentioning the technological–infrastructural suitability of street spaces for AVs) and by taking into account latest developments, it becomes clear that AVs will likely roll out in waves or only in specific areas in the near future and the mentioned changes in traffic volume will initially occur in these areas [64,66]. However, to put the implementation of this rollout into some kind of a strategy from the viewpoint of cities, an understanding of possible changes in traffic volume with regard to different scenarios and their respective assumptions but also considering how this impairs the needs of other roads users in the street space is important to conceptualize the future with AVs [18,47]. Not least in order to identify or set policies to accompany the implementation of AVs in certain areas that would prevent undesirable effects, i.e., impairing the needs of pedestrians and cyclists, from a city perspective.
Lastly, of course, the travel patterns and activities used as input data for the simulation could also change in the future, as especially the COVID-19 pandemic fostered developments regarding working from home, i.e., fewer trips to work, and has also negatively affected public transit usage and ridesharing. For public transport and ridesharing, it might take some time to reach the same levels of usage as before the pandemic [67,68].
All of these aspects, but also other future developments, have to be taken into account when putting the results into context, as these might affect the validity of the modeling results.

6. Conclusions and Recommendations for Further Research

This paper investigated to what extent the implementation and use of AVs are compatible with the needs of surrounding uses and users, i.e., pedestrians and cyclists, in street spaces. Based on different scenarios with AVs in MATSim and the associated changes in traffic volume, i.e., number of vehicles at peak hour, and considering the different characteristics of streets and respective user demands, compatibility in different street spaces was assessed for the whole street network of Vienna.
For SAVs, results indicate a deterioration in compatibility especially in inner-city dense areas because of an increase in traffic volume and an already high amount of competing uses. In contrast, especially (on main roads) in the outskirts improvements in compatibility are observable. This particularly applies to SAVs with a stop-based service, while for SAVs with a door-to-door service this effect is only observable to a lower extent. However, private AVs interlinked with an overall capacity increase would lead to a deterioration in compatibility especially in streets with already not compatible traffic volumes in the higher-level street network, further increasing the separating or barrier effect of such streets.
Overall, the analysis can help city and transport planning to evaluate how to implement AVs in a sustainable way without increasing barrier effects of streets for pedestrians and cyclists further. It not only gives an overview of possible changes in traffic volume at street level for different scenarios with AVs, but also enables an indication to what extent these changes in traffic volume impair the needs of use and users in different street spaces. Moreover, it calls for taking the specific characteristics of street spaces into account when considering the implementation of AVs in the future. This also gives hints how and (helps to identify) in which areas an implementation of AVs should be facilitated and where the implementation of AVs should be connected to policies and measures to improve compatibility of traffic with the needs of pedestrians and cyclists.
However, although such an assessment of the compatibility has not been conducted before, with regard to changes in traffic volume due to AVs, the assessment using the compensatory approach is only a coarse investigation of the compatibility of AVs in different street spaces. More emphasis has to be put in future research to focus in a more detailed manner on the changes of traffic volume of AVs at the street level and how this might affect other roads users and differs based on various characteristics of street spaces. Here, future studies modeling the impacts of AVs that build the basis for such an assessment should also take into account current technological developments of AVs and look at traffic changes due to AVs in specific areas, as AVs will roll out in waves and possibly first in specific areas of a city [66].
Moreover, the approach to assess to what extent changes in traffic volume at street level impair pedestrians and cyclist should be developed further in future research. This concerns the incorporation of other aspects that seem important with regard to this topic, such as waiting times at traffic lights or results of the examination of actual traffic interactions between pedestrians and cyclists with AVs [69,70,71,72]. Additionally, other objective indicators regarding compatibility should be looked at, e.g., a low compatibility means also increased stress for pedestrians and cyclists that could be detected and mapped, using sensors [73] or further assessment of the (visual) quality of street space to meet, stay, sit, or play, using machine learning and other approaches [8,74], to assess the compatibility of AVs (and also develop possible implementing strategies) on a broader basis [15], is important.
In this regard, also a much broader assessment of the compatibility of AVs with the needs of uses and users might be necessary in the future. For example, also privacy issues due to the cameras, sensors, and lidars that are monitoring the environment of AVs and thus also pedestrians and cyclists in the street spaces, might be needed to consider for the implementation of AVs.
Overall, however, the analyses for Vienna give first insights into this topic for the scale of a whole street network and call for differentiated implementation strategies for AVs that consider the different characteristics of street spaces throughout a city.
Particularly in areas in the outskirts where sensibility towards a further increase of vehicles due to AVs is lower and conflicts less with other needs of uses and users than in the inner parts of the city, implementing SAVs in addition to public transport may decrease traffic volumes in these areas and thus be interesting for cities to consider. All the more so from a technical–infrastructural side, since these areas seem to be less complex environments for AVs in comparison to the crowded streets and intersections in the inner areas of cities. However, as mentioned as part of the scenario description, this would also need accompanying measures, e.g., to increase sharing.
In contrast, street spaces in which the current traffic volume at peak hour is already not compatible with the usage demands and especially in inner-city areas where AVs could induce traffic volumes, should be designed to be more compatible with the needs of pedestrians and cyclists (moving, crossing and leisure activities like eating, sitting, or playing in the street space), e.g., by implementing walking and cycling infrastructure, speed reduction, or additional crossing aids, etc., or the implementation of AVs should be linked to these measures. Here, especially the conversion of parking spaces in favor of such design elements and space for pedestrians and cyclists seems important and could be become an appropriate and (more accepted) measure with regard to future concepts with AVs, as parking needs—especially in the case of SAVs—could be reduced [6,75,76]. For future work, it would be interesting to evaluate the effects of potential planning measures or policies, such as pedestrianization, creation of public spaces, or restrictions of AVs, in street spaces that are already completely not compatible and look at how their situation changes within the assessment of compatibility.
However, since an increase in traffic volume at peak hour is observable at least in some street sections in all of the scenarios with AVs, measures to reduce the increase in traffic volume due to AVs such as dynamic mobility pricing or measures to increase the occupancy rate (e.g., bans or charges for empty rides [77]) could also be useful. In addition, a lot of cars are already connected and with AVs connectivity will further increase in the future. At the same time most cities today put efforts to foster the concept of the smart city, installing traffic sensors or parking detectors or implementing systems (e.g., smart parking systems) with Internet of Things (IoT) capabilities [78,79]. Moreover, AVs will be equipped with internet and communication capabilities as part of IoT, ensuring communication and exchanging information between the vehicles (V2V), but also with the infrastructure (V2I) and with smartphones of pedestrians (V2P) and cyclists [78,80]. This could enable real-time control, operation and traffic management of AVs in cities which could also help to reduce the increase in traffic volume or at least balance traffic and reduce congestion [78].
Finally, regarding the implementation of AVs—even when considering SAVs to complement public transport—it should be carefully evaluated whether they are compatible with the needs of pedestrians and cyclists, as infrastructural adjustments might be necessary [81,82] that could decrease the permeability of the street space. Doing so is particularly crucial during the transition phase, when maturity of technology is still low.

Author Contributions

Conceptualization, A.S., M.B. and M.M.; methodology, A.S. and M.B.; formal analysis, A.S., writing—original draft preparation, A.S., M.B., M.M.; writing—review and editing, A.S.; visualization, A.S.; supervision, M.B. All authors have read and agreed to the published version of the manuscript.

Funding

This paper was written within the framework of the research project “auto.WAVES: Autonomous Driving—Impact Analysis Transport, Energy and City for the Vienna Region”, funded by the FTI Innovation Fund of Wiener Stadtwerke, of the research study “Street Design Impacts and Traffic-Land Use Compatibility of Automated Driving in Vienna” a research cooperation with the Vienna City Administration, Urban Planning Department and the future.lab at TU Vienna, as well as the research project “Avenue21—Autonomous Transportation: Developments in European Urban Settings” funded by the Daimler and Benz Foundation.

Institutional Review Board Statement

Not applicable.

Informed Consent Statement

Not applicable.

Data Availability Statement

Publicly available datasets were analyzed in this study. This data can be found here: https://www.data.gv.at (accessed on 21 January 2021), https://www.openstreetmap.org (accessed on 21 January 2021), https://www.strava.com/heatmap (accessed on 21 January 2021). Restrictions apply to the availability of data of the simulation. Data was obtained from Trafility and are available from https://www.trafility.at (accessed on 21 January 2021) with the permission of Trafility.

Acknowledgments

The authors want to thank all partners of the research project “auto.WAVES” including Wiener Linien, Trafility (for the modeling within MATSim), Wiener Lokalbahnen, TU Graz, Institute of Highway Engineering and Transport Planning, and the Vienna City Administration, Urban Planning Department. Open Access Funding by TU Wien.

Conflicts of Interest

The authors declare no conflict of interest.

Appendix A. Categorization of Areas for the Maximum Compatible Traffic Volume
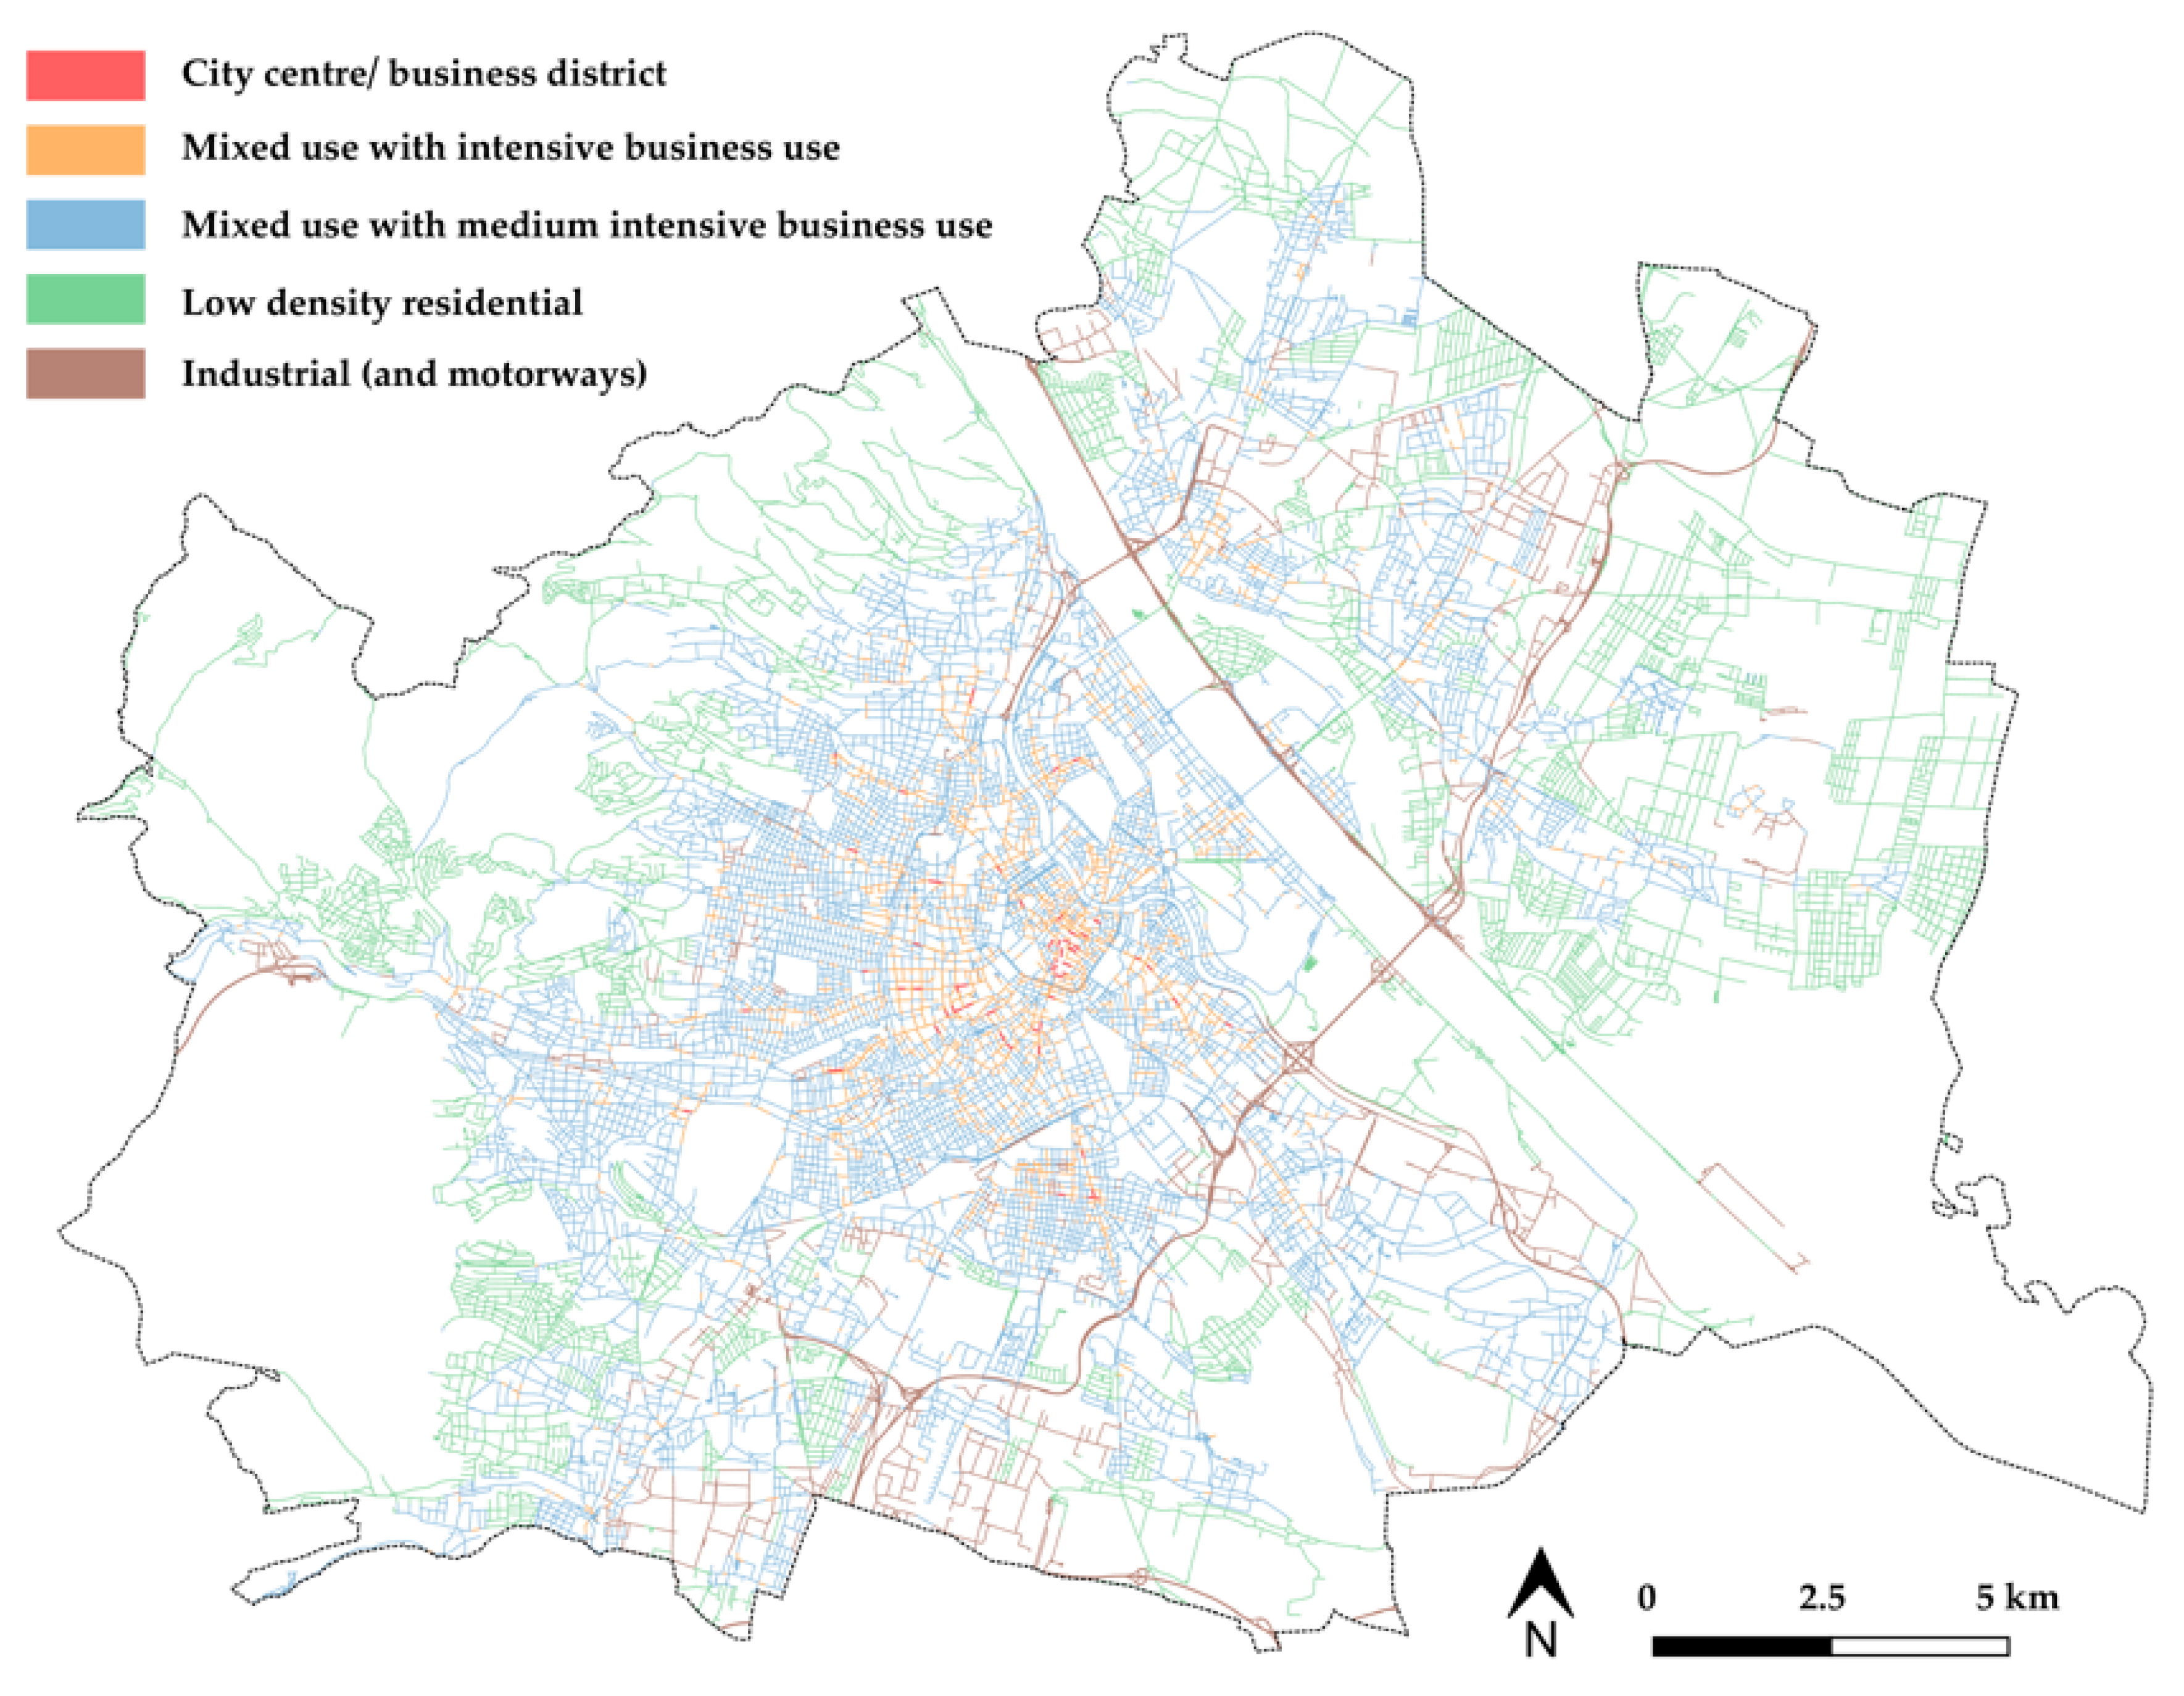
Figure A1. Categorization of street sections in the different area categories for the maximum compatible traffic volume for Table 2. Overview of the different criteria for adapting the maximum compatible traffic volume.
Sustainability 13 02732 g0a1

Appendix B. Criteria for Adapting the Maximum Compatible Traffic Volume
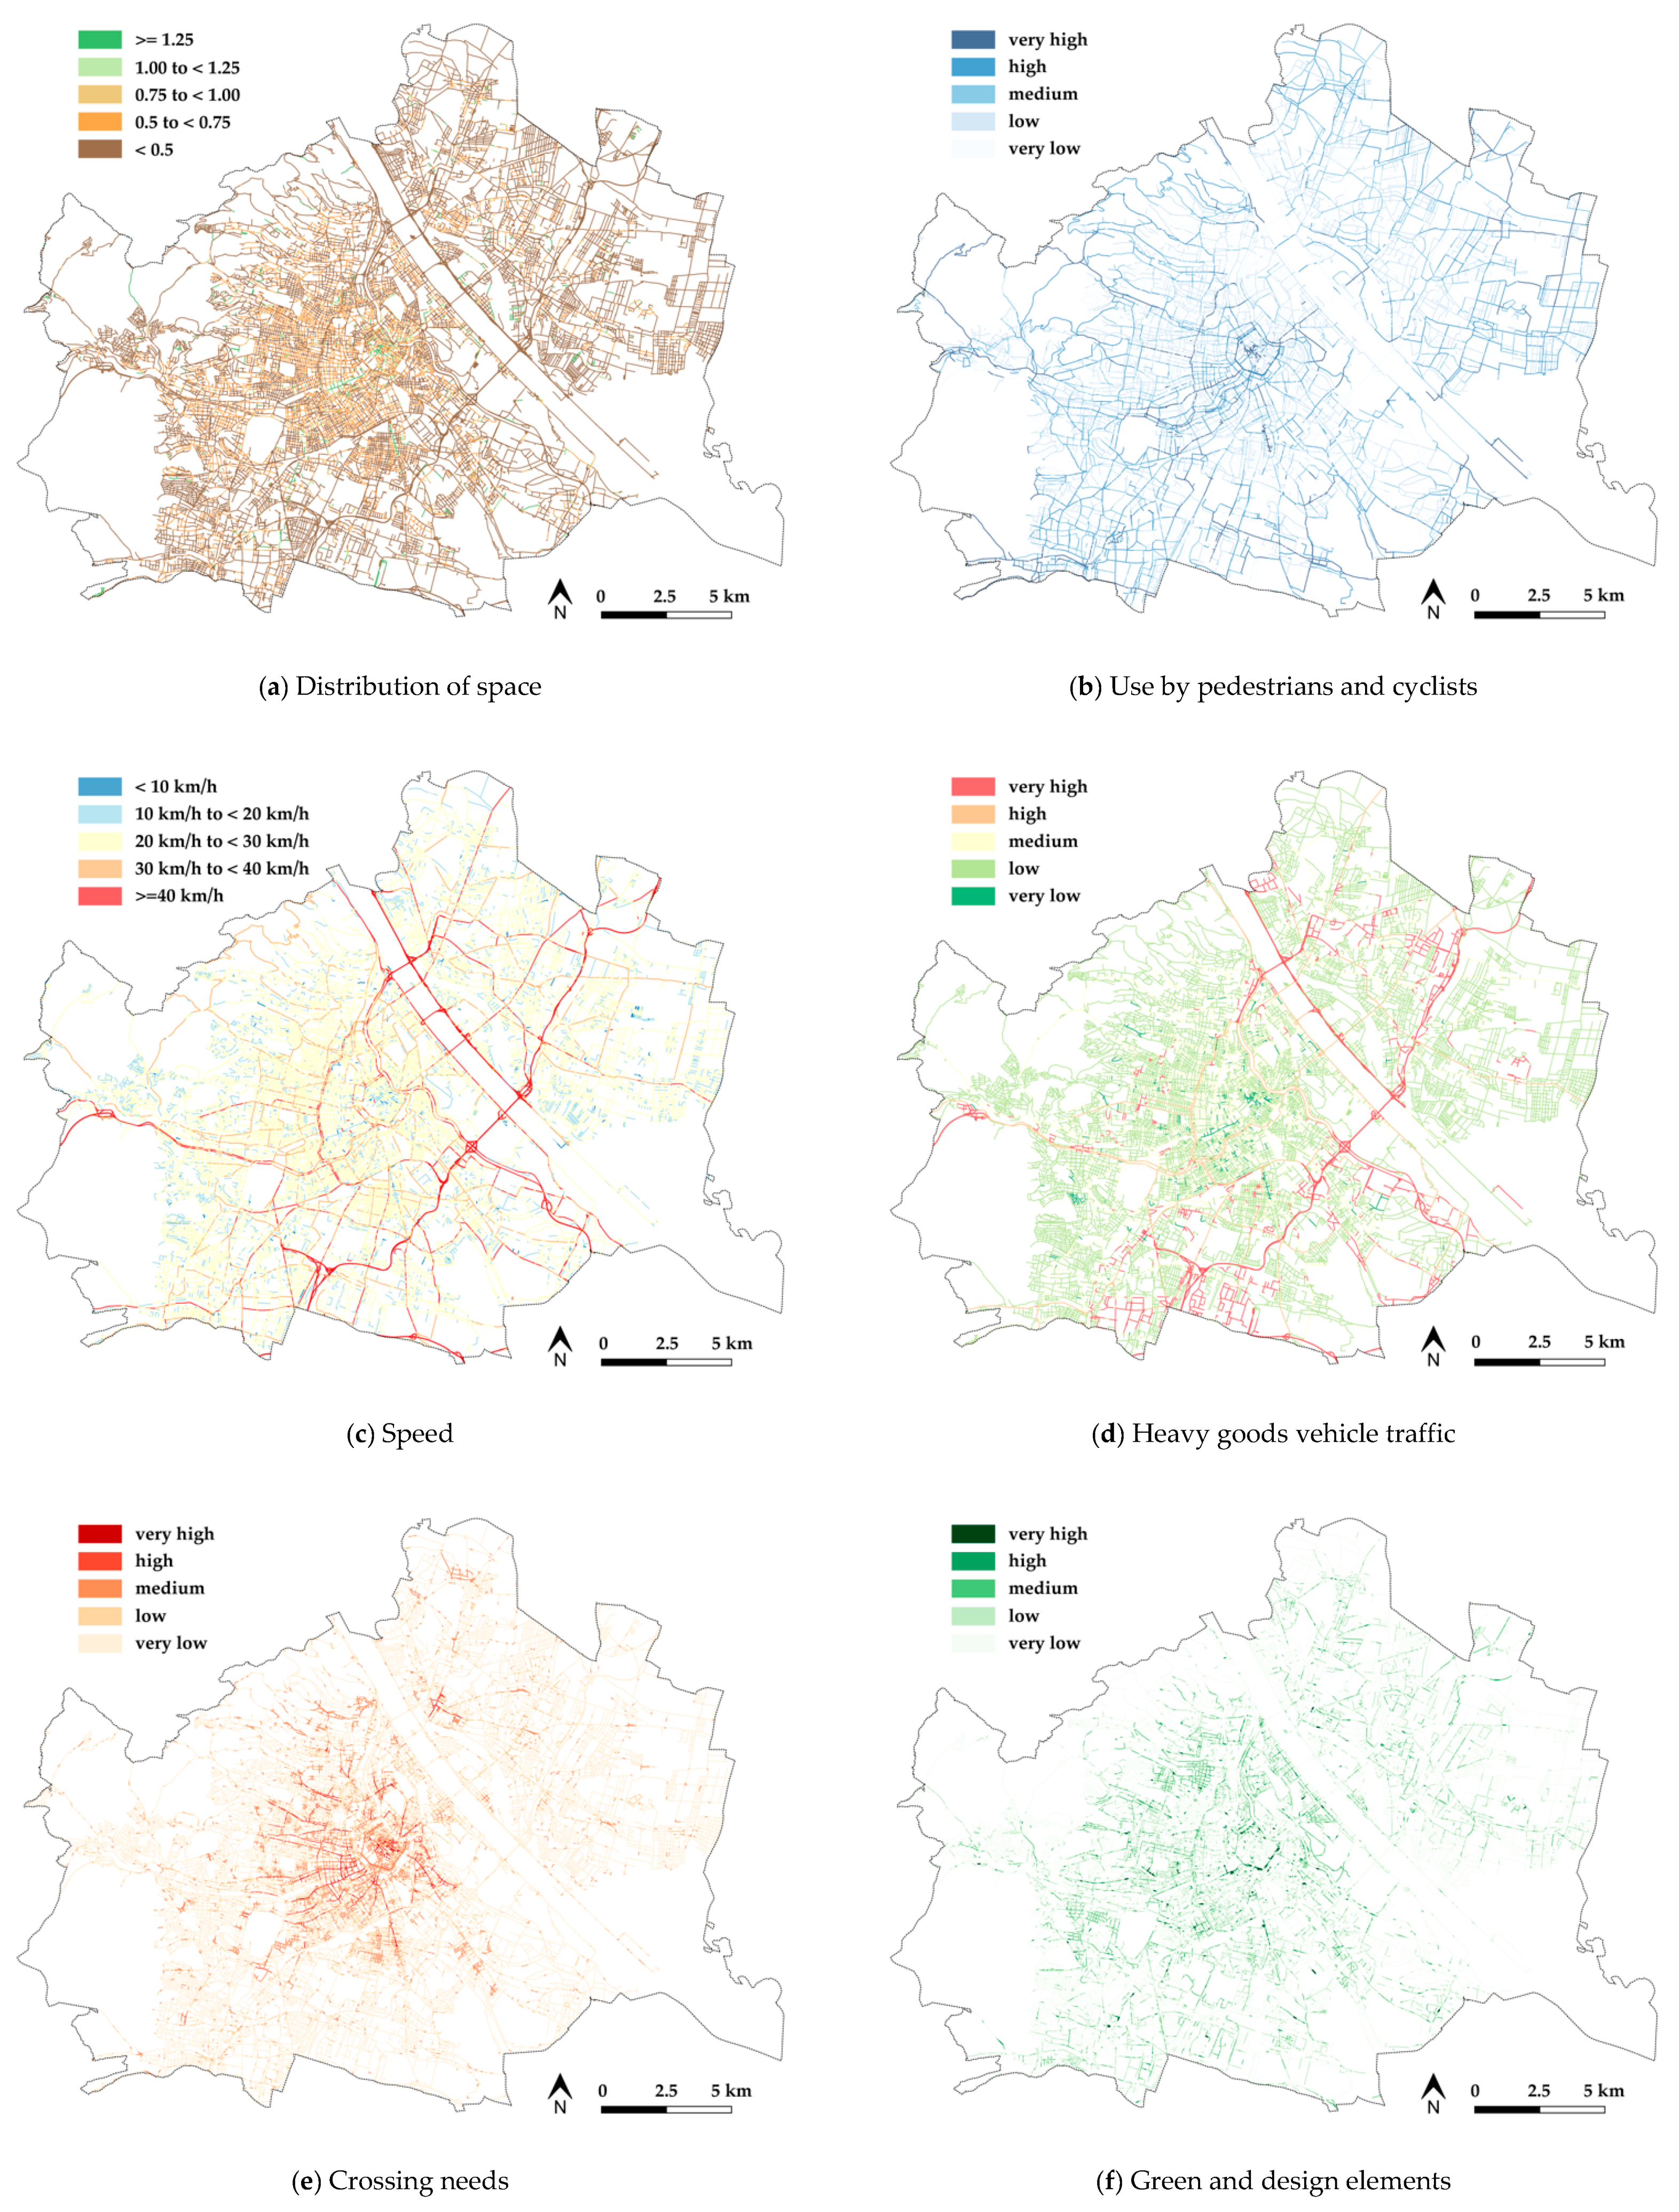
Figure A2. Overview of the different criteria for adapting the maximum compatible traffic volume: (a) Distribution of space (ratio between area width for pedestrians and cyclists in comparison to area width for motorized traffic); (b) Use by pedestrians and cyclists; (c) Speed (average speed of motor vehicles in reference scenario); (d) Heavy goods vehicle traffic (share of heavy goods traffic of the total motor vehicle traffic volume); (e) Crossing needs; (f) Green and design elements (number of trees, bushes and design elements); (g) Crossability.
Sustainability 13 02732 g0a2aSustainability 13 02732 g0a2b

References

  1. González-González, E.; Nogués, S.; Stead, D. Automated vehicles and the city of tomorrow: A backcasting approach. Cities 2019, 94, 153–160. [Google Scholar] [CrossRef] [Green Version]
  2. Gavanas, N. Autonomous Road Vehicles: Challenges for Urban Planning in European Cities. Urban Sci. 2019, 3, 61. [Google Scholar] [CrossRef] [Green Version]
  3. Staricco, L.; Rappazzo, V.; Scudellari, J.; Brovarone, E.V. Toward Policies to Manage the Impacts of Autonomous Vehicles on the City: A Visioning Exercise. Sustainability 2019, 11, 5222. [Google Scholar] [CrossRef] [Green Version]
  4. Pernestål, A.; Engholm, A.; Kristoffersson, I.; Hammes, J.J. The impacts of automated vehicles on the transport system and how to create policies that target sustainable development goals. In Shaping Smart Mobility Futures: Governance and Policy Instruments in Times of Sustainability Transitions; Paulsson, A., Sørensen, C.H., Eds.; Emerald: Bingled, UK, 2020; pp. 37–53. [Google Scholar]
  5. Milakis, D.; van Arem, B.; van Wee, B. Policy and society related implications of automated driving: A review of literature and directions for future research. J. Intell. Transp. Syst. 2017, 21, 324–348. [Google Scholar] [CrossRef]
  6. Soteropoulos, A.; Berger, M.; Ciari, F. Impacts of automated vehicles on travel behaviour and land use: An international review of modelling studies. Transp. Rev. 2019, 39, 29–49. [Google Scholar] [CrossRef]
  7. Hörl, S.; Becker, F.; Dubernet, T.; Axhausen, K.W. Induzierter Verkehr Durch Autonome Fahrzeuge: Eine Abschätzung; Bundesamt für Strassen: Bern, Switzerland, 2019. [Google Scholar]
  8. Gehl Architects, Downtown Seattle: Public Spaces & Public Life. City of Seattle. 2009. Available online: www.seattle.gov/Documents/Departments/SDCI/Codes/PublicSpacesLifeIntro.pdf (accessed on 4 January 2021).
  9. Bertolini, L. From “streets for traffic” to “streets for people”: Can street experiments transform urban mobility? Transp. Rev. 2020, 40, 734–753. [Google Scholar] [CrossRef]
  10. FGSV—Forschungsgesellschaft für Straßen- und Verkehrswesen. Directives for the Design of Urban Roads; RASt 06 2012; FGSV—Forschungsgesellschaft für Straßen- und Verkehrswesen: Cologne, Germany, 2012. [Google Scholar]
  11. Bühlmann, F.; Laube, M. Verträglichkeit Straßenraum; Methodik und Ergebnisse: Zurich, Switzerland, 2013. [Google Scholar]
  12. Häfliger, R.; Bubenhofer, J.; Hagedorn, C.; Zweibrücken, K.; Condrau, S.; Baier, R. Verträglichkeitskriterien für Straßenraum innerorts; Bundesamt für Strassen: Bern, Switzerland, 2015. [Google Scholar]
  13. Jensen, S.U. Pedestrian and Bicyclist Level of Service on Roadway Segments. Transp. Res. Rec. 2007, 2031, 43–51. [Google Scholar] [CrossRef] [Green Version]
  14. Parkin, J.; Clark, B.; Clayton, W.; Ricci, M.; Parkhurst, G. Understanding Interactions between Autonomous Vehicles and Other Road Users. A Literature Review. Project Report. University of the West of England, Bristol. Available online: http://eprints.uwe.ac.uk/29153 (accessed on 15 January 2021).
  15. Anciaes, P.R.; Jones, P.; Mindell, J.S. Community Severance: Where Is It Found and at What Cost? Transp. Rev. 2016, 36, 293–317. [Google Scholar] [CrossRef]
  16. Abegg, C.; Girod, C.; Fischer, K.; Pahud, N.; Raymann, L.; Perret, F. Einsatz Automatisierter Fahrzeuge im Alltag—Denkbare Anwendungen und Effekte in der Schweiz. Schlussbericht Modul 3d Städte und Agglomerationen. 2018. Available online: www.ebp.ch/sites/default/files/proj-ect/uploads/2018-08-30%20aFn_3d%20St%C3%A4dte-Agglomerationen%20Schlussbericht_1.pdf (accessed on 1 October 2020).
  17. Heinrichs, D. Autonomous driving and urban land use. In Autonomous Driving; Maurer, M., Gerdes, C.J., Lenz, B., Winner, H., Eds.; Springer: Heidelberg, Germany, 2016; pp. 213–231. [Google Scholar]
  18. Curtis, C.; McLeod, S.; Hultén, J.; Pettersson-Lofstedt, F.; Paulsson, A.; Hedegaard Sørensen, C. Knowledge for policy-making in times of uncertainty: The case of autonomous vehicle model results. Transp. Rev. 2020, 1–21. [Google Scholar] [CrossRef]
  19. Zhao, Y.; Kockelman, K.M. Anticipating the regional impacts of connected and automated vehicle travel in Austin, Texas. J. Urban Plan. Dev. 2018, 144, 04018032. [Google Scholar] [CrossRef]
  20. Childress, S.; Nichols, B.; Charlton, B.; Coe, S. Using an activity-based model to explore the potential impacts of automated vehicles. Transp. Res. Rec. 2015, 2493, 99–106. [Google Scholar] [CrossRef]
  21. Zhang, W.; Guhathakurta, S.; Khalil, E.B. The impact of private autonomous vehicles on vehicle ownership and unoccupied VMT generation. Transp. Res. Part C 2018, 90, 156–165. [Google Scholar] [CrossRef] [Green Version]
  22. International Transport Forum. Urban Mobility System Upgrade-How Shared Self-Driving Cars Could Change City Traffic; International Transport Forum: Paris, France, 2015. [Google Scholar]
  23. Liu, J.; Kockelman, K.M.; Boesch, P.M.; Ciari, F. Tracking a system of shared autonomous vehicles across the Austin, Texas network using agent-based simulation. Transportation 2017, 44, 1261–1278. [Google Scholar] [CrossRef]
  24. Boesch, P.M.; Ciari, F.; Axhausen, K.W. Transport policy optimization with autonomous vehicles. Transp. Res. Rec. 2018, 2672, 698–707. [Google Scholar] [CrossRef] [Green Version]
  25. Oh, S.; Seshadri, R.; Azevedo, C.L.; Kumar, N.; Basak, K.; Ben-Akiva, M. Assessing the impacts of automated mobility-on-demand through agent-based simulation: A study of Singapore. Transp. Res. Part A 2020, 138, 367–388. [Google Scholar]
  26. Fagnant, D.J.; Kockelman, K.M.; Bansal, P. Operations of shared autonomous vehicle fleet for Austin, Texas, market. Transp. Res. Rec. 2015, 2563, 98–106. [Google Scholar] [CrossRef] [Green Version]
  27. Friedrich, M.; Hartl, M. MEGAFON-Modellergebnisse geteilter autonomer Fahrzeugflotten des öffentlichen Nahverkehrs; University of Stuttgart: Stuttgart, Germany, 2016. [Google Scholar]
  28. Auld, J.; Sokolov, V.; Stephens, T.S. Analysis of the effects of connected-automated vehicle technologies on travel demand. Transp. Res. Rec. 2017, 2625, 1–8. [Google Scholar] [CrossRef]
  29. Kim, K.; Rousseau, G.; Freedman, J.; Nicholson, J. The Travel Impact of Autonomous Vehicles In Metro Atlanta through Activity-Based Modeling. In Proceedings of the 15th TRB National Transportation Planning Applications Conference, Atlantic City, NJ, USA, 17–21 May 2015. [Google Scholar]
  30. Martinez, L.M.; Viegas, J.M. Assessing the impacts of deploying a shared self-driving urban mobility system: An agent-based model applied to the city of Lisbon, Portugal. Int. J. Transp. Sci. Technol. 2017, 6, 13–27. [Google Scholar] [CrossRef]
  31. Spieser, K.; Treleaven, K.; Zhang, R.; Frazzoli, E.; Morton, D.; Pavone, M. Toward a systemic approach to the design and evaluation of automated mobility-on-demand systems: A case study in Singapore. In Road Vehicle Automation. Lecture Notes in Mobility; Meyer, G., Beiker, S., Eds.; Springer: Cham, Switzerland, 2014; pp. 229–245. [Google Scholar]
  32. Zhang, W. The Interaction between Land Use and Transportation in the Era of Shared Autonomous Vehicles: A Simulation Model. Ph.D. Thesis, Georgia Institute of Technology, Atlanta, GA, USA, 2017. [Google Scholar]
  33. Zambrano-Martinez, J.L.; Calafate, C.T.; Soler, D.; Lemus-Zúñiga, L.G.; Cano, J.C.; Manzoni, P.; Gayraud, T. A centralized route-management solution for autonomous vehicles in urban areas. Electronics 2019, 8, 722. [Google Scholar] [CrossRef] [Green Version]
  34. Rossi, F.; Zhang, R.; Hindy, Y.; Pavone, M. Routing autonomous vehicles in congested transportation networks: Structural properties and coordination algorithms. Auton. Robot. 2018, 42, 1427–1442. [Google Scholar] [CrossRef] [Green Version]
  35. Horni, A.; Nagel, K.; Axhausen, K.W. The Multi-Agent Transport Simulation MATSim; Ubiquity: London, UK, 2016. [Google Scholar]
  36. Harb, M.; Stathopoulos, A.; Shiftan, Y.; Walker, J.L. What do we (Not) know about our future with automated vehicles? Transp. Res. Part C 2021, 123, 102948. [Google Scholar] [CrossRef]
  37. Frehn, M.; Steinberg, G.; Schröder, S. Methodik und Ergebnisse der Straßenraumverträglichkeit. Verkehrsentwicklungsplan Bremen 2025. 2013. Available online: http://www.bau.bremen.de/sixcms/media.php/13/130228_E03_Strassenraumvertraeglichkeit_Methodik_Ergebnisse.pdf (accessed on 12 February 2021).
  38. Baier, R.; Hebel, C.; Jachtmann, Y.; Reinartz, A.; Schäfer, K.H.; Warnecke, A. Stadt Mönchengladbach. Untersuchungen zur Verkehrsentwicklungsplan 2011, BSV—Büro für Stadt- und Verkehrsplanung Reinhold Baier, Aachen. Available online: https://tinyurl.com/yaqvgpwk (accessed on 13 February 2021).
  39. Von Mörner, J.; Müller, B.; Topp, H. Entwurf und Gestaltung innerörtlicher Straßen. Forschung Straßenbau und Straßenverkehrstechnik; Bericht 425; Bundesministerium für Verkehr: Bonn, Germany, 1984. [Google Scholar]
  40. Graph Integration Platform—GIP. The Reference System of Austrian Public Authorities for Transport Infrastructure Data. Available online: http://gip.gv.at/en/index.html (accessed on 11 February 2021).
  41. Su, S.; Zhou, H.; Xu, M.; Ru, H.; Wang, W.; Weng, M. Auditing street walkability and associated social inequalities for planning implications. J. Transp. Geogr. 2019, 74, 62–76. [Google Scholar] [CrossRef]
  42. Boesch, P.M.; Ciari, F.; Axhausen, K.W. Autonomous Vehicle Fleet Sizes Required to Serve Different Levels of Demand. Transp. Res. Rec. 2016, 2542, 111–119. [Google Scholar] [CrossRef] [Green Version]
  43. Trafility, Wiener Linien, Wiener Lokalbahnen, TU Graz. In auto.Waves: Autonomes Fahren—Wirkungsanalyse Verkehr, Energie und Stadt für den Raum Wien; Research Report; Institute of Highway Engineering and Transport Planning, Vienna City Administration, Urban Planning Department: Vienna, Austria, 2020.
  44. Kickhofer, B.; Hosse, D.; Turnera, K.; Tirachini, A. Creating an Open MATSim Scenario from Open Data: The Case of Santiago de Chile; TU Berlin, Transport System Planning and Transport Telematics: Berlin, Germany, 2016. [Google Scholar]
  45. Hörl, S.; Balac, M.; Axhausen, K.W. A first look at bridging discrete choice modeling and agent-based microsimulation in MATSim. Procedia Comput. Sci. 2018, 130, 900–907. [Google Scholar] [CrossRef]
  46. Tomschy, R.; Herry, M.; Sammer, G.; Klementschitz, R.; Riegler, S.; Follmer, R.; Gruschwitz, D.; Josef, F.; Gensasz, S.; Kirnbauer, R.; et al. Österreich unterwegs 2013/2014: Ergebnisbericht zur österreichweiten Mobilitätserhebung “Österreich unterwegs 2013/2014“; Bundesministerium für Verkehr, Infrastruktur und Technologie: Vienna, Austria, 2016. [Google Scholar]
  47. Brovarone, E.V.; Scudellari, J.; Staricco, L. Planning the transition to autonomous driving: A policy pathway towards urban liveability. Cities 2021, 108, 102996. [Google Scholar] [CrossRef]
  48. Bischoff, J.; Maciejewski, M.; Nagel, K. City-Wide Shared Taxis: A Simulation Study in Berlin. In Proceedings of the IEEE 20th International Conference on Intelligent Transportation Systems (ITSC), Yokohama, Japan, 16–19 October 2017; pp. 275–280. [Google Scholar]
  49. Levin, M.W.; Kockelman, K.M.; Boyles, S.D.; Li, T. A general framework for modeling shared autonomous vehicles with dynamic network-loading and dynamic ride-sharing application. Computers. Environ. Urban Syst. 2017, 64, 373–383. [Google Scholar] [CrossRef]
  50. Ester, M.; Kriegel, H.-P.; Sander, J.; Xu, X. A Density-Based Algorithm for Discovering Clusters in Large Spatial Databases with Noise. In Proceedings of the Second International Conference on Knowledge Discovery and Data Mining, Portland, ME, USA, 2–4 August 1996; pp. 226–231. [Google Scholar]
  51. Gelauff, G.; Ossokina, I.; Teulings, C. Spatial Effects of Automated Driving: Dispersion, Concentration or Both; KIM–Netherlands Institute for Transport Policy Analysis: The Hague, The Netherlands, 2017. [Google Scholar]
  52. Auld, J.; Verbas, O.; Javanmardi, M.; Rousseau, A. Impact of privately-owned level 4 CAV technologies on travel demand and energy. Procedia Comput. Sci. 2018, 130, 914–919. [Google Scholar] [CrossRef]
  53. de Correia, G.H.; Looff, E.; van Cranenburgh, S.; Snelder, M.; van Arem, B. On the impact of vehicle automation on the value of travel time while performing work and leisure activities in a car: Theoretical insights and results from a stated preference survey. Transp. Res. Part A 2019, 119, 359–382. [Google Scholar] [CrossRef] [Green Version]
  54. Kolarova, V.; Steck, F.; Bahamonde-Birke, F.J. Assessing the effect of autonomous driving on value of travel time savings: A comparison between current and future preferences. Transp. Res. Part A 2019, 129, 155–169. [Google Scholar] [CrossRef]
  55. Friedrich, B. The effect of autonomous vehicles on traffic. In Autonomous Driving; Maurer, M., Gerdes, C.J., Lenz, B., Winner, H., Eds.; Springer: Heidelberg, Germany, 2016; pp. 317–334. [Google Scholar]
  56. Meyer, J.; Becker, H.; Bösch, P.M.; Axhausen, K.W. Autonomous vehicles: The next jump in accessibilities? Res. Transp. Econ. 2017, 62, 80–91. [Google Scholar] [CrossRef] [Green Version]
  57. Gucwa, M. Mobility and Energy Impacts of Automated Cars. In Proceedings of the Automated Vehicles Symposium, San Francisco, CA, USA, 15–17 July 2014. [Google Scholar]
  58. Ghielmetti, M.; Steiner, R.; Leitner, J.; Hackenfort, M.; Diener, S.; Topp, H. Flächiges Queren in Ortszentren—Langfristige Wirkung und Zweckmäßigkeit; Bundesamt für Straßen: Bern, Switzerland, 2017. [Google Scholar]
  59. Gössling, S. Why cities need to take road space from cars-and how this could be done. J. Urban Des. 2020, 25, 443–448. [Google Scholar] [CrossRef]
  60. Arellana, J.; Saltarín, M.; Larrañaga, A.M.; González, V.I.; Henao, C.A. Developing an urban bikeability index for different types of cyclists as a tool to prioritise bicycle infrastructure investments. Transp. Res. Part A 2020, 139, 310–334. [Google Scholar] [CrossRef]
  61. Moura, F.; Cambra, P.; Gonçalves, A.B. Measuring walkability for distinct pedestrian groups with a participatory assessment method: A case study in Lisbon. Landsc. Urban Plan. 2017, 157, 282–296. [Google Scholar] [CrossRef]
  62. Holden, E.; Gilpin, G.; Banister, D. Sustainable mobility at thirty. Sustainability 2019, 11, 1965. [Google Scholar] [CrossRef] [Green Version]
  63. Nello-Deakin, S. Is there such a thing as a ‘fair’ distribution of road space? J. Urban Des. 2019, 24, 698–714. [Google Scholar] [CrossRef] [Green Version]
  64. Soteropoulos, A.; Mitteregger, M.; Berger, M.; Zwirchmayr, J. Automated Drivability: Toward an assessment of the spatial deployment of level 4 automated vehicles. Transp. Res. Part A Policy Pract. 2020, 136, 64–84. [Google Scholar] [CrossRef]
  65. Anciaes, P.R.; Jones, P. How Do Pedestrians Balance Safety, Walking Time, and the Utility of Crossing the Road? A Stated Preference Study; Street Mobility and Network Accessibility Series; Working Paper 08; University College London: London, UK, 2016; Available online: https://discovery.ucl.ac.uk/id/eprint/1505652/1/Anciaes_ucl_streetmobility_paper08.pdf (accessed on 10 January 2021).
  66. Axhausen, K.W.; Livingston, C.; Hörl, S.; Bruns, F.; Fischer, R.; Tasnády, B. Auswirkungen des Automatisierten Fahrens; Teilprojekt 2; Verkehrliche Auswirkungen und Infrastrukturbedarf; ASTRA—Bundesamt für Strassen: Bern, Switzerland, 2020. [Google Scholar]
  67. Tirachini, A.; Cats, O. COVID-19 and public transportation: Current assessment, prospects, and research needs. J. Public Transp. 2020, 22, 1. [Google Scholar] [CrossRef]
  68. Beck, M.J.; Hensher, D.A.; Wei, E. Slowly coming out of COVID-19 restrictions in Australia: Implications for working from home and commuting trips by car and public transport. J. Transp. Geogr. 2020, 88, 102846. [Google Scholar] [CrossRef]
  69. Schieben, A.; Wilbrink, M.; Kettwich, C.; Madigan, R.; Louw, T.; Merat, N. Designing the interaction of automated vehicles with other traffic participants: Design considerations based on human needs and expectations. Cogn. Technol. Work 2019, 21, 69–85. [Google Scholar] [CrossRef] [Green Version]
  70. Merat, N.; Mun Lee, Y.; Markkula, G.; Uttley, J.; Camara, F.; Fox, C.; Dietrich, A.; Weber, F.; Schieben, A. How do we study pedestrian interaction with automated vehicles? Preliminary findings from the European interACT project. In AVS 2019: Road Vehicle Automation 6; Meyer, G., Beiker, S., Eds.; Springer: Cham, Switzerland, 2019; pp. 21–33. [Google Scholar]
  71. Woodman, R.; Lu, K.; Higgins, M.D.; Brewerton, S.; Jennings, P.A.; Birrell, S. Gap acceptance study of pedestrians crossing between platooning autonomous vehicles in a virtual environment. Transp. Res. Part F 2019, 67, 1–14. [Google Scholar] [CrossRef]
  72. Pyrialakou, D.V.; Gkartzonikas, C.; Gatlin, J.D.; Gkritza, K. Perceptions of safety on a shared road: Driving, cycling, or walking near an autonomous vehicle. J. Saf. Res. 2020, 72, 249–258. [Google Scholar] [CrossRef]
  73. Kyriakou, K.; Resch, B.; Sagl, G.; Petutschnig, A.; Werner, C.; Niederseer, D.; Liedlgruber, M.; Wilhelm, F.H.; Osborne, T.; Pykett, J. Detecting moments of stress from measurements of wearable physiological sensors. Sensors 2019, 19, 3805. [Google Scholar] [CrossRef] [PubMed] [Green Version]
  74. Ye, Y.; Zeng, W.; Shen, Q.; Zhang, X.; Lu, Y. The visual quality of streets: A human-centred continuous measurement based on machine learning algorithms and street view images. Environ. Plan. B Urban Anal. City Sci. 2019, 46, 1439–1457. [Google Scholar] [CrossRef]
  75. González-González, E.; Nogués, S.; Stead, D. Parking futures: Preparing European cities for the advent of automated vehicles. Land Use Policy 2020, 91, 104010. [Google Scholar] [CrossRef]
  76. Zhang, W.; Guhathakurta, S.; Fang, J. Exploring the impact of shared autonomous vehicles on urban parking demand: An agent-based simulation approach. Sustain. Cities Soc. 2015, 19, 34–45. [Google Scholar] [CrossRef]
  77. Boesch, P.M. Autonomous Vehicles—The Next Revolution in Mobility. Ph.D. Thesis, ETH Zurich, Zurich, Switzerland, 2020. [Google Scholar]
  78. Seuwou, P.; Banissi, E.; Ubakanma, G. The Future of Mobility with Connected and Autonomous Vehicles in Smart Cities. In Digital Twin Technologies and Smart Cities; Farsi, M., Daneshkhah, A., Hosseinian-Far, A., Jahankhani, H., Eds.; Springer: Cham, Switzerland, 2019; pp. 37–52. [Google Scholar]
  79. Mohammadi, F.; Nazri, G.A.; Saif, M. A Real-Time Cloud-Based Intelligent Car Parking System for Smart Cities. In Proceedings of the 2nd IEEE International Conference on Information Communication and Signal Processing (ICICSP), Weihei, China, 28–30 September 2019; pp. 235–240. [Google Scholar]
  80. Shladover, S.E. Connected and automated vehicle systems: Introduction and overview. J. Transp. Syst. 2018, 22, 190–200. [Google Scholar] [CrossRef]
  81. International Transport Forum. Cooperative Mobility Systems and Automated Driving. Summary and Conclusion; OECD: Paris, France, 2020; Available online: https://www.itf-oecd.org/sites/default/files/docs/cooperative-mobility-systems-automated-driving-roundtable-summary.pdf (accessed on 5 January 2021).
  82. Botello, B.; Buehler, R.; Hankey, S.; Mondschein, A.; Jiang, Z. Planning for walking and cycling in an autonomous-vehicle future. Transp. Res. Interdiscip. Perspect. 2019, 1, 100012. [Google Scholar] [CrossRef]
Figure 1. Spatial distribution of activities (a) and number of activities carried out throughout the day (b), based on the mobile phone data [22].
Sustainability 13 02732 g001
Figure 2. Overview of steps for categorizing street sections into the different area categories, based on data on area type and age of buildings, zoning categories, and the number of shops and businesses.
Sustainability 13 02732 g002
Figure 3. Exemplarily applied weighting and corresponding compatibility of traffic volume in street spaces in the reference scenario. Source for pictures of street spaces: Google Street View.
Sustainability 13 02732 g003
Figure 4. Change of vehicles at peak hour on street level: comparison between (a) Scenario 1, (b) Scenario 2, and (c) Scenario 3 and reference scenario.
Sustainability 13 02732 g004
Figure 6. Overview of changes in traffic volume at peak hour at street sections that are completely not compatible in the reference scenario between Scenario 1 (a), Scenario 2 (b) and Scenario 3 (c) and the reference scenario.
Sustainability 13 02732 g006
Figure 7. Possible increase of number of vehicles at peak hour until completely not compatible in the reference scenario.
Sustainability 13 02732 g007
Figure 8. Overlap of the assessment of the sensibility of compatibility with increased traffic (in the reference scenario) and the assessment of the automated drivability.
Sustainability 13 02732 g008
Table 1. Applied maximum compatible traffic volume for different area categories.
Area CategoryCompatible Traffic Volume (Vehicles at Peak Hour)
City center/business district≤20 (well compatible)
>20–50 (compatible)
>50–150 (only just compatible)
>150–400 (not compatible)
>400 (completely not compatible)
Mixed-use with intensive commercial use≤50 (well compatible)
>50–150 (compatible)
>150–400 (only just compatible)
>400–600 (not compatible)
>600 (completely not compatible)
Mixed-use with medium intensive commercial use≤150 (well compatible)
>150–400 (compatible)
>400–600 (only just compatible)
>600–1000 (not compatible)
>1000 (completely not compatible)
Low-density residential≤400 (well compatible)
>400–600 (compatible)
>600–1000 (only just compatible)
>1000–1200 (not compatible)
>1200 (completely not compatible)
Industrial≤600 (well compatible)
>600–1000 (compatible)
>1000–1200 (only just compatible)
>1200–1500 (not compatible)
>1500 (completely not compatible)
Table 2. Compatibility levels for the criteria distribution of space, use by pedestrians and cyclists, speed, heavy-goods vehicle traffic, and crossing needs.
(a) Distribution of Space
Ratio between Area Width for Pedestrians
and Cyclists in Comparison to Area Width for Motor Vehicle Traffic
(b) Use by
Pedestrians and Cyclists
(c) Speed
Average Speed on the Street Section
(d) Heavy-Goods Vehicle Traffic
HGV Share of the Total Motor Vehicle Traffic Volume
(e) Crossing NeedsCategories of Compatibility with Needs of Surrounding Uses and UsersAdaptation of the Maximum Compatible Traffic Volume
≥1.25very low≤10 km/hvery lowvery low
(streets sections with no shops or other facilities)
++
well compatible
+100
vehicles/peak hour
1.00 to <1.25low>10 km/h ≤20 km/hlowlow
(street sections with at least 1 shop or other facility, no cross-relations in between)
+
compatible
+50
vehicles/peak hour
0.75 to <1.00medium>20 km/h ≤30 km/hmediummedium
(squares and parks or streets sections with 1 or more cross-relations between shops or other facilities)
o
only just compatible
±0
vehicles/peak hour
0.5 to <0.75high>30 km/h ≤40 km/hhighhigh
(shopping streets)
-
not compatible
−50
vehicles/peak hour
<0.5very high>40 km/hvery highvery high
(shopping streets or squares and parks with 2 or more cross-relations between shops or other facilities)
--
Completely not compatible
−100
vehicles/peak hour
Table 3. Compatibility levels for the criterion green and design elements.
Number of Design Elements per 100 mNumber of Trees and Bushes per 100 m
01 to 45 to 910 to 1415 or More
0----oo
1-oo++
2 to 4o++++ ++
5 or more+++++++++
--, very low = completely not compatible (−100 vehicle/peak hour); -, low = not compatible (−50 vehicle/peak hour); o, medium = only just compatible (±0 vehicle/peak hour); +, high = compatible (+50 vehicle/peak hour); ++, very high = well compatible (+100 vehicle/peak hour).
Table 4. Compatibility levels for the criterion crossability.
Area CategoryCrossability—Number of Crossing Aids per 100 m
00,10,20,30,40,50,60,70,80,91,01,11,21,31,41,51,61,7+
City center/commercial area-------------------ooo+++++
Mixed-use with intensive commercial use---------------ooo+++++++++
Mixed-use with medium intensive commercial use-----------ooo+++++++++++++
Low-density residential-------ooo+++++++++++++++++
Industrial----ooo+++++++++++++++++++++
--, very low = completely not compatible (−100 vehicle/peak hour); -, low = not compatible (−50 vehicle/peak hour); o, medium = only just compatible (±0 vehicle/peak hour); +, high = compatible (+50 vehicle/peak hour); ++, very high = well compatible (+100 vehicle/peak hour).
Table 5. Overview of the exemplarily applied weighting of the different criterions.
CriterionWeighting 1:
Equal Weights of Criteria
Weighting 2:
Higher Weight for C1, Lower Weight for C5 and C6
Weighting 3:
Considerable Higher Weight for C1, Lower Weights for C3 to C7
C1: Distribution of space123.5
C2: Use by pedestrians and cyclists111
C3: Speed110.5
C4: Heavy-goods vehicle traffic110.5
C5: Crossing needs10.50.5
C6: Green and design elements10.50.5
C7: Crossability110.5
Table 6. Example of comparison between actual traffic volume and adapted maximum compatible traffic volume (in number of vehicles at peak hour): assessment of compatibility of a street section.
Street SectionMaximum Compatible Traffic VolumeAdaptation of Maximum Compatible Traffic Volume
C1C2C3C4C5C6C7TotalAdapted Maximum Compatible Traffic VolumeActual Traffic VolumeAssessment of Compatibility
Street section in area category
“mixed-use with intensive commercial use”
150+175−100−25−50±0−25+50+25≤75 (++)
>75 bis 175 (+)
>175 bis 425 (o)
>425 bis 625 (-)
>625 (--)
157+ compatible
weights
3.510.50.50.50.50.5
unweighted
+50−100−50−100±0−50+100
C1 = criterion distribution of space; C2 = criterion use by pedestrians and cyclists; C3 = criterion speed; C4 = criterion heavy-goods vehicle traffic; C5 = criterion crossing needs; C6 = criterion green and design elements; C7 = criterion crossability.
Table 7. Overview of the share of street sections in different compatibility categories for different applied maximum compatible traffic volumes in reference scenario and Scenarios 1 to 3 (n = 52,840).
ScenarioAssessment of Street
Sections
Applied Maximum Compatible Traffic Volume at Peak Hour
10% DecreaseActually Applied10% Increase
Reference Scenariowell compatible29.6%32.8%36.1%
compatible33.1%34.0%34.3%
only just compatible14.3%12.5%10.9%
not compatible8.0%7.1%6.5%
completely not compatible15.0%13.6%12.1%
Scenario 1well compatible29.2%32.7%36.0%
compatible33.0%33.8%34.2%
only just compatible14.9%13.0%11.2%
not compatible7.9%7.1%6.6%
completely not compatible15.0%13.4%11.9%
Scenario 2well compatible30.2%33.7%36.8%
compatible32.9%33.4%33.8%
only just compatible13.8%12.1%10.6%
not compatible8.1%7.3%6.7%
completely not compatible15.0%13.5%12.1%
Scenario 3well compatible29.4%32.7%36.0%
compatible33.2%34.0%34.3%
only just compatible14.3%12.7%11.0%
not compatible7.9%6.6%6.3%
completely not compatible15.2%13.8%12.4%
100.0%100.0%100.0%
Publisher’s Note: MDPI stays neutral with regard to jurisdictional claims in published maps and institutional affiliations.